the eu savoury snacks industry key issues and market...
TRANSCRIPT

The EU Savoury Snacks Industry Key Issues and Market Update
Sebastian Emig Director General, ESA
Presentation to the Canadian Snack Food Association 13 September 2013 1

0. Key priorities for 2013-14 1. Labelling 2. Advertising to Children 3. Acrylamide
4. Discriminatory Food Taxes 5. The Market for Savoury Snacks in Europe
2

• Calls for restrictions to food marketing targeting children are getting louder and industry has to react in order to avoid adverse legislation
• On-going debate and introduction of discriminatory food taxation across Europe
• Avoid a proliferation of colour-coded FoP labelling, achieve an exemption for our category related to MCOOL and aim at a flexible implementation of the EU food labelling regulation (EC1169/2011)
• Upcoming food safety threats (acrylamide levels, new MLs for heavy metals, awareness of 3-MCPD esters,.... )
• Environmental sustainability and ethical sourcing are rising on the policy makers and consumers agenda
• Emerging issues (nanos, GM, sustainable supply chain)
3

0. Key priorities for 2013-14 1. Labelling 2. Advertising to Children 3. Acrylamide
4. Discriminatory Food Taxes 5. The Market for Savoury Snacks in Europe
4

GDAs are now RIs • According to the provisions of Food Information to Consumers
Regulation (FIC) EC1169/2011 to express voluntary nutrition information
• The intention of the FIC Regulation is to harmonise the content, expression and presentation of the nutrition information given to consumers, including the voluntary information
• Reference Intakes (RIs) are recommended to be used instead of Guideline Daily Amounts (GDAs) or its acronyms
• Reactions from industry • The European food industry represented by FoodDrinkEurope keeps on
promoting the GDAs approach • Precisely the GDAs icon, allowing for flexibility in terms of wording
(replacing the term GDAs by RIs)

VCOOL and MCOOL • Commission is finalising its impact assessment on VCOOL and
considers the following policy options for VCOOL: • The origin/provenance of the primary ingredient must be declared at
• at the same level of precision; or • at a higher level of precision; or • a lower level of precision
than the one of the final product
• The Commission will be looking into COOL for unprocessed foods, single ingredient products and ingredients that represent more than 50% of a food
• Next impact assessment to be carried out by the Commission will consider MCOOL
• On 19 June 2013 the UK Department of Health officially announced FOP hybrid system (combining GDAs with colour coding) as preferred scheme for Front of Pack labelling
• The scheme, being a voluntary one, was not officially notified to the Commission and Member States, therefore not allowing for comments
• The scheme has been heavily criticised by the European food industry, as: • May set a precedent for the proliferation of different national labelling
schemes across EU • Could demonise – without any scientific justification – foods with lot of
red and amber on the label • Was not formally notified to the Commission and Member States under
the TRIS procedure not allowing stakeholders to comment on it
Colour-coded FoP labelling

0. Key priorities for 2013-14 1. Labelling 2. Advertising to Children 3. Acrylamide
4. Discriminatory Food Taxes 5. The Market for Savoury Snacks in Europe
8

Pressure is increasing! “Food marketing is one of the key factors for childhood obesity”
WHO – Global Action Plan for the Prevention and Control of NCDs 2013-2020 “Policies to reduce the impact on children of marketing of foods and non-alcoholic beverages high in saturated fats, trans-fatty acids, free sugars, or salt” European Commission – EU Action Plan on Childhood Obesity Restrict marketing practices that promote energy-dense food and drinks to children under 18 years Several EU Member States Ireland: As of July new advertising restrictions for "HFSS" products to children in all radio and television broadcasts Poland: Polish government discusses ban on selling, serving, advertising and presenting snacks at nurseries, primary schools, grammar schools and other care and educational centres NGOs – International Association for the Study of Obesity report “The impact of initiatives to limit the advertising of food and beverage products to children” 9

10
2008 2012 Membership 11 founding members
2/3 market coverage 19 members >80% of market coverage
Media covered TV Print Third-party internet
TV, Print, third-party internet and company-owned websites
Audience definition Audiences >50% Audiences >35%
Monitoring Advertising: 6 markets Schools: 4 markets [Total: 67.5% EU population]
Advertising: 12 markets Schools: 12 markets [Total: 81.5% EU population]
EU Pledge (=European CFBAI) accounts for about 80% of food and beverage advertising spend in the EU

Programmes >35% <12 audiences (restricted products)
All programmes (restricted products)
All programmes (all products)
TV advertising: a downward trend
2008-2012
- 84%
- 49%
- 29%
11

Entry into force: No later than 31 December 2014 12
• Continue • recruitment effort • verifying compliance and demonstrating change • stronger focus on advertising on websites
• Consider an evolution of the Pledge with regard to:
• scope: marketing channels • big chunk of social media, advergames, mobile games, cinema,
still out of scope – attracts criticism • appeal: marketing techniques (e.g. celebrity or licensed character
endorsement)
Ensuring continued relevance and remain credible in our efforts otherwise we might face strict legislation with serious consequences!
13

0. Key priorities for 2013-14 1. Labelling 2. Advertising to Children 3. Acrylamide
4. Discriminatory Food Taxes 5. The Market for Savoury Snacks in Europe
14

• Indicative levels of 1,000ppb in place for savoury snack
• Latest European Food Safety Agency (EFSA) monitoring results for 2007-2010 showed no tangible downwards trend
• Four EU member states pushed EFSA to come up with a scientific opinion, which would serve the European Commission in their decision making process
• Increasing number of member states want to introduce legislation
15
ESA Secretariat collected results of member companies’ acrylamide testing programmes 2002-2011:
• 40,455 observations • 10 years period • 20 European countries
The largest available data set relating to acrylamide levels in potato crisps in terms of scope, quantity and
length
16
Analysis published after peer-review in Food Additives & Contaminants Journal: http://www.tandfonline.com/doi/abs/10.1080/19440049.2013.805439#.UaW11cTwDIV
• ESA presented on its paper "Acrylamide Concentrations in Potato Crisps in Europe from 2002 to 2011" at a Member States Expert Group meeting on 24 June
• Presentation was followed by site visits to the Kellogg's and PepsiCo plants in Belgium on 25 June
• The European Standing Committee meeting on 1 July agreed a revised acrylamide monitoring recommendation
No change to the 1,000 µg/kg 'indicative level' for potato crisps from fresh potatoes and from potato dough
17
• EFSA has issued a statement that its experts aim to complete a full risk assessment and draft scientific opinion on acrylamide in mid-2014
• ESA co-ordinated a submission of 30,000+ data points (fresh and formed potato crisps) to EFSA in response to its call for occurrence data
• Commission will assess situation end 2014/early 2015 with a view to determining a long-term regulatory strategy
18

19
0. Key priorities for 2013-14 1. Labelling 2. Advertising to Children 3. Acrylamide
4. Discriminatory Food Taxes 5. The Market for Savoury Snacks in Europe

Economic crisis and size of public deficits is accelerating and countries look for additional revenues • Danish government announced at the end of 2012 to scrap the
saturated fat tax and to cancel the planned extension of the chocolate tax • Potential job losses, administrative burden for companies
and cross-border shopping in Germany were among the main arguments
• Hungarian Public Health Office gave update on the impact of the food taxes in Hungary (in place since Sep 2011) • Consumption of ‘wholesome’ ingredients decreased and
prices of taxed products increased on average by 29%, leading to a state revenue of EUR 64 million
20

Remaining element in discussions on supranational level • WHO Action Plan for the Prevention and Control of NCDs
2013-2020 ‘considers economic tools, including taxes and subsidies, to improve the affordability of healthier food products and to discourage the consumption of less healthy options’
• OECD Health Committee, previously known to be ‘industry-friendly’ included food taxation as a driver to promote health
21

0. Key priorities for 2013-14 1. Labelling 2. Advertising to Children 3. Acrylamide
4. Discriminatory Food Taxes 5. The Market for Savoury Snacks in Europe
Agenda
22
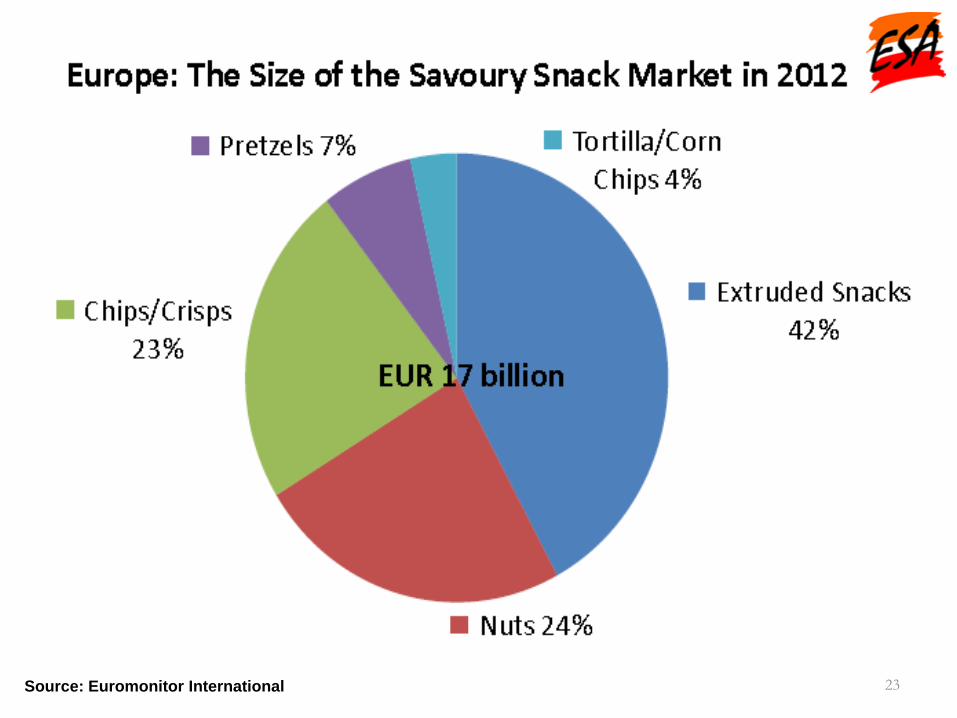
Source: Euromonitor International 23

European markets – volume
Country Volume (tonnes)
Change (%)
Country Volume (tonnes)
Change (%)
Germany 325,494 2.7 Switzerland 21,045 0.5 France 149,449 2.6 Ireland 18,261 3.9 Italy 80,389 -1.5 Austria 17,700 0.4 Sweden 42,865 1.1 Slovakia 8,442 -13.3 Norway 31,554 1.2 Lithuania 4,362 1.0 Czech Rep 24,903 -5.2 Slovenia 4,102 -7.7 Denmark 23,592 6.1 Latvia 3,115 3.7
Hungary 22,909 -11.7 Estonia 2,157 9.1
24

European markets – value
Country Value (€M)
Change (%) Country Value (€M)
Change (%)
Germany 2,226 7.2 Austria 156.0 4.6
France 1,305 5.8 Czech Rep 146.2 1.2 Italy 648.0 0.9 Hungary 143.7 2.8 Norway 430.6 6.9 Slovakia 53.9 -10.8 Sweden 368.8 2.4 Slovenia 31.2 -6.3 Switzerland 271.1 3.0 Lithuania 29.5 4.6 Ireland 234.0 7.8 Latvia 23.0 4.3 Denmark 219.5 6.9 Estonia 16.5 10.2
25

European markets – consumption
Country Per capita (Kg)
Change (%) Country Per capita (Kg)
Change (%)
Norway 6.3 0.6 France 2.3 2.2
Sweden 4.5 2.6 Hungary 2.3 -11.5 Denmark 4.2 5.8 Slovenia 2.2 -1.8 Germany 4.0 1.8 Austria 2.1 0.0 Switzerland 2.6 -0.6 Estonia 1.6 9.1 Italy 1.3 0.0 Slovakia 1.6 -8.0 Ireland 2.5 -3.7 Latvia 1.5 13.6 Czech Rep 2.3 -2.2 Lithuania 1.5 11.6
26

Thank you for your attention. Any questions?
27