the estimated cost of training the future surgical workforce thomas e. williams, jr., md,phd,...
TRANSCRIPT

The Estimated Cost of Training the Future Surgical Workforce
Thomas E. Williams, Jr., MD,PHD, Bhagwan Satiani, MD,MBA, Andrew Thomas, MD,MBA, and E. Christopher Ellison, MD
The Ohio State University Medical CenterDepartments of Surgery and Internal Medicine
DISCLOSURE: This effort was partially supported by a grant from Columbus Medical Association Foundation

HISTORY
– 1910 Flexner – 1959 Bane – 1975 SOSSUS [ Rural Shortage] – 1981 GMENAC – 1986 COGME, IOM, PEW, AAMC, AMA – 1994 COGME – 1995 PEW – 2004 Cooper – 2006 HRSA – 2008 Dill & Salsberg, AAMC
Surplus
Shortage

PHYSICIAN SHORTAGES

MEDICAL SCHOOL ENROLLMENTS PER 100,000 POPULATION
227,000,000 300,000,000
Medical School Enrollments – no increases between 1980 and 2005

BALANCED BUDGET ACT
Post Graduate Positions capped in 1997 by BBA No revision of the BBA so far
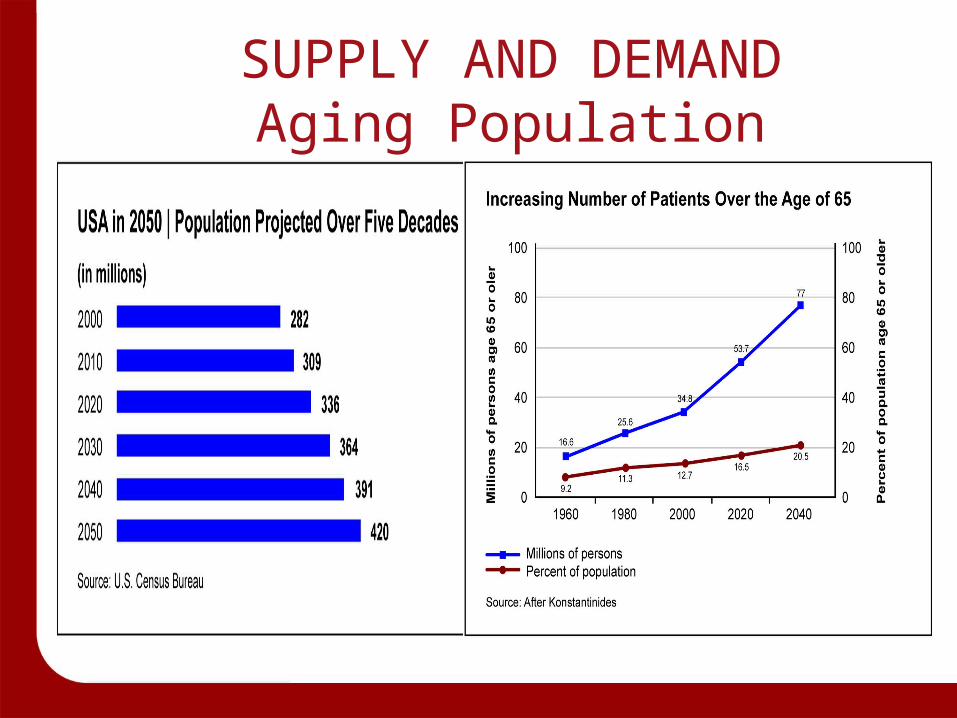
SUPPLY AND DEMANDAging Population

INCREASED WORK LOAD FOR THESE SEVEN SPECIALTIES
OBGYN also

Objectives
• To estimate the workforce needed by 2030 in seven surgical specialties to serve a population of 364 million people
• To quantify the cost associated with training additional surgeons.

Assumptions• Unchanged physician to population ratio• 30 years in practice from completion of
residency to retirement, • No revision of the Balanced Budget Act of
1997 and therefore no additional residency positions offered.
• Per resident expenses were estimated at $80,000 including salaries, benefits, and other direct medical education costs.

Methods• A review of the certificates granted in
otolaryngology, orthopedic surgery, thoracic surgery, obstetrics and gynecology, neurosurgery, urology, and general surgery was conducted.
• Population estimates of U.S Census bureau
• Population-based algorithm
• Baseline Supply + New Entrants (U.S & IMG’s) - Attrition

RESULTS: UROLOGY WORKFORCE
0
2000
4000
6000
8000
10000
12000
2005 2010 2020 2030 2040 2050
Practicing current
New graduates
Total practicing

RESULTS SHORTAGES
SPECIALTY YEARS CERTIFIC- TOTAL TOTAL SHORTAGE
TO ATIONS/ TRAINEDNEEDED2011 TO
TRAIN YR
2011 TO 2030 2030
OB-GYN 4 1,200 24,000 37,636 13,636
ENT 5 300 6,000 8,516 2,516
ORTHO 5 650 13,000 17,355 4,355
GENERAL 5 1,000 20,000 22,525 2,525
UROLOGY 5 260 5,200 9,084 3,884
NEURO 6 125 2,500 2,728 228
THORACIC 2 100 2,000 3,994 1,994
TOTAL 3,635 72,700 101,838 29,138

Cost of training surgical specialists at present certification levels
SPECIALTY YEARS INRESIDENCY
CERTIFICATIONSPER YEAR
TOTAL TO BE
TRAINED2011 TO
2030
TOTALTRAINEEYEARS
TOTAL COSTAT $80,000
PER TRAINEEYEAR
OB-GYN 4 1,200 24,000 96,000 $7,680,000,000
ENT 5 300 6,000 30,000 $2,400,000,000
ORTHO 5 650 13,000 65,000 $5,200,000,000
GENERAL 5 1,000 20,000 100,000 $8,000,000,000
UROLOGY 5 260 5,200 26,000 $2,080,000,000
NEURO 6 125 2,500 15,000 $1,200,000,000
THORACIC 2 100 2,000 4,000 $320,000,000
Total 3,635 72,700 336,000 $26,880,000,000

Cost of training surgical specialists at certification levels needed
SPECIALTYTOTAL TO BE
TRAINED2011 TO 2030
NUMBER PER
CLASS
TRAINEE YEARS PER
CLASS
PER CLASS COST
AT $80,000
TOTAL COST2011 TO 2030
OB-GYN 37,636 1,882 7,527 602,176,000 12,043,520,000
ENT 8,516 426 2,129 170,320,000 3,406,400,000
ORTHO 17,355 868 4,339 347,100,000 6,942,000,000
GENERAL 22,525 1,126 5,631 450,500,000 9,010,000,000
UROLOGY 9,084 454 2,271 181,680,000 3,633,600,000
NEURO 2,728 136 818 65,472,000 1,309,440,000
THORACIC 3,994 200 399 31,952,000 639,040,000
TOTAL 101,838 5,092 23,115 1,849,200,000 36,984,000,000
Incremental Cost: $10B

LIMITATIONS
• Validity of US Census numbers
• Surgical demand of the aged
• Shortened training programs
• Specialization
• Misdistribution of surgeons
• Impact of the economy
• Disruptive technology

CONCLUSION
• There will not be a sufficient number of trained surgeons to care for the American people as early as 2030.
• The shortage will grow to almost 30,000 surgeons by 2030.
• Cost of $ 36.9 B– Current cost $ 26,8B– Incremental cost $ 10.1B

CHALLENGES - CREATING THE RESIDENCIES
GOAL – REVISION OF BBA OF 1997
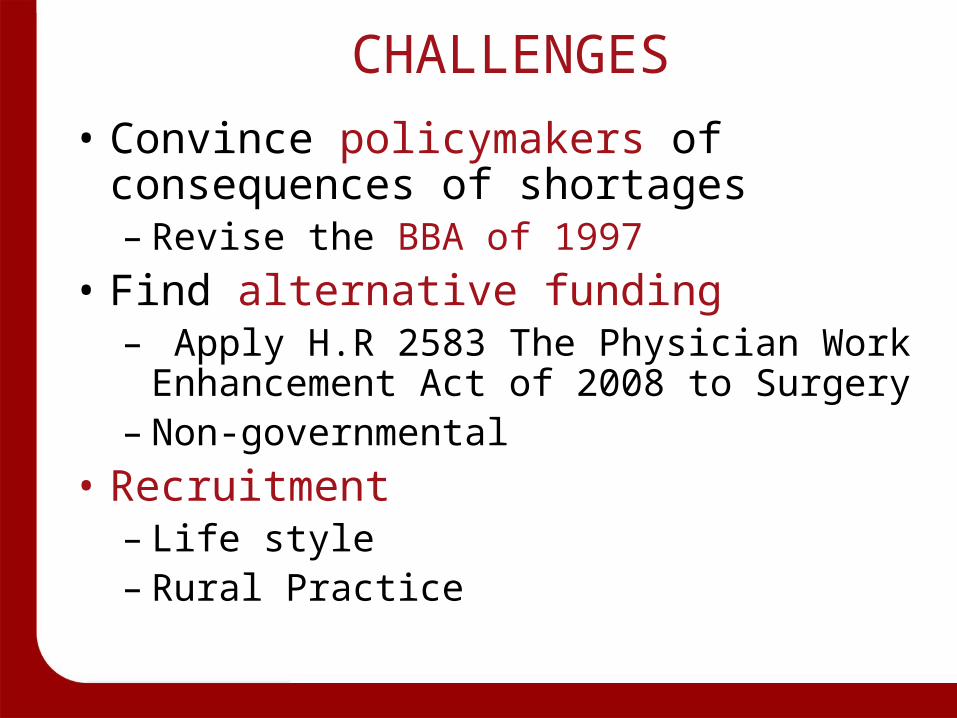
CHALLENGES
• Convince policymakers of consequences of shortages– Revise the BBA of 1997
• Find alternative funding – Apply H.R 2583 The Physician Work
Enhancement Act of 2008 to Surgery– Non-governmental
• Recruitment– Life style– Rural Practice

IMPACT OF SHORTAGE
ACCESS TO CARE
• WILL PORTSMOUTH, OHIO HAVE THESE SERVICES ???– APPENDECTOMY– BROKEN ARMS– DELIVERY of BABIES
• INCREASES IN – TIME TO APPOINTMENTS – TRAVEL TIMES

WILL IT COME TO THIS ??
RATIONING OF SURGICAL SERVICES
SOURCE: NEJM


SHORTAGES
• # Job solicitations
• Recruiting hard• Salary/bonus
offers• Hospital
employment
Source: Advisory Board (2007)

THORACIC SURGERY

HEALTH CARE $$$
Source: Modern Healthcare
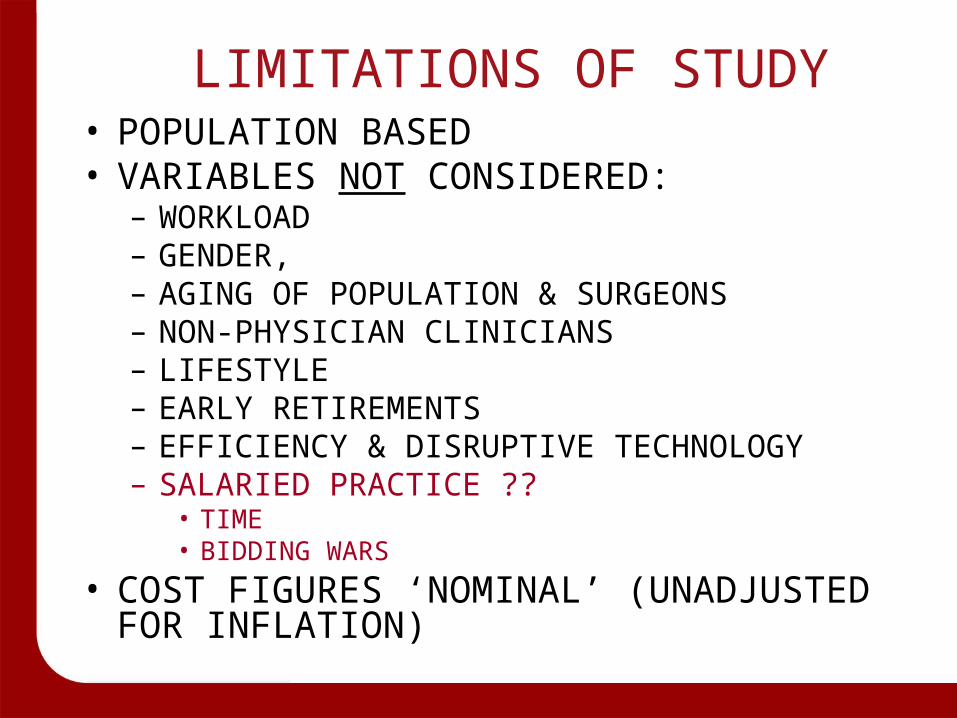
LIMITATIONS OF STUDY• POPULATION BASED• VARIABLES NOT CONSIDERED:
– WORKLOAD– GENDER, – AGING OF POPULATION & SURGEONS– NON-PHYSICIAN CLINICIANS– LIFESTYLE– EARLY RETIREMENTS– EFFICIENCY & DISRUPTIVE TECHNOLOGY– SALARIED PRACTICE ??
• TIME• BIDDING WARS
• COST FIGURES ‘NOMINAL’ (UNADJUSTED FOR INFLATION)

COOPER
Relationship of GDP & Physician Ratio
0
50
100
150
200
250
300
350
1929 1960 1970 1980 1990 2000
Year
#
GDP PER CAPITA ($100'S)
PHYSICIANS/100,000POPULATION

% Growth in surgical residents% Growth in Surgical Specialty Residents 2002-2007
0.00%
5.00%
10.00%
15.00%
20.00%
25.00%
30.00%
35.00%
Allopathic IMG's Osteopathic
Change in Total Residents
% % Growth
Source: AAMC
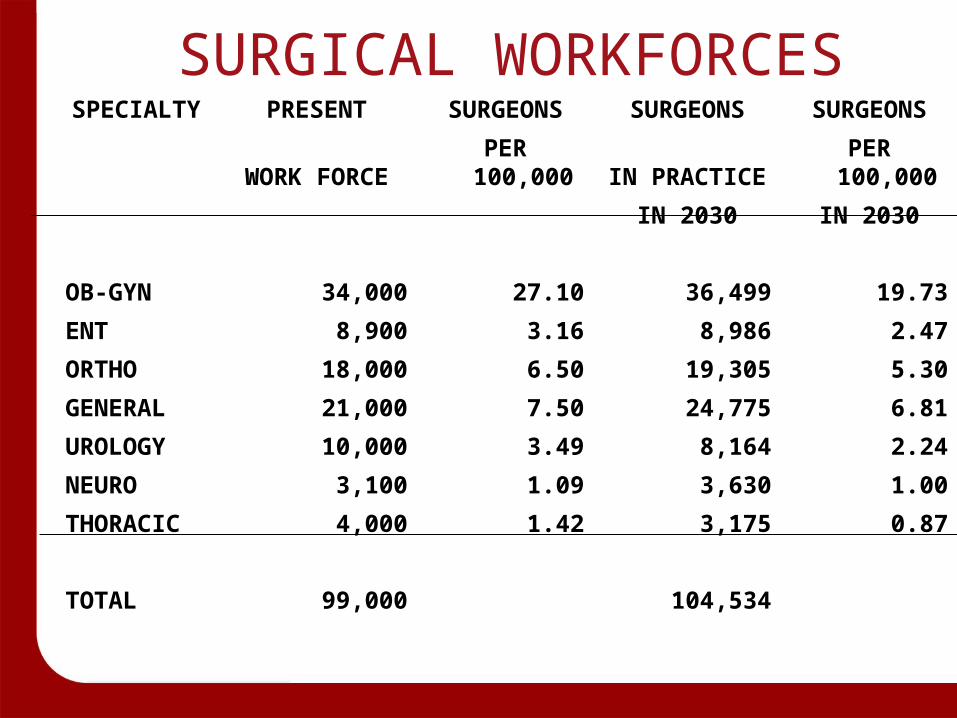
SURGICAL WORKFORCESSPECIALTY PRESENT SURGEONS SURGEONS SURGEONS
WORK FORCE PER 100,000 IN PRACTICE PER 100,000
IN 2030 IN 2030
OB-GYN 34,000 27.10 36,499 19.73
ENT 8,900 3.16 8,986 2.47
ORTHO 18,000 6.50 19,305 5.30
GENERAL 21,000 7.50 24,775 6.81
UROLOGY 10,000 3.49 8,164 2.24
NEURO 3,100 1.09 3,630 1.00
THORACIC 4,000 1.42 3,175 0.87
TOTAL 99,000 104,534
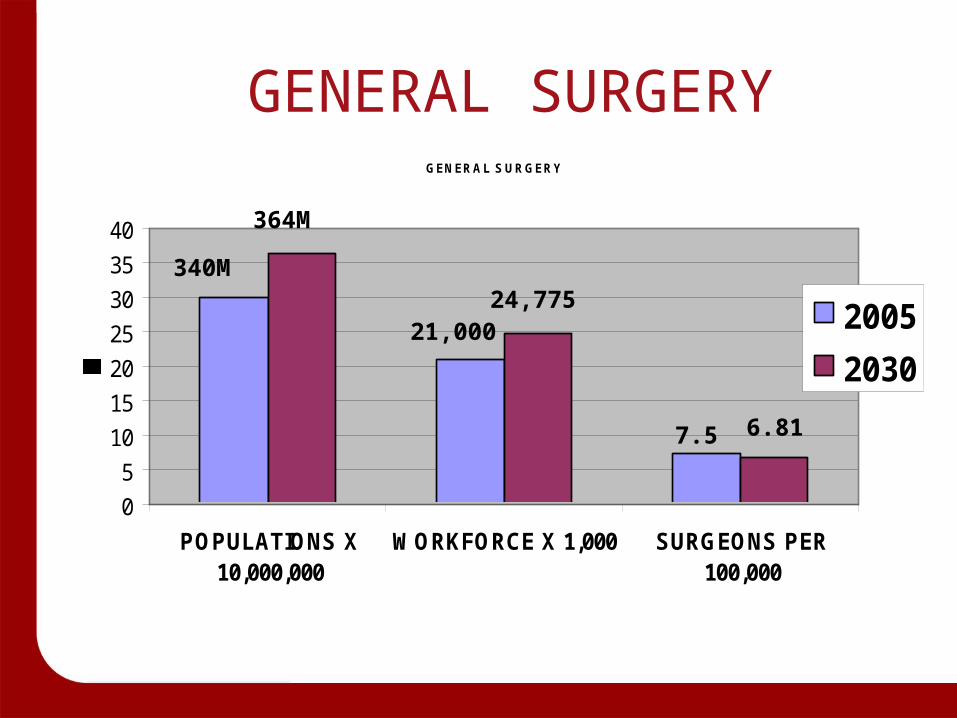
GENERAL SURGERYGENERAL SURGERY
0
5
10
15
20
25
30
35
40
POPULATIONS X10,000,000
WORKFORCE X 1,000 SURGEONS PER100,000
2005
2030
7.5 6.81
24,77521,000
340M
364M

NEEDED VERSUS SUPPLYTHORACIC SURGEONS
0
1000
2000
3000
4000
5000
6000
7000
2000 2010 2020 2030 2040 2050
YEAR
# O
F S
UR
GE
ON
S
NEEDED
PRACTICING

RESULTS: UROLOGY WORKFORCE
0
2000
4000
6000
8000
10000
12000
2005 2010 2020 2030 2040 2050
Practicing current
New graduates
Total practicing

SUMMARYPossible Cure for the Shortage
• Increase training positions– Funding
• Interest trainees in small town USA– Role models– Rural tracking or training programs– Incentives for rural practice
• Increase interest of X and Y generation and women in surgery