the eso uves advanced data products quasar sample - ii ... · the eso uves advanced data products...
TRANSCRIPT

arX
iv:1
307.
0602
v2 [
astr
o-ph
.CO
] 15
Aug
201
3Astronomy & Astrophysicsmanuscript no. uvespaperII c© ESO 2018March 6, 2018
The ESO UVES advanced data products quasar sample - II.Cosmological evolution of the neutral gas mass density
Tayyaba Zafar1, Celine Peroux1, Attila Popping2, Bruno Milliard1, Jean-Michel Deharveng1, and Stephan Frank1,3
1 Aix Marseille Universite, CNRS, LAM (Laboratoire d’Astrophysique de Marseille) UMR 7326, 13388, Marseille, France.2 International Centre for Radio Astronomy Research (ICRAR), The University of Western Australia, 35 Stirling Hwy, Crawley, WA
6009, Australia.3 Department of Astronomy, Ohio State University, 140 West 18th Avenue, Columbus, OH 43210-1173, USA.
Received/ Accepted
ABSTRACT
Damped absorbers, seen in the spectra of background quasars, are unique probes to select Hi-rich galaxies. These galaxies allow oneto estimate the neutral gas mass over cosmological scales. The neutral gas mass is a possible indicator of gas consumption as starformation proceeds. The damped Lyα absorbers (DLAs;NH I ≥ 2 × 1020 cm−2) and sub-DLAs (1019 ≤ NH I ≤ 2 × 1020 cm−2) arebelieved to contain a large fraction of neutral gas mass in the Universe. In paper I of the series, we presented the resultsof a searchfor DLAs and sub-DLAs in the European Southern Observatory (ESO) Ultraviolet Visual Echelle Spectrograph (UVES) advanceddata products dataset of 250 quasars. Here we use an unbiasedsubsample of sub-DLAs from this dataset to derive their statisticalproperties. We built a subset of 122 quasars ranging from 1.5 < zem < 5.0, suitable for statistical analysis. The statistical sample wasanalyzed in conjunction with other sub-DLA samples from theliterature. This resulted in a combined sample of 89 sub-DLAs over aredshift path of∆z = 193. We derived the redshift evolution of the number densityand the line density for sub-DLAs and comparedthen with the Lyman-limit systems (LLSs) and DLA measurements from the literature. The results indicate that these three classes ofabsorbers are evolving in the redshift interval 1.0 < z < 5.0. Thanks to the ESO UVES advanced data products data, we wereable todetermine the column density distribution,fH I(N, z), down to the sub-DLA limit. The flattening offH I(N, z) in the sub-DLA regimeis present in the observations. The redshift evolution offH I(N, z) down to logNH I = 19.0 cm−2 is also presented, indicating that thereare more sub-DLAs at high redshift than at low redshift.fH I(N, z) was also used to determine the neutral gas mass density,Ωg, at1.5 < z < 5.0. The complete sample shows that sub-DLAs contribute 8–20%to the totalΩg from 1.5 < z < 5.0. In agreement withprevious studies, no evolution ofΩg was observed from low to high redshift (i.e., 1.5 < z < 5.0), suggesting that star formation alonecannot explain this non-evolution and replenishment of gasand that recombination of ionized gas is needed.
Key words. Galaxies: abundances – Galaxies: evolution – Galaxies: high-redshift – Quasars: absorption lines – Quasars: general.
1. Introduction
Baryons account for only a small fraction of mass in theUniverse (Fukugita & Peebles 2004). In neutral and molecu-lar phase they are reservoirs of gas from which stars formover cosmological scales. A way of measuring the assemblyof galaxies is to probe the rate at which they convert theirgas into stars. Therefore, to understand this, it is important todetermine the cosmological mass density of neutral gas (Ωg;Ma & Bertschinger 1994 Klypin et al. 1995. The observations ofH i-rich galaxies, selected by the imprint they leave on a back-ground quasar, allow one to measure the neutral gas mass den-sity, Ωg. The quasar absorbers are divided into several classesaccording to the number of atoms along the line of sight: thedamped Lyα absorbers (DLAs) withNH I ≥ 2 × 1020 cm−2, thesub-DLAs with 1019 ≤ NH I ≤ 2 × 1020 cm−2, the Lyman-limitsystems (LLSs) with 1.6× 10¹⁷ ≤ NH I ≤ 1019 cm−2 and the Lyαforest withNH I ≤ 1.6× 1017 cm−2.
Lyα absorbers provide a useful probe of the distribu-tion of baryonic matter in the Universe over cosmologicalscales. The Hi column density distribution function,fH I(N, z),for different classes of absorbers is determined by countingthe number of Lyα absorbers in the spectra of backgroundquasars (e.g., Wolfe et al. 1995; Storrie-Lombardi & Wolfe
Send offprint requests to: [email protected]
2000; Prochaska et al. 2005; Noterdaeme et al. 2009, 2012).Current measurements of thefH I(N, z) distribution span almostten orders of magnitude in column density, ranging fromNH I ∼
1012 – 1022. The fH I(N, z) distribution for quasar absorbers isanalogous to the luminosity function of galaxy surveys. Thisfunction is then used to derive the amount of neutral gas massas a function of redshift.
The contribution of sub-DLAs to the total neutral gas massis the source of intense discussion in recent years (see Viegas1995; Peroux et al. 2005; Guimaraes et al. 2009). The contri-bution of sub-DLAs cannot be neglected in an accurate deter-mination of the total neutral gas mass. The gas in LLSs/sub-DLAs is located in extended haloes, whereas the gas in DLAsis located in dense and compact regions (Peroux et al. 2003b;van de Voort et al. 2012). The evolution ofΩg has been open todebate (Peroux et al. 2005; Zwaan et al. 2005a; Rao et al. 2006;Lah et al. 2007; Noterdaeme et al. 2009; Martin et al. 2010;Noterdaeme et al. 2012; Braun 2012). Atz = 0, the neutral gasis traced by the hyperfine 21-cm emission of atomic hydrogen,but, the limited sensitivity of current generation of radiotele-scopes prevents detection beyondz∼0.2 (Lah et al. 2007, seealso Chang et al. 2010).
In this work we take advantage of the advanced data prod-ucts archival data of UVES (Dekker et al. 2000) mounted at theESO-Very Large Telescope (VLT). The excellent spectral resolu-

2 T. Zafar et al.: Cosmological Evolution of the Neutral Gas Mass Density
tion of UVES allows measuring of the Hi column density withhigh precision. In Zafar et al. (2013, hereafter paper I), the de-tails of the ESO UVES advanced data products dataset togetherwith the newNH I measurements of DLAs/sub-DLAs have beenprovided. Because the database is not a blind search for sub-DLAs, we build here an unbiased statistical sample. Our mainaim is to include absorbers down to logNH I ≥ 19.0 to determinethe shape of thefH I(N, z) in the sub-DLA regime. The currentsample allows us to determine thefH I(N, z) redshift evolution.Quantities such as the number density and line density for differ-ent classes of quasar absorbers are also determined. Moreover,the incidence of the sub-DLAs together with the DLAs are usedto determine the total gas mass density.
In §2 we define our dataset. The ‘statistical’ and combinedsamples are defined in§3 and 4. In§5 we present our resultsfor fH I(N, z) andΩg, followed by a discussion. Conclusions areprovided in§6. All log values and expressions correspond to logbase 10. Throughout the paper we adopt theΛCDM cosmologywith the cosmological parametersΩΛ = 0.7, Ωm = 0.3, andH0 = 70 km s−1 Mpc−1 (e.g., Spergel et al. 2003).
2. EUADP sample
Details of the building of the quasar sample can be found in pa-per I and are briefly summarized here. The sample consists of250 quasar spectra ranging from 0.191 ≤ zem ≤ 6.311 takenwith the VLT instrument UVES. The lowest resolving power ofthe UVES is∼ 41,400 when a slit of 1′′ is used. The echellespectrograph covers the wavelength range 300–500 nm (BLUE)and 420–1100 nm (RED) by use of different standard and non-standard settings. The data were downloaded from the ESOUVES advanced data products (EUADP) facility. The down-loaded data were processed by the ESO UVES pipeline (ver-sion 3.2) within theMIDAS environment with the best availablecalibration data. The different spectra of each quasar were thenmerged after interpolating to a common frame. Throughout thepaper, this sample of quasars is coined the “EUADP” sample.
To derive a complete census of DLAs/sub-DLAs, an au-tomated search accompanied by a visual search was made tosearch for DLAs and sub-DLAs. The algorithm consists of build-ing an equivalent-width spectrum over 400-pixel-wide boxes foreach quasar blueward of the Lyα emission line of the quasar (seepaper I). This search resulted in 93 DLAs and 57 sub-DLAswhose Lyα absorption lines are covered by our data. A care-ful search in the literature indicated that 87 of these DLAs and44 of these sub-DLAs have been reported before. TheNH I mea-surements for the remaining 6 DLAs and 13 sub-DLAs are re-ported in paper I. These DLA/sub-DLAs are confirmed by thedetection of lines from higher-order Lyman series and associ-ated metal-lines. Their Hi column densities were determinedusing Voigt-profile fitting withFITLYMAN package inMIDAS(Fontana & Ballester 1995). In addition, another 47 DLAs/sub-DLAs along the lines of sight of EUADP quasars have beenfound for which Lyα absorption lines are not covered by ourdata. This yields a total of 197 DLAs/sub-DLAs along the lines-of-sight of 250 EUADP quasars.
3. Defining the statistical EUADP sample
The EUADP data originally come from different observing pro-grams where quasars were targeted by several groups for a va-riety of studies with different goals, many of which include theanalysis of a known DLA. We have followed a strict and careful
Table 2. Summary of the number of quasars and sub-DLAs forsamples included in this study. We used a subset of the EUADPsample, dubbed the statistical EUADP sample, combined withprevious sub-DLA studies.
Sample Ref. ∆z QSOs Sub-DLAsdescription included includedEUADP Paper I · · · 250 57Statistical EUADP This work 88.2 122 27
Previous sub-DLA Peroux et al. (2003a, 2005)104.9 116 62O’Meara et al. (2007)
Combined sub-DLA This work 193.1 238 89
process to select quasar lines-of-sight and sub-DLAs that can beused for statistical analysis. This process, detailed below, led toa subset of the EUADP sample dubbed the “statistical” EUADPsample.
3.1. Survey sensitivity for the statistical EUADP sample
The first step was defining the redshift path for each quasar.As common is practice, we defined a redshift interval∆z =zmax − zmin to obtain the redshift path over which we could re-liably determine the presence of damped absorbers. The lowestredshift (zmin) is either the lowest redshift at which the signal-to-noise (S/N) ratio ensures the detection of absorption featuresat the sub-DLA threshold of EWrest = 2.5 Å, or where an inter-vening LLS is present and thus prohibits the detection of anyab-sorption feature at wavelengths shorter than the restframeLymanbreak (912 Å). The higher redshift value of the two is adoptedaszmin of the quasar. The highest redshift (zmax) is 3000 km s−1
blueward of the quasar emission redshift. In addition, someofthe UVES-combined spectra have distinct spectral gaps due tono-overlapping settings, which were excluded from the redshiftpath calculation. The resulting values are provided for each lineof sight in Table 1.
Furthermore, we ignored quasars withzem < 1.51 becausethe UVES spectral coverage does not extend blueward to wave-lengths required for detecting the Lyα line. As a result of theS/N cut, the quasars abovezem > 5.0 were excluded becausethe density of absorbers becomes high enough beyond that red-shift to affect our ability to reliably determine the absence orpresence of sub-DLAs. In addition, we examined the abstractofeach observing proposal to determine if any knowledge of thesightline characteristics were known prior to the execution ofthe proposal that may represent a bias. We excluded all sight-lines that were observed for studying the Lyα forest and the in-tergalactic medium (IGM). This includes Heii Gunn-Petersoneffect, low column density distribution, and the tomography ofthe IGM as traced by quasar pairs or groups. Indeed, these sight-lines might be biased toward having no highNH I system, pre-cisely the type of feature we are looking for in the present study.We chose the conservative approach to exclude all these redshiftpaths and sub-DLAs from our analysis. Broad-absorption-line(BALs) quasars are often excluded from the search for quasarabsorbers. Indeed, the gas associated with the quasar itself can beconfused with DLAs. The EUADP sample contains a few BALquasars, but the absorption features are weak and cannot be con-fused with DLAs. In the appendix, we describe the reason forincluding or excluding each individualzem> 1.5 quasar sightlineand sub-DLA. This leaves us with a statistical EUADP sampleof 122 quasars from the original 250 EUADP sample (see Table2).

T. Zafar et al.: Cosmological Evolution of the Neutral Gas Mass Density 3
Fig. 1.Upper panel: Redshift sensitivity function,g(z), as a func-tion of sub-DLA redshift for the statistical EUADP (gray),O’Meara et al. (2007) MIKE+ ESI (green), Peroux et al. (2005)(red), Peroux et al. (2003a) (blue), andcombined sub-DLA sam-ple (black). Lower panel: The distribution of quasar emissionand absorption redshift for thecombined sub-DLA sample is il-lustrated by the black dotted and black solid lines, respectively.
Where the archival quasar spectra were targeted for thestudy of dark-matter halos, black-hole masses, stellar masses,and quasar luminosities. where an absorber is not the interestof the study, we included the full redshift path. A large per-centage (∼45%) of the quasars in the EUADP sample were tar-geted because there was a DLA along their line of sight (studiesfor deuterium, molecules, or metal abundances), though manylines of sight have been targeted for a specific known DLAwithout taking into consideration a sub-DLA along the sameline of sight. When an archival quasar spectra was targeted forstudying a DLA/sub-DLA, we removed the Lyα regions of afew angstroms in the trough (according to the column densities)from the redshift path, and the Lyβ regions for DLAs with logNH I & 20.90. The working hypothesis was that the presence ofa targeted DLA/sub-DLA does not effect the incidence of othersystems. This methodology follows the one applied by othersin the statistical analysis of archival data (Peroux et al.2003a;Ribaudo et al. 2011).
The cumulative number of lines of sight along which an ab-sorber at any given redshift could have been detected in Lyα, i.e.,redshift sensitivityg(z), is defined as:
g(z) =∑
H(zmaxi − z)H(z − zmin
i ), (1)
whereH is the Heaviside step function. The plot ofg(z) ver-sus the sub-DLA redshift for the statistical EUADP sample isshown in Fig. 1. The sharp feature ing(z) at z ≈ 2.82 is causedby a spectral gap between the BLUE 390 and RED 580 set-tings. Another feature atz ≈ 3.8 is due to a spectral gap in therange of 5756–5834Å in the RED 580 setting. The total red-shift path of our statistical EUADP sample is∆z = 88.2. Fora comparison, the Magellan Inamori Kyocera Echelle (MIKE)and the Echellette Spectrograph and Imager (ESI) sub-DLAsample from O’Meara et al. (2007) and UVES samples fromPeroux et al. (2003a, 2005) are also shown in Fig. 1. Their red-shift paths are∆z = 91.8, 16.6, and 23.9 respectively. The
Statistical EUADP
sample
(This work)
Previous sub-DLA
samples
(Péroux et al. 2003a,
2005; O'Meara et al.
2007)
If ∆z and
sub-DLAs
in common
Statistical EUADP
sample
(This work)
use
Fig. 2. Flowchart describing the building of thecombined sub-DLA sample. For quasars in common with previous sub-DLAsamples and the work presented here, we usedNH I and the red-shift path from this work.
EUADP sample includes a larger number of quasars at lowerredshift than other samples.
3.2. Absorber selection for the statistical EUADP sample
We defined our statistical EUADP sample as the catalog of sub-DLAs of the EUADP sample from paper I restricted to theredshift path defined above. The complete log of DLAs/sub-DLAs, redshifts, and column densities together with referencesare given in Table 1. Only sub-DLAs shown in boldface in Table1 were included in the statistical EUADP sample. The resultingstatistical EUADP sample consists of 27 sub-DLAs found bysurveying the 122 quasars’ lines of sight.
4. Defining the combined sub-DLA sample
For the remained of the paper, the statistical EUADP sampleis used in combination with previous sub-DLA studies. For theanalysis of sub-DLAs, we included the statistical EUADP sam-ple and the results of the high-resolution surveys by Peroux et al.(2003a, 2005) and O’Meara et al. (2007) in our statistics. Whencombining these samples, we encountered cases where the samequasars were targeted in two independent surveys. For theseweused∆z and the sub-DLA from this work. For example, becausethe EUADP sample is based on UVES archival data,by con-struction it includes the data from Peroux et al. (2005) which arebased on a PI UVES project aiming at finding new sub-DLAsat high redshift. The method used prevents any multiple count-ing in such cases. The procedure of defining thecombined sub-DLA sample is illustrated in Fig. 2. In Fig. 1,g(z) for thecom-bined sub-DLA, Peroux et al. (2005), Peroux et al. (2003b), andO’Meara et al. (2007) samples are shown. The total redshift pathfor thecombined sub-DLA sample is∆z = 193.1.
The resultingcombined sub-DLA sample consists of 89 sub-DLAs found by surveying 238 quasars (see Table 2). The col-umn density distributions of thecombined sub-DLA sample,Peroux et al. (2005), Peroux et al. (2003a), and MIKE+ ESIsamples from O’Meara et al. (2007) are shown in Fig. 3.
5. Statistical sample properties
5.1. Number density
The number density of quasar absorbers, a quantity directlyobservable, is the number of absorbers per unit redshift, i.e.,d(n)/dz also represented asn(z),
d(n)/dz = n(z) =mdz, (2)

4 T. Zafar et al.: Cosmological Evolution of the Neutral Gas Mass Density
Table 3. Summary of the number density (d(n)/dz) and line number density (d(n)/dX) of DLAs and sub-DLAs. The DLA resultsare taken from the Peroux et al. (2003b) sample. Thed(n)/dz andd(n)/dX for sub-DLAs is measured from the contribution of bothDLAs and sub-DLAs. The final row shows the total redshift pathand absorption path length for both DLAs and sub-DLAs.
log NH I > 19.0 > 20.3z range 〈z〉 dz dX # d(n)/dz d(n)/dX 〈z〉 dz dX # d(n)/dz d(n)/dX1.51–2.00 1.80 29.9 87.3 4 0.35± 0.12 0.12± 0.04 1.84 95.6 279.4 19 0.22± 0.05 0.08± 0.022.00–2.50 2.26 49.2 156.8 11 0.43± 0.10 0.14± 0.03 2.27 125.1 396.6 26 0.21± 0.04 0.07± 0.012.50–3.00 2.76 47.1 162.8 24 0.72± 0.13 0.21± 0.04 2.73 87.2 301.0 18 0.21± 0.05 0.06± 0.013.00–3.50 3.21 33.7 124.5 23 0.96± 0.18 0.26± 0.05 3.25 64.8 239.6 18 0.28± 0.07 0.08± 0.023.50–4.00 3.72 23.3 91.7 19 1.20± 0.24 0.30± 0.06 3.77 49.5 194.6 19 0.38± 0.09 0.10± 0.024.00–5.00 4.18 9.9 41.0 8 1.25± 0.38 0.30± 0.09 4.20 23.1 95.1 10 0.43± 0.14 0.10± 0.031.51–5.00 · · · 193.1 664.1 89 · · · · · · · · · 445.4 1506.9 · · · · · · · · ·
Fig. 3. Histograms showing the number of sub-DLAs as afunction of log NH I . Top panel: MIKE + ESI sample fromO’Meara et al. (2007). The filled area represents the new sub-DLAs in MIKE + ESI sample and the unfilled area illus-trates the ones overlapping with thecombined sub-DLA sam-ple. Middle panel: Combined sub-DLA sample. Bottom panel:The solid black, dash-dotted gray and filled gray histogramsshow the contribution of sub-DLAs to thecombined sub-DLAsample from the statistical EUADP, Peroux et al. (2005), andPeroux et al. (2003a) samples respectively.
wherem is the total number of absorbers in a given redshift binanddz is computed by summing the redshift paths in this bin.
The combined sample allows one to determine the numberdensity of sub-DLAs and compare it with those for the DLAsand LLSs from the literature. Fig. 4 shows the number densityper unit redshift for DLAs (Peroux et al. 2003b, Prochaska et al.2005, Rao et al. 2006, and Zwaan et al. 2005b), sub-DLAs(thecombined sub-DLA sample), and LLSs (Songaila & Cowie2010 and O’Meara et al. 2013). At low-redshift, results forDLAs come from the Rao et al. (2006) survey of quasars tar-geted because of known Mgii absorbers. The Zwaan et al.(2005b) results come from 21-cm emission of atomic hydro-gen ofz = 0 analogues to DLAs. At low redshifts, the resultsof O’Meara et al. (2013) for LLS come fromHubble SpaceTelescope survey. The binning for our data was chosen with anincrement of one half in redshift except for 4.0 < z < 5.0 becauseof low number statistics. Vertical error bars reflect 1σ Poissonuncertainty in the number of absorbers. All results are tabulatedin Table 3.
Fig. 4. Number density (d(n)/dz) of quasar absorbers as a func-tion of redshift.d(n)/dz for DLAs: Peroux et al. (2003b, blackcircles), Prochaska et al. (2005, black open stars), Rao et al.(2006, black open triangles), and Zwaan et al. (2005b, blacksquare) are shown.d(n)/dz for sub-DLAs: thecombined sub-DLA sample (red circles), and LLSs: Songaila & Cowie (2010,blue open stars) and O’Meara et al. (2013, blue inverted trian-gles) are shown. The size of the horizontal bars represents theredshift bin sizes, and the vertical error bars are the 1σ Poissonuncertainties in the number of absorbers. The blue dashed lineis the simple evolution fit to the LLS from Songaila & Cowie(2010). The red and black dashed lines are the LLS evolution fitscaled by a factor of 2.8 and 9.0 for the difference ind(n)/dzof sub-DLAs and DLAs with respect to LLSs (in the range2.5 < z < 3.0), respectively. The black dot-dashed curve rep-resents a non-evolving population of non-zeroΛ-Universe. Thered and blue dot-dashed curves are non-evolution curves scaledto a factor of 2.3 and 5.6, respectively (see text for more detail).
Songaila & Cowie (2010) found thatd(n)/dz of LLSs canbe well fitted by a simple evolution law of the formd(n)/dz =n3.5 [(1 + z)/4.5]γ with n3.5 = 2.80 ± 0.33 andγ = 1.94+0.36
−0.32for the entire redshift range from 0< z < 6, wheren3.5 isthe value ofn(z) at z = 3.5. In Fig. 4 we plot this simple evo-lution fit for LLS from Songaila & Cowie (2010), which pro-vides a reasonable fit to the data. For sub-DLAs and DLAs, themaximum-likelihood fit for the LLS was scaled according to afactor of difference in number density of the sub-DLA (by a fac-tor of 2.8) and DLA (by a factor of 9.0) in the redshift range2.5 < z < 3.0. The redshift range was chosen arbitrarily. Thisshows that the number density of the absorbers per unit redshiftis increasing with increasing redshift for all three classes of ab-
T. Zafar et al.: Cosmological Evolution of the Neutral Gas Mass Density 5
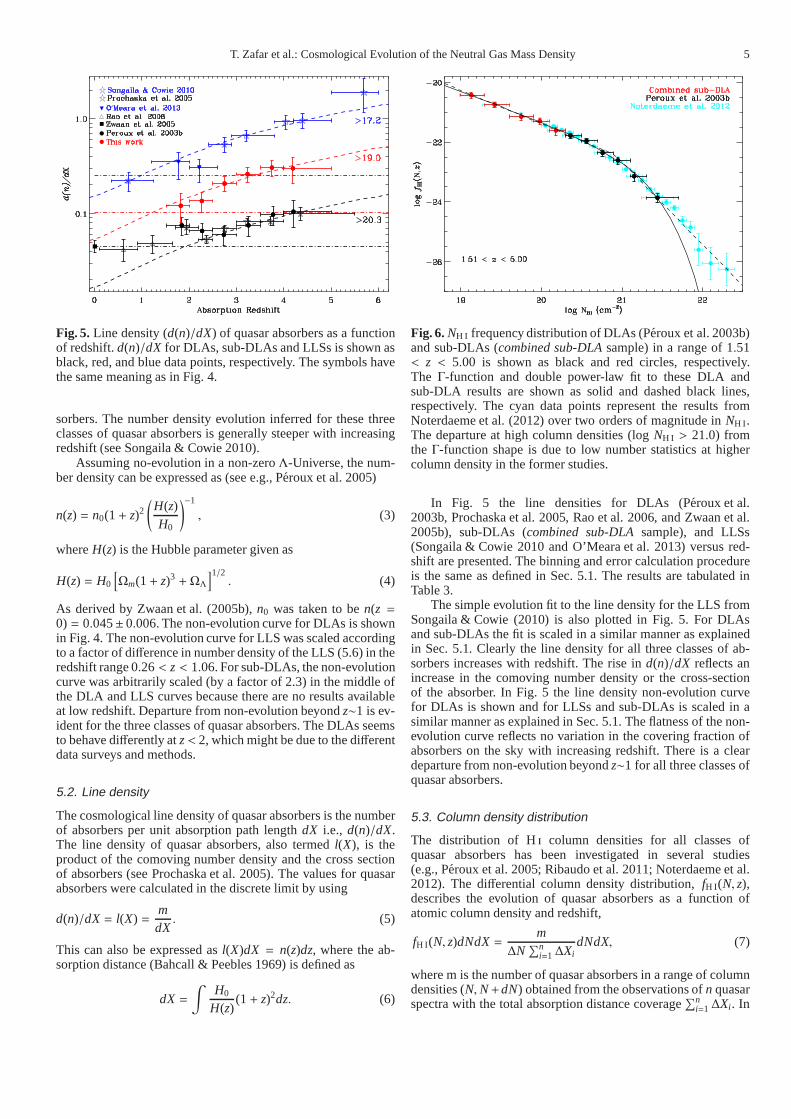
Fig. 5. Line density (d(n)/dX) of quasar absorbers as a functionof redshift.d(n)/dX for DLAs, sub-DLAs and LLSs is shown asblack, red, and blue data points, respectively. The symbolshavethe same meaning as in Fig. 4.
sorbers. The number density evolution inferred for these threeclasses of quasar absorbers is generally steeper with increasingredshift (see Songaila & Cowie 2010).
Assuming no-evolution in a non-zeroΛ-Universe, the num-ber density can be expressed as (see e.g., Peroux et al. 2005)
n(z) = n0(1+ z)2
(
H(z)H0
)−1
, (3)
whereH(z) is the Hubble parameter given as
H(z) = H0
[
Ωm(1+ z)3 + ΩΛ
]1/2. (4)
As derived by Zwaan et al. (2005b),n0 was taken to ben(z =0) = 0.045± 0.006. The non-evolution curve for DLAs is shownin Fig. 4. The non-evolution curve for LLS was scaled accordingto a factor of difference in number density of the LLS (5.6) in theredshift range 0.26< z < 1.06. For sub-DLAs, the non-evolutioncurve was arbitrarily scaled (by a factor of 2.3) in the middle ofthe DLA and LLS curves because there are no results availableat low redshift. Departure from non-evolution beyondz∼1 is ev-ident for the three classes of quasar absorbers. The DLAs seemsto behave differently atz < 2, which might be due to the differentdata surveys and methods.
5.2. Line density
The cosmological line density of quasar absorbers is the numberof absorbers per unit absorption path lengthdX i.e., d(n)/dX.The line density of quasar absorbers, also termedl(X), is theproduct of the comoving number density and the cross sectionof absorbers (see Prochaska et al. 2005). The values for quasarabsorbers were calculated in the discrete limit by using
d(n)/dX = l(X) =mdX. (5)
This can also be expressed asl(X)dX = n(z)dz, where the ab-sorption distance (Bahcall & Peebles 1969) is defined as
dX =∫
H0
H(z)(1+ z)2dz. (6)
Fig. 6.NH I frequency distribution of DLAs (Peroux et al. 2003b)and sub-DLAs (combined sub-DLA sample) in a range of 1.51< z < 5.00 is shown as black and red circles, respectively.The Γ-function and double power-law fit to these DLA andsub-DLA results are shown as solid and dashed black lines,respectively. The cyan data points represent the results fromNoterdaeme et al. (2012) over two orders of magnitude inNH I .The departure at high column densities (logNH I > 21.0) fromthe Γ-function shape is due to low number statistics at highercolumn density in the former studies.
In Fig. 5 the line densities for DLAs (Peroux et al.2003b, Prochaska et al. 2005, Rao et al. 2006, and Zwaan et al.2005b), sub-DLAs (combined sub-DLA sample), and LLSs(Songaila & Cowie 2010 and O’Meara et al. 2013) versus red-shift are presented. The binning and error calculation procedureis the same as defined in Sec. 5.1. The results are tabulated inTable 3.
The simple evolution fit to the line density for the LLS fromSongaila & Cowie (2010) is also plotted in Fig. 5. For DLAsand sub-DLAs the fit is scaled in a similar manner as explainedin Sec. 5.1. Clearly the line density for all three classes ofab-sorbers increases with redshift. The rise ind(n)/dX reflects anincrease in the comoving number density or the cross-sectionof the absorber. In Fig. 5 the line density non-evolution curvefor DLAs is shown and for LLSs and sub-DLAs is scaled in asimilar manner as explained in Sec. 5.1. The flatness of the non-evolution curve reflects no variation in the covering fraction ofabsorbers on the sky with increasing redshift. There is a cleardeparture from non-evolution beyondz∼1 for all three classes ofquasar absorbers.
5.3. Column density distribution
The distribution of Hi column densities for all classes ofquasar absorbers has been investigated in several studies(e.g., Peroux et al. 2005; Ribaudo et al. 2011; Noterdaeme et al.2012). The differential column density distribution,fH I(N, z),describes the evolution of quasar absorbers as a function ofatomic column density and redshift,
fH I(N, z)dNdX =m
∆N∑n
i=1∆XidNdX, (7)
where m is the number of quasar absorbers in a range of columndensities (N,N+dN) obtained from the observations ofn quasarspectra with the total absorption distance coverage
∑ni=1∆Xi. In

6 T. Zafar et al.: Cosmological Evolution of the Neutral Gas Mass Density
Table 4.Summary of the column density distribution of thecom-bined sub-DLA sample.
log NH I log logrange # 〈NH I〉 fH I(N, z)19.00–19.30 23 19.13 −20.43+0.09
−0.1019.30–19.60 21 19.42 −20.75+0.09
−0.1019.60–19.90 16 19.75 −21.15+0.09
−0.1319.90–20.10 18 20.06 −21.30+0.09
−0.1220.10–20.30 11 20.06 −21.61+0.11
−0.16
Table 5. Best-fit parameters of theΓ-function fits (see Eq. [6])to theNH I frequency distribution for different redshift bins.
z range logkg log Ng αg χ2ν
1.51–5.00 -22.33 21.02 -1.00 0.711.51–3.10 -22.30 21.08 -0.95 1.163.10–5.00 -22.05 20.91 -1.00 0.76
Table 6.Summary of the column density distribution of thecom-bined sub-DLA sample in two redshift bins.
z range 1.51–3.10 3.10–5.00log NH I log log log logrange # 〈NH I〉 fH I(N, z) # 〈NH I〉 fH I(N, z)19.00–19.40 14 19.20 −20.64+0.11
−0.13 17 19.17 −20.29+0.10−0.12
19.40–19.90 14 19.60 −21.16+0.10−0.13 15 19.65 −20.88+0.10
−0.1319.90–20.30 16 20.08 −21.48+0.10
−0.12 13 20.03 −21.30+0.10−0.14
Fig. 6, we present thefH I(N, z) of thecombined sub-DLA sam-ple while the values are tabulated in Table 4. The horizontalbars indicate the bin sizes plotted at the mean column densityfor each bin, and the vertical error bars are Poissonian statisti-cal errors. For a comparison with the DLA regime, the resultsof the Peroux et al. (2003b) samples are also shown with thesame redshift bins. In recent SDSS samples, Noterdaeme et al.(2009, 2012) observed absorbers down to logNH I = 20.0. Theresults of Noterdaeme et al. (2012) are also plotted in Fig. 6.Empirically, fH I(N, z) were fitted by a power-law for variousNH I regimes (e.g., Tytler 1987; Rao et al. 2006; O’Meara et al.2007). Early determinations offH I(N, z) for a broad columndensity range were defined with a single power-law (Tytler1987), but the improved quality of observations shows that asingle power-law does not represent the observations well overa broad column density range. For this reason, aΓ-function(power-law with an exponential turn-over), analogous to theSchechter function, was used to reasonably describe the ob-servations (e.g., Storrie-Lombardi & Wolfe 2000; Peroux et al.2003b; Noterdaeme et al. 2009). In addition, the integral ofthisfunctional form used to computeΩg converges, as opposed to apower law. TheΓ-function is defined as
fH I(N, z) = kg
(
NNg
)αg
e(−N/Ng). (8)
We fit the data with theΓ-function for the total redshift range.The best-fit values of the parameters are provided in Table 5 to-gether with the reducedχ2 (χ2
ν) values that define the goodness-of-fit. We also fit the data with a double power-law resultingin the best-fit values ofkd = −22.41, Nd = 20.90 (fixed),αd1 = −1.13, andαd2 = −2.74 (see also Noterdaeme et al. 2009).As apparent in Fig. 6, the column density distribution flattens inthe sub-DLA regime. This flattening of the distribution above logNH I = 18.0 cm−2 is indeed expected (e.g., Peroux et al. 2005;
O’Meara et al. 2007; Guimaraes et al. 2009). It is due to lessself-shielding in the absorbers because at these column densities,part of the neutral gas of the absorber is ionized by incidentUVflux (e.g., Katz et al. 1996; Pontzen et al. 2008; McQuinn et al.2011; Altay et al. 2011). The distribution steepens around logNH I = 20.3–21.5 as the absorbing gas becomes fully neutral(Altay et al. 2011; Erkal et al. 2012) and because of the atomic-to-molecular hydrogen transition (Schaye 2001; Krumholz et al.2009; Altay et al. 2011). There is a deficit of logNH I > 21.7DLAs in the Peroux et al. (2003b) sample because their redshiftpath is smaller than that of the SDSS surveys (Noterdaeme et al.2009, 2012), the latter providing a better estimation offH I(N, z)down to logNH I & 22.
In a recent study, Erkal et al. (2012) argued that the atomic-to-molecular hydrogen transitions do not significantly contributeto the high column density redshift-independent turnover.Theyfurthermore argued that the similarity of thefH I(N, z) at z = 3(e.g., Noterdaeme et al. 2009) andz = 0 (Zwaan et al. 2005b)is due to the similarity of the highest central Hi surface densi-ties of high-z and low-z disks. van de Voort et al. (2012) advo-cated that above logNH I = 17 most of the absorbers reside in-side haloes and below logNH I = 17 the absorbers reside outsidehaloes. They also argued that the absorbing gas between columndensities 17< log NH I < 21 has never experienced a virial shock.
5.3.1. fH I(N, z) redshift evolution
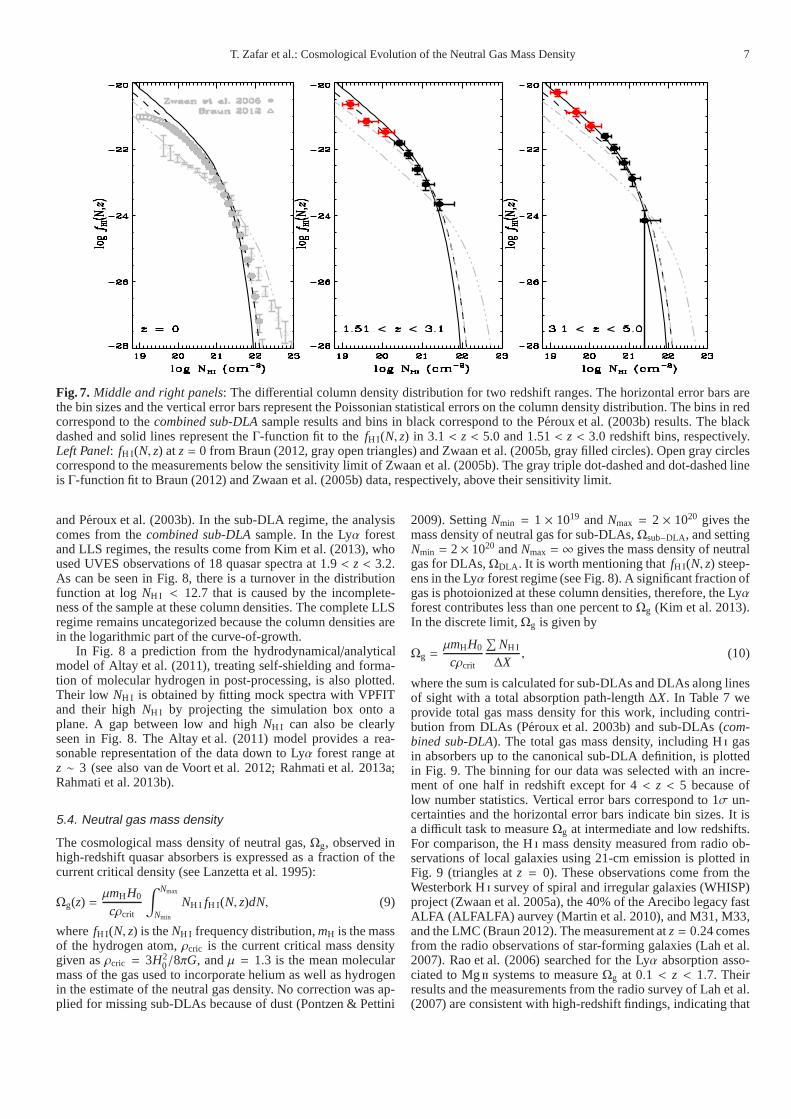
We estimated the column density distribution for low and highredshifts. The differential column density distributions for tworedshift ranges, 1.51 < z < 3.1 and 3.1 < z < 5.0, are shownin Fig. 7. These redshift ranges are chosen to divide the num-ber of sub-DLAs equally for each redshift bin. The results ofthecombined sub-DLA sample for two redshift bins are tabulated inTable 6. Because thedz were available to us, we fit thecombinedsub-DLA and Peroux et al. (2003b) results with theΓ-functionfor both redshift ranges; the best-fit values of the parametersare summarized in Table 5. For comparison, the column densitydistribution atz = 0 is also shown in Fig. 7 from Zwaan et al.(2005b) and Braun (2012). The results of Zwaan et al. (2005b)come from the survey of 355 Hi 21-cm individual maps ofnearby galaxies and the Braun (2012) results come from Hi
distribution, based on high-resolution maps of M31, M33, andthe Large Magellanic Cloud (LMC). The data of Zwaan et al.(2005b) have a lower resolution and therefore cannot resolve thehighest column densities. Braun (2012) used data at very high-resolution and also applied a correction to the column densitybased on opacity. In Fig. 7, we overplotted theΓ-function fit fromZwaan et al. (2005b) withαg = 1.24, logkg = −22.91 and logNg = 21.20. We performed aΓ-function fit to the Braun (2012)results withαg = 1.02, logkg = −24.10 and logNg = 21.87.
Fig. 7 indicates that thefH I(N, z) evolves with redshift. Thereis a tendency for a flattening of the distribution function inthesub-DLA regime at lower redshift, indicating that the numberof sub-DLAs is larger at higher redshift. This evolution of sub-DLAs might be due to the merging history of absorbers or theionization of the systems with time.
5.3.2. Comparison with other studies
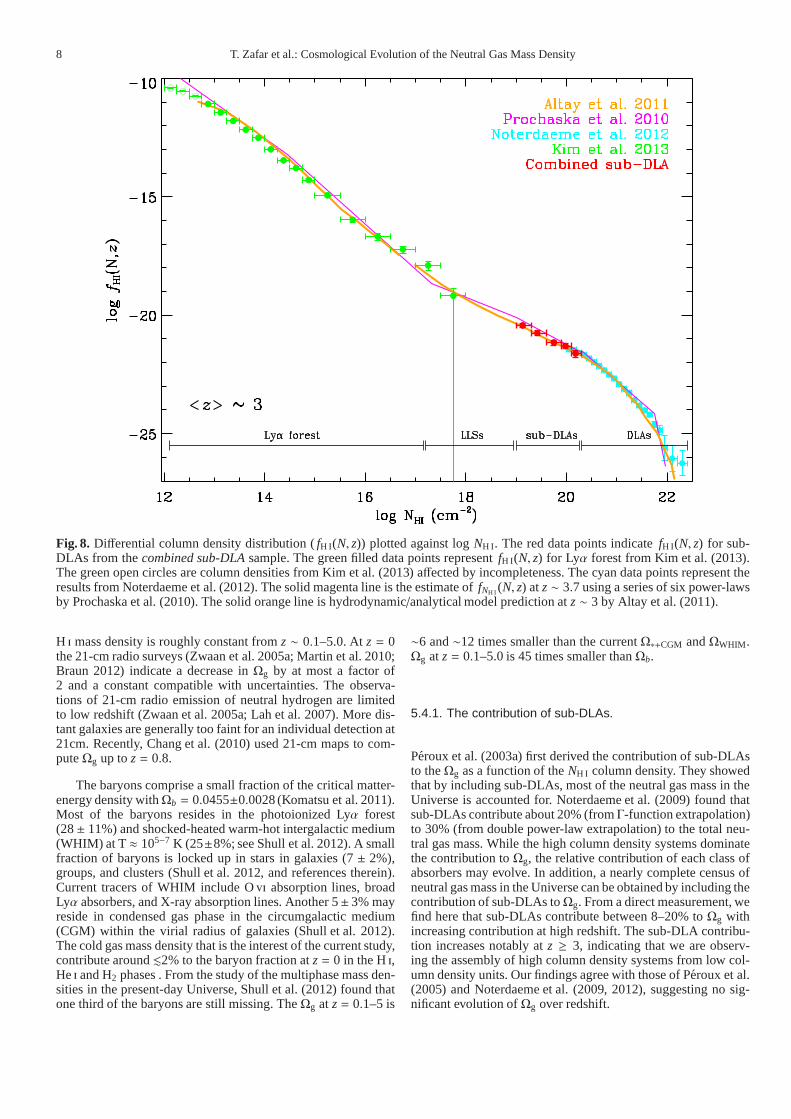
We combined our study with previous studies to place con-straints on thefH I(N, z) over ten orders of magnitude inNH I .In Fig. 8, we show the column density distribution at〈z〉 ∼ 3. Inthe DLA regime, the results come from Noterdaeme et al. (2012)
T. Zafar et al.: Cosmological Evolution of the Neutral Gas Mass Density 7
Fig. 7. Middle and right panels: The differential column density distribution for two redshift ranges. The horizontal error bars arethe bin sizes and the vertical error bars represent the Poissonian statistical errors on the column density distribution. The bins in redcorrespond to thecombined sub-DLA sample results and bins in black correspond to the Peroux etal. (2003b) results. The blackdashed and solid lines represent theΓ-function fit to the fH I(N, z) in 3.1< z < 5.0 and 1.51< z < 3.0 redshift bins, respectively.Left Panel: fH I(N, z) atz = 0 from Braun (2012, gray open triangles) and Zwaan et al. (2005b, gray filled circles). Open gray circlescorrespond to the measurements below the sensitivity limitof Zwaan et al. (2005b). The gray triple dot-dashed and dot-dashed lineis Γ-function fit to Braun (2012) and Zwaan et al. (2005b) data, respectively, above their sensitivity limit.
and Peroux et al. (2003b). In the sub-DLA regime, the analysiscomes from thecombined sub-DLA sample. In the Lyα forestand LLS regimes, the results come from Kim et al. (2013), whoused UVES observations of 18 quasar spectra at 1.9< z < 3.2.As can be seen in Fig. 8, there is a turnover in the distributionfunction at logNH I < 12.7 that is caused by the incomplete-ness of the sample at these column densities. The complete LLSregime remains uncategorized because the column densitiesarein the logarithmic part of the curve-of-growth.
In Fig. 8 a prediction from the hydrodynamical/analyticalmodel of Altay et al. (2011), treating self-shielding and forma-tion of molecular hydrogen in post-processing, is also plotted.Their low NH I is obtained by fitting mock spectra with VPFITand their highNH I by projecting the simulation box onto aplane. A gap between low and highNH I can also be clearlyseen in Fig. 8. The Altay et al. (2011) model provides a rea-sonable representation of the data down to Lyα forest range atz ∼ 3 (see also van de Voort et al. 2012; Rahmati et al. 2013a;Rahmati et al. 2013b).
5.4. Neutral gas mass density
The cosmological mass density of neutral gas,Ωg, observed inhigh-redshift quasar absorbers is expressed as a fraction of thecurrent critical density (see Lanzetta et al. 1995):
Ωg(z) =µmHH0
cρcrit
∫ Nmax
Nmin
NH I fH I(N, z)dN, (9)
wherefH I(N, z) is theNH I frequency distribution,mH is the massof the hydrogen atom,ρcric is the current critical mass densitygiven asρcric = 3H2
0/8πG, andµ = 1.3 is the mean molecularmass of the gas used to incorporate helium as well as hydrogenin the estimate of the neutral gas density. No correction wasap-plied for missing sub-DLAs because of dust (Pontzen & Pettini
2009). SettingNmin = 1 × 10¹⁹ andNmax = 2 × 10²⁰ gives themass density of neutral gas for sub-DLAs,Ωsub−DLA , and settingNmin = 2× 10²⁰ andNmax = ∞ gives the mass density of neutralgas for DLAs,ΩDLA . It is worth mentioning thatfH I(N, z) steep-ens in the Lyα forest regime (see Fig. 8). A significant fraction ofgas is photoionized at these column densities, therefore, the Lyαforest contributes less than one percent toΩg (Kim et al. 2013).In the discrete limit,Ωg is given by
Ωg =µmHH0
cρcrit
∑
NH I
∆X, (10)
where the sum is calculated for sub-DLAs and DLAs along linesof sight with a total absorption path-length∆X. In Table 7 weprovide total gas mass density for this work, including contri-bution from DLAs (Peroux et al. 2003b) and sub-DLAs (com-bined sub-DLA). The total gas mass density, including Hi gasin absorbers up to the canonical sub-DLA definition, is plottedin Fig. 9. The binning for our data was selected with an incre-ment of one half in redshift except for 4< z < 5 because oflow number statistics. Vertical error bars correspond to 1σ un-certainties and the horizontal error bars indicate bin sizes. It isa difficult task to measureΩg at intermediate and low redshifts.For comparison, the Hi mass density measured from radio ob-servations of local galaxies using 21-cm emission is plotted inFig. 9 (triangles atz = 0). These observations come from theWesterbork Hi survey of spiral and irregular galaxies (WHISP)project (Zwaan et al. 2005a), the 40% of the Arecibo legacy fastALFA (ALFALFA) aurvey (Martin et al. 2010), and M31, M33,and the LMC (Braun 2012). The measurement atz = 0.24 comesfrom the radio observations of star-forming galaxies (Lah et al.2007). Rao et al. (2006) searched for the Lyα absorption asso-ciated to Mgii systems to measureΩg at 0.1 < z < 1.7. Theirresults and the measurements from the radio survey of Lah et al.(2007) are consistent with high-redshift findings, indicating that
8 T. Zafar et al.: Cosmological Evolution of the Neutral Gas Mass Density
Fig. 8. Differential column density distribution (fH I(N, z)) plotted against logNH I. The red data points indicatefH I(N, z) for sub-DLAs from thecombined sub-DLA sample. The green filled data points representfH I(N, z) for Lyα forest from Kim et al. (2013).The green open circles are column densities from Kim et al. (2013) affected by incompleteness. The cyan data points represent theresults from Noterdaeme et al. (2012). The solid magenta line is the estimate offNH I (N, z) atz ∼ 3.7 using a series of six power-lawsby Prochaska et al. (2010). The solid orange line is hydrodynamic/analytical model prediction atz ∼ 3 by Altay et al. (2011).
H i mass density is roughly constant fromz ∼ 0.1–5.0. Atz = 0the 21-cm radio surveys (Zwaan et al. 2005a; Martin et al. 2010;Braun 2012) indicate a decrease inΩg by at most a factor of2 and a constant compatible with uncertainties. The observa-tions of 21-cm radio emission of neutral hydrogen are limitedto low redshift (Zwaan et al. 2005a; Lah et al. 2007). More dis-tant galaxies are generally too faint for an individual detection at21cm. Recently, Chang et al. (2010) used 21-cm maps to com-puteΩg up toz = 0.8.
The baryons comprise a small fraction of the critical matter-energy density withΩb = 0.0455±0.0028 (Komatsu et al. 2011).Most of the baryons resides in the photoionized Lyα forest(28± 11%) and shocked-heated warm-hot intergalactic medium(WHIM) at T ≈ 105−7 K (25±8%; see Shull et al. 2012). A smallfraction of baryons is locked up in stars in galaxies (7± 2%),groups, and clusters (Shull et al. 2012, and references therein).Current tracers of WHIM include Ovi absorption lines, broadLyα absorbers, and X-ray absorption lines. Another 5± 3% mayreside in condensed gas phase in the circumgalactic medium(CGM) within the virial radius of galaxies (Shull et al. 2012).The cold gas mass density that is the interest of the current study,contribute around.2% to the baryon fraction atz = 0 in the Hi,Hei and H2 phases . From the study of the multiphase mass den-sities in the present-day Universe, Shull et al. (2012) found thatone third of the baryons are still missing. TheΩg at z = 0.1–5 is
∼6 and∼12 times smaller than the currentΩ∗+CGM andΩWHIM .Ωg at z = 0.1–5.0 is 45 times smaller thanΩb.
5.4.1. The contribution of sub-DLAs.
Peroux et al. (2003a) first derived the contribution of sub-DLAsto theΩg as a function of theNH I column density. They showedthat by including sub-DLAs, most of the neutral gas mass in theUniverse is accounted for. Noterdaeme et al. (2009) found thatsub-DLAs contribute about 20% (fromΓ-function extrapolation)to 30% (from double power-law extrapolation) to the total neu-tral gas mass. While the high column density systems dominatethe contribution toΩg, the relative contribution of each class ofabsorbers may evolve. In addition, a nearly complete censusofneutral gas mass in the Universe can be obtained by includingthecontribution of sub-DLAs toΩg. From a direct measurement, wefind here that sub-DLAs contribute between 8–20% toΩg withincreasing contribution at high redshift. The sub-DLA contribu-tion increases notably atz ≥ 3, indicating that we are observ-ing the assembly of high column density systems from low col-umn density units. Our findings agree with those of Peroux etal.(2005) and Noterdaeme et al. (2009, 2012), suggesting no sig-nificant evolution ofΩg over redshift.

T. Zafar et al.: Cosmological Evolution of the Neutral Gas Mass Density 9
Table 7. Redshift distribution of the neutral gas mass density,Ωg, in DLAs from Peroux et al. (2003b) andcombined sub-DLAsample expressed as a function of the current critical density. The total amount of Hi gas from DLAs+ sub-DLAs is given inboldface. In the last column, we provide the Himass density for DLA+ sub-DLA.
log NH I range logNH I > 20.3 19.0< log NH I < 20.3 TotalΩDLA # Ωsub−DLA # Ωg ρg × 108
z range 〈z〉 dz dX ×10−3 DLAs 〈z〉 dz dX ×10−3 sub-DLAs ×10−3 M⊙ Mpc−3
1.51–2.00 1.84 95.6 279.4 0.83± 0.24 21 1.80 29.9 87.3 0.07± 0.03 4 0.90± 0.20 1.23± 0.332.00–2.50 2.27 125.1 396.6 0.90± 0.28 26 2.26 49.2 156.8 0.09± 0.03 11 0.99± 0.29 1.35± 0.382.50–3.00 2.73 87.2 301.0 0.96± 0.28 18 2.76 47.1 162.8 0.17± 0.04 24 1.13± 0.28 1.54± 0.383.00–3.50 3.25 64.8 239.6 1.00± 0.28 18 3.21 33.7 124.5 0.16± 0.05 23 1.16± 0.29 1.58± 0.393.50–4.00 3.77 49.5 194.6 0.75± 0.21 19 3.72 23.3 91.7 0.18± 0.05 19 1.03± 0.21 1.40± 0.294.00–5.00 4.20 23.2 95.6 0.76± 0.25 10 4.18 9.9 41.0 0.20± 0.09 8 0.96± 0.25 1.31± 0.36
Fig. 9. Redshift evolution of the neutral gas mass density,Ωg. The black bins correspond toΩg measured from DLAs(Peroux et al. 2003b) plus sub-DLAs (combined sub-DLA) con-tribution. The gray bins show the DLA contribution to theΩgfrom Peroux et al. (2003b) in the same redshift bins. The tri-angles atz = 0 represent theΩg measured in local galaxiesby Zwaan et al. (2005a, cyan), Martin et al. (2010, orange), andBraun (2012, magenta), respectively. The open purple star at z=0.24 illustrates the Hi content measured from the star-forminggalaxies by Lah et al. (2007). The blue squares atz < 2 repre-sent the Hi measured from Mgii selected DLAs by Rao et al.(2006). The red bins correspond to theΩg measured from SDSSby Noterdaeme et al. (2012).
5.4.2. Interpretation of the non evolution of Ωg
Previously, an evolution ofΩg was expected over cosmictime due to the consumption of neutral gas by star-formationactivity. The evolution is also expected because energy isreleased during the hierarchical build-up of systems fromsubsystems (e.g., Ledoux et al. 1998) and/or ejection of gasthrough galactic winds from the central parts of massive ha-los into the IGM (Fall & Pei 1993). Prochaska et al. (2005) andProchaska & Wolfe (2009) observed a significant decrease in Hi
mass betweenz = 2–4 from the SDSS surveys. They attributedit to the consumption of neutral gas by star formation activ-ity and/or ejection of gas into the IGM through galactic winds.Zwaan et al. (2008) and Tescari et al. (2009) debated the impor-tance of galactic winds for the evolution ofΩg.
In recent years, new observations have considerablychanged the genetal picture of the observable baryons inthe Universe (e.g, Cole et al. 2001; Fukugita & Peebles 2004;
Fig. 10. Top panel: Total dust-corrected UV-derived SFR den-sity as a function of lookback time from the visible multiobject-spectrograph (VIMOS)-VLT deep survey (VVDS) Deep+ Ultra-Deep sample from Cucciati et al. (2012) is illustrated asblack open circles. The red curve corresponds to the best-fittingparametric form to the SFR density from Hopkins & Beacom(2006). Bottom panel: The data points have the same mean-ing as in Fig. 9. The green curves represent the prediction ofρH I from Nagamine et al. (2004, green triple dot-dashed line),Tescari et al. (2009, green solid line), and Lagos et al. (2011,green dashed line). The gray curves correspond to the predic-tion of ρH2 from Bauermeister et al. (2010, solid gray line) andLagos et al. (2011, gray dashed line). The solid red line illus-trates the evolution of the stellar mass density build-up inferredfrom the star formation history by Hopkins & Beacom (2006).
Danforth & Shull 2008; Shull et al. 2012; Noterdaeme et al.2012). The Hi clouds form molecules, and the molecular cloudsthen cool, fragment, and initiate star formation in galaxies.Therefore DLAs provide the reservoir of neutral gas and serveas a barometer of recent starformation activity. The neutral gasmass densityρg = Ωgρcrit (whereρcrit = 2.78 × 10¹¹ h2 M⊙Mpc−3) has been measured over most of the age of the Universe(lookback time of about 12 Gyr). The space density of Hi ap-pears to evolve surprisingly little fromz = 0.1–5.0. In contrast,the space density of the starformation rate (SFR) in galaxiessteadily increases towardz ≃ 2 by almost an order of magni-tude (e.g, Cucciati et al. 2012). Given the SFR density, it isex-

10 T. Zafar et al.: Cosmological Evolution of the Neutral GasMass Density
pected that Hi plus H2 gas at high-redshift would be exhaustedon timescales of a few Gyr. Fig. 10 indicates that there is no evo-lution of ρH I over a lookback time of 1.3–12.3 Gyr. This sug-gests that SFR, ionization of neutral gas, and/or the formation ofmolecular hydrogen alone cannot explain the non-evolutionofthe Hi space density.
Several surveys have been conducted to study inflowsand outflows in distant galaxies via UV absorption lines.Outflows are ubiquitous in almost all distant star-forming galax-ies (Weiner et al. 2009; Rubin et al. 2010; Steidel et al. 2010;Kacprzak et al. 2011; Bordoloi et al. 2011) and their rates ares-imilar to or higher than the SFR (e.g., Kornei et al. 2012).Recently, cool gas inflows have been detected in a few galax-ies, although with an inflow rate lower than the SFR (Sato et al.2009; Giavalisco et al. 2011; Rubin et al. 2012; Martin et al.2012). Because the outflow rates are generally found to be higherthan the SFR, a constant Hi space density as we observe seemsto indicate a higher accretion on average than observed in thequoted observations.
Introducing a continuous replenishment of gas the accountfor an appropriate evolution of outflows and gas replenishmentrates, i.e., accretion of gas from filaments and streams to thecenters of cold dark matter halos, can possibly help in resolv-ing the puzzle of the non-evolution of the space density of Hi(Hopkins et al. 2008). Hydrodynamical simulation indicatethatH i gas might be replenished by accretion of matter from theIGM and/or recombination of ionized gas in the walls of super-shells (Keres et al. 2005; Birnboim et al. 2007; Erb 2008).
6. Conclusions
We here presented a statistical sample of 122 quasars (1.5< zem< 5.0) observed with the VLT/UVES. The statistical propertiesof 27 sub-DLAs along the lines of sight of these quasars were an-alyzed in combination with the sub-DLA studies of Peroux etal.(2003a, 2005) and O’Meara et al. (2007). Our main findings aresummarized as follows:
– Thecombined sub-DLA sample allows one to determine theredshift evolution of the number density and line density.Comparing these with DLAs and LLSs results from the liter-ature, we found that all three classes of absorbers are evolv-ing in the redshift range 1< z < 5 in the same way.
– The shape of the column density distribution function downto log NH I = 19.0 was determined. The redshift evolution offH I(N, z) was also presented for two redshift bins 1.5< z <3.1 and 3.1< z < 5.0. The shape offH I(N, z) at high-redshiftin the sub-DLA range is steeper, indicating that there aremore sub-DLAs at high-redshift than at low-redshift. Thisevolution suggests that sub-DLAs may merge and/or ionizeover cosmic time.
– We furthermore usedfH I(N, z) to determine the total Hi gasmass in the Universe at 1.5 < z < 5.0. The complete sampleshows that sub-DLAs are significant at all redshifts and theircontribution toΩg increases from 8–20% with an increasingfraction at higher redshift.
– From 0.1< z < 5.0 no-evolution of Ωg was found. In con-trast, star formation peaks atz ∼ 2.1. This indicates that starformation aline cannot explain the non-evolution ofΩg. Thismay suggest that replenishment of gas through accretion ofmatter from filaments and/or recombination of ionized gasin the walls of supershells may help in sustainingΩg as aconstant over cosmic time (Hopkins et al. 2008).
7. Acknowledgments
This work has been funded within the BINGO! (‘history ofBaryons: INtergalactic medium/Galaxies cO-evolution’) projectby the Agence Nationale de la Recherche (ANR) under the allo-cation ANR-08-BLAN-0316-01. We are thankful to the anony-mous referee for his/her constructive comments. We would liketo thank the ESO staff for making the UVES Advanced DataProducts available to the community.
ReferencesAltay, G., Theuns, T., Schaye, J., Crighton, N. H. M., & DallaVecchia, C. 2011,
ApJ, 737, L37Bahcall, J. N. & Peebles, P. J. E. 1969, ApJ, 156, L7Bauermeister, A., Blitz, L., & Ma, C.-P. 2010, ApJ, 717, 323Birnboim, Y., Dekel, A., & Neistein, E. 2007, MNRAS, 380, 339Bordoloi, R., Lilly, S. J., Knobel, C., et al. 2011, ApJ, 743,10Braun, R. 2012, ApJ, 749, 87Carswell, R. F., Webb, J. K., Lanzetta, K. M., et al. 1996, MNRAS, 278, 506Chang, T.-C., Pen, U.-L., Bandura, K., & Peterson, J. B. 2010, Nature, 466, 463Cole, S., Norberg, P., Baugh, C. M., et al. 2001, MNRAS, 326, 255Coppolani, F., Petitjean, P., Stoehr, F., et al. 2006, MNRAS, 370, 1804Cucciati, O., Tresse, L., Ilbert, O., et al. 2012, A&A, 539, A31Danforth, C. W. & Shull, J. M. 2008, ApJ, 679, 194Dekker, H., D’Odorico, S., Kaufer, A., Delabre, B., & Kotzlowski, H. 2000, in
SPIE Conference Series, Vol. 4008, Society of Photo-Optical InstrumentationEngineers (SPIE) Conference Series, ed. M. Iye & A. F. Moorwood, 534–545
Dessauges-Zavadsky, M., Ellison, S. L., & Murphy, M. T. 2009, MNRAS, 396,L61
Dessauges-Zavadsky, M., Peroux, C., Kim, T.-S., D’Odorico, S., & McMahon,R. G. 2003, MNRAS, 345, 447
D’Odorico, V., Petitjean, P., & Cristiani, S. 2002, A&A, 390, 13Ellison, S. L. & Lopez, S. 2009, MNRAS, 397, 467Ellison, S. L., Pettini, M., Steidel, C. C., & Shapley, A. E. 2001a, ApJ, 549, 770Ellison, S. L., Yan, L., Hook, I. M., et al. 2001b, A&A, 379, 393Erb, D. K. 2008, ApJ, 674, 151Erkal, D., Gnedin, N. Y., & Kravtsov, A. V. 2012, ApJ, 761, 54Fall, S. M. & Pei, Y. C. 1993, ApJ, 402, 479Fontana, A. & Ballester, P. 1995, The Messenger, 80, 37Fox, A. J., Ledoux, C., Petitjean, P., Srianand, R., & Guimaraes, R. 2011, A&A,
534, A82Fox, A. J., Prochaska, J. X., Ledoux, C., et al. 2009, A&A, 503, 731Fukugita, M. & Peebles, P. J. E. 2004, ApJ, 616, 643Giavalisco, M., Vanzella, E., Salimbeni, S., et al. 2011, ApJ, 743, 95Guimaraes, R., Petitjean, P., de Carvalho, R. R., et al. 2009, A&A, 508, 133Herbert-Fort, S., Prochaska, J. X., Dessauges-Zavadsky, M., et al. 2006, PASP,
118, 1077Hopkins, A. M. & Beacom, J. F. 2006, ApJ, 651, 142Hopkins, A. M., McClure-Griffiths, N. M., & Gaensler, B. M. 2008, ApJ, 682,
L13Ivanchik, A. V., Petitjean, P., Balashev, S. A., et al. 2010,MNRAS, 404, 1583Kacprzak, G. G., Churchill, C. W., Evans, J. L., Murphy, M. T., & Steidel, C. C.
2011, MNRAS, 416, 3118Kanekar, N., Smette, A., Briggs, F. H., & Chengalur, J. N. 2009, ApJ, 705, L40Kaplan, K. F., Prochaska, J. X., Herbert-Fort, S., Ellison,S. L., & Dessauges-
Zavadsky, M. 2010, PASP, 122, 619Katz, N., Weinberg, D. H., Hernquist, L., & Miralda-Escude,J. 1996, ApJ, 457,
L57Keres, D., Katz, N., Weinberg, D. H., & Dave, R. 2005, MNRAS, 363, 2Kim, T.-S., Partl, A. M., Carswell, R. F., & Muller, V. 2013,ArXiv e-printsKlypin, A., Borgani, S., Holtzman, J., & Primack, J. 1995, ApJ, 444, 1Komatsu, E., Smith, K. M., Dunkley, J., et al. 2011, ApJS, 192, 18Kornei, K. A., Shapley, A. E., Martin, C. L., et al. 2012, ApJ,758, 135Krumholz, M. R., Ellison, S. L., Prochaska, J. X., & Tumlinson, J. 2009, ApJ,
701, L12Lagos, C. D. P., Baugh, C. M., Lacey, C. G., et al. 2011, MNRAS,418, 1649Lah, P., Chengalur, J. N., Briggs, F. H., et al. 2007, MNRAS, 376, 1357Lanzetta, K. M., Wolfe, A. M., & Turnshek, D. A. 1995, ApJ, 440, 435Le Brun, V., Bergeron, J., Boisse, P., & Deharveng, J. M. 1997, A&A, 321, 733Ledoux, C., Bergeron, J., & Petitjean, P. 2002, A&A, 385, 802Ledoux, C., Petitjean, P., Bergeron, J., Wampler, E. J., & Srianand, R. 1998,
A&A, 337, 51Ledoux, C., Petitjean, P., Fynbo, J. P. U., Møller, P., & Srianand, R. 2006, A&A,
457, 71Ledoux, C., Petitjean, P., & Srianand, R. 2003, MNRAS, 346, 209
T. Zafar et al.: Cosmological Evolution of the Neutral Gas Mass Density 11
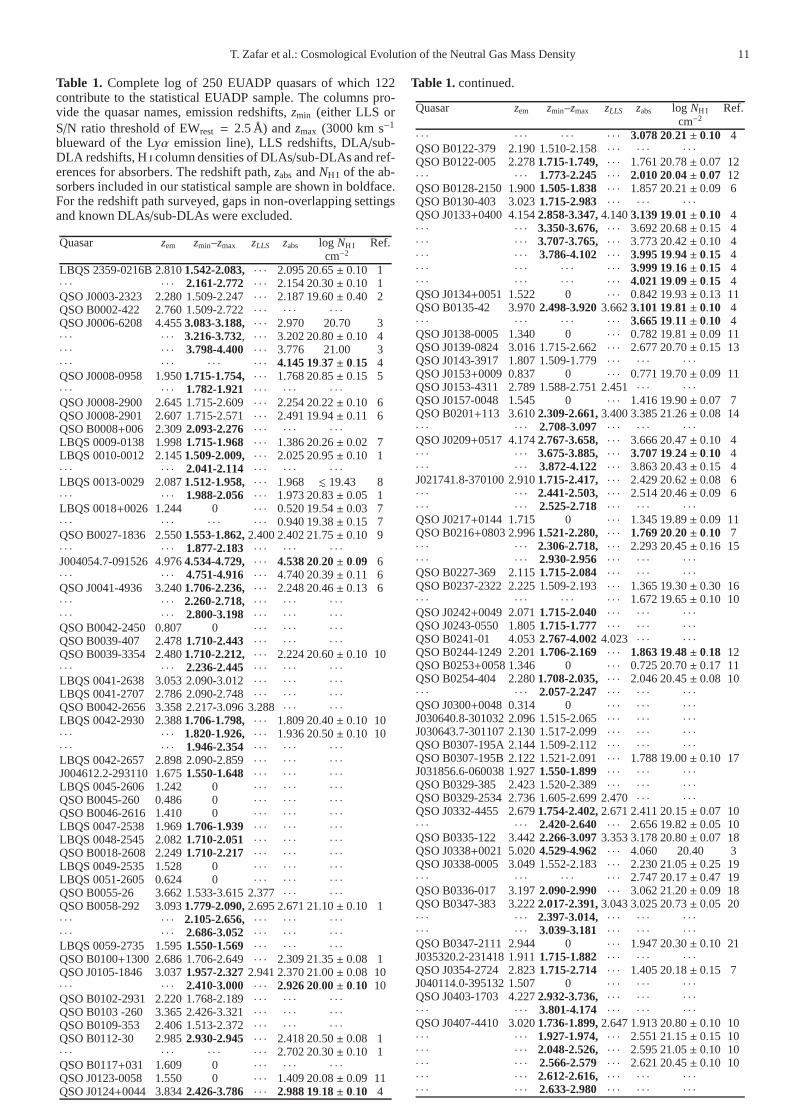
Table 1. Complete log of 250 EUADP quasars of which 122contribute to the statistical EUADP sample. The columns pro-vide the quasar names, emission redshifts,zmin (either LLS orS/N ratio threshold of EWrest = 2.5 Å) andzmax (3000 km s−1
blueward of the Lyα emission line), LLS redshifts, DLA/sub-DLA redshifts, Hi column densities of DLAs/sub-DLAs and ref-erences for absorbers. The redshift path,zabs andNH I of the ab-sorbers included in our statistical sample are shown in boldface.For the redshift path surveyed, gaps in non-overlapping settingsand known DLAs/sub-DLAs were excluded.
Quasar zem zmin–zmax zLLS zabs log NH I Ref.cm−2
LBQS 2359-0216B 2.8101.542-2.083, · · · 2.095 20.65± 0.10 1· · · · · · 2.161-2.772 · · · 2.154 20.30± 0.10 1QSO J0003-2323 2.280 1.509-2.247· · · 2.187 19.60± 0.40 2QSO B0002-422 2.760 1.509-2.722· · · · · · · · ·
QSO J0006-6208 4.4553.083-3.188, · · · 2.970 20.70 3· · · · · · 3.216-3.732, · · · 3.202 20.80± 0.10 4· · · · · · 3.798-4.400 · · · 3.776 21.00 3· · · · · · · · · · · · 4.145 19.37± 0.15 4QSO J0008-0958 1.9501.715-1.754, · · · 1.768 20.85± 0.15 5· · · · · · 1.782-1.921 · · · · · · · · ·
QSO J0008-2900 2.645 1.715-2.609· · · 2.254 20.22± 0.10 6QSO J0008-2901 2.607 1.715-2.571· · · 2.491 19.94± 0.11 6QSO B0008+006 2.3092.093-2.276 · · · · · · · · ·
LBQS 0009-0138 1.9981.715-1.968 · · · 1.386 20.26± 0.02 7LBQS 0010-0012 2.1451.509-2.009, · · · 2.025 20.95± 0.10 1· · · · · · 2.041-2.114 · · · · · · · · ·
LBQS 0013-0029 2.0871.512-1.958, · · · 1.968 . 19.43 8· · · · · · 1.988-2.056 · · · 1.973 20.83± 0.05 1LBQS 0018+0026 1.244 0 · · · 0.520 19.54± 0.03 7· · · · · · · · · · · · 0.940 19.38± 0.15 7QSO B0027-1836 2.5501.553-1.862,2.400 2.402 21.75± 0.10 9· · · · · · 1.877-2.183 · · · · · · · · ·
J004054.7-091526 4.9764.534-4.729, · · · 4.538 20.20± 0.09 6· · · · · · 4.751-4.916 · · · 4.740 20.39± 0.11 6QSO J0041-4936 3.2401.706-2.236, · · · 2.248 20.46± 0.13 6· · · · · · 2.260-2.718, · · · · · · · · ·
· · · · · · 2.800-3.198 · · · · · · · · ·
QSO B0042-2450 0.807 0 · · · · · · · · ·
QSO B0039-407 2.4781.710-2.443 · · · · · · · · ·
QSO B0039-3354 2.4801.710-2.212, · · · 2.224 20.60± 0.10 10· · · · · · 2.236-2.445 · · · · · · · · ·
LBQS 0041-2638 3.053 2.090-3.012· · · · · · · · ·
LBQS 0041-2707 2.786 2.090-2.748· · · · · · · · ·
QSO B0042-2656 3.358 2.217-3.096 3.288· · · · · ·
LBQS 0042-2930 2.3881.706-1.798, · · · 1.809 20.40± 0.10 10· · · · · · 1.820-1.926, · · · 1.936 20.50± 0.10 10· · · · · · 1.946-2.354 · · · · · · · · ·
LBQS 0042-2657 2.898 2.090-2.859· · · · · · · · ·
J004612.2-293110 1.6751.550-1.648 · · · · · · · · ·
LBQS 0045-2606 1.242 0 · · · · · · · · ·
QSO B0045-260 0.486 0 · · · · · · · · ·
QSO B0046-2616 1.410 0 · · · · · · · · ·
LBQS 0047-2538 1.9691.706-1.939 · · · · · · · · ·
LBQS 0048-2545 2.0821.710-2.051 · · · · · · · · ·
QSO B0018-2608 2.2491.710-2.217 · · · · · · · · ·
LBQS 0049-2535 1.528 0 · · · · · · · · ·
LBQS 0051-2605 0.624 0 · · · · · · · · ·
QSO B0055-26 3.662 1.533-3.615 2.377· · · · · ·
QSO B0058-292 3.0931.779-2.090,2.695 2.671 21.10± 0.10 1· · · · · · 2.105-2.656, · · · · · · · · ·
· · · · · · 2.686-3.052 · · · · · · · · ·
LBQS 0059-2735 1.5951.550-1.569 · · · · · · · · ·
QSO B0100+1300 2.686 1.706-2.649· · · 2.309 21.35± 0.08 1QSO J0105-1846 3.0371.957-2.3272.941 2.370 21.00± 0.08 10· · · · · · 2.410-3.000 · · · 2.926 20.00± 0.10 10QSO B0102-2931 2.220 1.768-2.189· · · · · · · · ·
QSO B0103 -260 3.365 2.426-3.321· · · · · · · · ·
QSO B0109-353 2.406 1.513-2.372· · · · · · · · ·
QSO B0112-30 2.9852.930-2.945 · · · 2.418 20.50± 0.08 1· · · · · · · · · · · · 2.702 20.30± 0.10 1QSO B0117+031 1.609 0 · · · · · · · · ·
QSO J0123-0058 1.550 0 · · · 1.409 20.08± 0.09 11QSO J0124+0044 3.8342.426-3.786 · · · 2.988 19.18± 0.10 4
Table 1.continued.
Quasar zem zmin–zmax zLLS zabs log NH I Ref.cm−2
· · · · · · · · · · · · 3.078 20.21± 0.10 4QSO B0122-379 2.190 1.510-2.158· · · · · · · · ·
QSO B0122-005 2.2781.715-1.749, · · · 1.761 20.78± 0.07 12· · · · · · 1.773-2.245 · · · 2.010 20.04± 0.07 12QSO B0128-2150 1.9001.505-1.838 · · · 1.857 20.21± 0.09 6QSO B0130-403 3.0231.715-2.983 · · · · · · · · ·
QSO J0133+0400 4.1542.858-3.347,4.1403.139 19.01± 0.10 4· · · · · · 3.350-3.676, · · · 3.692 20.68± 0.15 4· · · · · · 3.707-3.765, · · · 3.773 20.42± 0.10 4· · · · · · 3.786-4.102 · · · 3.995 19.94± 0.15 4· · · · · · · · · · · · 3.999 19.16± 0.15 4· · · · · · · · · · · · 4.021 19.09± 0.15 4QSO J0134+0051 1.522 0 · · · 0.842 19.93± 0.13 11QSO B0135-42 3.9702.498-3.9203.6623.101 19.81± 0.10 4· · · · · · · · · · · · 3.665 19.11± 0.10 4QSO J0138-0005 1.340 0 · · · 0.782 19.81± 0.09 11QSO J0139-0824 3.016 1.715-2.662· · · 2.677 20.70± 0.15 13QSO J0143-3917 1.807 1.509-1.779· · · · · · · · ·
QSO J0153+0009 0.837 0 · · · 0.771 19.70± 0.09 11QSO J0153-4311 2.789 1.588-2.751 2.451· · · · · ·
QSO J0157-0048 1.545 0 · · · 1.416 19.90± 0.07 7QSO B0201+113 3.6102.309-2.661,3.400 3.385 21.26± 0.08 14· · · · · · 2.708-3.097 · · · · · · · · ·
QSO J0209+0517 4.1742.767-3.658, · · · 3.666 20.47± 0.10 4· · · · · · 3.675-3.885, · · · 3.707 19.24± 0.10 4· · · · · · 3.872-4.122 · · · 3.863 20.43± 0.15 4J021741.8-370100 2.9101.715-2.417, · · · 2.429 20.62± 0.08 6· · · · · · 2.441-2.503, · · · 2.514 20.46± 0.09 6· · · · · · 2.525-2.718 · · · · · · · · ·
QSO J0217+0144 1.715 0 · · · 1.345 19.89± 0.09 11QSO B0216+0803 2.9961.521-2.280, · · · 1.769 20.20± 0.10 7· · · · · · 2.306-2.718, · · · 2.293 20.45± 0.16 15· · · · · · 2.930-2.956 · · · · · · · · ·
QSO B0227-369 2.1151.715-2.084 · · · · · · · · ·
QSO B0237-2322 2.225 1.509-2.193· · · 1.365 19.30± 0.30 16· · · · · · · · · · · · 1.672 19.65± 0.10 10QSO J0242+0049 2.0711.715-2.040 · · · · · · · · ·
QSO J0243-0550 1.8051.715-1.777 · · · · · · · · ·
QSO B0241-01 4.0532.767-4.0024.023 · · · · · ·
QSO B0244-1249 2.2011.706-2.169 · · · 1.863 19.48± 0.18 12QSO B0253+0058 1.346 0 · · · 0.725 20.70± 0.17 11QSO B0254-404 2.2801.708-2.035, · · · 2.046 20.45± 0.08 10· · · · · · 2.057-2.247 · · · · · · · · ·
QSO J0300+0048 0.314 0 · · · · · · · · ·
J030640.8-301032 2.096 1.515-2.065· · · · · · · · ·
J030643.7-301107 2.130 1.517-2.099· · · · · · · · ·
QSO B0307-195A 2.144 1.509-2.112· · · · · · · · ·
QSO B0307-195B 2.122 1.521-2.091· · · 1.788 19.00± 0.10 17J031856.6-060038 1.9271.550-1.899 · · · · · · · · ·
QSO B0329-385 2.423 1.520-2.389· · · · · · · · ·
QSO B0329-2534 2.736 1.605-2.699 2.470· · · · · ·
QSO J0332-4455 2.6791.754-2.402,2.671 2.411 20.15± 0.07 10· · · · · · 2.420-2.640 · · · 2.656 19.82± 0.05 10QSO B0335-122 3.4422.266-3.0973.353 3.178 20.80± 0.07 18QSO J0338+0021 5.0204.529-4.962 · · · 4.060 20.40 3QSO J0338-0005 3.049 1.552-2.183· · · 2.230 21.05± 0.25 19· · · · · · · · · · · · 2.747 20.17± 0.47 19QSO B0336-017 3.1972.090-2.990 · · · 3.062 21.20± 0.09 18QSO B0347-383 3.2222.017-2.391,3.043 3.025 20.73± 0.05 20· · · · · · 2.397-3.014, · · · · · · · · ·
· · · · · · 3.039-3.181 · · · · · · · · ·
QSO B0347-2111 2.944 0 · · · 1.947 20.30± 0.10 21J035320.2-231418 1.9111.715-1.882 · · · · · · · · ·
QSO J0354-2724 2.8231.715-2.714 · · · 1.405 20.18± 0.15 7J040114.0-395132 1.507 0 · · · · · · · · ·
QSO J0403-1703 4.2272.932-3.736, · · · · · · · · ·
· · · · · · 3.801-4.174 · · · · · · · · ·
QSO J0407-4410 3.0201.736-1.899,2.647 1.913 20.80± 0.10 10· · · · · · 1.927-1.974, · · · 2.551 21.15± 0.15 10· · · · · · 2.048-2.526, · · · 2.595 21.05± 0.10 10· · · · · · 2.566-2.579 · · · 2.621 20.45± 0.10 10· · · · · · 2.612-2.616, · · · · · · · · ·
· · · · · · 2.633-2.980 · · · · · · · · ·

12 T. Zafar et al.: Cosmological Evolution of the Neutral GasMass Density
Table 1.continued.
Quasar zem zmin–zmax zLLS zabs log NH I Ref.cm−2
QSO J0422-3844 3.123 2.093-3.120 3.115 3.082 19.37± 0.02 22QSO J0427-1302 2.1661.710-2.135 · · · 1.408 19.04± 0.04 7· · · · · · · · · · · · 1.562 19.35± 0.10 23QSO J0430-4855 1.940 1.517-1.911· · · · · · · · ·
QSO B0432-440 2.6491.715-2.283, · · · 2.297 20.78± 0.10 21· · · · · · 2.311-2.613 · · · · · · · · ·
QSO B0438-43 2.8521.551-2.333, · · · 2.347 20.78± 0.12 21· · · · · · 2.361-2.815 · · · · · · · · ·
QSO J0441-4313 0.593 0 · · · · · · · · ·
QSO B0449-1645 2.6791.708-2.643 · · · 1.007 20.98± 0.07 11QSO B0450-1310B 2.2501.517-2.055, · · · 2.067 20.50± 0.07 10· · · · · · 2.079-2.187 · · · · · · · · ·
QSO J0455-4216 2.661 1.514-2.624· · · · · · · · ·
PKS 0454-220 0.534 0 · · · 0.474 19.45± 0.03 114C-02.19 2.286 1.550-2.253· · · 2.040 21.70± 0.10 10QSO B0512-3329 1.569 0 · · · 0.931 20.49± 0.08 24QSO B0515-4414 1.713 1.517-1.686· · · 1.151 19.88± 0.05 25J051939.8-364613 1.349 0 · · · · · · · · ·
QSO B0528-2505 2.7651.889-2.128,2.827 2.141 20.95± 0.05 26· · · · · · 2.154-2.714 · · · 2.811 21.35± 0.07 27QSO J0530+13 2.0701.861-2.039 · · · · · · · · ·
QSO B0551-36 2.3181.517-1.949, · · · 1.962 20.70± 0.08 20· · · · · · 1.975-2.285 · · · · · · · · ·
J060008.1-504036 3.1302.063-2.138,3.080 2.149 20.40± 0.12 6· · · · · · 2.160-3.089 · · · · · · · · ·
QSO B0606-2219 1.9261.750-1.898 · · · · · ·
QSO B0642-5038 3.0901.757-2.644,2.670 2.659 20.95± 0.08 10· · · · · · 2.932-3.050 · · · · · · · · ·
QSO B0736+01 0.191 0 · · · · · · · · ·
QSO B0810+2554 1.510 0 · · · · · · · · ·
QSO B0827+2421 0.939 0 · · · 0.518 20.30± 0.04 11QSO B0841+129 2.4951.707-1.846, · · · 1.864 21.00± 0.10 10· · · · · · 1.881-2.362, · · · 2.375 21.05± 0.10 10· · · · · · 2.387-2.466, · · · 2.476 20.80± 0.10 10· · · · · · · · · · · · 2.506 19.00± 0.15 28QSO 0908+0603 2.793 1.715-2.720· · · · · · · · ·
QSO B0913+0715 2.7851.726-2.608,2.629 2.618 20.35± 0.10 20· · · · · · 2.628-2.747 · · · · · · · · ·
QSO B0919-260 2.2991.715-2.266 · · · · · · · · ·
QSO B0926-0201 1.661 0 · · · · · · · · ·
QSO B0933-333 2.9102.093-2.670 · · · 2.682 20.50± 0.10 20· · · · · · 2.694-2.871 · · · · · · · · ·
QSO B0951-0450 4.3692.936-3.846, · · · 3.235 20.25± 0.10 29· · · · · · 3.870-4.158 · · · 3.858 20.60± 0.10 3· · · · · · · · · · · · 4.203 20.55± 0.10 27QSO B0952+179 1.472 0 · · · 0.238 21.32± 0.05 18QSO B0952-0115 4.426 3.034-4.370 4.203 3.476 20.04± 0.07 6· · · · · · · · · · · · 4.024 20.55± 0.10 26QSO B1005-333 1.8371.731-1.809 · · · · · · · · ·
QSO J1009-0026 1.241 0 · · · 0.840 20.20± 0.06 11· · · · · · · · · · · · 0.880 19.48± 0.08 11LBQS 1026-0045B 1.530 0 · · · 0.632 19.95± 0.07 7· · · · · · · · · · · · 0.709 20.04± 0.06 7QSO B1027+0540 6.311 5.581-6.238· · · · · · · · ·
Q1036-272 3.0902.096-2.779, · · · 2.792 20.65± 0.13 6· · · · · · 2.805-3.050 · · · · · · · · ·
QSO B1036-2257 3.1301.846-2.179,2.7902.533 19.30± 0.10 6· · · · · · 2.194-2.714, · · · 2.777 20.93± 0.05 10· · · · · · 2.793-3.091 · · · · · · · · ·
QSO J1039-2719 2.1931.706-2.132, · · · 2.139 19.90± 0.05 10· · · · · · 2.146-2.163 · · · · · · · · ·
QSO B1038-2712 2.3311.505-2.298 · · · · · · · · ·
QSO B1036-268 2.4601.707-2.425 · · · 2.235 19.96± 0.09 6QSO J1044-0125 5.740 0 · · · · · · · · ·
J104540.7-101813 1.261 0 · · · · · · · · ·
J104642.9+053107 2.682 1.517-2.182· · · · · · · · ·
QSO B1044+059 1.226 0 · · · · · · · · ·
QSO B1044+056 1.306 0 · · · · · · · · ·
QSO B1045+056 1.230 0 · · · 0.951 19.28± 0.02 11QSO B1052-0004 1.021 0 · · · · · · · · ·
QSO B1055-301 2.5231.552-1.885, · · · 1.904 21.54± 0.10 10· · · · · · 1.923-2.488 · · · · · · · · ·
QSO B1101-26 2.145 2.109-2.117· · · 1.838 19.50± 0.05 15
Table 1.continued.
Quasar zem zmin–zmax zLLS zabs log NH I Ref.cm−2
QSO B1104-181 2.319 1.517-2.286· · · 1.661 20.85± 0.01 30QSO J1107+0048 1.392 0 · · · 0.740 21.00± 0.04 11QSO B1108-07 3.9222.619-3.598,3.8243.482 19.95± 0.07 1· · · · · · 3.618-3.874 · · · 3.608 20.37± 0.07 1QSO J1113-1533 3.3702.241-2.574,3.295 3.265 21.30± 0.05 10· · · · · · 2.615-3.248, · · · · · · · · ·
· · · · · · 3.282-3.326 · · · · · · · · ·
QSO B1114-220 2.282 0 · · · · · · · · ·
QSO B1114-0822 4.4953.180-3.734, · · · 4.258 20.02± 0.12 6· · · · · · 3.804-4.246, · · · · · · · · ·
· · · · · · 4.270-4.302 · · · · · · · · ·
QSO B1122-168 2.400 1.706-2.368· · · 0.682 20.45± 0.05 31J112910.9-231628 1.019 0 · · · · · · · · ·
QSO J1142+2654 2.630 2.095-2.594· · · · · · · · ·
QSO B1145-676 0.210 0 · · · · · · · · ·
QSO B1151+068 2.7621.517-1.757, · · · 1.775 21.30± 0.08 24· · · · · · 1.793-2.724 · · · · · · · · ·
J115538.6+053050 3.4752.266-2.597,3.350 2.608 20.37± 0.11 6· · · · · · 2.619-3.258 · · · 3.327 21.00± 0.10 6QSO J1159+1337 3.9842.932-3.736, · · · 3.726 20.00± 0.10 29· · · · · · 3.800-3.935 · · · · · · · · ·
QSO B1158-1842 2.453 1.509-2.418· · · · · · · · ·
QSO B1202-074 4.695 3.129-4.635 4.500 4.383 20.60± 0.14 26J120550.2+020131 2.1341.778-2.102 · · · 1.747 20.40± 0.10 10QSO B1209+0919 3.2922.137-2.563,3.182 2.584 21.40± 0.10 20· · · · · · 2.599-3.251 · · · · · · · · ·
LBQS 1209+1046 2.1931.706-2.161 · · · 0.633 20.30 32LBQS 1210+1731 2.5431.517-1.878, · · · 1.892 20.70± 0.08 10· · · · · · 1.906-2.187 · · · · · · · · ·
QSO J1215+3309 0.616 0 · · · · · · · · ·
QSO B1220-1800 2.1601.698-2.102 · · · 2.112 20.12± 0.07 10· · · · · · 2.122-2.130 · · · · · · · · ·
LBQS 1223+1753 2.9402.044-2.446,2.941 2.466 21.40± 0.10 10· · · · · · 2.488-2.901 · · · 2.557 19.32± 0.15 33QSO B1228-113 3.5281.715-2.180, · · · 2.193 20.60± 0.10 21· · · · · · 2.206-2.718 · · · · · · · · ·
· · · · · · 2.932-3.485 · · · · · · · · ·
QSO B1230-101 2.3941.805-1.919, · · · 1.931 20.48± 0.10 21· · · · · · 1.943-2.361 · · · · · · · · ·
LBQS 1232+0815 2.5701.704-2.327, · · · 1.720 19.48± 0.13 6· · · · · · 2.350-2.535 · · · 2.334 20.90± 0.08 34LBQS 1242+0006 2.0841.706-1.812, · · · 1.824 20.45± 0.10 10· · · · · · 1.836-2.053 · · · · · · · · ·
QSO J1246-0730 1.286 0 · · · · · · · · ·
LBQS 1246-0217 2.1171.842-2.088 · · · 1.781 21.45± 0.15 35J124957.2-015929 3.635 2.414-3.589 3.550· · · · · ·
QSO B1249-02 1.192 0 · · · · · · · · ·
QSO B1256-177 1.9561.789-1.926 · · · · · · · · ·
QSO J1306+0356 5.999 4.511-5.929· · · · · · · · ·
QSO B1317-0507 3.710 1.911-3.663 2.880· · · · · ·
QSO B1318-263 2.0271.715-1.997 · · · · · · · · ·
LBQS 1320-0006 1.388 0 · · · 0.716 20.54± 0.15 11QSO B1324-047 1.8821.706-1.853 · · · · · · · · ·
QSO J1330-2522 3.910 2.547-2.714,· · · 2.654 19.56± 0.13 6· · · · · · 2.932-3.736, · · · 2.910 20.00 3· · · · · · 3.800-3.861 · · · 3.080 19.88± 0.09 3QSO B1331+170 2.0841.517-1.718, · · · 1.776 21.15± 0.07 10· · · · · · 1.801-2.053 · · · · · · · · ·
QSO J1342-1355 3.2122.115-3.0923.152 3.118 20.05± 0.08 10QSO J1344-1035 2.134 1.512-2.103· · · · · · · · ·
QSO B1347-2457 2.578 1.512-2.542· · · · · · · · ·
QSO J1356-1101 3.0062.090-2.493 · · · 2.397 19.85± 0.08 6· · · · · · 2.510-2.924 · · · 2.501 20.44± 0.05 27· · · · · · · · · · · · 2.967 20.80± 0.10 10QSO B1402-012 2.5222.093-2.487 · · · · · · · · ·
QSO B1409+0930 2.8381.761-2.008,2.680 2.019 20.65± 0.10 10· · · · · · 2.030-2.448, · · · 2.456 20.53± 0.08 10· · · · · · 2.463-2.802 · · · 2.668 19.80± 0.08 10QSO B1412-096 2.0011.715-1.971 · · · · · · · · ·
QSO J1421-0643 3.6892.357-3.0963.474 3.448 20.40± 0.10 18QSO B1424-41 1.522 0 · · · · · · · · ·
QSO B1429-008B 2.082 1.739-2.052· · · · · · · · ·
QSO J1439+1117 2.5831.715-2.409, · · · 2.418 20.10± 0.10 36

T. Zafar et al.: Cosmological Evolution of the Neutral Gas Mass Density 13
Table 1.continued.
Quasar zem zmin–zmax zLLS zabs log NH I Ref.cm−2
· · · · · · 2.427-2.547 · · · · · · · · ·
QSO J1443+2724 4.4432.932-3.736, · · · 4.224 20.95± 0.08 27· · · · · · 3.802-4.209, · · · · · · · · ·
· · · · · · 4.242-4.384 · · · · · · · · ·
LBQS 1444+0126 2.2101.710-2.082, · · · 2.087 20.25± 0.07 10· · · · · · 2.091-2.178 · · · · · · · · ·
QSO B1448-232 2.215 1.509-2.184· · · · · · · · ·
J145147.1-151220 4.763 3.103-4.705 4.369· · · · · ·
QSO J1453+0029 1.297 0 · · · · · · · · ·
J151352.52+085555 2.9041.745-2.865 · · · · · · · · ·
QSO J1621-0042 3.700 2.110-3.655 3.138 3.104 19.70± 0.20 374C 12.59 1.7921.517-1.764 · · · 0.531 20.70± 0.09 11· · · · · · · · · · · · 0.900 19.70± 0.04 11QSO J1723+2243 4.5203.072-3.687, · · · 3.697 20.35± 0.10 29· · · · · · 3.707-3.736, · · · 4.155 19.23± 0.12 6· · · · · · 3.802-4.464 · · · · · · · · ·
QSO B1730-130 0.902 0 · · · · · · · · ·
QSO B1741-038 1.054 0 · · · · · · · · ·
QSO B1937-1009 3.787 2.932-3.738· · · · · · · · ·
QSO B1935-692 3.152 2.932-3.110· · · · · · · · ·
QSO B2000-330 3.783 2.422-3.735 3.560 3.172 19.80± 0.25 37· · · · · · · · · · · · 3.188 19.80± 0.15 37· · · · · · · · · · · · 3.192 19.20± 0.25 37QSO J2107-0620 0.642 0 · · · · · · · · ·
LBQS 2113-4345 2.053 1.510-2.021· · · · · · · · ·
LBQS 2114-4347 2.040 1.509-2.010· · · 1.912 19.50± 0.10 6J211739.5-433538 2.050 1.509-2.020· · · · · · · · ·
QSO J2119-3536 2.3411.710-1.992, · · · 1.996 20.10± 0.07 27· · · · · · 2.000-2.308 · · · · · · · · ·
QSO B2126-15 3.268 1.838-3.225 2.783 2.638 19.25± 0.15 37· · · · · · · · · · · · 2.769 19.20± 0.15 37QSO B2129-4653 2.230 1.706-2.198· · · · · · · · ·
J213314.2-464031 2.208 1.730-2.176· · · · · · · · ·
LBQS 2132-4321 2.4201.710-1.907, · · · 1.916 20.74± 0.09 6· · · · · · 1.923-2.383 · · · · · · · · ·
LBQS 2138-4427 3.1702.090-2.371, · · · 2.383 20.60± 0.05 1· · · · · · 2.395-2.837, · · · 2.852 20.98± 0.05 27· · · · · · 2.867-3.099 · · · · · · · · ·
QSO B2139-4433 3.220 2.932-3.178· · · · · · · · ·
QSO B2149-306 2.3451.715-2.312 · · · · · · · · ·
QSO B2204-408 3.1552.932-3.113 · · · · · · · · ·
LBQS 2206-1958A 2.5601.517-1.912, · · · 1.921 20.67± 0.05 30· · · · · · 1.932-2.071, · · · 2.076 20.44± 0.05 10· · · · · · 2.083-2.526 · · · · · · · · ·
QSO J2215-0045 1.476 0 · · · · · · · · ·
QSO J2220-2803 2.406 1.517-2.373· · · · · · · · ·
QSO B2222-396 2.1981.706-2.114 · · · 2.154 20.85± 0.10 10QSO J2227-2243 1.891 1.517-1.863· · · · · · · · ·
QSO B2225-4025 2.0301.716-1.920 · · · 1.965 20.65± 0.10 10LBQS 2230+0232 2.1471.517-1.849, · · · 1.864 20.90± 0.10 10· · · · · · 1.879-2.116 · · · · · · · · ·
J223851.0-295301 2.387 1.535-2.356· · · · · · · · ·
J223922.9-294947 1.849 1.564-1.821· · · · · · · · ·
J223938.9-295451 1.907 1.535-1.878· · · · · · · · ·
J223941.8-294955 2.102 1.656-2.071· · · 1.825 19.84± 0.14 6J223948.7-294748 2.068 1.517-2.037· · · · · · · · ·
J223951.9-294837 2.121 1.525-2.090· · · · · · · · ·
QSO B2237-0607 4.5582.894-3.735, · · · 4.079 20.55± 0.10 4· · · · · · 3.802-4.068, · · · · · · · · ·
· · · · · · 4.090-4.500 · · · · · · · · ·
QSO J2247-1237 1.8921.716-1.863 · · · · · · · · ·
QSO B2311-373 2.4761.706-2.171, · · · 2.182 20.48± 0.13 10· · · · · · 2.193-2.443 · · · · · · · · ·
J232046.7-294406 2.401 1.509-2.367· · · · · · · · ·
J232059.4-295520 2.317 1.517-2.284· · · · · · · · ·
J232114.3-294725 2.677 2.091-2.640· · · · · · · · ·
J232121.2-294350 2.184 1.620-2.152· · · · · · · · ·
QSO B2318-1107 2.9601.509-1.618, · · · 1.629 20.52± 0.14 6· · · · · · 1.640-1.977, · · · 1.989 20.68± 0.05 10· · · · · · 2.001-2.714, · · · · · · · · ·
· · · · · · 2.932-2.920 · · · · · · · · ·
QSO J2328+0022 1.302 0 · · · 0.652 20.32± 0.07 11QSO B2332-094 3.3302.177-3.045,3.2352.287 20.07± 0.07 8
Table 1.continued.
Quasar zem zmin–zmax zLLS zabs log NH I Ref.cm−2
· · · · · · 3.069-3.289 · · · 3.057 20.50± 0.07 10J233544.2+150118 0.791 0 · · · 0.680 19.70± 0.30 11QSO B2342+3417 3.0102.091-2.891, · · · 2.909 21.10± 0.10 10· · · · · · 2.927-2.970 · · · 2.940 20.18± 0.10 6QSO J2346+1247 2.578 1.715-2.538· · · 2.569 20.98± 0.04 38QSO B2343+125 2.7631.601-2.1852.465 2.431 20.40± 0.07 10QSO B2345+000 2.654 1.715-2.617· · · · · · · · ·
QSO B2347-4342 2.885 1.812-2.846 2.750· · · · · ·
QSO B2348-0180 3.0231.962-2.032,2.946 2.426 20.50± 0.10 27· · · · · · 2.069-2.415, · · · 2.615 21.30± 0.08 10· · · · · · 2.437-2.596, · · · · · · · · ·
· · · · · · 2.634-2.718, · · · · · · · · ·
· · · · · · 2.932-2.982 · · · · · · · · ·
QSO B2348-147 2.9331.838-2.264, · · · 2.279 20.56± 0.08 10· · · · · · 2.288-2.894 · · · · · · · · ·
J235534.6-395355 1.579 0 · · · · · · · · ·
J235702.5-004824 3.0132.002-2.9733.000 2.479 20.41± 0.08 6QSO J2359-1241 0.868 0 · · · · · · · · ·
References: (1) Ledoux et al. (2006); (2) Richter et al. (2005);
(3) Peroux et al. (2001); (4) Peroux et al. (2005); (5) Kaplan et al.(2010); (6) Paper I; (7) Dessauges-Zavadsky et al. (2009); (8)Ledoux et al. (2003); (9) Noterdaeme et al. (2007); (10) Fox et al.(2009); (11) Rao et al. (2006); (12) Ellison & Lopez (2009); (13)Prochaska & Herbert-Fort (2004); (14) Ellison et al. (2001a); (15)Peroux et al. (2003b); (16) Srianand et al. (2007); (17) D’Odorico et al.(2002); (18) Kanekar et al. (2009); (19) Noterdaeme et al. (2009);(20) Noterdaeme et al. (2008a); (21) Ellison et al. (2001b);(22)Carswell et al. (1996); (23) Peroux et al. (2004); (24) Lopez et al.(2005); (25) Quast et al. (2008); (26) Prochaska et al. (2007);(27) Srianand & Petitjean (1998); (28) Fox et al. (2011); (29)Guimaraes et al. (2009); (30) Lopez et al. (1999); (31) Ledoux et al.(2002); (32) Le Brun et al. (1997); (33) Dessauges-Zavadskyet al.(2003); (34) Ivanchik et al. (2010); (35) Herbert-Fort et al. (2006); (36)Noterdaeme et al. (2008b); (37) O’Meara et al. (2007); (38) Rix et al.(2007).
Lopez, S., Reimers, D., Gregg, M. D., et al. 2005, ApJ, 626, 767Lopez, S., Reimers, D., Rauch, M., Sargent, W. L. W., & Smette, A. 1999, ApJ,
513, 598Ma, C.-P. & Bertschinger, E. 1994, ApJ, 434, L5Martin, A. M., Papastergis, E., Giovanelli, R., et al. 2010,ApJ, 723, 1359Martin, C. L., Shapley, A. E., Coil, A. L., et al. 2012, ApJ, 760, 127McQuinn, M., Oh, S. P., & Faucher-Giguere, C.-A. 2011, ApJ,743, 82Nagamine, K., Springel, V., & Hernquist, L. 2004, MNRAS, 348, 421Noterdaeme, P., Ledoux, C., Petitjean, P., et al. 2007, A&A,474, 393Noterdaeme, P., Ledoux, C., Petitjean, P., & Srianand, R. 2008a, A&A, 481, 327Noterdaeme, P., Petitjean, P., Carithers, W. C., et al. 2012, A&A, 547, L1Noterdaeme, P., Petitjean, P., Ledoux, C., & Srianand, R. 2009, A&A, 505, 1087Noterdaeme, P., Petitjean, P., Ledoux, C., Srianand, R., & Ivanchik, A. 2008b,
A&A, 491, 397O’Meara, J. M., Prochaska, J. X., Burles, S., et al. 2007, ApJ, 656, 666O’Meara, J. M., Prochaska, J. X., Worseck, G., Chen, H.-W., &Madau, P. 2013,
ApJ, 765, 137Peroux, C., Deharveng, J.-M., Le Brun, V., & Cristiani, S. 2004, MNRAS, 352,
1291Peroux, C., Dessauges-Zavadsky, M., D’Odorico, S., Kim, T.-S., & McMahon,
R. G. 2003a, MNRAS, 345, 480Peroux, C., Dessauges-Zavadsky, M., D’Odorico, S., Sun Kim, T., & McMahon,
R. G. 2005, MNRAS, 363, 479Peroux, C., McMahon, R. G., Storrie-Lombardi, L. J., & Irwin, M. J. 2003b,
MNRAS, 346, 1103Peroux, C., Storrie-Lombardi, L. J., McMahon, R. G., Irwin, M., & Hook, I. M.
2001, AJ, 121, 1799Pontzen, A., Governato, F., Pettini, M., et al. 2008, MNRAS,390, 1349Pontzen, A. & Pettini, M. 2009, MNRAS, 393, 557Prochaska, J. X. & Herbert-Fort, S. 2004, PASP, 116, 622Prochaska, J. X., Herbert-Fort, S., & Wolfe, A. M. 2005, ApJ,635, 123Prochaska, J. X., O’Meara, J. M., & Worseck, G. 2010, ApJ, 718, 392

14 T. Zafar et al.: Cosmological Evolution of the Neutral GasMass Density
Prochaska, J. X. & Wolfe, A. M. 2009, ApJ, 696, 1543Prochaska, J. X., Wolfe, A. M., Howk, J. C., et al. 2007, ApJS,171, 29Quast, R., Reimers, D., & Baade, R. 2008, A&A, 477, 443Rahmati, A., Pawlik, A. H., Raicevic, M., & Schaye, J. 2013a,MNRAS, 430,
2427Rahmati, A., Schaye, J., Pawlik, A. H., & Raicevic, M. 2013b,MNRAS, 431,
2261Rao, S. M., Turnshek, D. A., & Nestor, D. B. 2006, ApJ, 636, 610Ribaudo, J., Lehner, N., & Howk, J. C. 2011, ApJ, 736, 42Richter, P., Ledoux, C., Petitjean, P., & Bergeron, J. 2005,A&A, 440, 819Rix, S. A., Pettini, M., Steidel, C. C., et al. 2007, ApJ, 670,15Rubin, K. H. R., Prochaska, J. X., Koo, D. C., & Phillips, A. C.2012, ApJ, 747,
L26Rubin, K. H. R., Weiner, B. J., Koo, D. C., et al. 2010, ApJ, 719, 1503Sato, T., Martin, C. L., Noeske, K. G., Koo, D. C., & Lotz, J. M.2009, ApJ, 696,
214Schaye, J. 2001, ApJ, 562, L95Shull, J. M., Smith, B. D., & Danforth, C. W. 2012, ApJ, 759, 23Songaila, A. & Cowie, L. L. 2010, ApJ, 721, 1448Spergel, D. N., Verde, L., Peiris, H. V., et al. 2003, ApJS, 148, 175Srianand, R., Gupta, N., & Petitjean, P. 2007, MNRAS, 375, 584Srianand, R. & Petitjean, P. 1998, A&A, 335, 33Steidel, C. C., Erb, D. K., Shapley, A. E., et al. 2010, ApJ, 717, 289Storrie-Lombardi, L. J. & Wolfe, A. M. 2000, ApJ, 543, 552Tescari, E., Viel, M., Tornatore, L., & Borgani, S. 2009, MNRAS, 397, 411Tytler, D. 1987, ApJ, 321, 49van de Voort, F., Schaye, J., Altay, G., & Theuns, T. 2012, MNRAS, 2664Viegas, S. M. 1995, MNRAS, 276, 268Weiner, B. J., Coil, A. L., Prochaska, J. X., et al. 2009, ApJ,692, 187Wolfe, A. M., Lanzetta, K. M., Foltz, C. B., & Chaffee, F. H. 1995, ApJ, 454,
698Zafar, T., Popping, A., & Peroux, C. 2013, A&A, 556, A140Zwaan, M., Walter, F., Ryan-Weber, E., et al. 2008, AJ, 136, 2886Zwaan, M. A., Meyer, M. J., Staveley-Smith, L., & Webster, R.L. 2005a,
MNRAS, 359, L30Zwaan, M. A., van der Hulst, J. M., Briggs, F. H., Verheijen, M. A. W., & Ryan-
Weber, E. V. 2005b, MNRAS, 364, 1467
Appendix A: Description of the individual sightlines
This appendix describes the individual sightlines of all thequasars withzem > 1.5 presented in Table 1. For each of them,we have examined the abstract of the observing proposal to de-termine if any knowledge of the sightline characteristics wereknown prior to the execution of the proposal, which may rep-resent a bias for our statistical study of sub-DLAs. We providehere a short description of the original observing aims and ade-scription of our decision on whether to include or exclude theredshift path and/or the sub-DLAs along these sightlines.
– LBQS 2359-01216B was observed with the aim of measur-ing the molecular and metal content of known DLAs. Theredshift path was included in our statistical sample to searchfor unknown sub-DLAs.
– QSO J0003-2323 was observed as part of the ESO LargeProgram for IGM studies. The redshift path and an addi-tional sub-DLA reported by Richter et al. (2005) were ex-cluded from the statistical sample.
– QSO B0002-422 was observed as part of the ESO LargeProgram for IGM studies. The redshift path was excludedfrom the statistical sample.
– QSO 0006-6208 was targeted in a search for new sub-DLAs.Therefore, the redshift path and a sub-DLA previously re-ported by Peroux et al. (2005) were included in the statisticalsample.
– QSO J0008-0958 was observed with the aim of measuringthe metal content of a known DLA. The redshift path wasincluded in our statistical sample to search for unknown sub-DLAs.
– QSO J0008-2900 was observed in a study of the tomographyof the IGM. Therefore, the redshift path and an additionalsub-DLA reported in paper I were excluded from the statis-tical sample.
– QSO J0008-2901 was observed in a study of the tomographyof the IGM. Therefore, the redshift path and an additionalsub-DLA reported in paper I were excluded from the statis-tical sample.
– QSO B0008+006 was observed in a study of its BAL fea-tures and therefore the redshift path was included in our sta-tistical sample to search for unknown sub-DLAs.
– LBQS 0009-0138 was targeted in a study the metal contentof sub-DLAs at 0.7< z < 1.5. The redshift path was includedto search for sub-DLAs at higher redshift.
– LBQS 0010-0012 was observed with the aim of measuringthe molecular content of a known DLA. The redshift pathwas included in our statistical sample to search for unknownsub-DLAs.
– LBQS 0013-0029 was observed with the aim of measuringthe molecular content of a known DLA. The redshift pathwas included in our statistical sample to search for unknownsub-DLAs. The sub-DLA found by Ledoux et al. (2003) wasnot included in our redshift path because it is near the knownDLA.
– QSO B0027-1836 was observed in a search for molecules ina known DLA. The redshift path was included in our statis-tical sample to search for unknown sub-DLAs.
– J004054.7-091526 was observed in a study of the intrinsicproperties of the quasar. Therefore, the redshift path and anadditional sub-DLA found by Noterdaeme et al. (2009) wereincluded.
– QSO J0041-4936 was observed with the aim of measuringthe deuterium content of a known DLA. The redshift pathwas included in our statistical sample to search for unknownsub-DLAs.
– QSO B0039-407 was targeted in a study the metal contentof Mg ii absorbers at 0.6< z < 1.5. The redshift path wasincluded to search for sub-DLAs at higher redshift.
– QSO B0039-3354 was observed with the aim of measuringthe metal content of known DLAs. The redshift path wasincluded in our statistical sample to search for unknown sub-DLAs.
– LBQS 0041-2638 was observed in a study of the tomographyof the IGM. Therefore, the redshift path was excluded fromthe statistical sample.
– LBQS 0041-2707 was observed in a study of the tomographyof the IGM. Therefore, the redshift path was excluded fromthe statistical sample.
– QSO B0042-2656 was targeted in a study of the tomographyof the IGM. Therefore, the redshift path was excluded fromthe statistical sample.
– LBQS 0042-2930 was observed with the aim of measuringthe metal content of known DLAs. The redshift path wasincluded in our statistical sample to search for unknown sub-DLAs.
– LBQS B0042-2657 was targeted in a study of the tomogra-phy of the IGM. Therefore, the redshift path was excludedfrom the statistical sample.
– J004612.2-293110 was targeted in a study of a dark clump at0.1< z < 0.3 along the line of sight to the quasar. Therefore,the redshift path was included in our statistical sample tosearch for unknown sub-DLAs.
– LBQS 0047-2538 was observed in a study of the halo of anearby galaxy along the quasar sightline. Hence, the redshift

T. Zafar et al.: Cosmological Evolution of the Neutral Gas Mass Density 15
path was included in our statistical sample to search for un-known sub-DLAs.
– LBQS 0048-2545 was observed in a study of the halo of anearby galaxy along the quasar sightline. Therefore, the red-shift path was included in our statistical sample to search forunknown sub-DLAs.
– QSO B0018-2608 was targeted in a study of the halo of anearby galaxy along the quasar sightline. Hence, the redshiftpath was included in our statistical sample to search for un-known sub-DLAs.
– QSO B0055-26 was observed in a study of the IGM.Therefore, the redshift path was excluded from the statisti-cal sample.
– QSO B0058-292 was observed with the aim of measuringthe molecular and metal content of a known DLA. The red-shift path was included in our statistical sample to search forunknown sub-DLAs.
– LBQS 0059-2735 was observed in a study of quasar out-flows. Therefore, the redshift path was included in our sta-tistical sample to search for unknown sub-DLAs.
– QSO 0100+1300 was targeted in a study of the variationof the fine-structure constant in a quasar with known metallines. Hence, the redshift path was excluded from the statis-tical sample.
– QSO J0105-1846 was observed in a study of the metal con-tent of a known DLA. Therefore the redshift path and anadditional sub-DLA reported by Fox et al. (2009) were in-cluded in our statistical sample.
– QSO B0102-2931 was observed in a study of the correlationfunction of the IGM. Therefore, the redshift path was ex-cluded from the statistical sample.
– QSO B0103-260 was targeted in a study of the IGM. Hence,the redshift path was excluded from the statistical sample.
– QSO B0109-353 was observed as part of the ESO LargeProgram for IGM studies. The redshift path was excludedfrom the statistical sample.
– QSO B0112-30 was observed with the aim of measuring themolecular content of known DLAs. The redshift path wasincluded in our statistical sample to search for unknown sub-DLAs.
– QSO J0124+0044 was targeted with the aim of searching fornew sub-DLAs. Therefore, the redshift path and sub-DLAspreviously reported by Peroux et al. (2005) were included inthe statistical sample.
– QSO B0122-379 was observed as part of the ESO LargeProgram for IGM studies. The redshift path was excludedfrom the statistical sample.
– QSO B0122-005 was targeted in a study of the metal contentof Mg ii absorbers at 0.6< z < 1.5. The redshift path andan additional sub-DLA reported by Ellison & Lopez (2009)were included in our statistical sample.
– QSO B0128-2150 was observed with the aim of measuringthe deuterium content ofzabs = 1.85 and 1.64 Hi systems.The redshift path was included in our statistical sample tosearch for unknown sub-DLAs. TheNH i of the two systemsmentioned above are fitted for the first time in paper I . Onlyone of them is classified as a sub-DLA, the other system hasa of lower Hi column density.
– QSO B0130-403 was observed in a study of a nearby galaxyalong the quasar sightline. Hence, the redshift path was in-cluded in our statistical sample to search for unknown sub-DLAs.
– QSO J0133+0400 was targeted in a search of new sub-DLAs and in a study of the metal content of known DLAs.
Therefore, the redshift path and sub-DLAs previously re-ported by Peroux et al. (2005) were included in the statisticalsample.
– QSO B0135-42 was observed in a search of new sub-DLAs.Therefore, the redshift path and sub-DLAs previously re-ported by Peroux et al. (2005) were included in the statisticalsample
– QSO J0139-0824 was targeted in a study of the variationof the fine-structure constant in a quasar with known metallines. Hence, the redshift path wss excluded from the statis-tical sample.
– QSO J0143-317 was observed in a study of the IGM. Hence,the redshift path was excluded from the statistical sample.
– QSO J0153-4311 was observed as part of the ESO LargeProgram for IGM studies. The redshift path was excludedfrom the statistical sample.
– QSO B0201+113 was observed in a study of the metal con-tent of a known DLA. Therefore, the redshift path was in-cluded in our statistical sample to search for unknown sub-DLAs.
– QSO J0209+0517 was observed in a search of new sub-DLAs. Therefore, the redshift path and a sub-DLA previ-ously reported by Peroux et al. (2005) were included in thestatistical sample.
– J021741.8-370100 was observed with the aim of measuringthe metal content of known DLAs. The redshift path wasincluded in our statistical sample to search for unknown sub-DLAs.
– QSO B0216+0803 was observed with the aim of measuringthe molecular and metal content of a known DLA betweenz = 2–3. The redshift path and an additional sub-DLA atlower redshift reported by Dessauges-Zavadsky et al. (2009)were included in our statistical sample.
– QSO B0227-369 was targeted in a study of the metal contentof Mg ii absorbers at 0.6< z < 1.5. The redshift path wasincluded to search for sub-DLAs at higher redshift.
– QSO B0237-2322 was targeted as part of the ESO LargeProgram for IGM studies. The redshift path and sub-DLAswere excluded from the statistical sample.
– QSO J0242+0049 was observed in a study of its BAL fea-tures and therefore the redshift path was included in our sta-tistical sample to search for unknown sub-DLAs.
– QSO J0243-0550 was observed in a study of the metal con-tent of Mgii absorbers at 0.6< z < 1.5. The redshift path wasincluded to search for sub-DLAs at higher redshift.
– QSO B0241-01 was observed in a search of new sub-DLAs.The redshift path was included in the statistical sample.
– QSO B0244-1249 was targeted in a study of the metal con-tent of Mgii absorbers at 0.6< z < 1.5. The redshift path andan additional sub-DLA reported by Ellison & Lopez (2009)were included in the statistical sample.
– QSO B0254-404 was observed with the aim of measuringthe metal content of a known DLA. The redshift path wasincluded in our statistical sample to search for unknown sub-DLAs.
– J030640.8-301032 was observed in a study of the tomogra-phy of the IGM. Therefore, the redshift path was excludedfrom the statistical sample.
– J030643.7-301107 was observed in a study of the tomogra-phy of the IGM. Hence, the redshift path was excluded fromthe statistical sample.
– QSO B0307-195A was observed in a study of the tomogra-phy of the IGM. Hence, the redshift path was excluded fromthe statistical sample.

16 T. Zafar et al.: Cosmological Evolution of the Neutral GasMass Density
– QSO B0307-195B was observed in a study of the tomogra-phy of the IGM. The redshift path and an additional sub-DLA reported by D’Odorico et al. (2002) were excludedfrom the statistical sample.
– J031856.6-060038was observed in a study of the quasar out-flows. Therefore, the redshift path was included in our statis-tical sample to search for unknown sub-DLAs.
– QSO B0329-385 was observed as part of the ESO LargeProgram for IGM studies. The redshift path was excludedfrom the statistical sample.
– Q B0329-2534 was observed as part of the ESO LargeProgram for IGM studies. The redshift path was excludedfrom the statistical sample.
– QSO J0332-4455 was targeted with the aim of measuring themetal content of known DLAs. The redshift path was in-cluded in our statistical sample. An additional sub-DLA re-ported by Fox et al. (2009) was excluded because it is 3000km s−1 blueward of the quasar emission line.
– QSO B0335-122 was observed with the aim of measuring themetal content of known DLAs. Therefore, the redshift pathwas included in our statistical sample to search for unknownsub-DLAs.
– QSO J0338+0021 was observed in a study of the intrinsicproperties of the quasar. Therefore, the redshift path was in-cluded in our statistical sample to search for unknown sub-DLAs.
– QSO J0338-0005 was observed in a study of the variationof the fine-structure constant in a quasar with known metallines. Hence, the redshift path was excluded from the statis-tical sample.
– QSO B0336-017 was observed in a study of the metal con-tent of a known DLA. Therefore, the redshift path was in-cluded in our statistical sample to search for unknown sub-DLAs.
– QSO B0347-383 was observed in a study of the metal con-tent of a known DLA. Therefore, the redshift path was in-cluded in our statistical sample to search for unknown sub-DLAs.
– J035320.2-231418 was targeted in a study of the metal con-tent of Mgii absorbers at 0.6< z < 1.5. The redshift path wasincluded to search for sub-DLAs at higher redshift.
– QSO J0354-2724 was observed in a study of the metal con-tent of sub-DLAs at 0.7< z < 1.5. The redshift path wasincluded to search for sub-DLAs at higher redshift.
– QSO J0403-1703 was observed in a study of narrow absorp-tion lines associated with the quasar. Therefore, the redshiftpath was included in our statistical sample to search for un-known sub-DLAs.
– QSO J0407-4410 was observed with the aim of measuringthe molecular and metal content of known DLAs. The red-shift path was included in our statistical sample to search forunknown sub-DLAs.
– QSO J0422-3844 was targeted as part of the ESO LargeProgram for IGM studies. The redshift path and a sub-DLAwere excluded from our statistical sample.
– QSO J0427-1302 was targeted in a study of the metal contentof sub-DLAs at 0.7< z < 1.5. The redshift path was includedto search for sub-DLAs at higher redshift.
– QSO J0430-4855 was targeted in a study of the IGM. Theredshift path was excluded from the statistical sample.
– QSO B0432-440 was observed with the aim of measure themetal content of a known DLA. Therefore, the redshift pathwas included in our statistical sample to search for unknownsub-DLAs.
– QSO B0438-43 was observed with the aim of measuring themetal content of a known DLA. Therefore, the redshift pathwas included in our statistical sample to search for unknownsub-DLAs.
– QSO B0449-1645 was targeted in a study of the metal con-tent of a DLA atz ≤ 1.0. The redshift path was included tosearch for sub-DLAs at higher redshift.
– QSO B0450-1310B was observed in a study of the metalcontent of DLAs atzabs& 2. The redshift path was includedin the statistical sample to search for unknown sub-DLAs.
– QSO J0455-4216 was observed as part of the ESO LargeProgram for IGM studies. The redshift path was excludedfrom the statistical sample.
– 4C-02.19 was observed with the aim of measuring themolecular and metal content of a known DLA. Later thequasar was re-observed in a study of the variation of the fine-structure constant in known metal lines. To be conservative,the redshift path was excluded from our statistical sample.
– QSO B0515-4414 was targeted in a study of the IGM. Hence,the redshift path and a lower redshift sub-DLA were ex-cluded from the statistical sample.
– QQSO B0528-2505 was observed with the aim of measuringthe molecular and metal content of known DLAs and to con-strain the variation of ratio of the electron to proton masses.The redshift path was included in our statistical sample tosearch for unknown sub-DLAs.
– QSO J0530+13 was targeted in a study of the Mgii absorberatz = 0.79. The redshift path was included to search for sub-DLAs at higher redshift.
– QSO B0551-36 was observed with the aim of measuring themolecular content of a known DLA. The redshift path wasincluded in our statistical sample to search for unknown sub-DLAs.
– J060008.1-504036 was observed in a search of deuterium ina known LLS. The redshift path was included in our statisti-cal sample to search for unknown sub-DLAs.
– QSO B0606-2219 was targeted in a study of the metal con-tent of Mgii absorbers at 0.6< z < 1.5. The redshift path wssincluded to search for sub-DLAs at higher redshift.
– QSO B0642-5038 was observed in a search of molecules in aknown DLA. The redshift path was included in our statisticalsample to search for unknown sub-DLAs.
– QSO B0841+129 was observed in a study of the metal con-tent of DLAs atzabs& 2. The redshift path was included inthe statistical sample. An additional sub-DLA reported byFox et al. (2011) was excluded because it is within 3000 kms−1 of the quasar emission line.
– QSO B0908+0603 was observed in a study of the tomogra-phy of the IGM. The redshift path wss excluded from ourstatistical sample.
– QSO B0913+0715 was targeted with the aim of measuringthe metal content and to search for deuterium in a knownDLA. Therefore, the redshift path was included in our statis-tical sample to search for unknown sub-DLAs.
– QSO B0919-260 was targeted in a study of the metal contentof Mg ii absorbers at 0.6< z < 1.5. The redshift path wasincluded to search for sub-DLAs at higher redshift.
– QSO B0933-333 was observed with the aim of measuringthe metal content of a known DLA. The redshift path wasincluded in our statistical sample to search for unknown sub-DLAs.
– QSO B0951-0405 was targeted with the aim of measuringthe metal content of known DLAs. The redshift path and

T. Zafar et al.: Cosmological Evolution of the Neutral Gas Mass Density 17
an additional sub-DLA reported by Guimaraes et al. (2009)were included in the statistical sample.
– QSO B0952-0115 was first observed in a study of the tomog-raphy of the IGM and later to measure the metal content ofa known DLA. To be conservative, the redshift path and anadditional sub-DLA reported in paper I were excluded fromour statistical sample.
– QSO B1005-333 was targeted in a study of the metal contentof Mg ii absorbers at 0.6< z < 1.5. The redshift path wasincluded to search for sub-DLAs at higher redshift.
– QSO B1027-0540 was observed in a study of the epoch ofreionization. The redshift path was excluded because thequasar iszem> 5.0.
– Q 1036-272 was observed to constrain the variation of ra-tio of the electron to proton masses. The redshift path wasincluded in the statistical sample to search for unknown sub-DLAs.
– QSO B1036-2257 was targeted with the aim of measuringthe metal content of a known DLA. Therefore, the redshiftpath and an additional sub-DLA reported in paper I were in-cluded in our statistical sample.
– QSO J1039-2719 was observed to constrain the variation ofratio of the electron to proton masses in a known sub-DLAand in a study of narrow absorption lines associated with thequasar. The redshift path was included in the statistical sam-ple to search for additional sub-DLAs.
– QSO B1038-2712 was observed in Visitor Mode as part ofa program to search for molecules in known DLAs but thepurpose of observing this particular target was to confirmthe BAL nature of the quasar. Hence, the redshift path wasincluded in our statistical sample.
– QSO B1036-268 was targeted in a study of the BAL outflowof the quasar. Hence, the redshift path and an additional sub-DLA reported in paper I were included in our statistical sam-ple.
– J104642.9+053107 was observed in a study of the tomogra-phy of the IGM. Therefore, the redshift path was excludedfrom the statistical sample.
– QSO B1055-301 was observed with the aim of measuring themetal content of a known DLA. Therefore, the redshift pathwas included in our statistical sample to search for unknownsub-DLAs.
– QSO B1101-26 was targeted in a study of the variation of thefine-structure constant in a quasar with known metal lines.Hence, the redshift path was excluded from the statisticalsample.
– QSO B1104-181 was observed in a study of the tomographyof the IGM. The redshift path was excluded from our statis-tical sample.
– QSO B1108-07 was targeted with the aim of measuring themetal content and search for deuterium in a known DLA.Hence, the redshift path and an additional sub-DLA reportedby Ledoux et al. (2006) were included in our statistical sam-ple.
– QSO B1113-1533 was observed in a search of deuterium in aknown DLA. The redshift path was included in our statisticalsample to search for unknown sub-DLAs.
– QSO B1114-0822 was observed with the aim of measuringthe metal content of a known DLA. The redshift path wasincluded in our statistical sample to search for unknown sub-DLAs.
– QSO B1122-168 was targeted in a study of the high ioniza-tion metal lines in the IGM and broad-line regions. The red-shift path was excluded from our statistical sample.
– QSO J1142+2654 was observed in a study of the Heii reion-ization. The redshift path was excluded from our statisticalsample.
– QSO B1151+068 was observed in a study of the metal con-tent in a known DLA. The redshift path was included in ourstatistical sample to search for unknown sub-DLAs.
– J115538.6+053050was observed in a study of the metal con-tent of known DLAs. Therefore, the redshift path was in-cluded in our statistical sample to search for unknown sub-DLAs.
– QSO J1159+1337 was observed in a study of narrow absorp-tion lines associated with the quasar. Therefore, the redshiftpath and an additional sub-DLA reported by Guimaraes et al.(2009) were included in our statistical sample to search forunknown sub-DLAs.
– QSO B1158-1842 was targeted as part of the ESO LargeProgram for IGM studies. The redshift path was excludedfrom the statistical sample.
– QSO B1202-074 was observed under the quasar environ-ments, ESO Large Program for IGM studies and DLA abun-dances programmes. Therefore, the redshift path was not in-cluded in our statistical sample.
– J120550.2+020131 was observed to confirm the nature of aDLA candidate. The redshift path was included in our statis-tical sample to search for unknown sub-DLAs.
– QSO B1209+0919 was targeted with the aim of measuringthe metal content of a known DLA. The redshift path wasincluded in our statistical sample to search for unknown sub-DLAs.
– LBQS 1209+1046 was targeted with the aim of measuringthe metal content of a known DLA. The redshift path wasincluded in our statistical sample to search for unknown sub-DLAs.
– LBQS 1210+1731 was observed in a study of the metal con-tent of a DLA atzabs≈ 2. The redshift path was included inthe statistical sample to search for unknown sub-DLAs.
– QSO B1220-1800 was observed to confirm the nature of asub-DLA candidate. The redshift path was included in ourstatistical sample to search for unknown sub-DLAs.
– LBQS 1223+1753 was observed in a study of the quasarbroad-line region and metal content in a known DLA.The redshift path and an additional sub-DLA reported byDessauges-Zavadsky et al. (2003) were included in our sta-tistical sample.
– QSO B1228-113 was observed with the aim of measuringthe metal content of known DLAs. The redshift path wasincluded in our statistical sample to search for unknown sub-DLAs.
– QSO B1230-101 was targeted in a study of the metal contentof Mg ii absorbers at 0.6< z < 1.5. The redshift path wasincluded to search for sub-DLAs at higher redshift.
– LBQS 1232+0815 was observed in a study of the molecularcontent of a known DLA, quasar outflows and to constrainthe variation of ratio of the electron to proton masses. Theredshift path and an additional sub-DLA reported in paper Iwere included in the statistical sample.
– LBQS 1242+0006 was observed to confirm the nature of aDLA candidate. The redshift path was included in our statis-tical sample to search for unknown sub-DLAs.
– LBQS 1246-0217 was observed in a study of the metal con-tent of a known DLA. The redshift path was included in ourstatistical sample to search for unknown sub-DLAs.

18 T. Zafar et al.: Cosmological Evolution of the Neutral GasMass Density
– J124957.2-015929 was observed in a study of the Heii
reionization. The redshift path was excluded from our sta-tistical sample.
– QSO B1256-177 was targeted in a study of the metal contentof Mg ii absorbers at 0.6< z < 1.5. The redshift path wasincluded to search for sub-DLAs at higher redshift.
– QSO B1306+0356 was observed in a study of the epochof reionization. The redshift path was excluded because thequasar iszem> 5.0.
– QSO B1317-0507 was observed in a study of the Heii reion-ization. The redshift path was excluded from our statisticalsample.
– QSO B1318-263 was targeted in a study of the metal contentof Mg ii absorbers at 0.6< z < 1.5. The redshift path wasincluded to search for sub-DLAs at higher redshift.
– QSO B1324-047 was targeted in a study of the metal contentof Mg ii absorbers at 0.6< z < 1.5. The redshift path wasincluded to search for sub-DLAs at higher redshift.
– QSO J1330-2522 was observed in a study of the Heii reion-ization. The redshift path and three sub-DLAs were excludedfrom our statistical sample.
– QSO B1331+170 was targeted in a study of the metal contentin a known DLA. Hence, the redshift path was included inour statistical sample to search for known sub-DLAs.
– QSO J1344-1035 was targeted as part of the ESO LargeProgram for IGM studies. The redshift path was excludedfrom our statistical sample.
– QSO J1347-2457 was observed as part of the ESO LargeProgram for IGM studies. The redshift path was excludedfrom the statistical sample.
– QSO J1356-1101 was observed with the aim of measuringthe metal content of known DLAs. Therefore, the redshiftpath and an additional sub-DLA reported in paper I were in-cluded in our statistical sample.
– QSO B1402-012 was targeted in a study of the metal contentof Mg ii absorbers at 0.6< z < 1.5. The redshift path wasincluded to search for sub-DLAs at higher redshift.
– QSO B1409+0930 was observed in a study of the metal con-tent of known DLAs. The redshift path and an additionalsub-DLA reported by Fox et al. (2009) were included in ourstatistical sample.
– QSO B1412-096 was targeted in a study of the metal contentof Mg ii absorbers at 0.6< z < 1.5. The redshift path wasincluded to search for sub-DLAs at higher redshift.
– QSO J1421-0643 was observed with the aim of measuringthe metal content of a known DLA. Therefore, the redshiftpath was included in our statistical sample to search for un-known sub-DLAs.
– QSO B1429-008B was targeted in a study of the tomographyof the IGM. The redshift was excluded from our statisticalsample.
– QSO J1439+1117 was observed with the aim of measuringthe molecular content of a known sub-DLA. The redshiftpath was included in our statistical sample to search for un-known sub-DLAs.
– QSO J1443+2724 was targeted in a search of molecules andmeasure the CMB temperature in a known DLA. The red-shift path was included in our statistical sample to search forunknown sub-DLAs.
– LBQS 1444+0126 was observed in a study of the quasarbroad-line regions, as well as the metal and molecular con-tent of a known DLA. The redshift path was included inour statistical sample to search for additional unknown sub-DLAs.
– QSO B1448-232 was targeted for the IGM ionization andESO Large Program for IGM studies. The redshift path wasexcluded from our statistical sample.
– J145147.1-151220 was observed as part of the ESO LargeProgram for IGM studies. The redshift path was not includedin our statistical sample.
– J151352.52+085555.7 was observed in a study of the quasaroutflows. Therefore, the redshift path was included in ourstatistical sample to search for unknown sub-DLAs.
– QSO J1621-0042 was observed in a study of the Heii reion-ization. The redshift path was excluded from our statisticalsample.
– 4C 12.59 was observed in a study of the metal content ofknown low-redshift DLA and sub-DLA. The redshift pathwas included in our statistical sample to search for sub-DLAs at higher redshift.
– QSO J1723+2243 was observed in a search of molecules ina known DLA. The redshift path and an additional sub-DLAreported in paper I were included in our statistical sample.
– QSO B1937-1009 was observed in a study of the Heii reion-ization. The redshift path was excluded from our statisticalsample.
– QSO B1935-692 was observed in a study of the Heii reion-ization. The redshift path was excluded from our statisticalsample.
– QSO B2000-330 was observed as part of the ESO LargeProgram for IGM studies and in a study of Jeans scaleof the IGM. The redshift path and sub-DLAs reported byO’Meara et al. (2007) were not included in the statisticalsample.
– LBQS 2113-4345 was targeted in a study of the tomographyof the IGM. The redshift was excluded from our statisticalsample.
– LBQS 2114-4347 was targeted in a study of the tomographyof the IGM. The redshift and a sub-DLA reported in paper Iwere excluded from our statistical sample.
– J211739.5-433538was targeted in a study of the tomographyof the IGM. The redshift was excluded from our statisticalsample.
– QSO J2119-3536 was targeted in a study of the metal con-tent of a known sub-DLA. Therefore, the redshift path wasincluded in our statistical sample to search for unknown sub-DLAs.
– QSO B2126-15 was observed as part of the ESO LargeProgram for IGM studies. The redshift path and two sub-DLAs reported by O’Meara et al. (2007) were not includedin our statistical sample.
– QSO B2129-4653 was targeted in a study of the variationof the fine-structure constant in a quasar with known metallines. Hence, the redshift path was excluded from the statis-tical sample.
– J213314.2-464031 was observed in Visitor Mode as part ofa program to search for molecules in known DLAs but thepurpose of observing this particular target was to study thetomography of the IGM (see Coppolani et al. 2006). Hence,the redshift path was excluded from our statistical sample.
– LBQS 2132-4321 was targeted in a study of the metal con-tent of a known sub-DLA. The redshift path was included inour statistical sample to search for unknown sub-DLAs.
– LBQS 2138-4427 was observed with the aim of measuringthe metal content of known DLAs. The redshift path wasincluded in our statistical sample to search for unknown sub-DLAs.
T. Zafar et al.: Cosmological Evolution of the Neutral Gas Mass Density 19
– QSO B2139-4433 was observed in a study of the tomogra-phy of the IGM. The redshift path was excluded from ourstatistical sample.
– QSO B2149-306 was targeted in a study of the metal contentof Mg ii absorbers at 0.6< z < 1.5. The redshift path wasincluded to search for sub-DLAs at higher redshift.
– QSO B2204-408 was observed in a study of absorption linesassociated with the quasar. Therefore, the redshift path wasincluded in our statistical sample to search for unknown sub-DLAs.
– LBQS 2206-1958A was targeted in a study of the metal andmolecular content of known DLAs. Therefore, the redshiftpath was included in our statistical sample to search for un-known sub-DLAs.
– QSO J2220-2803 was observed as part of the ESO LargeProgram for IGM studies and in a study of broad-line re-gions of the quasar. The redshift path was not included inour statistical sample.
– QSO B2222-396 was observed with the aim of measuringthe metal content of a known DLA. The redshift path wasincluded in our statistical sample to search for unknown sub-DLAs.
– QSO J2227-2243 was observed in a study of the IGM. Theredshift path was excluded from the statistical sample.
– QSO B2225-4025 was observed with the aim of measuringthe metal content of a known DLA. The redshift path wasincluded in our statistical sample to search for unknown sub-DLAs.
– LBQS 2230+0232 was observed in a study of the metal con-tent of a DLA atzabs& 2. The redshift path was included inthe statistical sample to search for known sub-DLAs.
– J223851.0-295301was targeted in a study of the tomographyof the IGM. The redshift was excluded from our statisticalsample.
– J223922.9-294947was targeted in a study of the tomographyof the IGM. The redshift was excluded from our statisticalsample.
– J223928.9-295451was targeted in a study of the tomographyof the IGM. The redshift was excluded from our statisticalsample.
– J223941.8-294955was targeted in a study of the tomographyof the IGM. The redshift and a sub-DLA reported in paper Iwere excluded from our statistical sample.
– J223948.7-294748was targeted in a study of the tomographyof the IGM. The redshift was excluded from our statisticalsample.
– J223951.9-294837was targeted in a study of the tomographyof the IGM. The redshift was excluded from our statisticalsample.
– QSO B2237-0607 was targeted in a search of new sub-DLAs. The redshift path was included in the statistical sam-ple.
– QSO J2247-1237 was targeted in a study of the metal contentof Mg ii absorbers at 0.6< z < 1.5. The redshift path wasincluded to search for sub-DLAs at higher redshift.
– QSO B2311-373 was observed with the aim of measuring themetal content of a known DLA. Therefore, the redshift pathwas included in our statistical sample to search for unknownsub-DLAs.
– J232046.7-294406was targeted in a study of the tomographyof the IGM. The redshift was excluded from our statisticalsample.
– J232059.4-295520was targeted in a study of the tomographyof the IGM. The redshift was excluded from our statisticalsample.
– J232114.3-294725 was observed in a study of the tomogra-phy of the IGM. Therefore, the redshift path was excludedfrom the statistical sample.
– J232121.2-294350was targeted in a study of the tomographyof the IGM. The redshift was excluded from our statisticalsample.
– QSO B2318-1107 was observed in a search of molecules andmeasure the metal content of known DLAs. The redshift pathwas included in our statistical sample to search for unknownsub-DLAs.
– QSO B2332-094 was targeted with the aim of measuring themetal and molecular content of a known DLA. The redshiftpath and an additional sub-DLA reported by Ledoux et al.(2003) were included in our statistical sample.
– QSO B2342+3417 was observed with the aim of measuringthe metal content of a known DLA. The redshift path and anadditional sub-DLA reported in paper I were included in ourstatistical sample.
– QSO J2346+1247 was observed in a study of the absorbersassociated with known galaxies along the quasar line ofsight. The redshift path was excluded from our statisticalsample.
– QSO B2343+125 was targeted in a study of the metal contentof a known DLA. Hence, the redshift path was included inour statistical sample.
– QSO B2345+000 was observed in a study of the absorbersassociated with known galaxies along the quasar sightline.The redshift path was excluded from our statistical sample.
– QSO B2347-4342 was observed as part of the ESO LargeProgram and other IGM related programmes. The redshiftpath was not included in the statistical sample.
– QSO B2348-147 was observed in a study of the metal con-tent of a known DLA. The redshift path was included in ourstatistical sample to search for unknown sub-DLAs.
– J235702.5-004824 was observed in a study of its BAL fea-tures and therefore the redshift path was included in our sta-tistical sample to search for unknown sub-DLAs.