the eso distant cluster survey ediscsswhite/talk/eso-lp.pdf · get hst/acs imaging of 10 most...
TRANSCRIPT

The ESO Distant Cluster Survey
EDisCS
Simon D.M. White Max Planck Institut für Astrophysik
ESO Large Programme Workshop Garching, May, 2003

WMAP Map of the Cosmic Microwave Background
Bennett et al 2003

● > 105 near-independent 5 temperature measurements
● Gaussian map: PS fit by a CDM model with parameters consistent with other data
● Extrapolation fits the Ly- forest power spectrum Confirms standard model to scales well below those of clusters and bright galaxies
Bennett et al 2003
Spergel et al 2003
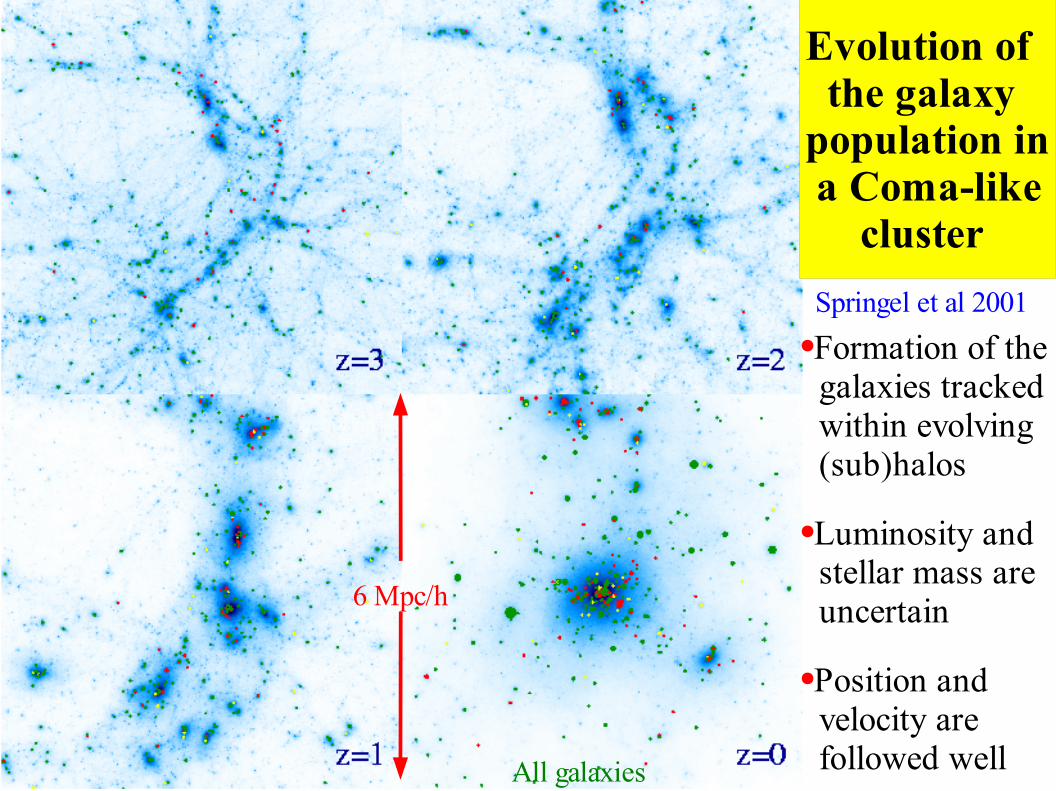
Evolution of the galaxy population in a Coma-like cluster
Springel et al 2001
●Formation of the galaxies tracked within evolving (sub)halos
●Luminosity and stellar mass are uncertain
●Position and velocity are followed wellAll galaxies
6 Mpc/h

Formation histories of cluster ellipticals
● Cluster mass is 7 x 10¹⁴M⊙/h
● 104 member ellipticals with MB< -18
● Stars form early● Most ellipticals assembled early● Many ellipticals accreted late
Springel et al2003

Science Goals for EDisCS
● Obtain a uniform photometric and spectroscopic database for a large and representative sample of galaxy clusters covering the last half of the Hubble time
● Characterise the sizes, luminosities, morphologies, internal kinematics, star formation and stellar populations of cluster galaxies
● Compare cluster samples at z=0.8, 0.5 and 0.1 (SDSS) to establish trends as a function of redshift and cluster properties
● Compare with high-resolution simulations of galaxy and galaxy cluster formation in a CDM universe to determine the role of various physical processes (e.g. harassment, stripping, strangulation, cannibalism, merging, induced star-formation, SN/AGN feedback) in establishing the properties of galaxies
EDisCS Participants
Co-I Team on Proposal 166.A-0162A. Aragon (Nottingham, UK) G. Kauffmann (MPA, D)R. Bender (Munich, D) Y. Mellier (IAP, F)P. Best (ROE, UK) R. Pello (Toulouse, F)M. Bremer (Bristol, UK) B. Poggianti (Padova, I)S. Charlot (IAP, F) H. Rottgering (Leiden, NL)D. Clowe (Bonn, D) P. Schneider (Bonn, D)J. Dalcanton (Seattle, US) S. White (MPA, D) P.I.B. Fort (IAP, F) D. Zaritsky (Tucson, US)P. Jablonka (Meudon, F)
Additional participantsM. Dantel (Meudon, F) S. Poirier (Meudon, F)G. De Lucia (MPA, D) G. Rudnick (MPA, D)V. Desai (Seattle, USA) R. Saglia (Munich, D)C. Halliday (Padova, I) L. Simard (DAO, Canada)B. Milvang-Jensen (MPE, D)

The EDisCS Strategy
● Select 15 bright candidates with zest ~ 0.5 and 15 with zest~ 0.8
from the Las Campanas Distant Cluster Survey (130 deg2)
● Image each field in 2 bands for 20min with FORS2 (3 FORS nights)
● Select 10+10 best cluster fields for deep imaging: VRIJK at z ~ 0.8, BVIK at z ~ 0.5 (11 FORS + 20 SOFI nights)
● 30min exposure of one FORS2 mask of each field to confirm reality of cluster (1.5 FORS nights)
● 3 or 4 FORS2 masks of each confirmed field at longer exposure to get spectra of representative systems to I=23 (20.5 FORS nights)
● Get HST/ACS imaging of 10 most distant fields (80 orbits)
● Get WFI 3-colour imaging of all 20 fields to study large-scale environment of clusters (84 hours of WFI imaging)
LP Allocation: 36 nights on FORS2 + 20 nights on NTT/SOFI

EDisCS Status
● Deep optical imaging is complete for all 20 cluster fields -- data are fully reduced, calibrated and combined -- photometry and image quality excellent (seeing 0.5 to 0.8 arcsec) -- preliminary weak lensing and morphology analysis complete
● Deep NIR imaging almost complete (one final night required) -- data through summer 2002 fully reduced, calibrated and combined with the optical (about 60% of total)
● Nineteen nights of FORS2 spectroscopy successfully completed -- data through summer 2002 fully reduced (about 38% of total) -- data quality good -- fully consistent with expected performance -- three nights still required to complete programme (14% of total)
● HST/ACS data currently being taken, first frames now reduced
● About 60% of WFI data taken and already reduced
● Large suite of high resolution simulations completed

High redshift but no detected lensing
clus=453±41km/s
from measuredredshifts
Clowe, Halliday
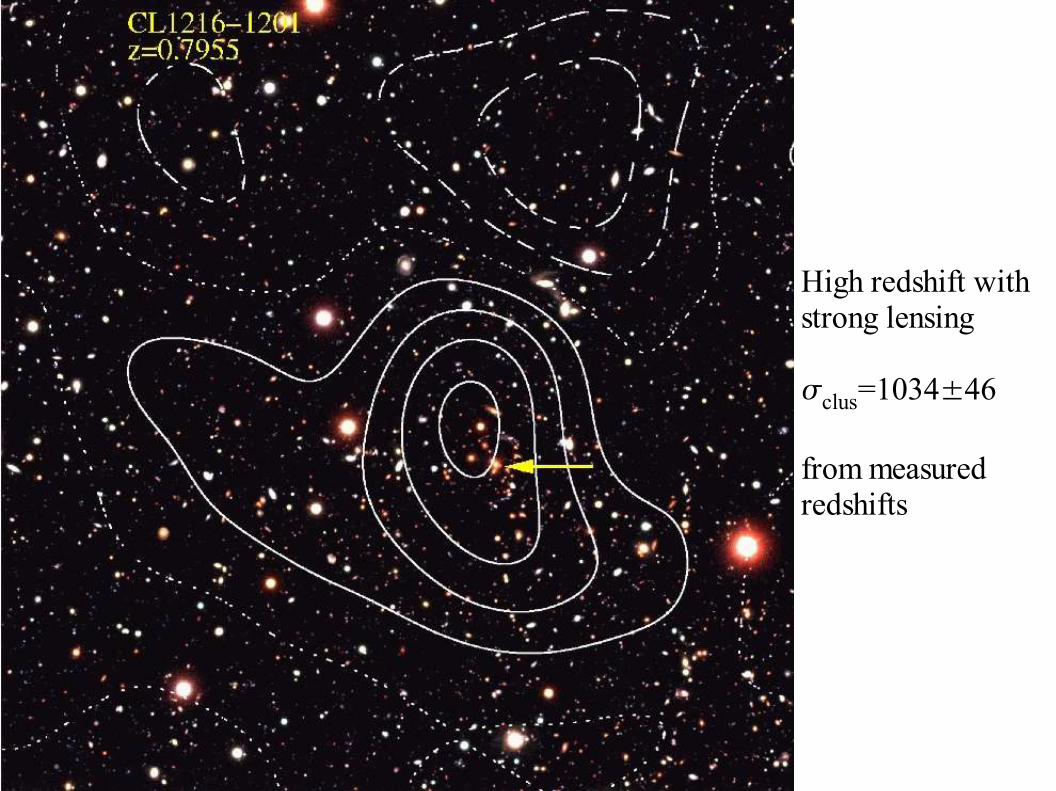
High redshift with strong lensing
clus=1034±46
from measured redshifts
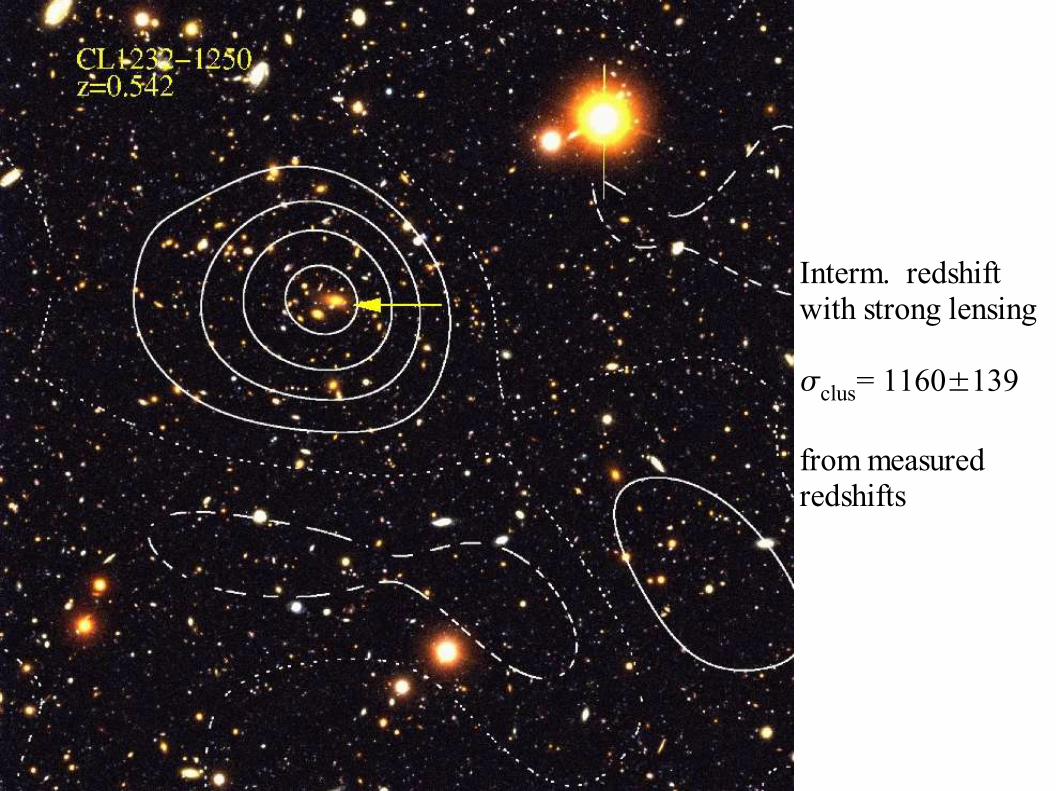
Interm. redshift with strong lensing
clus= 1160±139
from measuredredshifts

Interm. redshift with weak lensing
Insufficent spectrafor a robust clus
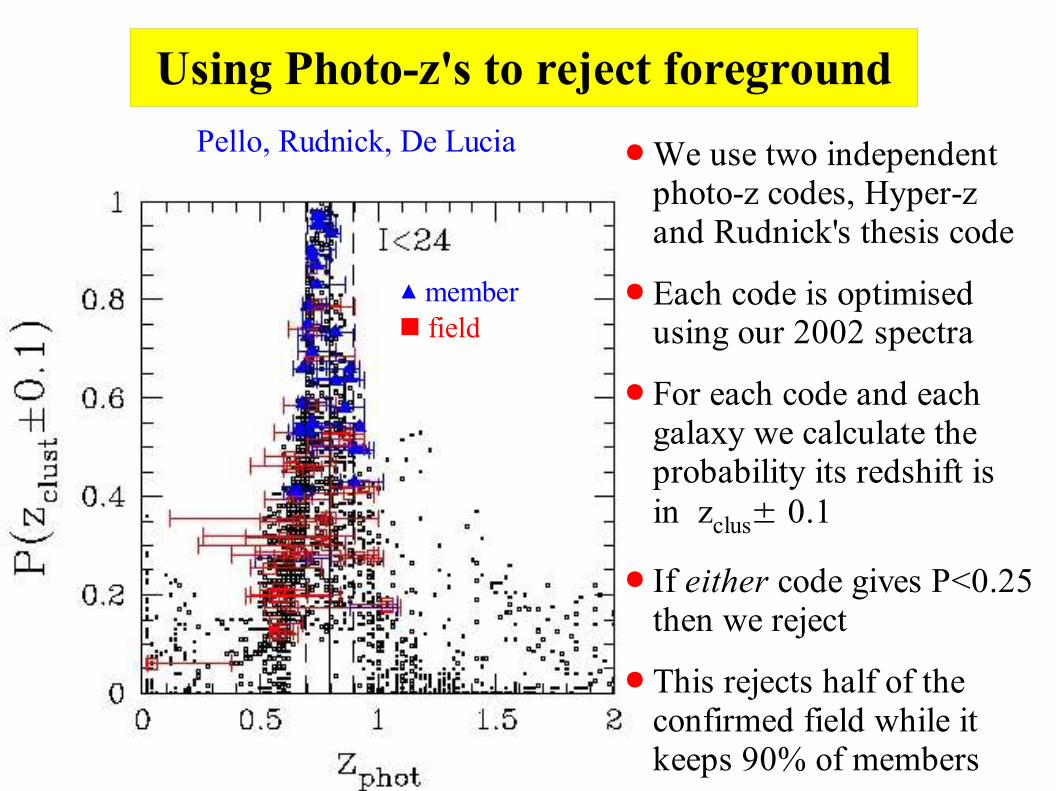
Using Photo-z's to reject foreground
▴ member■ field
Pello, Rudnick, De Lucia ● We use two independent photo-z codes, Hyper-z and Rudnick's thesis code
● Each code is optimised using our 2002 spectra
● For each code and each galaxy we calculate the probability its redshift is in zclus± 0.1
● If either code gives P<0.25 then we reject
● This rejects half of the confirmed field while it keeps 90% of members

Evolution of the cluster luminosity function
● Field-corrected cluster luminosity functions are well fit by the shape of the 2dF cluster LF both at z = 0.5 and z = 0.75
● Their characteristic L* are brighter at rest B by more than a magnitude
● This brightening is larger than expected from the aging of stars as inferred from fundamental plane studies ( ¬0.57 at z = 0.5 and ¬0.86 at z = 0.75)
Rudnick

Colour-Magnitude-Morphology Diagrams
● Field corrected C-M diagrams for typical clusters
● 'Morphologies' are B/T values derived from the 2D image fitting code GIM2D
● Clusters show a wide range of richness
● Strength of red sequence and of blue 'B-O' population is variable
● Many disky galaxies on the red sequence
Simard

HST/ACS F814W imageof cl1037-1243 at z=0.58
, Dalcanton, Desai

Cluster images: observation vs simulation
● Photo-z rejection used on real data
● Only galaxies with I < 25 used either in real or in simulated clusters
● Galaxy formation assumptions in simulations are as in Springel et al (2001)
De Lucia

Cluster Density Profiles
0.7 < z < 0.8, I < 24● Galaxies rejected by the photo-z's are not concen- trated to cluster centre
● Photo-z rejection gives enhances contrast by a factor of about 5
● Mean cluster profile is detected out to 1.5 Mpc
● Blue galaxies are much less concentrated to the cluster centre than red ones
De Lucia

EDisCS Spectra
Halliday, Poggianti
● FORS2 spectra are of very high quality
● Redshifts can measured to I ~ 23
● Line indices can be measured to I ~ 22.5
● Velocity dispersions can be measured accurately to I ~ 21.5

Emission fraction vs cluster velocity dispersion
Fraction of emission linegalaxies in FORS2 fieldcorrelates strongly withcluster velocity dispersion
Poggianti, Halliday
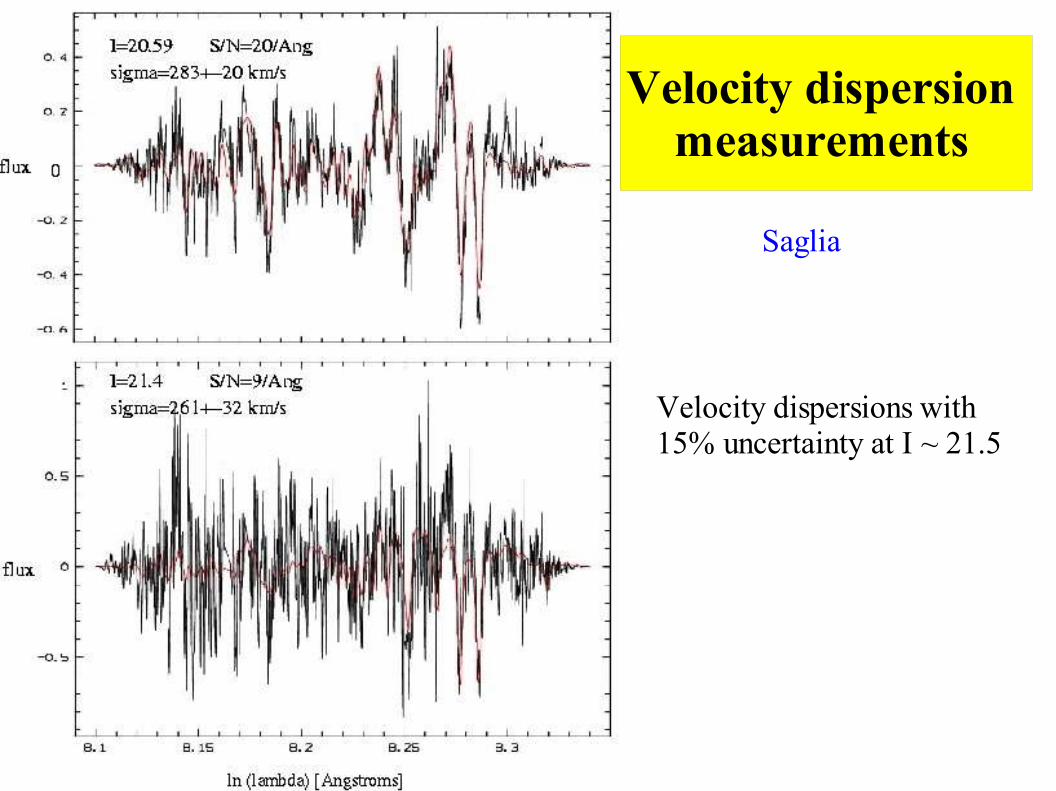
Velocity dispersion measurements
Saglia
Velocity dispersions with15% uncertainty at I ~ 21.5
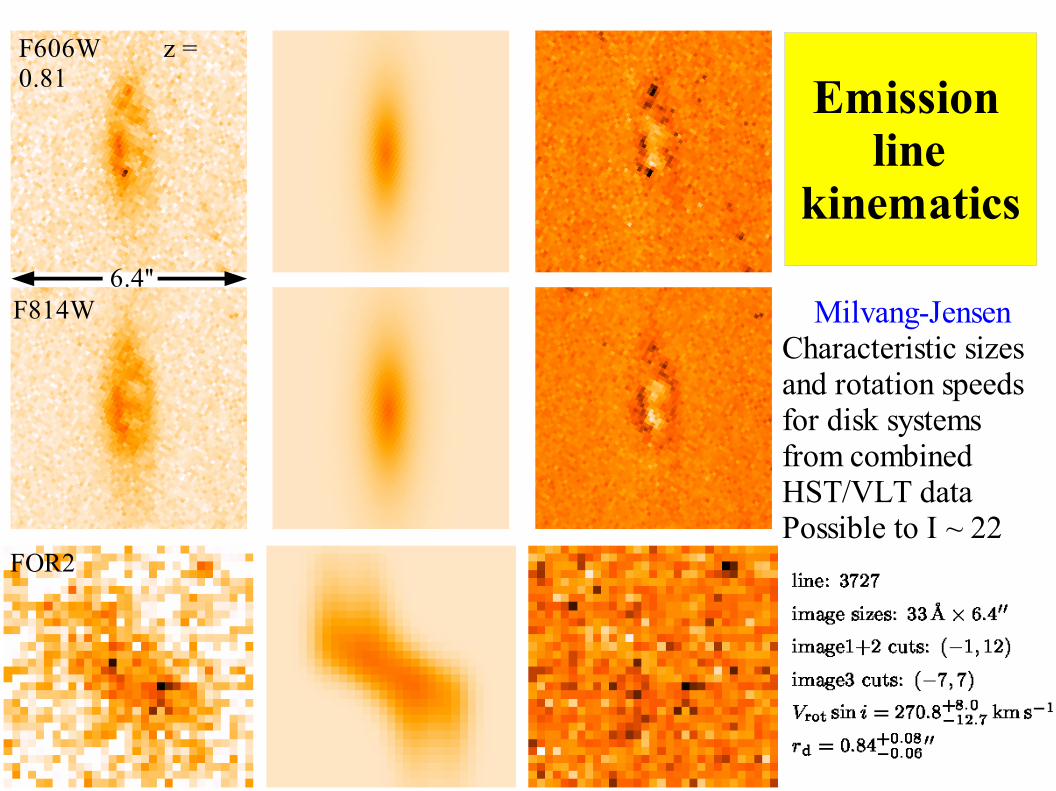
6.4''
F606W z = 0.81
F814W
FOR2
Milvang-JensenCharacteristic sizesand rotation speedsfor disk systems from combined HST/VLT data Possible to I ~ 22
Emission linekinematics

Expected statistics for final spectroscopy
If our final 3 spectroscopic nights are as successful as the previous 19,we expect our final EDisCS spectroscopic sample to contain:
Intermediate z fields High z fields Total 10 clusters 9 clusters
Spectra 1000 1300 2300
Redshifts 900 1200 2100
Cluster members 400 420 820
Accurate line indices 100 (+ 150 field) 150 (+ 250 field) 650
velocity dispersions 75 (+ 70 field) 110 ( + 70 field) 325
rotation curves 60 (+ 100 field) 80 (+ 130 field) 370
Accurate line indices for fainter galaxies will be obtained by stackingspectra for similar systems
Comments on Large Programmes
● EDisCS is only possible as a Large Programme and at ESO -- availability of full instrument suite (FORS2, SOFI, WFI) -- commitment to full time needed (incl. weather replacement) -- availability of service mode -- flexibility of scheduling -- high quality and reliability of typical nights at Paranal
● ESOs commitment to complete Large Programmes in a timely fashion helps to get time from other facilities -- EDisCS was the only large cluster programme to get time in the first round of HST/ACS allocations
● Large Programmes provide an opportunity to federate and develop European expertise in specific areas. This requires the internal atmosphere to be open and inclusive, rather than competitive