the esg advantage in fixed income investing · an empirical analysis kim nguyen-taylor ... founder...
TRANSCRIPT
The ESG Advantage in Fixed Income Investing:
An Empirical Analysis
Kim Nguyen-Taylor Director, Credit Analysis
Ivan Naranjo, CFA, FRM Associate Portfolio Manager
Catherine Roy, CFA Senior Vice President and
Chief Investment Officer for Fixed Income
2 T H E E S G A D V A N T A G E I N F I X E D I N C O M E I N V E S T I N G
Two decades ago, it seemed like ESG was going to be yet another fad in the CSR (corporate social responsibility) world when negative screens gave way to positive screens as the engine for socially responsible investing. How things have changed. As company efforts to address social and environmental problems through competitive mechanisms that generate profit and revenue become more sophisticated, so do the financial tools that allow investors to identify and target short and long term value creation. Welcome to the frontier of today’s ESG investing landscape where it is not just about identifying what a company should avoid or how it should operate, but it is also about identifying how a company frames its opportunities for growth.
Organizational value consists of many elements, including the abil-ity of a company to reduce its risk and costs, as well as to avoid cri-ses that undermine a firm’s legitimacy and right to operate among stakeholders. From the beginning, ESG has squarely focused on companies’ exposure to risk—not only in the short run, but over time as ever evolving problems such as poverty, ecosystem degra-dation, and climate change continue to shift companies’ operating environments. This is ESG on the cost side of the profit equation.
But organizational value also consists of a companies’ ability to understand where market trends are heading, where opportunities of the future will be and when they will be there, and the ability of a firm to be innovative and reposition itself so that its products and services remain relevant and in demand. This is what Ron Shaich, founder of Panera Bread, aptly described as the business leader’s challenge to try “to figure out where the world is going [to] make sure [the] company is there when the world arrives.”1 This is the revenue side of the profit equation and where ESG can provide investors better insight into the dynamics that create and sustain firm value.
To gain better understanding of which companies frame social and environmental issues as both indicators and catalysts of latent market opportunities is to develop better acumen into a firm’s long-term strategic positioning. In forward thinking companies, innovation and R&D aren’t simply guided by a desire to serve an existing customer base with known demand profiles.
Such firms seek to identify long-term trends that will impact the marketplace of the future where broad forces—social, technical, environmental, cultural, political—shape the need for new, and sometimes unfamiliar products and services.
ESG isn’t meant to be a yardstick to measure liberal and conser-vative values for what in the United States has become overly politicized conversation on critical global challenges. Rather, ESG tools provide investors more sophisticated ways to recognize and assess how our collective, evolving knowledge of the physical sci-ences, engineering, and social sciences impacts business growth.
Today’s ESG is shining a light on what we at Cornell’s Center for Sustainable Global Enterprise have seen in our work with companies for over a decade: companies carefully building vibrant businesses in areas that would have been hard to imagine ten years ago. Compelling examples include BASF’s aggressive revenue targets from new products that address long-standing challenges in the low income housing and construction industry. Or Emerson’s innovative work to generate chemicals from organic waste. Or SunEdison’s, efforts to build responsive, distributed power networks.
Like a growing number of investors, Calvert is using ESG not only to ensure firms aren’t exposed to unnecessary risks, but also to recognize and assess how companies are responding to changes in the world in an effort to grow revenues and create enduring value.
1. http://www.washingtonpost.com/business/on-small-business/when-we-were-small-panera-bread/2014/12/23/891baa5c-8ac5-11e4-9e8d-0c687bc18da4_story.html
Foreword
MARK B. MILSTEIN Clinical Professor of Management and Director of the Center for Sustainable Global Enterprise at the Samuel Curtis Johnson Graduate School of Management at Cornell University.
DR. MARK MILSTEIN is Clinical Professor of Management and Director of the Center for Sustainable Global Enterprise at the Samuel Curtis Johnson Graduate School of Management at Cornell University. He conducts applied research in and oversees the Center’s work on market and enterprise creation; business development; clean technology commercialization; and sustainable finance. Over the past decade, Milstein has worked with more than 80 firms across a range of industries, including renewable energy and carbon markets, life sciences and sustainable agriculture, consumables, food and nutrition, health care and hospitality management, as well as finance and international development. Professor Milstein’s writings have appeared in a number of journals including Science, Academy of Management Executive, and Sloan Management Review. He is a frequent speaker on the topics of strategy, organizational change and innovation related to business and sustainability, and consults with multi-national firms, small and medium sized enterprises, and NGOs.
T H E E S G A D V A N T A G E I N F I X E D I N C O M E I N V E S T I N G 3
Research Introduction: The Impact of ESG Analysis on Fixed income Investment Returns
The key objective in this backtested analysis was to validate the efficacy of ESG (environmental, social, and governance) performance on CDS (credit default swap) spreads over a 10-year period, using historical time-series data. Specifically, we evaluated the annual rate of change in CDS spreads for a universe of high-yield and investment-grade companies, broken down by fractiles based on their annual ESG scores. We conducted the analysis at an aggregate level as well as segregating by, and neutralizing the impact of, credit quality and sector impacts.
As in any statistical analysis, the quality of data is highly important in order to provide rigor to the test as well as mitigate the risk of analyzing inaccurate and mismanaged data and, thereby, arrive at wrongful conclusions. Due to the sensitivity of data in this analysis, a significant effort was made to capture standardized and reliable “clean” data for the universe under investigation. A disciplined approach of checks and balances and sample testing was executed when gathering the data to ensure its quality.
For this analysis, we chose to use CDS as a proxy for credit-spread performance given its following advantages: 1) isolation of credit risk given the instrument’s insensitivity to interest rate risk 2) constant maturity, removing the need for potential rolldown adjustments during the simulation, 3) standardized structure, given senior unsecured ranking and bullet maturity (lack of optionality), allowing for more accurate performance comparisons, and 4) high liquidity throughout the time frame, providing robust, continuous data, and more accurate reflection of price action. Moreover, in considering the segregation of the data, we decided to utilize a fundamental measure of leverage as opposed to using credit-agency ratings, given our belief that the former allows us to better and more quickly capture market re-pricing. For non-financial firms, for example, we used lease-adjusted leverage and lease-adjusted interest coverage
ratios as a way to divide our sample universe into sub-groups. Additionally, data was also organized by sector according to Global Industry Classification Standards (GICS).
RATIOS USED FOR NON-FINANCIAL FIRMS
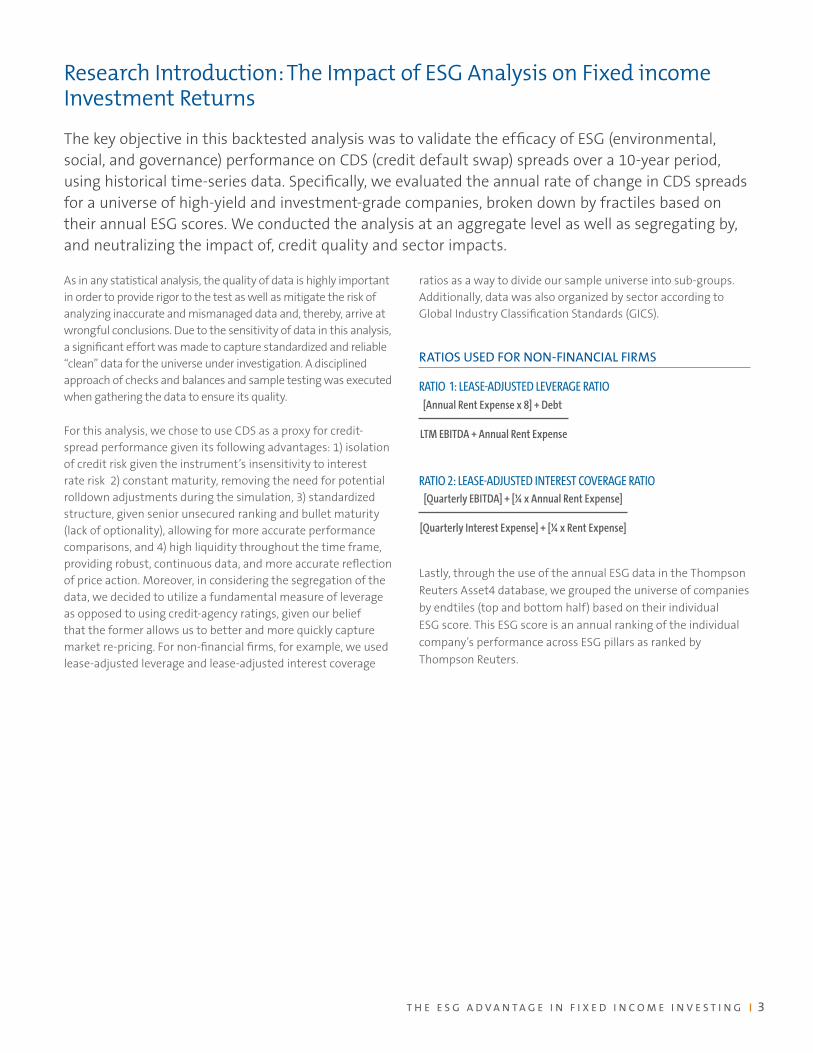
RATIO 1: LEASE-ADJUSTED LEVERAGE RATIO
[Annual Rent Expense x 8] + Debt
LTM EBITDA + Annual Rent Expense
RATIO 2: LEASE-ADJUSTED INTEREST COVERAGE RATIO[Quarterly EBITDA] + [¼ x Annual Rent Expense]
[Quarterly Interest Expense] + [¼ x Rent Expense]
Lastly, through the use of the annual ESG data in the Thompson Reuters Asset4 database, we grouped the universe of companies by endtiles (top and bottom half) based on their individual ESG score. This ESG score is an annual ranking of the individual company’s performance across ESG pillars as ranked by Thompson Reuters.
4 T H E E S G A D V A N T A G E I N F I X E D I N C O M E I N V E S T I N G
The Simulations: Evaluating ESG from Six Perspectives
The key objective of our simulations was to test the impact of ESG on the performance of CDS spreads from six perspectives, controlling for different leverage and sector impacts. The CDS performance was calculated as an annual percentage change in spread for each 5 year contract across the companies in the portfolio during the defined time horizon. Ultimately, the performance of the portfolio was measured in yearly intervals.
The simulation period was 12/31/2002 through 12/31/2012 and included all names with available and continuous CDS data throughout the period. It was assumed the portfolio would “buy and hold” securities, with quarterly rebalancing to maintain equal weighting for each holding in the portfolio. Rebalancing corrects any market over- or under-weight exposures caused by a security’s over- or under-performance during the quarter.
The rationale behind establishing equal weighting across the simulations was to remove the impact of any security and/or sector
bias in the attribution of returns in order to most effectively assess the impact of ESG factors on CDS spread performance.
The various simulations were classified as follows: 1) Overall ESG—leverage neutral 2) Individual ESG factors—leverage neutral3) Overall ESG—sector neutral 4) Individual ESG factors—sector neutral 5) Overall ESG—by leverage grouping6) Overall ESG—by leverage grouping, sector neutral
SIMULATION # 1: OVERALL ESG (This simulation was analyzed on a leverage-neutral basis.)
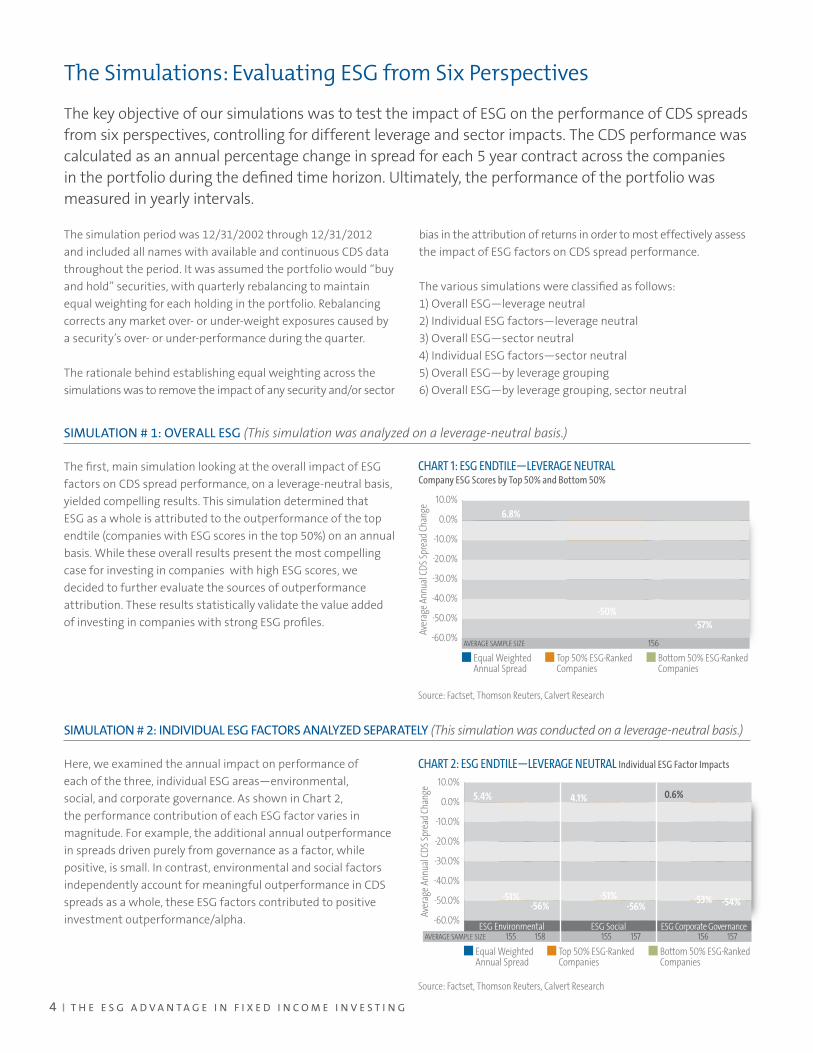
The first, main simulation looking at the overall impact of ESG factors on CDS spread performance, on a leverage-neutral basis, yielded compelling results. This simulation determined that ESG as a whole is attributed to the outperformance of the top endtile (companies with ESG scores in the top 50%) on an annual basis. While these overall results present the most compelling case for investing in companies with high ESG scores, we decided to further evaluate the sources of outperformance attribution. These results statistically validate the value added of investing in companies with strong ESG profiles.
SIMULATION # 2: INDIVIDUAL ESG FACTORS ANALYZED SEPARATELY (This simulation was conducted on a leverage-neutral basis.)
Here, we examined the annual impact on performance of each of the three, individual ESG areas—environmental, social, and corporate governance. As shown in Chart 2, the performance contribution of each ESG factor varies in magnitude. For example, the additional annual outperformance in spreads driven purely from governance as a factor, while positive, is small. In contrast, environmental and social factors independently account for meaningful outperformance in CDS spreads as a whole, these ESG factors contributed to positive investment outperformance/alpha.
CHART 1: ESG ENDTILE—LEVERAGE NEUTRAL Company ESG Scores by Top 50% and Bottom 50%
-60.0%
-50.0%
-40.0%
-30.0%
-20.0%
-10.0%
0.0%
10.0%
Equal Weighted Annual Spread
Top 50% ESG-Ranked Companies
Bottom 50% ESG-Ranked Companies
6.8%
-50%-57%
Aver
age
Annu
al C
DS
Spre
ad C
hang
e
AVERAGE SAMPLE SIZE 156
Source: Factset, Thomson Reuters, Calvert Research
CHART 2: ESG ENDTILE—LEVERAGE NEUTRAL Individual ESG Factor Impacts
AVERAGE SAMPLE SIZE 155 158
-60.0%
-50.0%
-40.0%
-30.0%
-20.0%
-10.0%
0.0%
10.0%
ESG Environmental
0.6%
-53% -54%
5.4%
-51%-56%
4.1%
-51%-56%
ESG Social ESG Corporate Governance
Aver
age
Annu
al C
DS
Spre
ad C
hang
e
Equal Weighted Annual Spread
Top 50% ESG-Ranked Companies
Bottom 50% ESG-Ranked Companies
155 157 156 157
Source: Factset, Thomson Reuters, Calvert Research
T H E E S G A D V A N T A G E I N F I X E D I N C O M E I N V E S T I N G 5
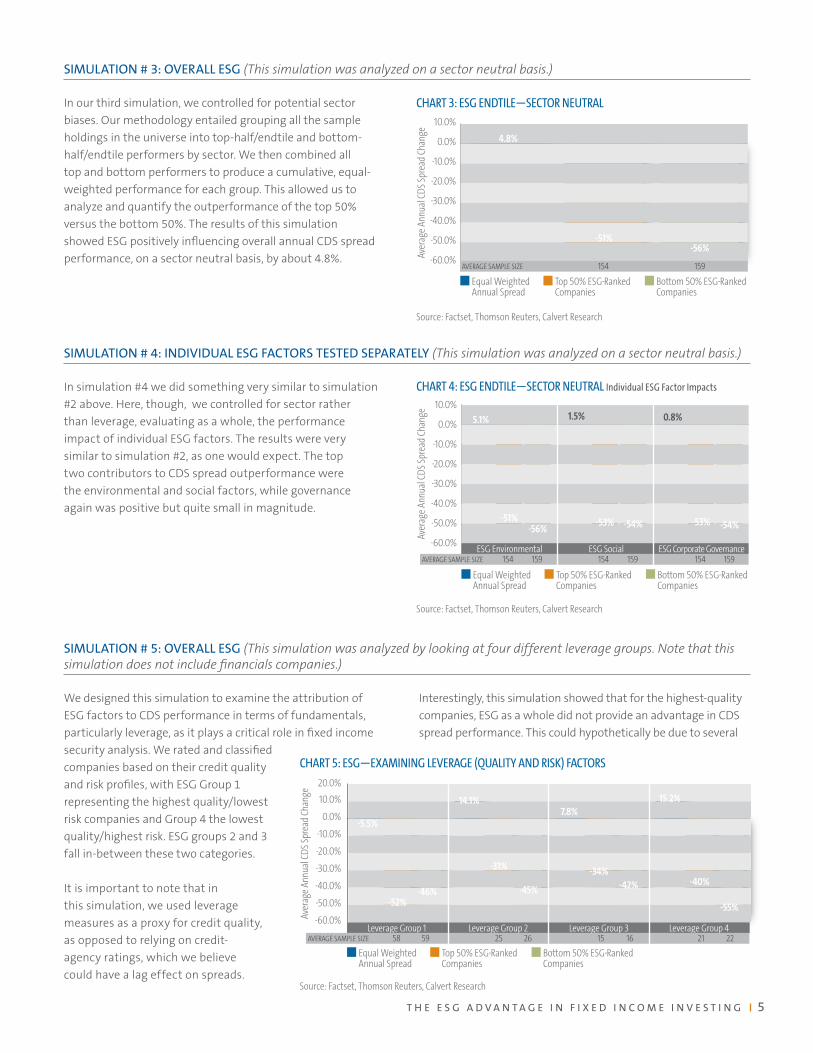
SIMULATION # 3: OVERALL ESG (This simulation was analyzed on a sector neutral basis.)
In our third simulation, we controlled for potential sector biases. Our methodology entailed grouping all the sample holdings in the universe into top-half/endtile and bottom-half/endtile performers by sector. We then combined all top and bottom performers to produce a cumulative, equal-weighted performance for each group. This allowed us to analyze and quantify the outperformance of the top 50% versus the bottom 50%. The results of this simulation showed ESG positively influencing overall annual CDS spread performance, on a sector neutral basis, by about 4.8%.
SIMULATION # 4: INDIVIDUAL ESG FACTORS TESTED SEPARATELY (This simulation was analyzed on a sector neutral basis.)
In simulation #4 we did something very similar to simulation #2 above. Here, though, we controlled for sector rather than leverage, evaluating as a whole, the performance impact of individual ESG factors. The results were very similar to simulation #2, as one would expect. The top two contributors to CDS spread outperformance were the environmental and social factors, while governance again was positive but quite small in magnitude.
SIMULATION # 5: OVERALL ESG (This simulation was analyzed by looking at four different leverage groups. Note that this simulation does not include financials companies.)
We designed this simulation to examine the attribution of ESG factors to CDS performance in terms of fundamentals, particularly leverage, as it plays a critical role in fixed income security analysis. We rated and classified companies based on their credit quality and risk profiles, with ESG Group 1 representing the highest quality/lowest risk companies and Group 4 the lowest quality/highest risk. ESG groups 2 and 3 fall in-between these two categories.
It is important to note that in this simulation, we used leverage measures as a proxy for credit quality, as opposed to relying on credit-agency ratings, which we believe could have a lag effect on spreads.
Interestingly, this simulation showed that for the highest-quality companies, ESG as a whole did not provide an advantage in CDS spread performance. This could hypothetically be due to several
CHART 4: ESG ENDTILE—SECTOR NEUTRAL Individual ESG Factor Impacts
-60.0%
-50.0%
-40.0%
-30.0%
-20.0%
-10.0%
0.0%
10.0%
5.1%
-51%-56%
1.5%
-53% -54%
0.8%
-53% -54%
ESG Environmental ESG Social ESG Corporate Governance
Equal Weighted Annual Spread
Top 50% ESG-Ranked Companies
Bottom 50% ESG-Ranked Companies
Aver
age
Annu
al C
DS
Spre
ad C
hang
e
AVERAGE SAMPLE SIZE 154 159 154 159 154 159
Source: Factset, Thomson Reuters, Calvert Research
CHART 3: ESG ENDTILE—SECTOR NEUTRAL
-60.0%
-50.0%
-40.0%
-30.0%
-20.0%
-10.0%
0.0%
10.0%
Equal Weighted Annual Spread
Top 50% ESG-Ranked Companies
Bottom 50% ESG-Ranked Companies
Aver
age
Annu
al C
DS
Spre
ad C
hang
e
4.8%
-51%-56%
AVERAGE SAMPLE SIZE 154 159
Source: Factset, Thomson Reuters, Calvert Research
CHART 5: ESG—EXAMINING LEVERAGE (QUALITY AND RISK) FACTORS
-60.0%
-50.0%
-40.0%
-30.0%
-20.0%
-10.0%
0.0%
10.0%
20.0%
Leverage Group 1
-52%-46%
Leverage Group 2 Leverage Group 3 Leverage Group 4
14.1%
-31%
-45%
7.8%
-34%-42%
15.2%
-40%
-55%
-5.5%
Equal Weighted Annual Spread
Top 50% ESG-Ranked Companies
Bottom 50% ESG-Ranked Companies
Aver
age
Annu
al C
DS
Spre
ad C
hang
e
AVERAGE SAMPLE SIZE 58 59 25 26 15 16 21 22
Source: Factset, Thomson Reuters, Calvert Research
6 T H E E S G A D V A N T A G E I N F I X E D I N C O M E I N V E S T I N G
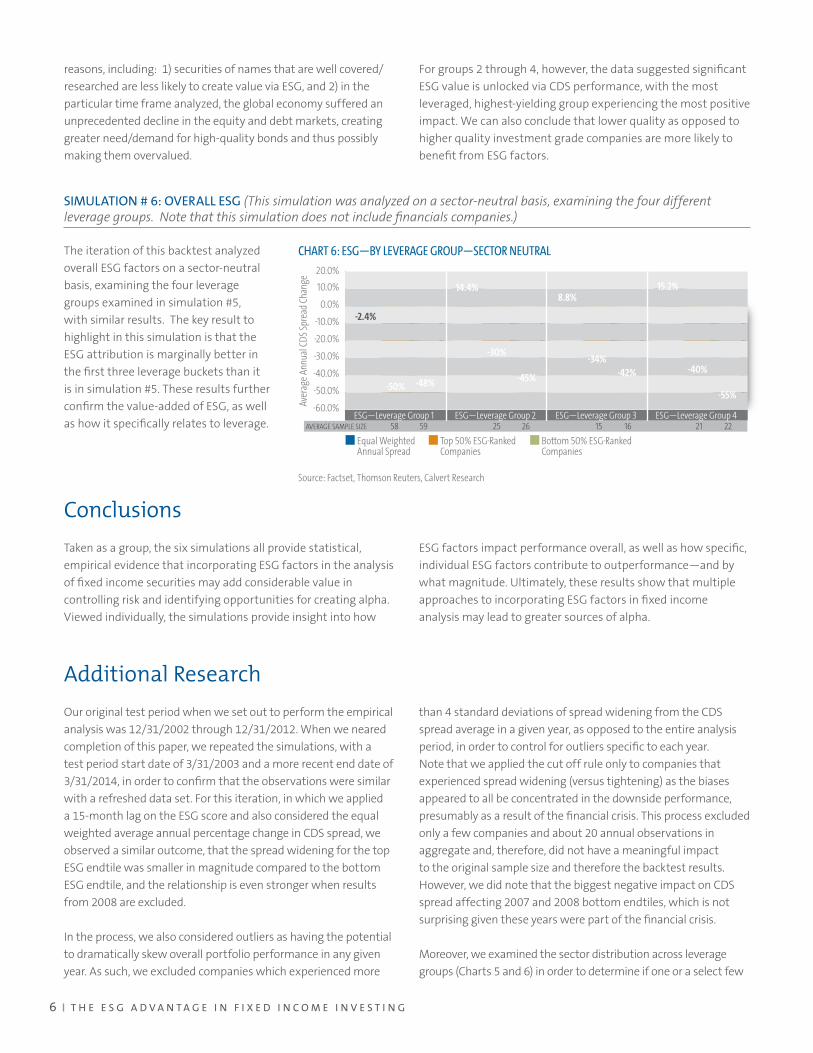
reasons, including: 1) securities of names that are well covered/researched are less likely to create value via ESG, and 2) in the particular time frame analyzed, the global economy suffered an unprecedented decline in the equity and debt markets, creating greater need/demand for high-quality bonds and thus possibly making them overvalued.
For groups 2 through 4, however, the data suggested significant ESG value is unlocked via CDS performance, with the most leveraged, highest-yielding group experiencing the most positive impact. We can also conclude that lower quality as opposed to higher quality investment grade companies are more likely to benefit from ESG factors.
SIMULATION # 6: OVERALL ESG (This simulation was analyzed on a sector-neutral basis, examining the four different leverage groups. Note that this simulation does not include financials companies.)
The iteration of this backtest analyzed overall ESG factors on a sector-neutral basis, examining the four leverage groups examined in simulation #5, with similar results. The key result to highlight in this simulation is that the ESG attribution is marginally better in the first three leverage buckets than it is in simulation #5. These results further confirm the value-added of ESG, as well as how it specifically relates to leverage.
Conclusions
Taken as a group, the six simulations all provide statistical, empirical evidence that incorporating ESG factors in the analysis of fixed income securities may add considerable value in controlling risk and identifying opportunities for creating alpha. Viewed individually, the simulations provide insight into how
ESG factors impact performance overall, as well as how specific, individual ESG factors contribute to outperformance—and by what magnitude. Ultimately, these results show that multiple approaches to incorporating ESG factors in fixed income analysis may lead to greater sources of alpha.
Additional Research
Our original test period when we set out to perform the empirical analysis was 12/31/2002 through 12/31/2012. When we neared completion of this paper, we repeated the simulations, with a test period start date of 3/31/2003 and a more recent end date of 3/31/2014, in order to confirm that the observations were similar with a refreshed data set. For this iteration, in which we applied a 15-month lag on the ESG score and also considered the equal weighted average annual percentage change in CDS spread, we observed a similar outcome, that the spread widening for the top ESG endtile was smaller in magnitude compared to the bottom ESG endtile, and the relationship is even stronger when results from 2008 are excluded.
In the process, we also considered outliers as having the potential to dramatically skew overall portfolio performance in any given year. As such, we excluded companies which experienced more
than 4 standard deviations of spread widening from the CDS spread average in a given year, as opposed to the entire analysis period, in order to control for outliers specific to each year. Note that we applied the cut off rule only to companies that experienced spread widening (versus tightening) as the biases appeared to all be concentrated in the downside performance, presumably as a result of the financial crisis. This process excluded only a few companies and about 20 annual observations in aggregate and, therefore, did not have a meaningful impact to the original sample size and therefore the backtest results. However, we did note that the biggest negative impact on CDS spread affecting 2007 and 2008 bottom endtiles, which is not surprising given these years were part of the financial crisis.
Moreover, we examined the sector distribution across leverage groups (Charts 5 and 6) in order to determine if one or a select few
CHART 6: ESG—BY LEVERAGE GROUP—SECTOR NEUTRAL
-60.0%
-50.0%
-40.0%
-30.0%
-20.0%
-10.0%
0.0%
10.0%
20.0%
ESG—Leverage Group 1
-50% -48%
ESG—Leverage Group 2 ESG—Leverage Group 3 ESG—Leverage Group 4
14.4%
-30%
-45%
8.8%
-34%-42%
15.2%
-40%
-55%
-2.4%
Equal Weighted Annual Spread
Top 50% ESG-Ranked Companies
Bottom 50% ESG-Ranked Companies
Aver
age
Annu
al C
DS
Spre
ad C
hang
e
AVERAGE SAMPLE SIZE 58 59 25 26 15 16 21 22
Source: Factset, Thomson Reuters, Calvert Research

T H E E S G A D V A N T A G E I N F I X E D I N C O M E I N V E S T I N G 7
sectors were over-represented in a given leverage group, therefore causing a bias in the results and affecting our overall observations. However, we did not recognize any biases in the sector distribution across leverage groups and, therefore, the results still suggested to us that significant ESG value is unlocked via CDS performance, with the most leveraged group experiencing the most positive impact.
Last but not least we tested for market capitalization bias to further enhance the control. We observed that there was a meaningful large cap bias (i.e. larger cap names in top endtile). However, when controlling for leverage and market capitalization, the predictive relationship between high (low) ESG scores and improving (deteriorating) CDS performance still exists.
Shortcomings
Given the nature of statistical and time-series analysis, there may be some shortcomings in the analysis that in our view are worth considering.
FREQUENCY OF CDS QUOTES—Credit default swaps were not as frequently quoted/traded at the beginning of the time horizon neither in this study nor across a meaningfully wide scope of firms in the universe being sampled. This was primarily observed in the first and second year of the simulation but from then on, the quoting frequency and breadth of firms with CDS available to trade grew exponentially.
SURVIVORSHIP BIAS—Moreover, it is important to note that there is inherent survivorship bias, particularly due to the unprecedented recession experienced in the US as well as the global markets. In the case of the financial sector, there were multiple bankruptcies as well as mergers and acquisitions. During the data-gathering and data-mining processes, we addressed this shortcoming by incorporating the old entity with the purchasing/new entity and obtaining uninterrupted data for the specific firm.
LIMITED SAMPLE SIZES—The universe which we initially used was the Barclays US Credit Investment Grade and High Yield Indexes, which are comprised of approximately 950 and 1020 issuers respectively (varies with reconstitution; as of 6/15/15, there were 954 and 1022 issuers respectively). These companies include global issuers that are SEC-registered and have US dollar denominated debt. From this universe, we were able to retrieve CDS data for 390 issuers. Of the 390 issuers, only 313 had ESG data, while 77 did not have ESG data available. Hence our sample size was reduced substantially from the initial universe. Additionally, analyzing ESG scores against CDS spread performance on an individual sector level yielded small sub-groups of data in the sample. While we did not discuss this particular simulation in this paper due to our concerns about drawing conclusions based on a limited set of data, we did observe a relationship between positive CDS performance and good ESG scores. We made this same observation when we used the entire data set.
KIM NGUYEN-TAYLOR is a director in credit analysis for Calvert Investment Management, responsible for fundamental/relative value analysis as well as leading the environmental, social, and governance (ESG) integration strategy for Calvert’s fixed-income portfolios. Prior to joining Calvert in 2010, she was a managing director at Bear Stearns Asset Management, and vice president at JP Morgan in New York, working on teams managing institutional separate-managed accounts, as well as collateralized loan obligations and proprietary credit portfolios. At these firms, Ms. Taylor worked for a combined 10 years in a buy-side credit analyst role within the corporate bond, leveraged loan, and credit derivative markets. Ms. Taylor focused on distressed and high-yield investments across the retail, consumer products, and other industrial sectors. While at JP Morgan, she also worked in private banking and credit derivative sales. She began her career in the financial economics consulting group at Arthur Andersen in New York. Ms. Taylor holds a B.A. in economics from Cornell University. She is FINRA Series 7 and 63 licensed.
IVAN NARANJO, CFA, FRM, is an associate portfolio manager for Calvert Investment Management, Inc. He joined Calvert in 2007 as a junior trading assistant and has worked in the financial industry since 2004. Mr. Naranjo is responsible for interest rates strategy and execution as well as supporting portfolio management/construction, relative value analysis, and quantitative analysis across asset classes. Before coming to Calvert, he worked as a portfolio analyst for Rydex Funds, focusing on Equity Index leveraged mutual funds and ETFs. Mr. Naranjo holds a degree in finance from the University of Maryland - Robert H. Smith School of Business. He received his CFA designation in 2013 and is a member of the CFA Institute and CFA Society of Washington, D.C. Additionally, he received his FRM designation in 2014 and is a member of the Washington, D.C chapter.
CATHERINE ROY, CFA, Senior Vice President and Chief Investment Officer Fixed Income, also serves as lead portfolio manager on the Calvert Green Bond Strategy Portfolio and is a member of the Calvert Asset Allocation and Balanced Funds Committee. Ms. Roy joined Calvert in August, 2004. She has been in the financial services industry since 1981. Before joining Calvert, Ms. Roy was Head of U.S. Fixed Income and Senior Portfolio Manager for Baring Asset Management. Her responsibilities included investment oversight of U.S. fixed income portfolios, lead manager on the Core Plus Fixed Income Strategy, and U.S. sector specialist on the global bond asset allocation committee. She also served as the U.S. dollar sector specialist, providing insight and U.S. Treasury Yield forecasts into the firm’s global optimization models. Prior to her work at Baring Asset Management, Ms. Roy was S.V.P and Senior Portfolio Manager with Scudder Insurance Asset Management, managing over $11 billion in fixed income assets for insurance companies, with a primary focus on U.S. dollar investment grade taxable securities. Other positions include serving as Chief Investment Officer and Portfolio Manager with Massachusetts-based insurance companies SBLI and Constitution Capital Management. Past Board positions include The Greater Washington YWCA (board member and Investment Committee Chair) and Leadership Montgomery (Investment Committee Chair). Ms. Roy holds an undergraduate degree from Barnard College. She is a member of the CFA Institute and CFA Society of Washington, DC.
About the Authors
About Calvert Investments
A global leader in responsible investing, Calvert Investments is a diversified investment management firm that provides mutual funds and separate accounts to institutional investors, retirement plans, financial intermediaries and their clients. We offer a broad array of equity, fixed income, and multi-asset investment strategies that feature integrated environmental, social, and governance research and corporate engagement. Founded in 1976 and based in Bethesda, Maryland, Calvert Investments managed assets of more than $13.0 billion as of June 30, 2015.
All views and opinions expressed are being presented for informational and educational purposes only, represent the views and opinions of the author(s) as of the date of the writing and are subject to change without notice. These views and opinions are not intended to forecast future events or guarantee future results and do not constitute a recommendation or a solicitation to buy or sell any security. This information does not take into account the specific investment objective, financial situation, or specific needs of any individual, does not provide information reasonably sufficient upon which to base an investment decision and should not be relied upon as investment advice. This information has been obtained from sources believed to be reliable, but Calvert makes no representation as to its accuracy or completeness.
The ESG strategies used by an investment manager may fail to produce the intended result. In addition, information used to evaluate the ESG performance of issuers and industries may not be readily available, complete, or accurate, which could negatively impact both the investment manager’s application of ESG standards and Fund performance.
Calvert Investments is a registered trade name representing Calvert Investments, Inc. and its subsidiaries, including Calvert Investment Management, Inc., an SEC-registered investment adviser, and Calvert Investment Distributors, Inc., a FINRA member broker/dealer and distributor of the Calvert mutual funds.
WP10011-201506
www.Calvert.com