the environmental performance of car companies
TRANSCRIPT

Automaker Rankings 2004
The Environmental Performance of Car Companies
Honda • Nissan • Toyota • Ford • DaimlerChrysler • General Motors

Automaker Rankings 2004
The Environmental Performance of Car Companiesof Car Companiesof
David FriedmanDon MacKenzie
Union of Concerned ScientistsDecember 2004

ii Union of Concerned Scientists
© 2004 Union of Concerned Scientists
All rights reserved
David Friedman is research director for the Union of Concerned Scientists Clean Vehicles Program. Don MacKenzie is a vehicles engineer in the Union of Concerned Scientists Clean Vehicles Program.
The Union of Concerned Scientists is a nonprofit partnership of scientists and citizens combining rigorous scientific analysis, innovative policy devel-opment, and effective citizen advocacy to achieve practical environmental solutions.
The Union of Concerned Scientists Clean Vehicles Program develops and promotes strategies to reduce the adverse environmental impact of the U.S. transportation system.
More information about the Union of Concerned Scientists is available on the UCS website at www.ucsusa.org.
The full text of this report is available online at www.ucsusa.org or may be obtained from:www.ucsusa.org or may be obtained from:www.ucsusa.org
UCS PublicationsTwo Brattle SquareCambridge, MA 02238-9105
Or email [email protected] or call (617) [email protected] or call (617) [email protected]
Designed by Rob Catalano/Catalano Design
Printed on recycled paper

Automaker Rankings 2004
Figures and Tables iv
Acknowledgments v
Executive Summary 1
The Environmental Image of Automakers 5
Passenger Vehicle Pollution 5
Ranking Method 7
Pollution Ranking Results 9
Fleet Comparisons 9
Car and Truck Comparisons 11
Class Comparisons 12
Box: Update: Ford’s Voluntary Commitment 15 to Increasing Fuel Economy
Model Comparisons 16
The Flex-Fuel Vehicle Loophole 17
Total Pollution Impact 19
Conclusions 22
Individual Automaker Results 22
Lessons Learned 24
Creating Pollution Progress 25
References 27
Appendix A: Methodology 29
Automakers Evaluated 29
Classification of Vehicles 29
Pollutants Evaluated 30
Data Sources 31
Data Analysis 32
Test Results vs. Real-World Conditions 34
Appendix B: Detailed Data Tables 35
iii
Contents

Union of Concerned Scientistsiv
Figures
ES-1. Relative Emissions vs. Big Six Average 2
1. MY03 Environmental Standards for Cars vs. Trucks 7
2. Types of Pollution Comparisons 9
3. Emissions vs. Big Six Averages, Cars and Trucks 12
4. Car and Truck Smog-Forming Emissions, by Class 13
5. Car and Truck Heat-Trapping Emissions, by Class 14
6. SUV Fuel Economy Trends 15
7. Combined Emission Scores of Popular Car Models 18
8. Combined Emission Scores of Popular SUV Models 19
9. Combined Emission Scores of Popular Pickup and Minivan Models 20
10. Total Pollution Impact and MY03 Sales 21
Tables
ES-1. Automaker Pollution Ranking for Average New-Vehicle Emissions 1
1. Automaker Pollution Ranking for Average New-Vehicle Emissions 10
2. Relative Emissions vs. Big Six Average, by Model Year 10
3. MY03 Average Emissions, by Manufacturer 11
4. Combined Emission Scores vs. Big Six Average, by Class 16
A-1: Light-Duty Truck Classes, by Weight 29
A-2. Common Heat-Trapping Gases from Vehicles 31
A-3. Sales Area Splits 33
B-1. Car and Truck Fuel Economy (mpg), by Class 35
B-2. Car and Truck Smog-Forming Emissions (g/mi), by Class 35
B-3. Combined Emission Scores vs. Big Six Average, by Class 35
B-4. Effect of Flex-Fuel Vehicle Credits on Corporate 36 Average Fuel Economy
B-5. Truck Fuel Economy and Smog-Forming Emissions, by Type 36
B-6. Automaker Sales, by Class 37
B-7. Characteristics of Leading Car Models 38
B-8. Characteristics of Leading Truck Models 39
Figures and Tables

Automaker Rankings 2004
Support for this work was provided by Foundation M, Oak Foundation, Jon and NoraLee Sedmak, Steven and Michele Kirsch Foundation, The Energy Foundation, The William and Flora Hewlett Foundation, V. Kann Rasmussen Foundation, and Wallace Global Fund.
The authors would like to thank Jessica Biegelson for her assistance with the database, and Jason Mark and Rich Hayes for their insightful comments. Thanks also go to Heather Tuttle for editing under a tight deadline and Rob Catalano for layout.
The opinions expressed in this report do not necessarily reflect the opinions of the founda-tions that supported the work. The Union of Concerned Scientists is solely responsible for the contents of this report.
Acknowledgments
v

Union of Concerned Scientists
The pollution performance of just a handful of corporations has a dramatic impact on
the air we breathe and the climate we will pass on to future generations. The six largest auto-makers in the U.S. market—General Motors (GM), Ford, DaimlerChrysler, Toyota, Honda, and Nissan—are responsible for more than 90 percent of the heat-trapping and smog-forming emissions from new automobiles today. This lackluster environmental performance gives the industry a negative image and increases con-cern among investors that automakers are poorly positioned in a global market where environmen-tal stewardship is becoming a competitive priority.
This report uses government data to pro-vide a quantitative analysis of automakers’ envi-ronmental performance. By presenting a clear, objective ranking of the Big Six automakers, this report can help consumers, investors, and lawmakers sort through manufacturers’ billion-dollar advertising campaigns and public relations efforts to find out which one is truly the green-est when the rubber meets the road. We analyze the average emissions of the fleet of cars, SUVs, minivans, and pickups sold by these six car com-panies to rank their performance based on an
equal weighting of their relative contribution to smog and global warming.
Ranking ResultsClear differences exist among the automakers when it comes to environmental performance. Since our first automaker ranking report, for model year 1998 (MY98), a trend has emerged for the market leaders and laggards (Table ES-1): Honda has consistently remained at the top, representing the cleanest of the Big Six auto-makers, while GM has consistently fallen in our rankings, from fourth place in our first ranking to last place in 2003, the latest model year for which data were publicly available. The differ-ence between Honda and GM is most apparent in smog-forming pollution; Honda’s vehicles produce less than half the pollution of the fleet average, while GM’s produce nearly a third more than the average (Figure ES-1).
The pollution performance for other auto-makers has been less consistent, with Nissan taking over second place from Toyota due to reduced contributions to smog and global warm-ing, Ford holding its position after making gains in MY01, and DaimlerChrysler moving out
Table ES-1. Automaker Pollution Ranking for Average New-Vehicle Emissions
Rank Model Year 1998 Model Year 2001 Model Year 2003
1 Honda Honda Honda
2 Toyota Toyota Nissan
3 Nissan Nissan Toyota
4 GM Ford Ford
5 Ford GM DaimlerChrysler
6 DaimlerChrysler DaimlerChrysler GM
Executive Summary
1

Automaker Rankings 2004
of last place for the first time in our rankings. Overall, the smog-forming pollution performance of the industry continues to improve in response to new regulations, while global warming pollu-tion performance remains stuck in neutral.
Lessons LearnedGiven cases of progress and regression over the time period of our rankings, several important observations appear:
Trucks don’t have to be an environmental
liability. Ford and Honda put technology to work to cut their overall smog-forming pollution despite increased truck sales.
Regulations spur environmental progress.
When regulations are in place, automakers not only abide by the law and clean up their vehicles, but several go above and beyond the minimum requirements and distinguish themselves through early compliance.
Regulatory loopholes discourage environ-
mental progress. Automakers that take full advantage of loopholes trail the industry in environmental performance. Current regula-
tions allow trucks to pollute more than cars and allow some vehicles to flout fuel economy rules. Closing these loopholes will deliver important environmental gains.
Automakers are jeopardizing our future by
ignoring climate change. The poor performance of all automakers on reducing heat-trapping emissions from their vehicles indicates they are doing little to tackle the problem of climate change, despite broad availability of technology for addressing the problem.
Creating Pollution ProgressIf we are to tackle the pollution problems that face our world today and in the years ahead, all automakers will have to focus on real solu-tions over rhetoric. Improving the pollution performance of their fleets will enhance their environmental image and help attract consumers and investors. But success doesn’t depend on the efforts of automakers alone; consumers, inves-tors, and policy makers will have to do their part as well. Based on our findings, we recommend the following actions:
Toyota (3)
DaimlerChrysler (5)
Ford (4)
GM (6)
Honda (1)
Nissan (2)
Smog-Forming
Heat-Trapping
0% 20% 40% 60% 80% 100% 120% 140%
Emissions vs. Big Six Average
Big Six Average
82%48%
94%70%
88%84%
107%91%
104%114%
104%129%
Figure ES-1. Relative Emissions vs. Big Six Average
2

Union of Concerned Scientists
Automakers
Put technology to work. Ford, Honda, and Nissan have demonstrated the effectiveness of putting technology to work across much of their fleets to cut smog-forming pollution, and the other automakers should follow their lead. A similar approach is needed to address global warming; automakers must tap into the broad variety of existing technologies that can cut car-bon dioxide and other heat-trapping emissions from vehicle operation while saving consumers money at the gas pump (Bedsworth 2004).
Don’t block environmental progress. Nothing hurts the environmental image of an automaker more than standing in the way of policies that protect the environment and public health. In order to increase the confidence of investors, par-ticipate as a good corporate citizen, and expand their consumer base, automakers should support federal and state environmental laws instead of using lawyers and lobbyists to block them.
Increase “true green” marketing. Automakers and their dealers should do much more to pro-mote their greener products and educate con-sumers about the opportunities for reducing the impact of driving by devoting an increased share of their $18 billion annual advertising budget to promote real-world environmental improvements.
Government, Investors, and Consumers
Promote corporate responsibility. Automakers at the leading edge of environmental stewardship are best positioned for financial success over the coming years. Investors can accelerate change by putting their money in companies where envi-ronmental progress is being made, to send aclear signal to the market on the need for an increased focus on cutting smog and global warming pollution. Investors can also play a key role by using existing shares in dirtier companies to leverage change.
Increase government support. Strong prog-ress has been made in addressing smog-forming pollution. The same success needs to be repli-cated with global warming by creating effective programs to increase alternative fuel use, improve fuel economy, and directly regulate global warm-ing emissions.
Purchase cleaner cars. Consumers should always choose the cleanest, most efficient car or truck that meets their needs. This sends a clear message to automakers that environmental per-formance is more important than environmen-tal image. When all else is equal between two vehicles, consumers can use these rankings to help decide how to use their purchasing power to reward the better overall automaker.
3

Automaker Rankings 2004
1. Honda showed that it deserves its image as the greenest automaker, extending its lead in MY03. Honda’s vehicles produced less than half the smog-forming pollutants of the industry average, and 18 percent less heat-trapping gas emissions. Honda’s lead on smog results from certifying more than half of its models to meet or beat 2007 federal emission standards. Honda’s lead on global warming pollution, however, has been falling fast. Its increased truck sales have not been offset by enough technology gains to match past per-formance, while on cars, Toyota is nipping at its heels.
2. Nissan climbed from third place to sec-ond place compared with our last ranking. It achieved the largest improvement on global warming pollution since MY01 (six percent) and the second-largest improvement on smog-forming pollution (nine percent) by certifying all of its vehicles to meet or beat California’s tighter smog standards and increasing its emphasis on car sales. Nissan’s cars, however, continue to move backward on global warm-ing pollution. Its trucks improved to the same level as Toyota’s by increasing the fuel econ-omy of almost every truck and shifting sales from SUVs to a more efficient “crossover” vehicle, the Murano.
3. Toyota’s slip into third place is a reflec-tion of Nissan’s pollution progress as well as insufficient effort on the part of Toyota. Toyota’s fleet remains cleaner than the average, but its truck performance was relatively stag-nant. If it had kept up with Nissan on smog, its superior global warming pollution perfor-mance would have kept it in second place.
4. Ford’s environmental image has become increasingly puzzling: it maintained a fourth place standing with cars that matched Toyota’s smog-forming pollution performance for the first time in our analysis, but also had the absolute worst heat-trapping gas emission performance of all the Big Six automakers. This makes Ford’s commitment to the envi-ronment appear half-hearted. In addition, Ford publicly walked away from its com-mitment to improve the fuel economy of its SUVs, which fell back almost to MY00 levels.
5. DaimlerChrysler moved into fifth place (up from last place in our 2002 ranking) due to GM’s poor performance as well as a modest fuel economy improvement from the trucks that make up two-thirds of its sales. It had an overall improvement, albeit small, on global warming pollution despite increased light truck sales since MY01. Many significant black marks still remain on DaimlerChrysler’s record, however, including many abuses of regulatory loopholes that allow its fleet to remain below federal fuel economy standards.
6. General Motors bottomed out in our rankings, going from the best of the Big Three to the worst over the past six model years. GM was the only company whose vehicles emitted more smog-forming and global warming pollution per vehicle in MY03 than in MY01. Despite many tech-nology announcements and a commitment to lead the Big Three on fuel economy, GM’s trucks were worse than Ford’s and DaimlerChrysler’s. Had GM followed Ford’s lead on smog-forming emissions from its trucks, it would have moved into fourth place in the overall rankings.
Key Results, by Automaker
4

Union of Concerned Scientists
The auto industry sits squarely at the center of many of the environmental problems
facing the world today. Passenger vehicles in the United States are responsible for one-fifth of the nation’s smog-forming pollution, and result in emissions of more carbon dioxide (CO2), the heat-trapping gas primarily responsible for global warming, than most countries emit from all sources combined.1 This has created an image problem for the auto industry—a problem it is seeking to solve with advertising campaigns, press releases, and the unveiling of “greener” products at auto shows.2
In 2003 alone, automakers and their fran-chised dealers spent $18 billion in advertising in attempts to set themselves apart from competi-tors and improve their images while providing information about their products.3 With that amount of money being spent to influence what consumers buy and how investors and lawmak-ers see them, it is not surprising that automakers would carve out a portion of these funds to seek a competitive edge when it comes to the environ-ment. While their increased attention to environ-mental concerns is welcome, it can be hard to see past the smoke and mirrors of “green” marketing to see how automakers truly perform when it comes to the environment.
This report helps separate the hype from the reality by presenting consumers, investors, and lawmakers a clear image of the environmental performance of automakers and the products they sell. Our analysis focuses on the six larg-est automakers in the U.S. market—General
Motors (GM), Ford, DaimlerChrysler, Toyota, Honda, and Nissan—which account for nine out of every 10 vehicles sold in America. These six companies are also among the top 50 global Fortune 500 companies,Fortune 500 companies,Fortune 500 4 so their environmental impact is felt not only in the United States, but throughout the world as well.
We provide an analysis and ranking of the key pollutants from each company’s fleet of cars and trucks as well as comparisons in key market segments (e.g., midsized cars and SUVs) and among popular models. These rankings should prove useful to consumers choosing among dif-ferent brands—if all else is equal between car models, consumers should pick the one from the company with the best environmental perfor-mance, not the best environmental PR campaign. Investors may find our rankings to be a valuable tool in evaluating which companies are better investments based on how well they are posi-tioned to meet tightening pollution standards and rising energy concerns in the United States and throughout the world. Further, identifying auto-makers’ strengths and weaknesses helps to provide insight on what steps automakers and policy makers need to take to clean up cars and trucks to ensure automakers earn their “green” image.
Passenger Vehicle PollutionThe manufacture, use, and disposal of automo-biles have a significant impact on the environ-ment, contributing to water pollution, land use issues, traffic congestion, toxic emissions, smog, and global warming. From among these, we
The Environmental Image of Automakers
1 Only China, Russia, and Japan have higher total emissions (based on Marland et al., 1996).
2 For example, automakers have recently invested in a new ad campaign to boost their environmental image (Stoffer, 2004).
3 Automakers spent more than $9.5 billion on advertising, while their franchised dealers spent $8.5 billion (Automotive News, 2004; NADA, 2004).
4 Four of the six—GM, Ford, DaimlerChrysler, and Toyota—are among the top 10 in Fortune’s global ranking (Fortune, 2003).
5

Automaker Rankings 2004
narrow our focus to two areas in which automo-biles stand out as having a unique and dramatic impact on public health and the environment: smog-forming pollution and heat-trapping gas emissions.
We further refine our competitive arena to pollution associated with the use of the vehicles because this is where the largest impact lies. For example, heat-trapping emissions associated with the manufacture and use of gasoline in a midsize family car are more than 13 times higher than those associated with vehicle manufacture and disposal.5 As a result, even significant emission reductions in the vehicle manufacturing sector will have only a small impact on lifetime vehicle emissions. Similarly, while reductions in smog-forming emissions from manufacturing plants can create very important local air quality ben-efits, the in-use impact of the vehicle remains much larger and wider in scope.
Smog. Ground-level ozone, formed when nitro-gen oxides (NOx) and hydrocarbons from vehicle exhaust and other sources combine in the presence of sunlight, is one of the key ingredients in urban smog. Ozone-induced smog can irritate the respi-ratory system, reduce lung function, exacerbate asthma, damage the lining of lungs, and aggravate chronic lung diseases (EPA, 2002), and can lead to higher death rates and permanent injury from repeated exposure (ATS, 1996). On smoggy days, hospital admissions, especially for asthma, escalate (Koren, 1995; White et al., 1994).
Since the 1960s, state and federal govern-ments have tightened regulations on vehicular
emissions to help protect public health. As a result, automakers have made significant strides in reducing smog-forming pollution from their cars and trucks. These gains, however, have not been enough to eliminate smog as a serious threat to public heath and the environment. In 2003, 57 percent of the U.S. population was living in areas that exceeded the current federal health guidelines for smog.6
Vehicle ownership has doubled and total vehicle miles traveled have increased by a factor of 2.5 over the last 30 years (Davis and Diegel, 2003). This has diminished the real-world ben-efits of automaker advances on individual vehicle smog performance. Further, regulatory loop-holes that allow larger trucks to emit two to five times more smog-forming pollution than cars have become a significant liability as automak-ers have shifted production towards these lucra-tive segments (Figure 1, p. 7). New regulations that began phasing in during model year 2004 (MY04) will eliminate this smog loophole, but they will not be fully implemented until MY09.
Global Warming. Global warming is the most serious long-term environmental threat facing the United States and the world. Concentrations of heat-trapping gases in the atmosphere have increased dramatically since the beginning of the Industrial Revolution, largely as the result of human activities such as burning fossil fuels. There is overwhelming consensus within the international scientific community that these heat-trapping gases are forming a blanket around Earth, changing the global climate: increasing
5 Based on data in Weiss (2000) indicating that vehicle materials production and assembly, distribution, maintenance, and disposal amount to 28.9 grams of CO2 per mile for a 1996 Toyota Camry. Our analysis indicates that the manufacture and use of gasoline in the Camry would result in about 395 grams of CO2 per mile.
6 Data for eight-hour ozone nonattainment areas as of September 27, 2004, from EPA’s Green Book (http://www.epa.gov/oar/oaqps/greenbk/gntc.html).http://www.epa.gov/oar/oaqps/greenbk/gntc.html).http://www.epa.gov/oar/oaqps/greenbk/gntc.html
6

Union of Concerned Scientists
temperatures and sea levels while altering pre-cipitation patterns and altering the frequency and intensity of extreme weather events (IPCC, 2001; Schneider and Sarukhan, 2001; Field et al., 1999). These changes pose great risks to our health and economy.
The global warming emissions of automo-biles are tied to several factors, including fuel economy, fuel type, catalyst formulation, and air conditioning refrigerants and efficiency. In response to the creation of Corporate Average Fuel Economy (CAFE) standards, designed to address the economic risks associated with U.S. oil dependence, automakers increased fuel econ-omy by more than 60 percent between 1975 and 1985 (Hellman and Heavenrich 2004).
However, progress has stalled since then. Today’s fuel economy hovers at a 20-year low, a result of no progress on CAFE standards and exacerbated by a fuel economy loophole that
allows trucks to consume one-third more fuel than cars (see Figure 1). Stagnant fuel economy, combined with rising travel and the failure of a few modest efforts to move automobiles toward using lower-carbon fuels, have led U.S. pas-senger vehicles to account for 20 percent of the U.S. emissions of CO2—the single-largest source other than electricity generation.
Ranking MethodThis report represents the third assessment of automakers in the U.S. market, based on their average pollution performance, and follows in the tradition of the previous UCS ranking reports (Morey et al., 2000; Mark, 2002). By combining smog-forming and heat-trapping emissions into a single ranking, this report pro-vides a simple, objective, and comprehensive assessment of an automaker’s environmental performance. This can help inform consumers
Car0.0
0.39 0.390.63
1.44
2.09
0.5
1.0
1.5
2.0
2.5
0
27.5
20.7
5
10
15
20
30
25
LargeTruck
SmallTruck
LargestTruck
Car TruckMedTruck
Smog-Forming Emissions
NO
x +
NM
OG
(g/m
i)
Mile
s p
er G
allo
n
Fuel Economy
Notes:
1. Smog-forming emissions are the sum of the 100,000-mile standards for NOx and NMOG (non-methane organic gases). Car, small truck, and medium truck correspond to the National Low Emission Vehicle (NLEV) program. Large and largest truck emissions are not captured by NLEV, so the default Tier 1 standards apply. Size definitions for trucks are based on vehicle weight in pounds (lb), as follows: small (≤3,750 lb LVW, ≤6,000 lb GVWR); medium (>3,750 lb LVW, ≤6,000 lb GVWR); large (≤5,750 lb ALVW, ≤8,500 lb GVWR); and largest (>5,750 lb ALVW, ≤8,500 lb GVWR). LVW = loaded vehicle weight (curb weight plus 300 lb); GVWR = gross vehicle weight rating (maximum design loaded weight specified by the manufacturer); ALVW = adjusted loaded vehicle weight (average of curb weight and GVWR). These emission levels do not reflect average emissions during typical driving conditions.
Figure 1: MY03 Environmental Standards for Cars vs. Trucks
7

Automaker Rankings 2004
of what to expect from an automaker when they step into the showroom—while all companies may have some top-rated models, the companies at the top of our ranking will tend to have more clean car choices. This report also helps to cool down the hype when an automaker tries to claim environmental leadership by introducing only one or two clean vehicles in small production volume without ensuring those vehicles create a net improvement in its overall environmental performance.
The data used in our ranking are developed from several publicly available U.S. government databases that track sales, CAFE-certified fuel economy, and smog-forming pollution cert-ifications for all passenger cars and trucks at or below 8,500 pounds gross vehicle weight rating (the maximum design loaded weight specified by the manufacturer). The analysis is based on data for MY03, the most recent year for which data were available.
Combining sales estimates and CAFE fuel economy values, we evaluate the sales-weighted average fuel economy for each manufacturer, as well as for certain market segments (e.g., cars vs. trucks) and popular models. The global warm-ing pollution rates are developed from the fuel economy values along with an integrated credit for automakers that produce dedicated alter-native-fuel vehicles. Fuel economy and global warming pollution credits are not allowed for so- called “flex-fuel vehicles” (FFVs), which are built to run on alternative fuels (but almost never do). Through the same procedure, we estimate the fleet average smog-forming emission levels for each automaker. The resulting grams-per-mile values for heat-trapping and smog-forming emis-sions represent the pollution from each automak-er’s average vehicle.7 We first rank these results separately and then combine them (giving equal weight to each) to form an overall ranking. For more details on our methodology, see the appen-dix of this report.
7 The resulting fuel economy and emission rates are not intended to represent real-world performance. For example, data from the Energy Information Administration indicate that the gap between these CAFE certification-based values and real-world values is likely to be 30 percent or more (EIA, 2004).
8

Union of Concerned Scientists
Our pollution ranking provides many different ways to compare the automakers
(Figure 2). The primary basis of our rankings is a comparison of the relative emissions of smog-forming and global warming pollution from each automaker’s average MY03 vehicle. To further understand the origin of these values, we analyze the pollution performance of cars and trucks, and then break down the analysis by class and by vehicle type. Model-by-model comparisons of some of the most popular vehicles provide additional insight. Finally, we provide an esti-mate of the total pollution impact of each automaker, comparing the results against their total vehicle sales.
Fleet ComparisonsAs in the previous two rankings, Honda remains the cleanest automaker—actually having extend-ed its lead—but several changes have taken place among the other automakers (Table 1). Most notably, GM continued its steady fall in our rankings, going from the greenest of the Big
Three U.S. automakers in MY98 to replacing DaimlerChrysler as the dirtiest in MY03. GM fell to the bottom of the ranking by increasing its average global warming pollution levels by the largest amount among all automakers, and by taking the greatest advantage of a loophole that allows larger trucks to produce significantly more smog-forming pollution than cars.
Nissan pulled itself up from third place in 1998 and 2001 to second place in 2003, leaving Toyota the dirtiest of the three Japanese auto-makers but still significantly cleaner than any of the Big Three. Nissan pulled ahead in part because Toyota made little progress on smog-forming pollution while Nissan certified all of its vehicles to more stringent California emission standards. Toyota still has better global warm-ing pollution performance than Nissan but the gap has narrowed due to Nissan’s fuel economy improvements in nearly all its trucks. As a result, Toyota’s superior global warming performance was not enough to balance out Nissan’s smog performance.
Pollution Ranking Results
Buick CenturyBuick RegalCadillac CTS
Cadillac SevilleChevrolet Malibu
Chevrolet Monte CarloOldsmobile AuroraPontiac Grand Prix
Saab 9-5Saturn L200Saturn L300
Small CarMidsize CarLarge Car
SUVMinivanPickup
orSmall Truck
Medium TruckLarge Truck
Largest Truck
(GM midsize car example)(overall ranking)ModelClassTypeFleet Average
AverageVehicle
Car
Truck
Figure 2: Types of Pollution Comparisons
9

Automaker Rankings 2004
Automakers have been getting cleaner since we first began our rankings, though the credit goes to stronger smog-forming emission standards spurring manufacturers toward early compliance. On global warming pollution, the automakers pretty much ran in place between MY01 and MY03 after having gotten worse at the end of the last decade.
Smog-Forming Emissions. Automakers have made very different choices when it comes to putting technology to work to help protect public health. As Table 2 shows, the gap between best and worst had narrowed in MY01 due to full implemen-tation of tighter federal standards for cars and smaller trucks, but widened again in MY03 as Honda moved to certify more than half of its cars and trucks to levels that meet or beat the more stringent federal emission standards that will be in place in MY07. As a result, the average Honda vehicle was certified to emit half the smog-forming pollution levels of the industry average.
Ford continued its commitment to reduce smog-forming pollution from its vehicles, mov-ing up to fourth place in MY01 despite increased truck sales. On the other hand, GM’s lack of progress on reducing smog-forming emissions put it solidly in last place, with emission levels nearly 30 percent higher than the Big Six average, and more than 2.5 times higher than Honda’s.
Global Warming Pollution. There is less differen-tiation between automakers when it comes to global warming pollution, largely due to stagnant government standards and a lack of effective automaker or consumer incentives over the past 20 years. While there is a difference of more than 80 percentage points between first and last place for smog-forming emissions, the spread among automakers on heat-trapping emissions is less than 25 percentage points (Table 2). This gap has narrowed since MY98 as Honda, though still significantly cleaner than the competition, has moved into the truck market without applying sufficient technology to ensure its trucks are as clean as its cars.
There were two important changes among the Big Three automakers between 2001 and 2003. DaimlerChrysler achieved the largest fuel
Table 1. Automaker Pollution Ranking for Average New-Vehicle Emissions
Rank Model Year 1998 Model Year 2001 Model Year 2003
1 Honda Honda Honda
2 Toyota Toyota Nissan
3 Nissan Nissan Toyota
4 GM Ford Ford
5 Ford GM DaimlerChrysler
6 DaimlerChrysler DaimlerChrysler GM
10
AutomakerSmog-Forming Emissions Heat-Trapping Emissions
MY98 MY01 MY03 MY98 MY01 MY03
Honda 59% 69% 48% 78% 79% 82%
Nissan 86% 77% 70% 90% 100% 94%
Toyota 85% 80% 84% 88% 90% 88%
Ford 107% 99% 91% 106% 105% 107%
Daimler-Chrysler 113% 110% 114% 109% 109% 104%
GM 102% 114% 129% 99% 100% 104%
Table 2. Relative Emissions vs. Big Six Average, by Model Year

Union of Concerned Scientists
economy improvement (four percent), despite increased truck share. On the other hand, Ford’s fuel economy fell by nearly two percent, put-ting it in last place on heat-trapping emissions. GM also slipped, but maintained a slight lead over Ford on global warming performance. These changes make it difficult to tell the Big Three apart when it comes to global warming pollution—they are all almost equally poor performers. Among the three Japanese automak-ers, Nissan improved by six percent, double Toyota’s improvement, while Honda got worse.
Car and Truck ComparisonsAs with our previous ranking, Ford continues to prove that trucks do not have to be a liability when it comes to environmental performance. Despite having a greater market share of trucks than GM, Ford’s average vehicle in MY03 pro-duced 30 percent less smog-forming pollution, in large part because Ford’s trucks were 40 percent cleaner than GM’s (Table 3). These advantages
over GM, however, were not enough to help Ford overcome the significantly higher reliance on cars among Honda, Nissan, and Toyota.
Most automakers chose to take advantage of loopholes that allow trucks to be dirtier than cars. As a result, the average Big Six MY03 truck emitted 2.6 times the smog-forming emissions, and 1.4 times the global warming pollution, of the average car.
Smog-Forming Emissions. Among cars, most automakers have about the same smog perfor-mance. Honda, however, stands out as the clean-est, with emission levels more than 25 percent below the industry average (Figure 3). Ford is the only other automaker to achieve a cleaner-than-average smog rating for its cars by having most of its Volvos, some of its Jaguars, and an extremely clean version of the Ford Focus meet 2007 federal emission standards ahead of the deadline.
Honda is also the clear leader in smog per-formance for trucks, with less than half the
AutomakerSmog-Forming Emissions (g/mi) Heat-Trapping Emissions (g/mi)
Truck Share
Cars Trucks Both Cars Trucks Both
Honda 0.25 0.40 0.31 340 449 383 39%
Nissan 0.36 0.61 0.45 399 506 437 36%
Toyota 0.37 0.82 0.54 346 506 409 39%
Ford 0.34 0.76 0.59 415 555 497 59%
DaimlerChrysler 0.39 0.96 0.74 408 535 485 61%
GM 0.37 1.20 0.84 393 558 485 56%
Big Six Average 0.35 0.92 0.65 385 537 465 52%
Notes:
1. Smog-forming emissions are the sum of the 100,000-mile standards for NOx and NMOG. These emissions levels do not reflect aver-age emissions during typical driving conditions.
2. Heat-trapping emission values are based on certification tests and do not reflect average fuel use during typical driving conditions.
3. Truck Share represents percentage of total MY03 vehicle sales.
Table 3. MY03 Average Emissions, by Manufacturer
11

Automaker Rankings 2004
smog-forming emissions of the industry average. Nissan also stands out, with Ford and Toyota not far behind. On the other end of the scale is GM, producing far and away the dirtiest trucks in the industry, which contributes significantly to its low overall environmental rating. If GM were to make technology strides to reach the same truck smog-forming emission levels as Ford, it would leap ahead two spots to place fourth in our over-all ranking.
Global Warming Pollution. Honda and Toyota are the clear leaders in the car market, with Toyota nearly eliminating Honda’s past lead. Ford, on the other hand, has not applied the same strat-egy to global warming that it has to smog, and as a result its cars have the highest heat-trapping emissions of the six automakers.
Ford’s poor global warming performance also applies to its trucks, with the second-highest heat-trapping emission levels in the industry. GM has taken out ads highlighting the class-leading fuel economy of its truck models, but those individual advantages (where they
exist) failed to produce real-world benefits when it came to global warming pollution in its MY03 truck fleet, and it finished in last place. Honda and Toyota remain the cleanest companies when it comes to trucks, but Nissan’s gains in truck fuel economy have brought it up to tie with Toyota for second place in global warming performance.
Class ComparisonsTo understand these rankings it is helpful to consider the different classes of vehicles made by each manufacturer; environmental standards and performance can vary significantly between vehi-cle classes, and especially between truck classes. While certain manufacturers produce more vehicles in particular classes, clear differences also exist between manufacturers within each vehicle class. This reflects the very different environ-mental choices made by automakers, influencing both their rankings and the options available to consumers.
Honda leads the pack with the lowest smog-forming and heat-trapping emissions in virtually
104%
90%
Toyota
112%
106%
Daimler-Chrysler
97%
108%
Ford
106%
102%
GM
72% 88
%
Honda
104%
Nissan Toyota Daimler-Chrysler
Ford GMHonda Nissan
140%
Big Six AverageSmog-FormingHeat-Trapping
Smog-FormingHeat-Trapping120%
100%
80%
60%
40%
20%
0%
Cars140%
Em
issi
ons
vs. B
ig S
ix A
vera
ge
Em
issi
ons
vs. B
ig S
ix A
vera
ge
105%
100%
83% 10
3%
131%
104%
104%
43%
84%
66%
94%
89% 94
%
120%
100%
80%
60%
40%
20%
0%
Trucks
Big Six Average
Figure 3: Emissions vs. Big Six Averages, Cars and Trucks
12

Union of Concerned Scientists
every class in which it competes. There are no clear winners or losers among the other auto-makers, though DaimlerChrysler is at or near the bottom of both the smog-forming and heat-trapping scoring in most classes.
Smog-Forming Emissions. With the full adoption of stricter federal standards for cars and small and medium trucks in MY01, the gaps between most of the manufacturers have narrowed sub-
stantially within these classes (Figure 4). The notable exception is Honda. While re-establishing its lead in smog-forming emissions from cars, it has also cleaned up its small trucks, which now produce 60 percent less smog-forming pollution than any other vehicle in their class, and are even cleaner than Honda’s industry-leading average car. In MY03, all of Honda’s small trucks, and two-thirds of its medium trucks, were certified to 2007 federal emission standards.
Small Midsize Large
NO
x +
NM
OG
(g/m
i)N
Ox
+ N
MO
G (g
/mi)
0.0
0.05
0.10
0.15
0.20
0.25
0.30
0.35
0.40
0.45
Cars
Small Medium Large Largest
0.0
0.50
1.00
1.50
2.00
2.50
Trucks
Toyota Daimler-Chrysler
Ford GMHonda Nissan
Toyota Daimler-Chrysler
Ford GMHonda Nissan
0.20
0.16
0.48
0.63
0.63
0.63
1.90
0.57
1.10
0.96 1.
22
2.02
0.39
0.39
0.39
0.39
0.39 0.57
1.33
1.33
1.91
0.36 0.37 0.39
0.36 0.
38
0.38
0.36
0.30
0.39 0.40
0.38
0.37
0.34
0.39
0.33 0.
37
Figure 4: Car and Truck Smog-Forming Emissions, by Class
Notes:
1. Smog-forming emissions are the sum of the 100,000-mile standards for NOx and NMOG. These emission levels do not reflect average emissions during typical driving conditions.
13

Automaker Rankings 2004
Ford has also made great strides in reducing smog-forming emissions, placing second only to Honda in cars and leading by wide margins in the larger truck classes. In fact, its largest trucks produce only half the pollution of their competitors. This can be traced to Ford’s deci-sion to phase out the vast majority of its dirtiest vehicles in favor of those meeting more stringent California and federal emission certifications. Only a handful of Ford’s largest models are still certified to the older federal standard (Tier 1), while other manufacturers still maintain Tier 1 certifications on a majority of their larger trucks.
DaimlerChrysler is the clear loser when it comes to smog-forming emissions from cars, coming last in every category. It is tied with a number of others for last place in the small and medium truck classes, and sits alone at the bot-tom of the largest truck class. And surprisingly, Toyota’s smog performance in each class is rather mediocre. It ranks third in every class of car, fails to distinguish itself in the small and medium truck categories, and is essentially tied with GM, well behind Ford, in the larger truck classes.
Global Warming Pollution. Compared with smog-forming pollutants, there is less differentiation between the automakers when considering heat-trapping emissions (Figure 5). In the absence of regulation, automakers have not had the incen-tive to adopt new technologies that would reduce heat-trapping emissions from their fleets; never-theless, marked differences do exist between the manufacturers.
When it comes to heat-trapping emissions from cars, Honda edges out Toyota in the small and midsize classes, with the other manufacturers trailing far behind. Toyota already leads the way in large cars, and is on pace to take the lead from Honda in small cars.
Ford and DaimlerChrysler score poorly in every class, while Nissan’s small cars, which pro-duce nearly 40 percent more global warming pollution than Honda’s, are especially worthy of reproach. Nissan’s poor showing in the large car category corresponds to a single model, the Infiniti Q45. However, only 3,000 of this model were sold in 2003, so it does not appreciably influence Nissan’s overall ranking.
Small Midsize Large
Hea
t-Tr
app
ing
Em
issi
ons
(g/m
i)
Hea
t-Tr
app
ing
Em
issi
ons
(g/m
i)
0
Cars
Small Medium Large Largest
0
100
200
300
400
500
600
700
100
200
300
400
500
600
700
Trucks
Toyota Daimler-Chrysler
Ford GMHonda Nissan Toyota Daimler-Chrysler
Ford GMHonda Nissan
292 37
3 401
397 48
3
304 38
1
406
384 42
3 444
400
417
433
360 40
9
417
397 46
6
423
513
392 50
0 594 61
9
619
447 52
9 577 63
6
435
498 57
664
9
413 50
9 583
Figure 5: Car and Truck Heat-Trapping Emissions, by Class
Notes:
1. Heat-trapping emission values are based on certification tests and do not reflect average fuel use during typical driving conditions.
14

Union of Concerned Scientists
Toyota is on top of the small truck class with Honda a close second, and Honda leads the medium truck class. Nissan’s medium trucks are still among the worst of the six automak-ers, although it has made the most progress of the group. And among manufacturers of larger trucks, Toyota’s advantage disappears—it is essen-tially tied with Ford, GM, and DaimlerChrysler in global warming performance.
Combined Scores. Since our overall rankings are based on comparisons of both smog-forming and heat-trapping emissions, we combine these two values to make comparisons within specific vehi-cle classes (Table 4). To provide a common refer-ence point, the emission rates of each pollutant
(as shown in Figures 4 and 5, pp. 13–14) were indexed against the Big Six fleet-wide averages.
Because the gaps between manufacturers are much wider for smog-forming pollutants than for heat-trapping emissions, the smog scores tend to drive the overall rankings. As would be expected, Honda is the clear winner in the small and midsize car categories, with Toyota coming second. In large cars, Toyota’s class-leading fuel economy can’t make up for its mediocre smog performance, leaving Ford and GM tied for first place. DaimlerChrysler, mean-while, comes in at the bottom of every car class due to poor showings in both smog-forming and heat-trapping emissions.
Ford publicly abandoned its commitment to improve the fuel economy of its SUV fleet by 25 percent from MY00 to MY05, and the lack of commitment shows. After jumping ahead of GM, DaimlerChrysler, and Nissan in MY02, Ford’s SUV fuel economy slid back to just 19.4 mpg in MY03 (Figure 6). This was accel-erated by sales of the gas-thirsty Expedition, which more than doubled to nearly 250,000 units. Had Ford kept its commitment, its SUV fuel economy would have been 21.6 mpg, nearly tying Nissan for fourth place on fuel economy and less than 1 mpg behind Toyota. The irony of this failure is that Ford has shown through its smog performance that it knows how to make environmental technology work when it puts in the effort.
Ford’s backtracking on fuel economy has had a negative effect on other Big Three auto-makers as well, because they had promised to
continue beating Ford on fuel economy. Since MY00, GM’s SUV fuel economy has slipped and is now just 0.2 mpg ahead of Ford.
18
20
22
24
26
28
2000 2001 2002 2003
GMNissan
FordDaimlerChrysler
Honda
Toyota
Mile
s p
er G
allo
n
Figure 6: SUV Fuel Economy Trends
Notes:
1. Fuel economy values are the combined city/highway results from CAFE tests. They do not reflect average fuel use during typical driving conditions.
Update: Ford’s Voluntary Commitment to Increasing Fuel Economy
15

Automaker Rankings 2004
In small and medium-sized trucks, Honda is securely in first place, with the other manufac-turers separated by no more than five percentage points. In the larger truck classes, Ford’s progress on smog-forming emissions has again earned it solid first-place scores, particularly in the largest truck category.
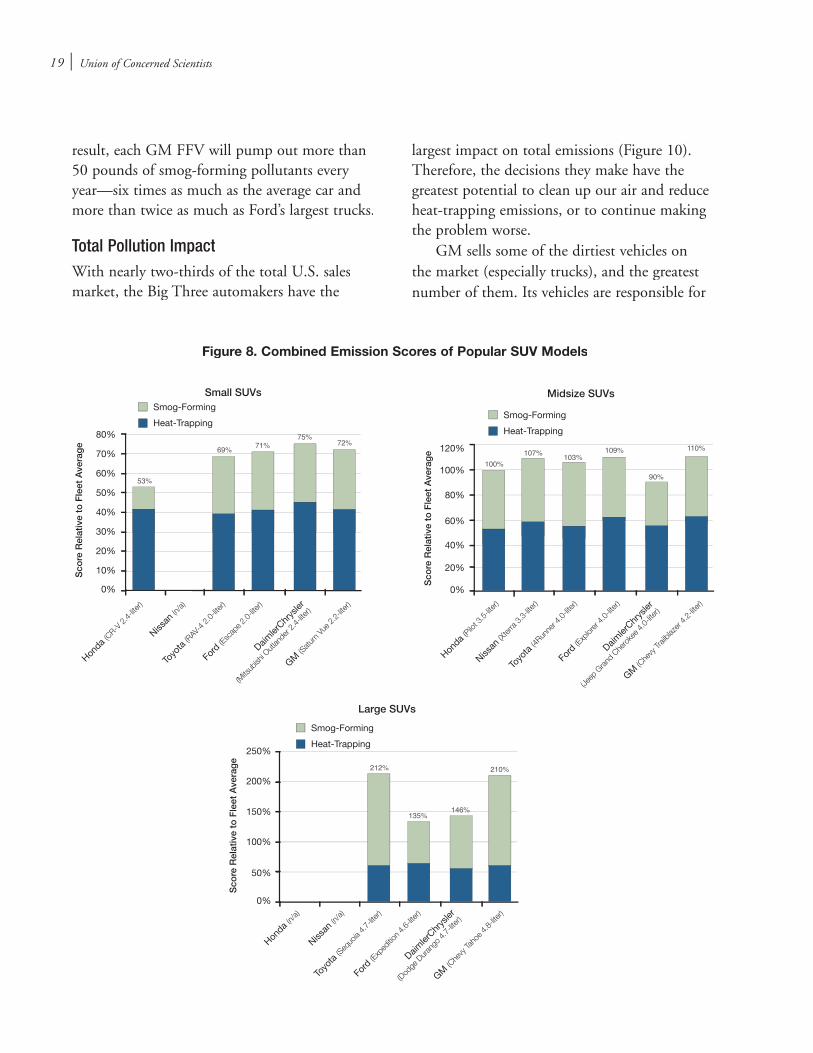
Model Comparisons
Our analysis has thus far compared entire fleets and vehicle classes, but to gain an understanding of how individual vehicles from each company stack up, we also analyzed top-selling models in each class. Vehicles were broken out by engine size and the more popular sizes were compared with one another. For these comparisons, we made an effort to choose similarly sized engines and to maintain as much of an apples-to-apples comparison as possible (though perfect compari-sons are often impossible due to variations in vehicle size and performance).
Overall, this analysis shows that clean and efficient vehicles can also be big sellers. Many class leaders in environmental performance are among the class leaders in sales as well, including
the Honda Accord and Toyota Camry (for mid-size cars); Chevy Impala (for large cars); Chevy S-10 (for four-wheel-drive compact pickups); Ford F-150 (for full-size pickups); Jeep Liberty and Grand Cherokee (for medium SUVs); and Ford Expedition (for large SUVs). See Figures 7 –9 for comparisons of these vehicles and others in their classes.
Ford’s vehicles are among the cleanest in every class in terms of smog-forming pollution, ranking first or second in eight out of nine popular model comparisons. Six of these eight vehicles score at or near the bottom in global warming pollution, but the other two are real winners: The 4.6-liter F-150 leads the full-size pickup class in heat-trapping emissions (Figure 9, p. 20) while the 2.0-liter Escape rivals the CR-V in small SUVs (Figure 8, p. 19). Unfortunately, Ford produced fewer than 4,000 2.0-liter Escapes, eschewing them in favor the less efficient 3.0-liter version.
In the small car category, the Nissan Sentra beats out the more efficient Honda Civic and Toyota Corolla because a substantial fraction of the Sentras are certified to the two cleanest cat-
AutomakerCars Trucks
Small Midsize Large Small Medium Large Largest
Honda 57% 55% - 55% 87% - -
Nissan 71% 71% - 76% 104% - -
Toyota 61% 69% 73% 72% 102% 166% 213%
Ford 70% 73% 71% 78% 101% 147% 142%
DaimlerChrysler 73% 76% 76% 77% 102% 156% 226%
GM 69% 73% 71% 74% 99% 166% 214%
Notes:
1. Nissan was omitted from the large car class comparison due to extremely low sales (3,000 units) of its only large car model, the Infiniti Q45.
Table 4. Combined Emission Scores vs. Big Six Average, by Class
16

Union of Concerned Scientists
egories of California’s smog standards (Figure 7). However, sales of the 350Z and Infiniti G35 outweigh those of the Sentra, leading to Nissan’s poor overall score in this category.
The top-selling Camry and Accord were the class leaders for four-cylinder midsize cars. These vehicles are among the best-selling cars in the United States, but despite the opportunity for high sales, Ford and GM did not even bother to compete in this category in MY03, leading to further disadvantages for their overall rankings. Among six-cylinder midsize cars, the Accord again comes in first place, while the Mercury Sable (manufactured by Ford) ties the Camry for the number two spot, with identical scores in both smog-forming and heat-trapping emissions.
DaimlerChrysler, while poor overall in smog performance, does have one winner: Its top-selling Jeep Grand Cherokee comes out on top in the midsize SUV category due to superior smog-forming pollution performance (Figure 8). This shows that even a generally poor-performing automaker can get a good grade when it puts technology to work. While its smog performance is worse, the Honda Pilot comes out on top for global warming pollution, giving it a second-place finish.
Looking at global warming pollution alone, Honda is the winner in the three car classes in which it competes, while Toyota comes first or second in three out of four car comparisons and five out of seven truck comparisons. Ford and Toyota each lead in two out of seven truck com-parisons. In the large car category, most auto-makers are close in ranking but, again, Ford is in last place (Figure 7).
The Flex-Fuel Vehicle LoopholeTo encourage the production of vehicles that can operate on alternative fuels, the federal govern-ment offers automobile manufacturers credits
toward meeting their CAFE requirements. FFVs, which can operate on both ethanol and gasoline, receive a generous fuel economy boost when calculating CAFE under the theory that they will use the alternative fuel and thereby cut down on gasoline consumption. For example, an 18-mpg Chevy Suburban FFV is credited as if it were a 30-mpg gasoline-only vehicle. In MY03 manufacturers could produce a fleet up to 1.2 mpg below CAFE requirements without penalty by filling that gap with FFV credits. Perversely, these vehicles seldom, if ever, operate on ethanol because such fueling stations are few and far between. This has led to an increase in oil dependence compared with what would have occurred if the automakers actually met the stan-dards. In fact, many consumers may not even realize they’ve bought an FFV—a lost opportu-nity for alternative fuel use.
Ford has replaced DaimlerChrysler as the biggest abuser of the FFV loophole, though all of the Big Three employ the loophole to its maxi-mum in their truck fleets. As a result, Ford and GM do not meet the light truck fuel economy standard of 20.7 mpg. Ford also used the loop-hole to gain an extra 0.8-mpg credit for its cars in MY03, which would not otherwise satisfy CAFE requirements. As a result of FFV cred-its, the average Ford vehicle is allowed to emit approximately 2.7 tons of extra CO2-equivalent emissions over its lifetime.
In addition to dragging down fuel economy, FFVs are often dirtier than their non-FFV counterparts when it comes to smog-forming pollution. GM’s FFVs, which include the Chevy Tahoe, Suburban, and Silverado as well as the GMC Yukon and Sierra, were the dirtiest vehi-cles sold in 2003. These FFVs are certified to the loosest possible Tier 1 standards, while their conventional counterparts are certified to tighter federal or California standards (which are 15 per-cent and 49 percent cleaner, respectively). As a
17

Automaker Rankings 2004
Figure 7. Combined Emission Scores of Popular Car Models
Toyo
ta (C
oroll
a 1.8
-liter
)
Daimler
Chrys
ler
(Dod
ge N
eon 2
.0-lit
er)
Ford
(Foc
us 2
.0-lit
er)
GM (C
hevy
Cav
alier
2.2
-liter
)
Honda (
Civic 1
.7-lit
er)
Nissan
(Sen
tra 1
.8-lit
er)
0%
10%
20%
30%
40%
50%
60%
70%
80%
Sco
re R
elat
ive
to F
leet
Ave
rag
e
Sco
re R
elat
ive
to F
leet
Ave
rag
e
Smog-Forming
Heat-Trapping
Smog-Forming
Heat-Trapping
Smog-Forming
Heat-Trapping
Smog-Forming
Heat-Trapping
Toyo
ta (C
amry
3.0-
liter)
Daimler
Chrys
ler
(Dod
ge S
tratu
s 2.7
-liter
)
Ford
(Merc
ury S
able
3.0-
liter)
GM (C
hevy
Mali
bu 3
.1-lit
er)
Honda (
Accor
d 3.
0-lite
r)
Nissan
(Altim
a 3.5
-liter
)
0%
20%
40%
60%
80%
100%
120%
Sco
re R
elat
ive
to F
leet
Ave
rag
e
Toyo
ta (C
amry
2.4-
liter)
Daimler
Chrys
ler
(Dod
ge S
tratu
s 2.4
-liter
)
Ford
(n/a
)
GM (n
/a)
Honda (
Accor
d 2.
4-lite
r)
Nissan
(Altim
a 2.5
-liter
)0%
10%
20%
30%
40%
50%
60%
70%
80%
Small Cars Midsize Cars (4-Cylinder)
Midsize Cars (6-Cylinder) Large Cars
Toyo
ta (A
valon
3.0
-liter
)
Daimler
Chrys
ler
(Dod
ge In
trepid
2.7
-liter
)
Ford
(Tau
rus 3
.0-lit
er)
GM (C
hevy
Impa
la 3.
4-lite
r)
Honda (
n/a)
Nissan
(n/a
)0%
10%
20%
30%
40%
50%
60%
70%
80%
Sco
re R
elat
ive
to F
leet
Ave
rag
e
58%
54%
99%72% 72% 72%
67%
77% 72% 72% 73%
55%59%
62%66% 67%
49%
68% 66%71%
18
Union of Concerned Scientists
Small SUVs
Toyo
ta (R
AV-4
2.0
-liter
)
Daimler
Chrys
ler
(Mits
ubish
i Out
lande
r 2.4
-liter
)
Ford
(Esc
ape 2
.0-lit
er)
GM (S
aturn
Vue
2.2
-liter
)
Honda (
CR-V 2
.4-lit
er)
Nissan
(n/a
)
0%
10%
20%
30%
40%
50%
60%
70%
80%
Sco
re R
elat
ive
to F
leet
Ave
rag
e
Large SUVs
Toyo
ta (S
equo
ia 4.
7-lite
r)
Daimler
Chrys
ler
(Dod
ge D
uran
go 4
.7-lit
er)
Ford
(Exp
editio
n 4.6
-liter
)
GM (C
hevy
Taho
e 4.8
-liter
)
Honda (
n/a)
Nissan
(n/a
)0%
50%
100%
150%
200%
250%
Sco
re R
elat
ive
to F
leet
Ave
rag
e
Smog-Forming
Heat-Trapping
Smog-Forming
Heat-TrappingSmog-Forming
Heat-Trapping
Midsize SUVs
Toyo
ta (4
Runne
r 4.0
-liter
)
Daimler
Chrys
ler
(Jeep
Gra
nd C
hero
kee 4
.0-lit
er)
Ford
(Exp
lorer
4.0
-liter
)
GM (C
hevy
Trail
blaze
r 4.2
-liter
)
Honda (
Pilot 3
.5-lit
er)
Nissan
(Xter
ra 3
.3-lit
er)
0%
20%
40%
60%
80%
100%
120%
Sco
re R
elat
ive
to F
leet
Ave
rag
e
53%
69% 71% 72%
100%107% 109%
90%
110%103%
75%
212% 210%
135%146%
result, each GM FFV will pump out more than 50 pounds of smog-forming pollutants every year—six times as much as the average car and more than twice as much as Ford’s largest trucks.
Total Pollution ImpactWith nearly two-thirds of the total U.S. sales market, the Big Three automakers have the
largest impact on total emissions (Figure 10). Therefore, the decisions they make have the greatest potential to clean up our air and reduce heat-trapping emissions, or to continue making the problem worse.
GM sells some of the dirtiest vehicles on the market (especially trucks), and the greatest number of them. Its vehicles are responsible for
Figure 8. Combined Emission Scores of Popular SUV Models
19

Automaker Rankings 2004
Figure 9. Combined Emission Scores of Popular Pickup and Minivan Models
Toyo
ta (T
acom
a 2.4
-liter
)
Daimler
Chrys
ler (n
/a)
Ford
(Ran
ger 2
.3-lit
er)
GM (C
hevy
S-1
0 2.
2-lite
r)
Honda (
n/a)
Nissan
(Fro
ntier
2.4
-liter
)0%
10%
20%
30%
40%
50%
60%
70%
80%
Sco
re R
elat
ive
to F
leet
Ave
rag
e
Toyo
ta (T
acom
a 3.4
-liter
)
Daimler
Chrys
ler
(Dod
ge D
akot
a 3.9
-liter
)
Ford
(Ran
ger 4
.0-lit
er)
GM (C
hevy
S-1
0 4.
3-lite
r)
Honda (
n/a)
Nissan
(Fro
ntier
3.3
-liter
)0%
20%
40%
60%
80%
100%
120%
140%
160%
Sco
re R
elat
ive
to F
leet
Ave
rag
e
Smog-FormingHeat-Trapping
Smog-FormingHeat-Trapping
Smog-FormingHeat-Trapping
Smog-FormingHeat-Trapping
Compact 2WD 4-Cylinder Pickups Full-Size Pickups
Compact 4WD 6-Cylinder Pickups Minivans
Toyo
ta (T
undr
a 4.7
-liter
)
Daimler
Chrys
ler
(Dod
ge R
am 1
500
4.7-
liter)
Ford
(F-1
50 4
.6-lit
er)
GM (C
hevy
Silv
erad
o 4.
8-lite
r)
Honda (
n/a)
Nissan
(n/a
)0%
50%
100%
150%
200%
250%
Sco
re R
elat
ive
to F
leet
Ave
rag
e
Toyo
ta (S
ienna
3.0
-liter
)
Daimler
Chrys
ler
(Dod
ge C
arav
an 3
.3-lit
er)
Ford
(Wind
star W
agon
3.8
-liter
)
GM (C
hevy
Vent
ure 3
.4-lit
er)
Honda (
Odyss
ey 3
.4-lit
er)
Nissan
(n/a
)0%
20%
40%
60%
80%
100%
120%
Sco
re R
elat
ive
to F
leet
Ave
rag
e
76% 75%73%70%
168%
142%
219%
179%
107% 106% 110%
156%
98%
98% 97%
76%
102%93%
20

Union of Concerned Scientists
29 percent of total heat-trapping emissions from new vehicles and 37 percent of smog-forming emissions, compared with 28 percent of sales. GM’s FFVs are worst of all, accounting for 7.4 percent of total smog-forming emissions from all manufacturers, while representing just 2.2 percent of total sales.
If GM were to hold its larger trucks to the same smog-forming emission standards as Ford, it would easily pass DaimlerChrysler and be just behind Ford in the overall rankings. This move
would eliminate more than 24 million pounds of smog-forming emissions from new vehicles every year, and would put its smog-forming emissionsat 30 percent of the total, approximately in line with its sales share. Similarly, if Ford were to match Toyota’s fuel economy in the small, medi-um, and largest truck classes, its trucks would jump into third place overall and more than 500,000 tons of CO2-equivalent emissions would be saved annually from new vehicles alone.
DaimlerChrysler17.7%
Ford19.6%
GM37.0%
Other7.5%
Toyota10.1%
Nissan3.6%
Honda4.5%
Smog-Forming Emissions
DaimlerChrysler16.0%
Ford22.8%
GM29.4%
Other9.0%
Toyota10.5%
Nissan4.8%
Honda7.6%
Global Warming Pollution
DaimlerChrysler15.1%
Ford21.0%
GM27.9%
Other10.0%
Toyota11.8%
Nissan5.0%
Honda9.2%
Vehicle Sales
Figure 10. Total Pollution Impact and MY03 Sales
21
Automaker Rankings 2004
Conclusions
The six largest automakers in the U.S. mar-ket are responsible for nine out of every
10 automobiles sold in MY03. Along with their dominant sales comes the responsibility to clean up their emissions of smog-forming and global warming pollutants. This, along with past lack-luster environmental performance, has created a negative environmental image among many automakers—an image they often seek to change though advertising, press releases, and auto show announcements.
Among the automakers, clear differences emerge when it comes to an environmental image based on fleet-wide performance. Given the results for MY03, the negative environmental images of GM, Ford, and DaimlerChrysler are not likely to change because their real-world per-formance has not matched their hype. Ironically, Ford’s negative image will likely remain because it has offset impressive gains on smog-forming pollution with significant degradation in its glob-al warming performance. Honda’s and Toyota’s positive environmental images are supported by their performance in MY03; however, Honda is slipping on global warming pollution and Toyota is almost as bad as the GM when it comes to in-class smog performance.
Individual Automaker Results1. Honda showed that it deserves its image as the greenest automaker by extending its lead over other automakers on environmental performance in MY03. Honda’s vehicles emit less than half the smog-forming emissions of the industry average, and 18 percent less heat-trapping gas emissions. Honda’s edge had slipped in MY01 as all auto-makers met federal smog standards that went into place that model year, but in MY03 Honda accel-
erated past the other automakers as 53 percent of its models were certified at smog-forming emission levels that meet or beat the more strin-gent federal emission standards that will be in place in 2007. This exceptional emissions perfor-mance came despite the fact that its truck share increased from 25 percent in 2001 to nearly 40 percent of its 2003 sales.
While Honda has extended its leadership position overall, it has lost some of its edge over the competition when it comes to fuel economy. Honda continues to have the most fuel-efficient cars, but Toyota is nipping at its heels. Honda also has the most fuel-efficient trucks, but it has fallen into the trap the industry has been in for the past 20 years, using technology primar-ily to increase weight and power rather than to improve fuel economy and save consumers money at the pump.
2. Nissan made progress in MY03, narrowly pass-ing Toyota to take second place in our ranking. Nissan showed the largest improvement among the automakers on global warming pollution since MY01 and the second-largest improvement on smog-forming pollution. Nissan achieved its new status by certifying all of its vehicles to meet or beat California’s smog standards, which are more stringent than federal standards, and increasing its emphasis on car sales. As a result, Nissan’s fleet emitted 30 percent less smog-forming emissions, and six percent less heat-trapping emissions, than the MY03 average.
Nissan also improved overall on fuel econ-omy. While the fuel economy of its cars has decreased consistently over the past four years, the average fuel economy of its trucks rose to the same level as Toyota’s in MY03. Nissan accom-
22

Union of Concerned Scientists
plished this by increasing the fuel economy of almost every truck model and shifting sales from less efficient SUVs to a “crossover” vehicle, the Murano, that delivers much of the functionality consumers desire from an SUV in a more effi-cient package. This is a commendable applica-tion of the crossover vehicle concept; while they are often used to draw consumers away from more efficient cars, using them to draw con-sumers from inefficient SUVs saves consumers money on fuel and reduces their environmental impact.
Nissan faces a significant opportunity in the coming years as it re-invigorates its expansion into the larger truck markets. If it chooses to introduce new and larger models with superior environmental performance, it will likely main-tain its second-place ranking and improve its environmental image.
3. Toyota’s slip from second to third place in our ranking is a reflection of Nissan’s pollution prog-ress as well as insufficient progress on the part of Toyota between MY01 and MY03. Toyota’s fleet remains cleaner than the average, emitting 16 percent less smog-forming pollution than the average and 12 percent less heat-trapping emis-sions, about where it was in MY01.
The emission performance of Toyota’s trucks has not changed significantly since MY01, and its truck sales share has remained at about 40 per-cent. Toyota’s overall heat-trapping emission levels improved slightly through a five-percent reduction in heat-trapping emissions from its cars, the largest improvement among automakers. Smog-forming pollution from Toyota’s cars also improved, but that improvement was small com-pared with progress made by Honda and Ford.
If Toyota had kept up with Nissan on reduc-ing smog-forming emissions, its superior heat-trapping emissions performance would have kept it in second place. Further improvements
in fuel economy along with cleaner trucks will be required for Toyota to demonstrate that it has earned the “green carmaker” image that its adver-tising and Prius sales and have helped create.
4. Ford’s environmental image has become con-fusing because of its self-contradictory approach to pollution performance: it maintained its fourth-place standing with better-than-average smog-forming emissions on one hand, and the absolute worst heat-trapping emissions of all Big Six automakers on the other. Overall, Ford’s smog-forming emissions were nine percent below industry average, but it had the highest heat-trapping emissions of the automakers (seven percent above average). This makes Ford’s com-mitment to the environment appear half-hearted.
While most automakers seem to have rested on the smog improvements required from 2001, Ford was second only to Honda in reducing smog-forming emissions in its car and truck fleets. Considered separately, Ford’s MY03 cars and trucks were cleaner than Toyota’s for the first time in our analysis. Thus, despite a grow-ing market share of trucks, Ford narrowed the gap between itself and the competition by put-ting technology to work. However, Ford did not use a similar approach to reducing heat-trapping emissions from its vehicles, and its resulting pol-lution performance was so poor that it replaced DaimlerChrysler, the typical industry laggard, as the last-place finisher in that category.
Ford’s disjointed approach to environmental performance is epitomized by the Focus. It is a leader among big-selling small cars in smog-forming emissions, and yet comes in last in heat-trapping emissions, producing 20 percent more than the class-leading Civic. These contra-dictory results are also seen in the Windstar and Expedition.
Adding to the disappointment and further harming its environmental image, Ford publicly
23
Automaker Rankings 2004
walked away from its commitment to improve the fuel economy of its SUVs by 25 percent from MY00 to MY05. Ford’s SUV fuel economy now sits at 19.4 mpg, nearly the same level it was at in MY00. Also, Ford took the greatest advantage of the FFV loophole to meet standards rather than using existing technologies to improve the actual fuel economy performance of its vehicles.
5. DaimlerChrysler moved from last place to fifth 5. DaimlerChrysler moved from last place to fifth 5. DaimlerChrysler
place, its first change in the rankings since 1998, due to the poor performance of GM as well as a modest improvement in fuel economy from the trucks that make up two-thirds of its sales. Still, DaimlerChrysler performed poorly overall, with smog-forming pollution that was 14 per-cent higher than the industry average and global warming pollution that was four percent higher than the average.
DaimlerChrysler’s four-percent reduction in fleet-wide heat-trapping emissions, though small, is impressive in light of an increased share of light truck sales compared with MY01. Rather than being a burden, these increased truck sales helped because DaimlerChrysler improved truck fuel economy, especially among vans.
Many significant black marks do still remain on DaimlerChrysler’s record, justifying its poor environmental image. For example, it continues to be one of the largest abusers of the FFV loop-hole. In addition, DaimlerChrysler took advan-tage of another loophole to sell 120,000 Chrysler PT Cruisers—cars built on the Dodge Neon small car platform—under the truck fuel econ-omy classification. (These were treated as cars in our analysis.) By classifying them as trucks, DaimlerChrysler artificially inflates both its car and truck fuel economy averages.
6. General Motors replaced DaimlerChrysler as the last-place finisher in our ranking, as it was the only company to produce a fleet of vehicles
that emitted more smog-forming and heat-trapping pollution per vehicle in MY03 than it did in MY01. GM’s fleet of cars and trucks emit-ted nearly 30 percent more smog-forming pol-lution than the industry average, and was more than 2.5 times dirtier than Honda’s fleet. Despite numerous technology announcements from 2001 through 2003 and a commitment to lead on fuel economy among the Big Three, GM’s trucks fell below both Ford’s and DaimlerChrysler’s in MY03, pushing its truck heat-trapping emissions to four percent worse than average.
If GM had matched Ford’s smog-reduction efforts within the large truck and largest truck categories, it would be solidly in fifth place over-all, less than two percentage points behind Ford. And if GM had matched the smog-forming emission performance of Ford on all of its trucks, it would have moved up into fourth place.
Recognizing that its image is at risk, GM has taken out full-page ads touting its environmen-tal leadership and noting that, “when it comes to efficiency, our trucks win more head-to-head comparisons than any other manufacturer.” While this claim might be true for MY04, our analysis of popular vehicles in the truck classes in MY03 shows that GM does not hold any lead in the truck market—GM has only one class-leading popular truck among the seven classes we investigated. This illustrates the gap between GM’s environmental rhetoric and its real-world performance.
Lessons LearnedConsidering cases of progress and regression over the time period of our rankings, several impor-tant observations appear:
Trucks don’t have to be an environmental liability.
Ford and Honda cut their fleets’ smog-forming pollution despite the fact that their truck sales increased between MY01 and MY03. By putting
24

Union of Concerned Scientists
clean-up technology to work in their trucks, they were able to expand truck sales without a smog penalty.
Regulations spur environmental progress. When regulations are in place, automakers not only abide by the law and clean up their vehicles, but several go above and beyond the minimum requirements and distinguish themselves through early compliance.
Regulatory loopholes discourage environmen-
tal progress. When regulatory loopholes are left open, such as those relating to truck fuel economy and larger truck smog performance, certain manufacturers will distinguish themselves as environmental laggards by taking full advan-tage of these loopholes instead of putting existing technology to work. As a result of these loop-holes, MY03 trucks from the Big Six emitted 2.6 times the smog-forming emissions, and 1.4 times the global warming pollution, of an average car. Closing these loopholes will deliver important environmental gains.
Automakers are jeopardizing our future by ignor-
ing climate change. The poor performance of all automakers on heat-trapping emissions indicates they are doing little to tackle the problem of climate change despite a wide variety of avail-able technologies. This stands in sharp contrast to progress on smog-forming pollution and indicates that an important cause for automak-ers’ failure on heat-trapping emissions is a lack of national vehicle climate controls and lack of progress on fuel economy and alternative fuels.
Creating Pollution ProgressIt is good news that more automakers are put-ting out advertisements touting environmental achievements. At a minimum, it means they understand the potential to draw customers in based on environmental performance. Questions
remain, however, as to whether some of that advertising is misleading to consumers, investors, and policy makers. In order to ensure that ad campaigns are more than just greenwashing, we recommend the following actions:
Automakers
Put technology to work. Ford, Honda, and Nissan have demonstrated the effectiveness of putting technology to work to cut smog-forming pollution. It is important for other automakers to follow suit, both for the health of millions of Americans and for the sake of their environmen-tal reputations.
The same holds true for putting technology to work to cut global warming pollution. While all automakers have made progress on smog, the industry has been at a standstill on global warm-ing for the last two decades. Technologies exist to cut CO2 and other heat-trapping emissions from vehicles while saving consumers money at the gas pump. Whether it is through alternative fuels, improving fuel economy, or improving air conditioning systems, all automakers have a lot of room to grow when it comes demonstrating a commitment to protecting our climate.
Don’t block environmental progress. Nothing hurts the environmental image of an automaker more than standing in the way of policies that protect the environment and public health. However, for the past four decades, most auto-makers have lobbied hard against improvements in vehicle safety, emissions, and fuel economy.
In order to increase the confidence of inves-tors, participate as a good corporate citizen, and expand their consumer base, automakers should support federal and state environmental laws instead of trying to block them. Putting engineers to work instead of lawyers can create tangible progress that will have a much greater impact on an automaker’s image than uncertain promises of advanced technologies.
25

Automaker Rankings 2004
Increase “true green” marketing. By devoting an increased share of their $18 billion annual adver-tising budget to promote real-world environmen-tal improvements, automakers and dealers can help positively shape consumer attitudes toward environmental progress. This would help create environmental competition between the auto-makers, sending a clear signal to consumers that their car choices matter when it comes to public health and climate change, not to mention oil dependence.
These campaigns, however, must be based on “true green,” marketing—ads based on the real progress that automakers can achieve by capital-izing on efforts to put technology to work and support fleet-wide environmental progress.
Government, Investors, and Consumers
Promote corporate responsibility. Automakers at the leading edge of environmental stewardship are best positioned for financial success over the coming years, and investors can accelerate change by supporting environmental progress among the automakers. By putting their money in com-panies that demonstrate a firm commitment to improving the environment, investors send a clear message that cutting smog and global warming pollution should be a priority to auto-makers. Investors with existing shares in dirtier companies can also effect change by using their positions as shareholders to push for improved environmental practices.
Increase government support. Lawmakers and regulators have many roles they can play in improving the environmental performance of automakers. By setting new standards that cap or regulate global warming emissions in the auto sector, increase alternative fuel use, improve fuel economy, or some combination of these, the same progress that has been seen on smog-forming pollution can be achieved with global warming. Vital financial support for cleaner cars can be provided by a combination of per-formance-based tax credits for automakers that retrofit existing U.S. plants to produce cleaner vehicles and for consumers who purchase cleaner vehicles.
Purchase cleaner cars. If automakers and gov-ernment do their part, the consumer’s job is easy: just go out and choose among a wide variety of clean cars and trucks that have the same power, performance, and safety as they do today. But until then, consumers can use their purchasing power to show automakers that environmental performance is more important than environ-mental image. Consumers should always try to purchase the cleanest, most fuel-efficient car or truck that meets their needs. When all else is equal between two vehicles, consumers can use these rankings to help decide how to use their purchasing power to reward the better overall automaker.
26

Union of Concerned Scientists
American Thoracic Society (ATS). 1996. “Health Effects of Outdoor Air Pollution.” American Journal of Respiratory and Critical Care Medicine153:3–50.
Automotive News. 2004. “Automakers’ ad spend-ing by media, 2003 vs. 2002, in thousands of dollars.” Online at http://www.autonews.com/files/03adspending412.pdf.
Bedsworth, L.W. 2004. Climate Control: Global Warming Solutions for California Cars. Cambridge, MA: Union of Concerned Scientists. April.
Davis, S.C. and S.W. Diegel. 2003. Transportation Energy Data Book. Edition 23. Oak Ridge, TN: Oak Ridge National Laboratory.
Energy Information Administration (EIA). 2003. Annual Energy Outlook 2003 with Projections to 2025. DOE/EIA-0383. Washington, DC: Department of Energy. January 9. Online at http://www.eia.doe.gov/oiaf/aeo/index.html.
Environmental Protection Agency (EPA). 2002. Health Assessment Document for Diesel Engine Exhaust. EPA/600/8-90/057F. Washington, DC. May.
Field, C.B., G.C. Daily, F.W. Davis, S. Gaines, P.A. Matson, J. Melack, and N.L. Miller. 1999. Confronting Climate Change in California: Ecological Impacts on the Golden State.Cambridge, MA: Union of Concerned Scientists and Ecological Society of America. November.
Fortune. 2003. The 2003 Global 500. Online at http://www.fortune.com/fortune/global500/subs/archive/2003/fulllist/0,17689,,00.html.
Hellman, K.H. and R.M. Heavenrich. 2004. Light-Duty Automotive Technology and Fuel Economy Trends 1975 Through 2004. Ann Arbor, Economy Trends 1975 Through 2004. Ann Arbor, Economy Trends 1975 Through 2004MI. December.
Intergovernmental Panel on Climate Change (IPCC). 2001. Climate Change 2001: The Scientific Basis. Cambridge: Cambridge University Press.
Koren, H.S. 1995. “Associations between Criteria Air Pollutants and Asthma.” Health Effects Research Laboratory. U.S. EPA. Presented at the Workshop on Air Toxics and Asthma—Impacts and End Points. Houston, TX. February 4.
Mark, J. 2002. Automaker Rankings: The Environmental Performance of Car Companies.Cambridge, MA: Union of Concerned Scientists. September.
Marland, G., T.A. Boden, R.J. Andres, A.L. Brenkert, and C.A. Johnston. 1996. Global, Regional, and National Fossil Fuel CO2Regional, and National Fossil Fuel CO2Regional, and National Fossil Fuel CO Emissions2 Emissions2 . Oak Ridge, TN: Carbon Dioxide Information Analysis Center. Online at http://cdiac.esd.ornl.gov/trends/emis/em_cont.htm.
Morey, C., R. Hwang, J. Kliesch, and J. DeCicco. 2000. Pollution Lineup: An Environmental Ranking of Automakers.Cambridge, MA: Union of Concerned Scientists. March.
National Automobile Dealers Association (NADA). 2004. NADA Data. pp. 43–63. May. Online at http://www.nada.org/Content/NavigationMenu/Newsroom/NADAData/20043/NADA_Data_2004.pdf.
References
27
Automaker Rankings 2004
Schneider, S. and J. Sarukhan. 2001. Overview of Impacts, Adaptation, and Vulnerability to Climate Change. Climate Change 2001: Impacts, Adaptation, and Vulnerability. Cambridge: Cambridge University Press.
Stoffer, H. 2004. “Automakers seek image boost with ads.” Automotive News. Detroit, MI: Crain Communications, Inc. March 29.
Ward’s Reference Center. 2002. U.S. Total Vehicle Registrations by Type by State, 2002. Online at http://www.wardsauto.com.
Weiss, M. et al. 2000. On the Road in 2020: A life-cycle analysis of new automobile technolo-gies. Cambridge, MA: Massachusetts Institute of Technology. Online at http://web.mit.edu/energylab/www/pubs/el00-003.pdf.
White, M.C., R.A. Etzel, W.D. Wilcox, C. Lloyd. 1994. “Exacerbations of Childhood Asthma and Ozone Pollution in Atlanta.” Environmental Research 65:56–68.Environmental Research 65:56–68.Environmental Research
28

Union of Concerned Scientists
Appendix A: Methodology
Automakers EvaluatedTo develop these rankings, we focused on the six automakers that together account for 90 percent of vehicle sales in the United States: General Motors (28 percent), Ford (21 per-cent), DaimlerChrysler (15 percent), Toyota (12 percent), Honda (9 percent), and Nissan (5 percent). Vehicles from these Big Six auto-makers accounted for approximately 91 percent of heat-trapping emissions and 93 percent of smog-forming emissions from new light-duty vehicles8 in 2003.
Classification of VehiclesIn this report, vehicles were divided into car and light truck categories according to the defi-nitions used by the National Highway Traffic Safety Administration (NHTSA) in regulat-ing fuel economy. Two notable exceptions were made to this rule, following the lead of
the Environmental Protection Agency’s (EPA) Fuel Economy Trends Report (Hellman and Heavenrich, 2004): the Chrysler PT Cruiser and the Volvo XC70, which exploit loopholes in the government’s definition of “light truck,” were restored to their appropriate categories (the small and midsize car classes, respectively).
In its Green Vehicle Guide, the EPA classifies cars as small, midsize, large, or station wagons. These are the same subdivisions that were used in this report, except that the wagon class was eliminated and station wagons were reassigned to the same classes as their sedan counterparts. Models that did not come in a sedan version were assigned based on the EPA’s size designation as listed online at http://www.fueleconomy.gov. For example, the Lexus RX-300 is listed as a midsize wagon, so it was reclassified as a midsize car.
Trucks were subdivided into four classes based on weight, as shown in Table A-1. These
8 A light-duty vehicle is a vehicle with a gross vehicle weight (the maximum design loaded weight of a single vehicle as specified by the manufacturer) of less than 8,500 lbs.
Table A-1: Light-Duty Truck Classes, by Weight
Size Federal Classifi cation California Classifi cationGross Vehicle Weight
(lbs.)Loaded Vehicle Weight
(lbs.)Adjusted Loaded
Vehicle Weight (lbs.)
Small LDT1 LDT1 ≤6,000 ≤3,750
Medium LDT2 LDT2 ≤6,000 >3,750
Large LDT3 MDV1 6,001-8,500 ≤3,750
Large LDT3 MDV2 6,001-8,500 3,751-5,750
Largest LDT4 MDV3 6,001-8,500 >5,750
Notes:
1. LDT = light-duty truck. MDV = medium-duty vehicle. Gross vehicle weight is the maximum design loaded weight of a single vehicle as specified by the manufacturer. Loaded vehicle weight is the curb weight plus 300 lbs. Adjusted loaded vehicle weight is the average of curb weight and gross vehicle weight.
29

Automaker Rankings 2004
are the same classes that are used in federal and California smog-forming emissions regulations.
Model-by-Model Comparisons. In selecting mod-els for head-to-head comparisons, an attempt was made to focus on a top-selling model from each manufacturer, while preserving fairness in the choices. For example, Nissan’s top-selling small car is the sporty 3.5-liter Infiniti G35, but it is hardly reasonable to compare it with the more utilitarian Ford Focus, Honda Civic, and Toyota Corolla. Therefore, the less popular Sentra was chosen since it competes more directly with the other models under consideration.
Similarly, in the small SUV category, most manufacturers’ offerings had engines in the 2.0-liter to 2.4-liter range. Although the 3.0-liter Ford Escape is far more common than the 2.0-liter version, the 2.0-liter version compares more closely with the other manufacturers’ top sellers in this segment, and thus was chosen for the comparison.
Where both regular and flex-fuel versions of an engine exist, such as in the Dodge Stratus V-6, sales-weighted averages of the fuel economy and smog-forming emissions for the two versions were used to calculate an average score for the vehicle.
Pollutants EvaluatedIn this ranking, automakers were scored on their emissions of two main classes of pollutants: heat-trapping gases and smog-forming emissions. There are numerous other environmental criteria worth evaluating in vehicles, including emissions of particulate matter, carbon monoxide, and toxics such as formaldehyde, as well as noise pol-lution. However, stemming global warming and
urban smog are arguably the top environmental challenges facing the auto industry today.
Smog-Forming Emissions. Since the 1960s, when vehicle emissions regulations were first intro-duced, cars and trucks sold in the United States have become much cleaner. However, many urban areas still suffer from poor air quality. On top of that, increases in vehicle ownership, miles traveled, and time spent sitting in traffic all mean that vehicles must continue to get cleaner just to maintain the gains that have been made.
Vehicles sold in the United States must satisfy standards governing their emissions of carbon monoxide, particulate matter, nitrogen oxides (NOx), and non-methane organic gases (NMOG).9 The latter two pollutants react in the presence of sunlight to produce ground-level ozone, a key component of urban smog. To determine the overall smog-forming potential of a vehicle, the rates at which it emits NOx and NMOG can be added together to obtain a rate for what are collectively termed “smog-forming emissions.” This composite value is the criterion by which the smog-forming potential of vehicles is judged in this report.
Heat-Trapping Emissions. Heat-trapping gases that are emitted from cars and trucks during operation include air conditioning refrigerants, nitrous oxide, methane, and carbon dioxide (CO2). Heat-trapping gases are characterized according to global warming potential (GWP), a measure of how strongly a gas insulates Earth (Table A-2, p. 31). By definition, the GWP of CO2 is unity, and the heat-trapping abilities of other gases are indexed to this standard.
9 Federal Tier 1 standards regulate emissions of non-methane hydrocarbons (HC-NM), which comprise organic compounds other than methane that contain only carbon and hydrogen. Federal National Low Emission Vehicle (NLEV) and Tier 2 regulations, as well as California regulations, set limits on non-methane organic gases (NMOG), which include hydrocarbons, alcohols, ketones, aldehydes, and other organic compounds that contribute to ground-level ozone formation. In this report, where NOx + NMOG values are given in the context of Tier 1 regulations, the Tier 1 HC-NM standard was used as a conservative estimate of the NMOG emissions.
30

Union of Concerned Scientists
HFC-134a, a hydrofluorocarbon, is the standard refrigerant used in automotive air con-ditioners, and due to its high GWP, even small amounts can have a substantial global warming impact. Emissions of HFC-134a can be reduced by improving air conditioners to better guard against leaks, and by replacing it with an alterna-tive refrigerant that has a lower GWP.
Methane and nitrous oxide are byproducts of the combustion process. Emissions of these pollutants can be reduced by improving emis-sion-control systems, especially the catalysts these systems use.
CO2 is an unavoidable byproduct of fossil fuel combustion. In addition, CO2 and other heat-trapping gases are released by the resource extraction and refining processes used to produce these fuels. These emissions can be reduced by burning less fuel, or by replacing gasoline with a lower-carbon fuel such as natural gas.
Unfortunately, detailed heat-trapping emis-sions profiles are not available for most vehicles. It is, therefore, not possible to compare differ-ent manufacturers on the basis of all their global warming emissions. However, data are widely available for the fuel economy and fuel type used for every car and light truck sold in the United States. As such, the heat-trapping emissions resulting from fuel production and use are used to compare the manufacturers with one another in this report.
Data SourcesData were gathered from a variety of government sources to compile a comprehensive database of the vehicles sold by each manufacturer. Data on each model’s smog-forming emissions came from two EPA sources: the Green Vehicle Guide and the Annual Certification Test Results Report.10
Fuel economy data came from a database used by NHTSA to track Corporate Average Fuel Economy (CAFE) compliance, and sales data came from two databases held by the EPA.11
Smog-Forming Emissions. The first and most critical source of data on smog-forming emis-sions was the EPA’s Green Vehicle Guide. This guide lists each model and configuration of vehi-cle sold in the United States, distinguishing them according to class (e.g., small car, SUV, van), engine size, transmission, sales area, fuel econo-my, emission standard (e.g., Tier 1, LEV), engine family, and the EPA’s own air pollution score.
Light-duty vehicles are certified to one of several standards for smog-forming emissions, and for each standard there are specific criteria for NOx, NMOG, particulates, and carbon monoxide that the vehicle must meet over a predetermined test cycle. The emission rate per-mitted depends on the vehicle’s size class, but the vehicle must meet all the criteria in order to be certified. These standards are the basis of the EPA’s air pollution scores.
Engine manufacturers assign a unique engine family number to each group of engines that has the same primary characteristics. A manufacturer might install a particular engine family in several different vehicle models, while one vehicle model might contain several different engine families. Moreover, a particular engine family might be certified to several different emission standards, even in the same vehicle model.
10 The Green Vehicle Guide is available online at http://www.epa.gov/autoemissions/. The Annual Certification Test Results Report is online at http://www.epa.gov/autoemissions/. The Annual Certification Test Results Report is online at http://www.epa.gov/autoemissions/ http://www.epa.gov/otaq/crttst.htm.
11 Data were supplied upon request.
31
Table A-2. Common Heat-Trapping Gases from Vehicles
Gas GWP
Carbon Dioxide 1
Methane 21
Nitrous Oxide 310
HFC-134a 1,300

Automaker Rankings 2004
The sales area is the region(s) of the coun-try in which a vehicle is certified to be sold. Generally, most vehicles are certified to be sold (a) in California and the other states that followed California’s emissions guidelines in 2003—Maine, Massachusetts, New York, and Vermont; (b) in states that do not follow California’s standards; (c) everywhere in the country; or (d) in urban areas with poor air quality, designated as Federal Clean Fuel Fleet areas—Atlanta, Chicago, Milwaukee, and Denver.
The second source of smog data, the EPA Annual Certification Test Results Report, sum-marizes the results of tests that the EPA performs on selected vehicle models. It includes data on model, engine family, transmission, sales area, emission standard, and certification level (the actual emission rate of a pollutant as measured by the EPA).
Heat-Trapping Emissions. As discussed previously, there are no comprehensive data available on emissions of all heat-trapping gases from individual automobile models. However, NHTSA keeps a database that contains data on fuel economy and fuel type used for each model of vehicle that is subject to CAFE standards. Within this database, the vehicles are broken out according to engine size, transmission type, and drive system. This database also contains preliminary sales estimates for each light-duty vehicle model sold in MY03. Although an accu-rate inventory of all heat-trapping gases from a vehicle is not feasible, it is possible to determine that portion of heat-trapping gases attributable to the burning of fuel.
Sales. Sales data came from two databases held by the EPA: one was similar to the NHTSA database mentioned above, containing the final year-end sales figures broken out by model,
engine size, transmission, and drive system; and the other listed sales of engines according to manufacturer and engine family.
Data Analysis
The sales, fuel economy, and emissions data collected from NHTSA and the EPA were com-bined into one master database, which was then used to calculate the average smog-forming and heat-trapping emissions for each manufacturer. This arrangement also enabled analyses broken out by vehicle class, model, engine, and other relevant criteria.
Combining the Databases. To develop a compre-hensive picture of the fleet of vehicles sold in the United States, the various sources of data had to be combined, with the goal of obtaining val-ues for sales, fuel economy, and smog-forming emissions.
First, the NHTSA fuel economy data and the EPA model sales data were merged. In a few cases, final sales numbers were missing from the EPA data, and in these cases NHTSA’s prelimi-nary sales estimates were used.
Next, the Green Vehicle Guide data were matched to the sales data by comparing model name, drive system, engine size, transmission type, fuel, and/or fuel economy. In many cases, there were multiple configurations listed in the Guide for a single model. This generally occurred when:
(1) The model was available with a particular engine that was certified to multiple stan-dards;
(2) The model was available with multiple engines that were the same size but came from different families; or
(3) A combination of the above.
32

Union of Concerned Scientists
In these cases, the model sales were distribut-ed among the different configurations according to the following procedures:
(1) Sales Area Split:
a. If there was a California-specific configura-tion, as defined by sales area, the sales were broken up according to state-by-state regis-tration data as shown in Table A-3.
b. If there was both a Federal Clean Fuel Fleet sales area and a nationwide sales area, the Federal sales12 were split 90/10 between these two sales areas, respectively.
(2) Engine Family Split: If there were multiple engine families within any sales area, the sales were split according to the overall ratio of engines sold, as determined from the EPA engine family sales database.
(3) The benefit of the doubt: In many cases, automakers certified some engines both to the weaker Tier 1 emission standard and to more stringent standards, but not enough
information was available to differentiate sales between the two standards within a sales area. We have given such cases the benefit of the doubt and assumed that 75 percent of the vehicles were certified to the more stringent standard, and the remainder certified to the more lax standard.
Calculation of Average Smog-Forming Emissions.
To determine the average smog-forming emis-sions from each manufacturer, a sales-weighted average of the certification standards was calcu-lated using the sales figures estimated, according to the procedure described above.
Calculation of Average Heat-Trapping Emissions.
Due to inadequate data, it is not possible to compare the emissions of heat-trapping gases such as methane or HFC-134a from different vehicles. It is possible, however, to calculate a vehicle’s emissions of heat-trapping gases due to burning fuel, based on its fuel economy and the fuel used. With a few exceptions, all the vehicles that the Big Six automakers sold in the United States in 2003 burned gasoline.
To determine the heat-trapping emissions from a vehicle (denoted as grams per mile), it was assumed that each gallon of gasoline burned releases 11.1 kilograms of CO2-equivalent heat-trapping gases into the atmosphere. This result is for federal reformulated gasoline and includes tailpipe CO2 as well as heat-trapping emissions released during fuel production and delivery (upstream emissions). This emission factor is based on the GREET 1.6ß model developed by Argonne National Laboratory,13 and is the same value used in the previous Automaker Rankings report.
12 “Federal sales” denotes vehicle sales outside of California and other states that followed California’s emissions regulations in 2003 (Maine, Massachusetts, New York, and Vermont), as determined in part (a) of the sales area split.
13 Downloaded from http://www.anl.gov.
33
Table A-3. Sales Area Splits
Vehicle TypeCalifornia Sales Area1
ShareFederal Sales Area2
Share
Car 22.5% 77.5%
Pickup 13.6% 86.4%
Van 18.8% 81.2%
SUV 19.3% 80.7%
Source: Ward’s Reference Center, 2002.
Notes:
1. Sales area includes California, Maine, Massachusetts, New York, and Vermont.
2. Sales area includes all areas not covered under California sales area.

Automaker Rankings 2004
Flexible and Alternative Fuel Vehicles. The fuel economy data maintained for CAFE compli-ance purposes includes credits assigned to certain vehicles that operate on an alternative fuel only (an alternative fuel vehicle), or on both an alter-native fuel and gasoline (a bi-fuel or flex-fuel vehicle (FFV)). These credits increase the fuel economy of these vehicles to account for their reduced oil consumption. However, data from a joint study by the Department of Transportation, Department of Energy, and EPA indicate that bi-fuel and flex-fuel vehicles operate on their respective alternative fuels less than one percent of the time,14 indicating that the credits provided are significantly inflated. As a result, the fuel economies used in the heat-trapping emissions calculation were adjusted to reflect operation on gasoline 100 percent of the time.15 The CAFE-certified fuel economies of dedicated natural-gas vehicles were left unchanged since these vehicles can only operate on natural gas.
Test Results vs. Real-World ConditionsThe results for smog-forming and heat-trapping emissions reported in this study should be taken as relative values only. The certification standards for smog-forming emissions represent the results of laboratory testing of vehicles under carefully specified environmental and driving conditions, using a particular fuel blend. The rigors of real-world driving can take their toll on vehicles, which can emit considerably more pollution than their certification values indicate. For this reason, the emissions of smog-forming pollutants reported in this study should be used only for
comparative purposes within this context, and should not be compared with smog estimates in other sources. Nevertheless, we believe that the certification values are an appropriate means to compare one vehicle with another that has been tested in the same way.
For much the same reason, the fuel economy and heat-trapping emissions values reported here should be used for comparative purposes only. The fuel economy values reported here are the CAFE test values, which are calculated as a 55/45 weighted average of the fuel economies measured on the EPA city and highway driving cycles, respectively. The EPA has long acknowl-edged that these tests do not accurately reflect real-world fuel economy, and for the last 20 years has applied a correction factor to these values to obtain the window-sticker fuel economy values with which we are familiar. The EPA’s window-sticker values are approximately 15 to 20 percent below the test values used in this analysis, but even these adjusted values are thought by many people to be too high.
The actual heat-trapping emissions from burning fuel in a vehicle are at least 20 percent higher than calculated here, and possibly much more. Actual emissions will depend on the par-ticular vehicle in question and how it is driven. Nevertheless, for purposes of comparing one vehicle with another and one manufacturer with another, these results should provide a reasonable basis for comparison, and a rather conservative estimate of the absolute emissions.
14 DOT, DOE, EPA. 2002. Report to Congress: Effects of the Alternative Motor Fuels Act CAFE Incentives Policy. March. Online at http://www.nhtsa.dot.gov/cars/rules/rulings/CAFE/alternativefuels.
15 Bi-fuel vehicles had fuel economies for gasoline operation listed in the NHTSA database, and these values were taken as the actual fuel economies. For a limited number of FFVs, the NHTSA database also contained two fuel economy values—a CAFE value and an actual value. The CAFE values ranged from 1.66 to 1.69 times the actual value. As a conservative estimate, the actual fuel economies of the remaining FFVs were calculated by dividing the CAFE value by 1.66.
34
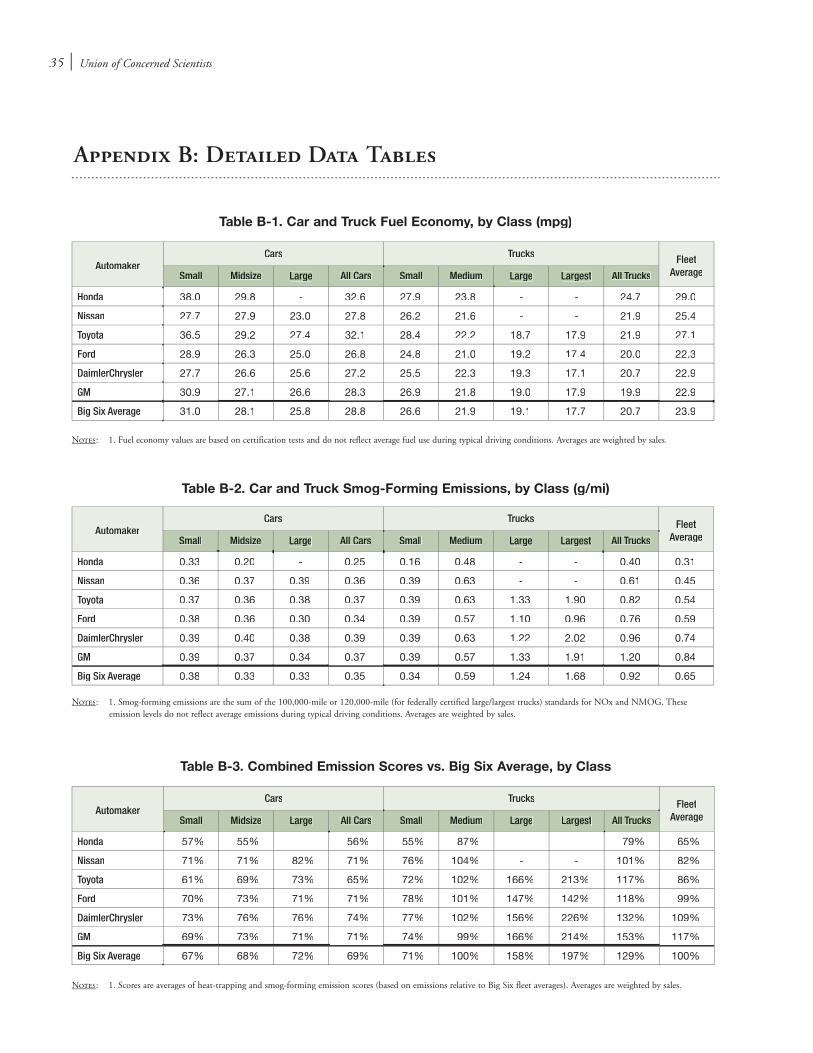
Union of Concerned Scientists
Appendix B: Detailed Data Tables
Table B-1. Car and Truck Fuel Economy, by Class (mpg)
Notes: 1. Fuel economy values are based on certification tests and do not reflect average fuel use during typical driving conditions. Averages are weighted by sales.
AutomakerCars Trucks Fleet
AverageSmall Midsize Large All Cars Small Medium Large Largest All Trucks
Honda 38.0 29.8 - 32.6 27.9 23.8 - - 24.7 29.0
Nissan 27.7 27.9 23.0 27.8 26.2 21.6 - - 21.9 25.4
Toyota 36.5 29.2 27.4 32.1 28.4 22.2 18.7 17.9 21.9 27.1
Ford 28.9 26.3 25.0 26.8 24.8 21.0 19.2 17.4 20.0 22.3
DaimlerChrysler 27.7 26.6 25.6 27.2 25.5 22.3 19.3 17.1 20.7 22.9
GM 30.9 27.1 26.6 28.3 26.9 21.8 19.0 17.9 19.9 22.9
Big Six Average 31.0 28.1 25.8 28.8 26.6 21.9 19.1 17.7 20.7 23.9
AutomakerCars Trucks Fleet
AverageSmall Midsize Large All Cars Small Medium Large Largest All Trucks
Honda 0.33 0.20 - 0.25 0.16 0.48 - - 0.40 0.31
Nissan 0.36 0.37 0.39 0.36 0.39 0.63 - - 0.61 0.45
Toyota 0.37 0.36 0.38 0.37 0.39 0.63 1.33 1.90 0.82 0.54
Ford 0.38 0.36 0.30 0.34 0.39 0.57 1.10 0.96 0.76 0.59
DaimlerChrysler 0.39 0.40 0.38 0.39 0.39 0.63 1.22 2.02 0.96 0.74
GM 0.39 0.37 0.34 0.37 0.39 0.57 1.33 1.91 1.20 0.84
Big Six Average 0.38 0.33 0.33 0.35 0.34 0.59 1.24 1.68 0.92 0.65
Notes: 1. Smog-forming emissions are the sum of the 100,000-mile or 120,000-mile (for federally certified large/largest trucks) standards for NOx and NMOG. These emission levels do not reflect average emissions during typical driving conditions. Averages are weighted by sales.
Table B-2. Car and Truck Smog-Forming Emissions, by Class (g/mi)
AutomakerCars Trucks Fleet
AverageSmall Midsize Large All Cars Small Medium Large Largest All Trucks
Honda 57% 55% - 56% 55% 87% - - 79% 65%
Nissan 71% 71% 82% 71% 76% 104% - - 101% 82%
Toyota 61% 69% 73% 65% 72% 102% 166% 213% 117% 86%
Ford 70% 73% 71% 71% 78% 101% 147% 142% 118% 99%
DaimlerChrysler 73% 76% 76% 74% 77% 102% 156% 226% 132% 109%
GM 69% 73% 71% 71% 74% 99% 166% 214% 153% 117%
Big Six Average 67% 68% 72% 69% 71% 100% 158% 197% 129% 100%
Table B-3. Combined Emission Scores vs. Big Six Average, by Class
Notes: 1. Scores are averages of heat-trapping and smog-forming emission scores (based on emissions relative to Big Six fleet averages). Averages are weighted by sales.
35

Automaker Rankings 2004
Cars Trucks Fleet
FFV Share of Sales
CAFE w/ Credits (mpg)
CAFE w/o Credits (mpg)
FFV Share of Sales
CAFE w/ Credits (mpg)
CAFE w/o Credits (mpg)
FFV Share of Sales
CAFE w/ Credits (mpg)
CAFE w/o Credits (mpg)
Honda - 32.6 32.6 - 24.7 24.7 - 29.0 29.0
Nissan - 27.8 27.8 - 21.9 21.9 - 25.4 25.4
Toyota - 32.1 32.1 - 21.9 21.9 - 27.1 27.1
Ford 7% 27.6 26.8 17% 21.2 20.0 13% 23.4 22.3
DaimlerChrysler 3% 27.6 27.2 18% 21.9 20.7 12% 23.9 22.9
GM - 28.3 28.3 14% 21.1 19.9 8% 23.7 22.9
Big Six Average 2% 29.1 28.8 13% 21.8 20.7 7% 24.6 23.9
Notes:
1. Fuel economy values, with or without FFV credits, are based on certification tests and do not reflect average fuel use during typical driving conditions.
2. Averages are weighted by sales.
Table B-4. Effect of Flex-Fuel Vehicle Credits on Corporate Average Fuel Economy
Pickups Vans SUVs
Fuel Economy
(mpg)
Smog-Forming
Emissions (g/mi)
Combined Score vs.
Fleet Average
Fuel Economy
(mpg)
Smog-Forming
Emissions (g/mi)
Combined Score vs.
Fleet Average
Fuel Economy
(mpg)
Smog-Forming
Emissions (g/mi)
Combined Score vs.
Fleet Average
Honda - - - 24.0 0.63 98% 25.0 0.30 71%
Nissan 22.4 0.55 96% - - - 21.8 0.63 103%
Toyota 21.0 0.81 119% 24.7 0.63 97% 22.3 0.84 118%
Ford 20.2 0.86 126% 22.4 0.52 94% 19.4 0.73 118%
DaimlerChrysler 18.0 1.67 195% 24.1 0.73 106% 20.8 0.67 109%
GM 19.6 1.18 152% 22.8 0.80 114% 19.6 1.29 161%
Big Six Average 19.7 1.09 145% 23.4 0.69 104% 20.5 0.88 126% Notes:
1. Fuel economy values are based on certification tests and do not reflect average fuel use during typical driving conditions.
2. Smog-forming emissions are the sum of the 100,000-mile or 120,000-mile (for federally certified large/largest trucks) standards for NOx and NMOG. These emission levels do not reflect average emissions during typical driving conditions.
3. Averages are weighted by sales.
Table B-5. Truck Fuel Economy and Smog-Forming Emissions, by Type
36
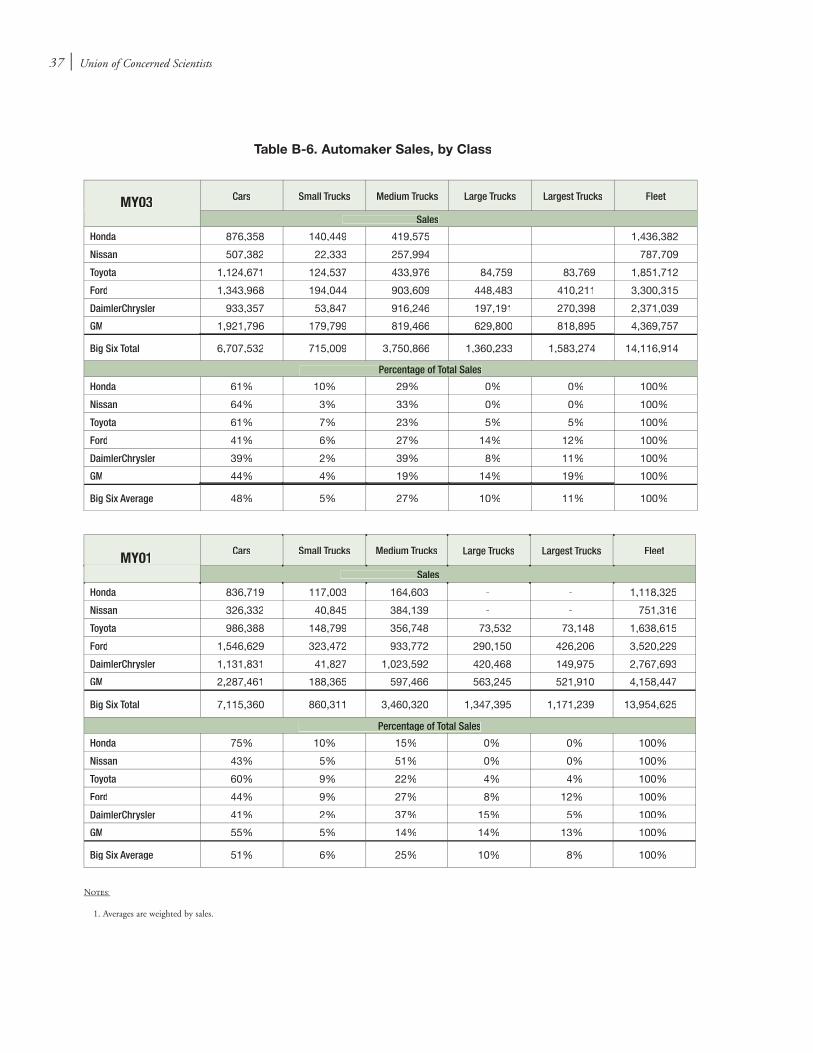
Union of Concerned Scientists
Cars Small Trucks Medium Trucks Large Trucks Largest Trucks Fleet
Sales
Honda 876,358 140,449 419,575 - - 1,436,382
Nissan 507,382 22,333 257,994 - - 787,709
Toyota 1,124,671 124,537 433,976 84,759 83,769 1,851,712
Ford 1,343,968 194,044 903,609 448,483 410,211 3,300,315
DaimlerChrysler 933,357 53,847 916,246 197,191 270,398 2,371,039
GM 1,921,796 179,799 819,466 629,800 818,895 4,369,757
Big Six Total 6,707,532 715,009 3,750,866 1,360,233 1,583,274 14,116,914
Percentage of Total Sales
Honda 61% 10% 29% 0% 0% 100%
Nissan 64% 3% 33% 0% 0% 100%
Toyota 61% 7% 23% 5% 5% 100%
Ford 41% 6% 27% 14% 12% 100%
DaimlerChrysler 39% 2% 39% 8% 11% 100%
GM 44% 4% 19% 14% 19% 100%
Big Six Average 48% 5% 27% 10% 11% 100%
Cars Small Trucks Medium Trucks Large Trucks Largest Trucks Fleet
Sales
Honda 836,719 117,003 164,603 - - 1,118,325
Nissan 326,332 40,845 384,139 - - 751,316
Toyota 986,388 148,799 356,748 73,532 73,148 1,638,615
Ford 1,546,629 323,472 933,772 290,150 426,206 3,520,229
DaimlerChrysler 1,131,831 41,827 1,023,592 420,468 149,975 2,767,693
GM 2,287,461 188,365 597,466 563,245 521,910 4,158,447
Big Six Total 7,115,360 860,311 3,460,320 1,347,395 1,171,239 13,954,625
Percentage of Total Sales
Honda 75% 10% 15% 0% 0% 100%
Nissan 43% 5% 51% 0% 0% 100%
Toyota 60% 9% 22% 4% 4% 100%
Ford 44% 9% 27% 8% 12% 100%
DaimlerChrysler 41% 2% 37% 15% 5% 100%
GM 55% 5% 14% 14% 13% 100%
Big Six Average 51% 6% 25% 10% 8% 100%
Table B-6. Automaker Sales, by Class
Notes:
1. Averages are weighted by sales.
MY03
MY01
37
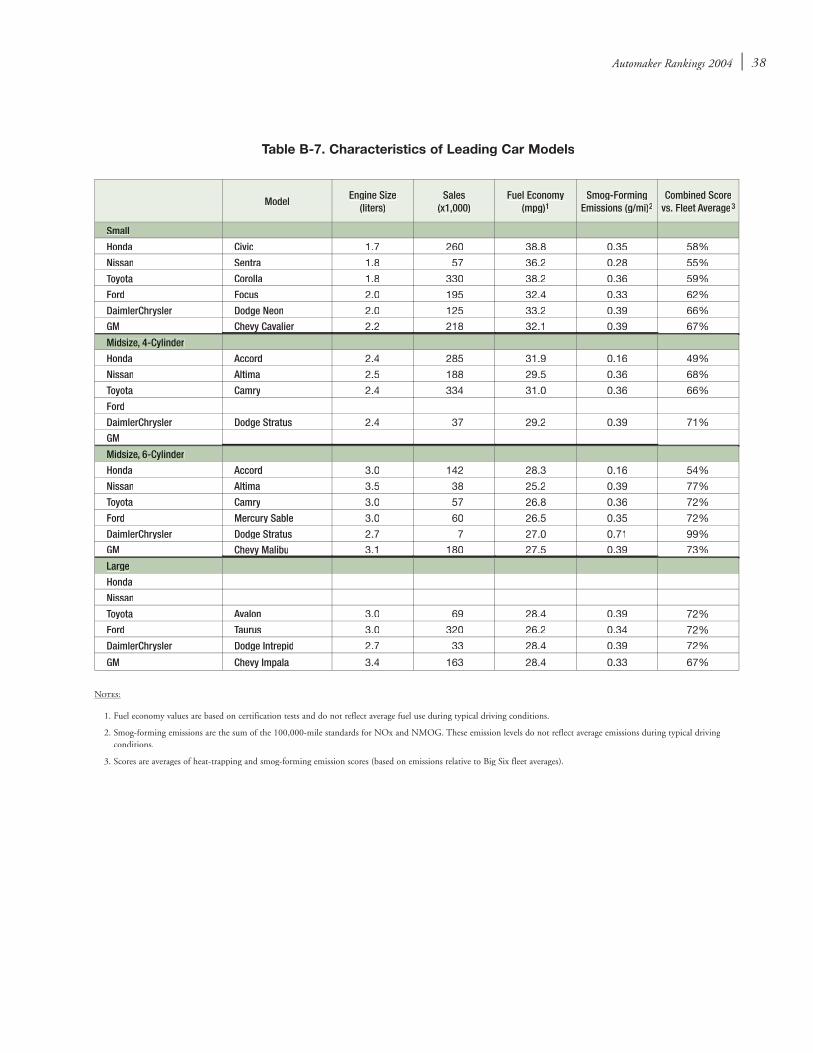
Automaker Rankings 2004
ModelEngine Size
(liters)Sales
(x1,000)Fuel Economy
(mpg)1Smog-Forming
Emissions (g/mi)2Combined Score
vs. Fleet Average3
Small
Honda Civic 1.7 260 38.8 0.35 58%
Nissan Sentra 1.8 57 36.2 0.28 55%
Toyota Corolla 1.8 330 38.2 0.36 59%
Ford Focus 2.0 195 32.4 0.33 62%
DaimlerChrysler Dodge Neon 2.0 125 33.2 0.39 66%
GM Chevy Cavalier 2.2 218 32.1 0.39 67%
Midsize, 4-Cylinder
Honda Accord 2.4 285 31.9 0.16 49%
Nissan Altima 2.5 188 29.5 0.36 68%
Toyota Camry 2.4 334 31.0 0.36 66%
Ford
DaimlerChrysler Dodge Stratus 2.4 37 29.2 0.39 71%
GM
Midsize, 6-Cylinder
Honda Accord 3.0 142 28.3 0.16 54%
Nissan Altima 3.5 38 25.2 0.39 77%
Toyota Camry 3.0 57 26.8 0.36 72%
Ford Mercury Sable 3.0 60 26.5 0.35 72%
DaimlerChrysler Dodge Stratus 2.7 7 27.0 0.71 99%
GM Chevy Malibu 3.1 180 27.5 0.39 73%
Large
Honda
Nissan
Toyota Avalon 3.0 69 28.4 0.39 72%
Ford Taurus 3.0 320 26.2 0.34 72%
DaimlerChrysler Dodge Intrepid 2.7 33 28.4 0.39 72%
GM Chevy Impala 3.4 163 28.4 0.33 67%
Table B-7. Characteristics of Leading Car Models
Notes:
1. Fuel economy values are based on certification tests and do not reflect average fuel use during typical driving conditions.
2. Smog-forming emissions are the sum of the 100,000-mile standards for NOx and NMOG. These emission levels do not reflect average emissions during typical driving conditions.
3. Scores are averages of heat-trapping and smog-forming emission scores (based on emissions relative to Big Six fleet averages).
38

Union of Concerned Scientists
Table B-8. Characteristics of Leading Truck Models
Notes:
1. Fuel economy values are based on certification tests and do not reflect average fuel use during typical driving conditions.
2. Smog-forming emissions are the sum of the 100,000-mile or 120,000-mile (for federally certified large/largest trucks) standards for NOx and NMOG. These emission levels do not reflect average emissions during typical driving conditions.
3. Scores are averages of heat-trapping and smog-forming emission scores (based on emissions relative to Big Six fleet averages).
39
Model
2-Wheel Drive 4-Wheel Drive
Engine Size (liters)
Sales (x1,000)
Fuel Economy (mpg)1
Smog-Forming
Emissions (g/mi)2
Combined Score
vs. Fleet Average3
Engine Size (liters)
Sales (x1,000)
Fuel Economy (mpg)1
Smog-Forming
Emissions (g/mi)2
Combined Score
vs. Fleet Average3
Small SUV
Honda CR-V 2.4 29 29.2 0.16 53% 2.4 112 27.6 0.16 56%
Nissan
Toyota RAV-4 2.0 41 30.3 0.39 69% 2.0 36 28.6 0.39 72%
Ford Escape 2.0 3 29.0 0.39 71%
DaimlerChrysler Mitsubishi Outlander 2.4 27 26.6 0.39 75% 2.4 22 25.3 0.39 77%
GM Saturn Vue 2.2 44 28.8 0.39 72% 2.2 15 26.4 0.39 75%
Midsize SUV
Honda Pilot 3.5 123 22.5 0.61 100%
Nissan Xterra 3.3 36 21.2 0.63 105% 3.3 35 20.6 0.63 107%
Toyota 4Runner 4.0 25 22.8 0.63 101% 4.0 28 21.9 0.63 103%
Ford Explorer 4.0 99 19.9 0.63 108% 4.0 150 19.6 0.63 109%
DaimlerChrysler Jeep Grand Cherokee 4.0 27 21.6 0.43 88% 4.0 56 21.1 0.43 90%
GM Chevy Trailblazer 4.2 75 20.5 0.63 107% 4.2 120 19.4 0.63 110%
Large SUV
Honda
Nissan
Toyota Sequoia 4.7 38 18.3 1.89 211% 4.7 31 18.0 1.89 212%
Ford Expedition 4.6 75 18.3 0.88 133% 4.6 13 17.7 0.88 135%
DaimlerChrysler Dodge Durango 4.7 35 20.2 1.12 145% 4.7 70 19.8 1.12 146%
GM Chevy Tahoe 4.8 31 19.0 1.88 207% 4.8 8 18.2 1.88 210%
Compact Pickup
Honda
Nissan Frontier 2.4 22 26.2 0.39 76% 3.3 19 20.4 0.63 107%
Toyota Tacoma 2.4 38 27.6 0.39 73% 3.4 46 20.6 0.63 106%
Ford Ranger 2.3 41 29.5 0.39 70% 4.0 62 19.5 0.63 110%
DaimlerChrysler Dodge Dakota 3.9 20 17.8 1.15 156%
GM Chevy S-10 2.2 59 26.6 0.39 75% 4.3 50 18.4 0.43 98%
Full-Size Pickup
Honda
Nissan
Toyota Tundra 4.7 43 19.2 1.33 165% 4.7 42 18.2 1.33 168%
Ford F-150 4.6 112 20.2 1.22 153% 4.6 41 19.0 1.03 142%
DaimlerChrysler Dodge Ram 1500 4.7 94 18.1 1.94 216% 4.7 45 17.1 1.94 219%
GM Chevy Silverado 4.8 99 19.7 1.34 164% 4.8 48 18.3 1.48 179%
Minivan
Honda Odyssey 3.5 165 24.0 0.63 98%
Nissan
Toyota Sienna 3.0 43 24.7 0.63 97%
Ford Windstar Wagon 3.8 145 23.2 0.33 76%
DaimlerChrysler Dodge Caravan 3.3 193 24.7 0.70 102% 3.8 3 22.9 0.63 101%
GM Chevy Venture 3.4 93 26.6 0.63 93% 3.4 3 23.4 0.63 100%

National Headquarters:
Two Brattle SquareTwo Brattle SquareTCambridge, MA 02238-9105Tel: (617) 547.5552 • Fax: (617) 864.9405
Washington, DC Office:
1707 H Street NW, Suite 600Washington, DC 20006-3962Tel: (202) 223.6133 • Fax: (202) 223.6162
West Coast Office:
2397 Shattuck Ave., Suite 203 Berkeley, CA 94704-1567Tel: (510) 843.1872 • Fax: (510) 843.3785
Web: www.ucsusa.org Email: [email protected]
JJust six companies are responsible for more than ust six companies are responsible for more than
90 percent of the emissions from new vehicles in
the United States. These automakers, which rank
among the largest corporations in the world, have
a dramatic impact on the air we breathe and the
climate we will pass on to future generations.
The lackluster environmental performance of
automakers has created an image problem for the
industry—a problem it is seeking to solve through
billion-dollar advertising campaigns and the unveil-
ing of “greener” products at auto shows. In a global
market where environmental stewardship is becom-market where environmental stewardship is becom-
ing a competitive priority, will the industry make a
true commitment to environmental progress?
This report helps consumers and investors sepa-
rate hype from reality by using government data to
quantitatively determine which automakers truly are quantitatively determine which automakers truly are
the greenest when the rubber meets the road. We
hope that our ranking will encourage automakers
to go beyond environmental rhetoric and put their
wealth of existing technology to work to create real-
world pollution progress.
Printed on recycled paper with soy-based inks
Automaker Rankings 2004The Environmental Performance of Car Companies