the entrepreneurnext door characteristics of …asalazar/kauffman/entrep_research/e_nextdoor.pdf ·...
TRANSCRIPT
Who is involved in starting businessesin the United States?
How do they go about the process ofstarting companies?
Which of these business start-up effortsare likely to result in new firms?
Why are some of these business start-up efforts successful in creating
high-growth businesses?
How can we increase the level of start-up activity in the United States —particularly in under-represented areas?
2002A N E X E C U T I V E S U M M A R Y O F
T H E P A N E L S T U D Y O F E N T R E P R E N E U R I A L D Y N A M I C S
T H E E N T R E P R E N E U R N E X T D O O R
C h a r a c t e r i s t i c s o f I n d i v i d u a l s S t a r t i n g C o m p a n i e s i n A m e r i c a
A R E P O R T S P O N S O R E D B Y
Paul D. ReynoldsBabson College
Nancy M. CarterUniversity of St. Thomas
William B. GartnerUniversity of Southern California
Patricia G. GreeneUniversity of Missouri, Kansas City
Larry W. CoxEwing Marion Kauffman
Foundation

2002A N E X E C U T I V E S U M M A R Y O F
T H E P A N E L S T U D Y O F E N T R E P R E N E U R I A L D Y N A M I C S
T H E E N T R E P R E N E U R N E X T D O O R
C h a r a c t e r i s t i c s o f I n d i v i d u a l s S t a r t i n g C o m p a n i e s i n A m e r i c a

Figure 1 Conceptualization of the Entrepreneurial Process . . . . . . . . . . . . . . . . . . . . . . . . . . . . . . . . . . . . . . . . . . .09
Figure 2 Research Design Overview . . . . . . . . . . . . . . . . . . . . . . . . . . . . . . . . . . . . . . . . . . . . . . . . . . . . . . . . . .11
Figure 3 Nascent Entrepreneur Prevalence Rates by Age and Gender . . . . . . . . . . . . . . . . . . . . . . . . . . . . . . . . . . . . .15
Figure 4 Nascent Entrepreneur Prevalence Rates by Ethnic Identity and Gender . . . . . . . . . . . . . . . . . . . . . . . . . . . . 15
Figure 5 Nascent Entrepreneur Prevalence Rates by Age, Gender and Ethnic Identity . . . . . . . . . . . . . . . . . . . . . . . . . 16
Figure 6 Nascent Entrepreneur Prevalence Rates by Education, Gender and Ethnic Identity . . . . . . . . . . . . . . . . . . . . . 17
Figure 7 Nascent Entrepreneur Prevalence Rates by Household Income, Gender and Ethnic Identity . . . . . . . . . . . . . . . 18
Figure 8 Nascent Entrepreneur Prevalence Rates by Dwelling Ownership, Gender and Ethnic Identity . . . . . . . . . . . . . . 19
Figure 9 Nascent Entrepreneur Prevalence Rates by Labor Force Participation, Gender and Ethnic Identity . . . . . . . . . . . 20
Figure 10 Nascent Entrepreneur Prevalence Rates by Marital Status, Gender and Ethnic Identity . . . . . . . . . . . . . . . . . . 21
Figure 11 Nascent Entrepreneur Prevalence Rates by Age of Children in the Household, Gender and Ethnic Identity . . . . . . . 22
Figure 12 Nascent Entrepreneur Prevalence Rates by Urbanness,Gender and Ethnic Identity . . . . . . . . . . . . . . . . . . . . .25
Table 1 Examples of Variables in the SCREENER . . . . . . . . . . . . . . . . . . . . . . . . . . . . . . . . . . . . . . . . . . . . . . . . .13
Table 2 Examples of Variables in the SAMPLE . . . . . . . . . . . . . . . . . . . . . . . . . . . . . . . . . . . . . . . . . . . . . . . . . . .13
Table 3 Urban Context Index: Selected Characteristics . . . . . . . . . . . . . . . . . . . . . . . . . . . . . . . . . . . . . . . . . . . . .24
Table A Reported Involvement in Start-up Activity . . . . . . . . . . . . . . . . . . . . . . . . . . . . . . . . . . . . . . . . . . . . . . .43
Table B Number of Respondents by State of Data Collection and Ethnic Background . . . . . . . . . . . . . . . . . . . . . . . . .47
Table C Estimated Number of Two-Criteria Nascent Entrepreneurs in the United States by Age, Gender, and Ethnic Identity . . . . . . . . . . . . . . . . . . . . . . . . . . . . . . . . . . . . . . . . . . . . . . . . . . .48
Table D Prevalence Rates by Gender and Ethnicity . . . . . . . . . . . . . . . . . . . . . . . . . . . . . . . . . . . . . . . . . . . . . . .49
Table E Selected Contextual Factors: Intercorrelations . . . . . . . . . . . . . . . . . . . . . . . . . . . . . . . . . . . . . . . . . . . . .49
L I S T O F F I G U R E S A N D T A B L E S

EXECUTIVE SUMMARY . . . . . . . . . . . . . . . . . . . . . . . . . . . . . . . . . . . . . . . . . . . . . . . . . . . . . . . 04
WHY STUDY NASCENT ENTREPRENEURS? . . . . . . . . . . . . . . . . . . . . . . . . . . . . . . . . . . . . . . . . . . . 06
HOW TO STUDY NASCENT ENTREPRENEURS: THE PSED MODEL AND RESEARCH DESIGN . . . . . . . . . . . . . . . 09
THE PSED DATASETS . . . . . . . . . . . . . . . . . . . . . . . . . . . . . . . . . . . . . . . . . . . . . . . . . . . . . . . . 12
HOW MANY START-UP ATTEMPTS IN THE UNITED STATES? TOTAL POPULATION ESTIMATES . . . . . . . . . . . . . 14
REGIONAL FACTORS AND NASCENT ENTREPRENEURSHIP ACTIVITY . . . . . . . . . . . . . . . . . . . . . . . . . . . . 23
CONCLUSIONS . . . . . . . . . . . . . . . . . . . . . . . . . . . . . . . . . . . . . . . . . . . . . . . . . . . . . . . . . . . . 27
THE ENTREPRENEUR NEXT DOOR — Five of Your Neighbors Who Are Starting Companies . . . . . . . . . . . . . 28
DESIGNING MEN — Alston Green . . . . . . . . . . . . . . . . . . . . . . . . . . . . . . . . . . . . . . . . 30
NURSING A SECOND BUSINESS — Rose Leidl . . . . . . . . . . . . . . . . . . . . . . . . . . . . . . . . . 32
¿HABLES ENTREPRENEURSHIP? — Mary De La Rosa . . . . . . . . . . . . . . . . . . . . . . . . . . . . . 34
GETTING AIRBORN — Miguel Hidalgo . . . . . . . . . . . . . . . . . . . . . . . . . . . . . . . . . . . . . . 36
TEXTBOOK CASE OF ENTREPRENEURSHIP — Seth Hendrickson and Zach McPherson . . . . . . . . . 38
WHERE DO WE GO FROM HERE? . . . . . . . . . . . . . . . . . . . . . . . . . . . . . . . . . . . . . . . . . . . . . . . . . 40
ENDNOTES . . . . . . . . . . . . . . . . . . . . . . . . . . . . . . . . . . . . . . . . . . . . . . . . . . . . . . . . . . . . . . 41
© 2002. Paul D. Reynolds, Nancy M. Carter, William B. Gartner, Patricia G. Greene, and the Ewing Marion Kauffman Foundation. All rights reserved.
C O N T E N T S

P S E D 2 0 0 2 E X E C U T I V E C O M M I T T E E , F U N D I N G S P O N S O R S A N D I N S T I T U T I O N S , S C HO L A R S
E X E C U T I V E C O M M I T T E E
Paul D. Reynolds, Babson CollegeCandida G. Brush, Boston UniversityNancy M. Carter, University of St. ThomasWilliam B. Gartner, University of Southern CaliforniaPer Davidsson, Jonkoping International Business SchoolPatricia G. Greene, University of Missouri, Kansas CityKelly G. Shaver, College of William & MaryMary Williams, University of Pennsylvania/Widener College
F U N D I N G S P O N S O R S
Ewing Marion Kauffman FoundationNational Science Foundation
F U N D I N G I N S T I T U T I O N S
Babson College Bodo Graduate School of Business Boston University Canadian Council on Small Business & Entrepreneurship CitibankClemson University Coleman Foundation EIM Small Business Research & Consultancy Entrepreneurship Theory & Practice Greek Entrepreneur’s Club Indiana University Finnvera plc. London Business School NFIB Educational Foundation NUTEK Rensselaer Polytechnic Institute RISEbusiness RWI/Essen Swinburne University Syracuse University Temple University University of British Columbia University of Cincinnati/Xavier University University of Colorado, Boulder University of Houston University of Michigan
University of Missouri, Kansas City University of North Carolina, Chapel Hill University of Pennsylvania/Widener University University of Southern California University of St. Thomas University of the Pacific U.S. Small Business Administration, Office of Advocacy
S C H O L A R S ( A S O F A U G U S T 3 1 , 2 0 0 2 )
Zolton Acs, University of Baltimore Howard E. Aldrich, University of North Carolina Kathleen Allen, University of Southern California Gry Alsos, Bodo Graduate School of Business Erkko Autio, Helsinki University of Technology Ray Babgy, Hankamer School of Business Karen A. Bantel, University of Michigan Robert Baron, Rensselaer Polytechnic Institute Sidney L. Barton, University of Cincinnati Robert E. Berney, U.S. Small Business Administration Barbara Bird, American University Dieter Bogenhold, University of Bremen Robert Brockhaus, Saint Louis University David Brophy, University of Michigan Candida Brush, Boston University Lowell W. Busenitz, University of Oklahoma John Sibley Butler, University of Texas, Austin Bill Bygrave, Babson College S. Michael Camp, Ewing Marion Kauffman FoundationNancy M. Carter, University of St. Thomas Rajeswararao Chaganti, Temple University Arnold Cooper, Purdue University Larry W. Cox, Ewing Marion Kauffman Foundation Bill Cunningham, Xavier University Richard Curtin, University of Michigan Rajiv Dant, Boston University Per Davidsson, Jonkoping International Business School Frederic Delmar, Stockholm School of Economics William Dennis, NFIB Education Foundation Monica Diochon, St. Francis Xavier University Marc Dollinger, Indiana University Kevin Dooley, Arizona State University Tom Douglas, Clemson University

Charles R. Duke, Clemson University William Dunkelberg, Temple University Gregory Fairchild, University of VirginiaCecilia Falbe, SUNY – Albany Jim Fiet, University of Louisville David Forsaith, Flinders University of Southern Australia Denis Garand, Universite Laval William B. Gartner, University of Southern California Yvon Gasse, Universite Laval Elizabeth Gatewood, Indiana University Patricia G. Greene, University of Missouri, Kansas City Gerald Gustafson, Beloit College Henrik Hall, Jonkoping International Business School Steven Hanks, Utah State University Michael Hay, London Business School Brian Headd, U.S. Small Business AdministrationMichael Hennessey, The Coleman Foundation. Inc. Robert Hill, California State University, Fresno T.L. Hill, Temple UniversityGerald E. Hills, University of Illinois at Chicago Kevin Hindle, Swinburne University of TechnologySherrie Human, Xavier University Steven Isberg, University of Baltimore Svenn Jenssen, Bodo Graduate School of Business Jerome Katz, Saint Louis University Lisa Keister, Ohio State University Bruce Kirchhoff, New Jersey Institute of Technology Matti Koiranen, University of Jyvaskyla Lars Kolvereid, Bodo Graduate School of Business Bernhard Lageman, Rheinisch-Westfaelisches Institute Rudy Lamont, University of Maryland Julian E. Lange, Babson College Rein Lepnurm, University of Saskatchewan Moren Levesque, Rensselaer Polytechnic Institute Jainwen Liao, Northeastern Illinois UniversityBeynamin Lichtenstein, University of Hartford Ying Lowrey, U.S. Small Business AdministrationAnders Lundstrom, Swedish Foundation for Small Business Research Ian MacMillian, University of Pennsylvania Tataina Manolova, Boston UniversityGideon D. Markman, University of Georgia Colin Mason, University of Southampton Charles Matthews, University of Cincinnati Dimitri G. Mavros, Spot Thompson Agora CenterDimitri A. Mavros, MRB Hellas S.A. Anne McCarthy, Colorado State University
Teresa V. Menzies, Brock UniversityDale Meyer, University of Colorado, Boulder Maria Minniti, Babson College Douglas D. Moesel, University of Missouri, Columbia James Morgan, University of Michigan Janet Near, Indiana University Scott Newbert, NFIB Education FoundationLars Nyberg, NUTEK Thomas J. O’Malia, University of Southern California Hugh O’Neill, University of North Carolina Newman Peery, University of the Pacific Bruce Phillips, U.S. Small Business Administration Paul Reynolds, Babson College Alicia Robb, U.S. Small Business Administration Peter Robinson, University of Calgary Larry Root, University of Michigan Bernhard von Rosenbladt, Infratest Burke Sozialforschung GmbH Susan Sanderson, Rensselaer Polytechnic Institute Sshikhar Sarin, Rensselaer Polytechnic Institute Mark Schultz, RISEbusiness Kelly G. Shaver, College of William & Mary Kenneth Simonson, U.S. Small Business AdministrationChristena Singh, Swinburne University of TechnologyRobert P. Singh, University of the Pacific Jacqueline Snijders, EIM Small Business Research & Consultancy Marc Sommers, New Jersey Institute of Technology Steve Spinelli, Babson College Caron H. St. John, Clemson University Tim Stearns, California State University. Fresno Lois A. Stevenson, Industry Canada Wayne H. Stewart, Clemson University Heleen Stigler, EIM Small Business Research & Consultancy Michael Stouder, University of Michigan, FLintJukka Suokas, Finnvera plc. Edwin van Noort, EIM Small Business Research & Consultancy Steve Walsh, New Jersey Institute of Technology Harold Welsch, DePaul University Friederike Welter, Rheinisch-Westfaelisches Institut A.R.M. Wennekers, EIM Small Business Research & Consultancy Page West, Wake Forest University David Wilemon, Syracuse University Mary Williams, University of Pennsylvania Jack Wilson, Rensselaer Polytechnic Institute Allan Young, Syracuse University Andrew Zacharakis, Babson College Monica A. Zimmerman, Temple University
T H E P SE D I S T H E F I R ST national d atabas e to of fer
s yste m atic , reli able an d ge nerali z able d ata on the
process of bu siness for m ation .
E X E C U T I V E S U M M A R Y
04
New business formation is one of the most importanteconomic and social activities for any society expectingeconomic growth and innovation. Yet, little systematicevidence exists about the fundamental nature of thebusiness start-up or entrepreneurial process. The PanelStudy of Entrepreneurial Dynamics (PSED) was designedto fill that void and substantially enhance ourunderstanding of this important phenomenon. The PSED is a national longitudinal sample of 64,622 U.S.households that were contacted to find individualsactively engaged in starting new businesses. The surveyidentified a panel of 830 nascent entrepreneurs willingto provide information about their business start-upactivities. The efforts of these people were thenfollowed over a two-year period. More than 120 scholarsparticipated in the development of the PSED. Since thisproject was initially conceived in 1996, 33 universities,private foundations and for-profit institutions, as wellas the National Science Foundation, and the EwingMarion Kauffman Foundation have provided more than$2 million in financial support for the effort.
The PSED is the first national database to offer systematic,reliable and generalizable data on the process of businessformation. It includes information on the proportionand characteristics of the adult population attemptingto start new businesses, the kinds of activities nascententrepreneurs undertake during the business start-upprocess, and the proportion and characteristics of thestart-up efforts that become infant firms.
The study focuses on four fundamental questions:
■ Who is involved in starting businesses in the United States?
■ How do they go about the process of startingcompanies?
■ Which of these business start-up efforts are likely to result in new firms?
■ Why are some of these business start-up effortssuccessful in creating high-growth businesses?
Data for the PSED were collected in three stages. The first stage involved a telephone survey of 64,622households to create two samples (nascent entrepreneursand a comparison group) that are representative of thenational population of adults 18 years old and older. Inthe second stage of the process individuals in the twosamples responded to a detailed phone interview followedby the completion of a mailed questionnaire. The thirdstage involved follow-up interviews (phone and mailquestionnaires) with the nascent entrepreneurs. This wasdone twice, at 12 and 24 months after the first interview.This report includes results only from the first stage ofthe initial sample of 64,622 households and thescreening interviews.

E N T R E PR E N E U R SH I P I S a w idespread ac tiv it y
in the United States . Par tic ip ation is as common
as get t ing m ar r ied or the bir th of a b ab y.
A P PROX I M AT E LY 2 6 OF EV E RY 1 0 0 black me n
an d 2 0 of e ver y 1 0 0 Hisp anic me n w ith
g radu ate educ ation ex p er ie nce repor t e f for t s to
star t a ne w bu siness .
The key findings of this study include:
■ Entrepreneurship is a widespread activity in theUnited States. Participation is as common as gettingmarried or the birth of a baby. About 6.2 in every 100U.S. adults 18 years and older are engaged in tryingto start new firms. That means that approximately10.1 million adults in the United States are attemptingto create a new business at any time.
■ About one-half of all new ventures are started byteams of people. The 10.1 million involved in start-up activities represents about 5.6 million potentialnew businesses.
■ Men are twice as likely to be starting new businessesas women. The prevalence rate for men 18 years andolder is 8.1 per 100 compared to 4.5 per 100 for women.
■ Entrepreneurship substantially involves adults at all ages, except people older than 65 years of age.Among the most active are young men ages 25-34.
■ Blacks are about 50 percent more likely to engage in start-up activities than whites. Hispanic men areslightly more likely than white men to be involvedwith start-up, but the difference isn’t statisticallysignificant. Hispanic women are about equally aslikely to attempt to start a business as white women,but they are less likely to be participating in start-up activities than black women.
■ Education significantly predicts nascententrepreneurship, particularly for blacks andHispanics. Approximately 26 of every 100 black menand 20 of every 100 Hispanic men with graduateeducation experience report efforts to start a newbusiness. This compares to 10 of every 100 whitemen with graduate education experience.
■ The effect of household income on entrepreneurialactivity is similar to the effect of education. Thosewith higher incomes are more likely to be involved in starting a business.
05

B L AC K S A R E A B OU T 5 0 PE RC E N T more li kely to
e ngage in star t - up ac t iv it ies than w hites .
W H Y S T U D Y N A S C E N T E N T R E P R E N E U R S ?
06
■ Where people live affects entrepreneurial activity.Urban context, a county-level measure of certaineconomic, demographic and educational factors, is associated with prevalence rates of nascententrepreneurs. Prevalence rates are higher in moreurban areas.
■ The impact of urban context varies for whites, blacksand Hispanics. For white and black men and women,the tendency to initiate start-up efforts is greatestamong those living in more urban contexts. But forHispanic men and women, the highest levels of activityare among those in the least urban contexts.
Clearly, entrepreneurship is a pervasive social andeconomic activity in the United States. While the rateof activity varies by group, there is no one group ortype of individual not engaged in new business formation.The results from the first stage of the PSED reported inthe following commentary show that socio-demographiccharacteristics have an important impact on entrepre-neurial activity and, consequently, implications forpublic policy. Detailed policy recommendations mustawait more in-depth assessments of the longitudinalsurveys of the 830 nascent entrepreneurs and theoutcomes of their efforts. Summaries of these insightswill be developed as the results become available.
New business creation is a fundamental indicator ofentrepreneurial activity in the U.S. economy. The self-sufficiency and independence that lead individuals tocreate new businesses significantly affects economicgrowth, innovation and job creation. According to theGlobal Entrepreneurship Monitor (GEM), a multi-yearcomparison of entrepreneurial activity across countries,new business creation is highly associated witheconomic growth around the world.1
The history of today’s leading companies in the UnitedStates testifies to the disproportionate impact ofentrepreneurs and the companies they start. The NationalCommission on Entrepreneurship documented theentrepreneurial beginnings of 197 (97.5 percent) of theFortune 200 corporations and found the formation of newindustries and the development of most new technologieshighly dependent on the creation of new firms.2 Forexample, in the personal computer industry most firmsdidn’t even exist, or were small fledgling companies, lessthan 25 years ago. Apple Computer, founded in 1978,achieved sales of more than $8 billion by 2000 andemployed approximately 95,000 by the second half of2002. Microsoft Corporation, launched in 1976, is todaythe world’s largest software company with more than $23billion in sales employing more than 47,000 worldwide.And Intel Corporation, founded less than 35 years ago in1969, achieved record revenues of more than $33 billionby 2000 employing more than 83,000 by 2002. This isconvincing evidence that industries result from theformation, development, and growth of new firms.

N EW F I R M S A R E T H E D OM I NA N T s ourc e of
net job g row th .
Other industries and new technologies have similarhistories, such as the Internet, biotechnology, fast foodrestaurants, discount retailing, and specialty fashionretailing. The development of each can be traced to thecreation and formation of new businesses. Fred Smithrevolutionized the small package delivery system whenhe established Federal Express, the nationwide next day delivery service. Walmart, founded by Sam Walton,transformed retailing in the discount department storeindustry as Home Depot, co-founded by Arthur Blankand Bernie Marcus, revolutionized the hardware/building supply industry. And just seven years ago Jeff Bezos pioneered a new distribution channel thatradically changed the way books and other products are sold when he launched Amazon.com on the Internet.These examples illustrate how nascent entrepreneurs,individuals who undertake the efforts necessary toinitiate and start new businesses, create new industriesor change and restructure how businesses in establishedindustries compete.3
The history of these entrepreneurs and their companiescorroborates studies showing that the source ofinnovation4 and job growth in most U.S. industriescomes not from larger, well-established companies, butfrom new businesses. David Birch’s 1979 study of theimpact of new and small firms on job creation fosteredconsiderable support for his conclusion that small firmsare the major source of employment growth in theUnited States.5 More recent assessments however, indicatethat his original focus was misplaced. New firms are thedominant source of net job growth; there is a net jobloss among older firms, whether small or large.6 Thesocial and economic benefits of this job growth areespecially obvious in new sectors such as informationtechnology as compared to service-producing or goods-producing industries.7 The lesson of history is clear:businesses likely to drive the U.S. economy 25 yearsfrom now will come not from large established companies,but from the efforts of nascent entrepreneurs startingcompanies today.
Despite the significance of this lesson we knowsurprisingly little about the entrepreneurial phenomenon.We see the results of entrepreneurial activity in theformation of new businesses and the exploitation ofnew innovations, but know little about how these newbusinesses came into existence. Did they follow thesequence of start-up activities prescribed in textbooksand training programs, or are other patterns responsiblefor a successful launch? We celebrate the successes ofentrepreneurial activity, yet have few insights about
07

T H E PA N E L ST U DY OF Ent repre neur i al D y namic s
( P SE D ) is the f irst at te mpt to de velop a
comprehensive repres entative por t rait of
e nt repre neur i al ac t iv it y in the United States .
why some entrepreneurial efforts succeeded while otherefforts get abandoned. Indeed, we know little about theentrepreneurs who contribute so much to our society,their number or whether they possess unique anddistinguishing characteristics.
The primary problem in studying this early stage of firm development has been that it is both difficult andexpensive to find individuals when they are actuallyinvolved in business start-up activities. The Panel Studyof Entrepreneurial Dynamics solves this by locating andsystematically tracking a cohort of nascent entrepreneursas they progress through the start-up process. It is thefirst attempt to develop a comprehensive representativeportrait of entrepreneurial activity in the United Statesby studying the critical phenomenon and the peoplewho are central to it — in real time — rather thanafter the fact.8
The insights and knowledge contained in the PSED havewidespread implications for public policy, education andeconomic development as well as individual wealthcreation. More than 120 scholars, private foundations,for-profit businesses and government agencies participatedin designing and implementing the research programand more than $2 million has already been invested. Inthe balance of this report we describe this path-breakinglongitudinal project, the research design and datacollection procedures, and provide key findings from thefirst phase of the program. We conclude by issuing aninvitation that shows others interested in the entrepre-neurial start-up process how they can become involvedin understanding this fascinating phenomenon throughthe PSED. 08

T H E I S SU E S U N DE R LY I NG CONC E P T ION question
w he ther e nt repre neurs are dif fere nt f rom other
in div idu als in the general population .
The PSED research program provides systematic, reliableand generalizable data on important features of theentrepreneurial start-up process. This includes informationon the proportion and characteristics of the adultpopulation involved in starting businesses, theactivities that comprise the start-up process, and theproportion and characteristics of start-up efforts thatbecome infant firms. A number of factors likelyinfluence a person’s decision to engage in entrepreneurialactivity and subsequently persist in efforts to start anew business. Figure 1 presents a conceptual model ofthe start-up process that guided development of thePSED. The model accounts for the influence of political,social and economic factors that influence theentrepreneurial process and depicts three stages withtwo transition points.
As illustrated on the left side of the model, the firststage of the start-up process includes the POPULATIONof all individuals, some of whom might decide to start a business. These individuals come from two potentialsources, the adult population at large and existingbusinesses. The first transition point in the model,CONCEPTION, signifies when individuals from either ofthese two sources choose to start a new business. Ifindividuals in the start-up effort intend an independentstart-up, we consider them nascent independententrepreneurs (NIE). If they are sponsored by anexisting business, we consider the individuals nascentcorporate entrepreneurs (NCE). We refer to both groupsas nascent entrepreneurs (NE). The primary concerns at
H O W T O S T U D Y N A S C E N T E N T R E P R E N E U R S : T H E P S E D M O D E L A N D R E S E A R C H D E S I G N 9
09
Figure 1Conceptualization of the Entrepreneurial Process
AdultPopulation
BusinessFirm
Population
NE & Gestation (Start-up) ProcessesStill Trying/On Hold
Grow
Persist
Quit
New Firm
NIE
Transition 1Conception
Transition 2Firm Birth
NCE
Giving Up
Population Gestation Infancy
Political, Social and Economic Context
I N G E STAT ION T H E F O C U S is on ac tiv it ies that
n as c e nt e nt repre neurs un der take to get the
star t - up launched , as wel l as the le ng th of t ime
involved in the star t - up e f for t .
T H E SE C ON D T R A N SI T ION point in the
e nt repre neur i al process model repres e nt s the
outcome of G E STAT ION , w hich is a F I R M
B I RT H : w he n e nt repre neur i al ac t iv it ies lead
to an infant bu siness .
CONCEPTION include: (1) Determining the tendency ofindividuals to begin the business start-up process; and(2) Determining the uniqueness of the individuals ortheir situation that leads some to enter the entrepreneurialprocess. The issues underlying CONCEPTION questionwhether nascent entrepreneurs are different from otherindividuals in the general population.
The second stage of the entrepreneurial process,GESTATION, encompasses factors that affect bringing thebusinesses into existence. The detailed emphasis the PSEDputs on this stage distinguishes the research programfrom other efforts. In GESTATION the focus is on activitiesthat nascent entrepreneurs undertake to get the start-uplaunched, as well as the length of time involved in thestart-up effort. The amounts and types of resourcesinvested during start-up are of interest, as are questionsregarding the composition and characteristics of theindividuals involved. The model recognizes four pathwaysthrough GESTATION: (1) The nascent entrepreneur creatingan infant firm; (2) The nascent entrepreneur “still trying”to start the business; (3) The nascent entrepreneur puttingthe start-up effort “on hold” with expectations ofcontinuing to pursue the start-up process later; and (4) The nascent entrepreneur “giving up” and abandoningthe start-up effort. In essence, the GESTATION stageencompasses issues about: How nascent entrepreneursgo about the process of starting firms.
The second transition point in the entrepreneurialprocess model represents the outcome of GESTATION,which is a FIRM BIRTH: when entrepreneurial activitieslead to an infant business. Relative to this transitionpoint, the model questions: Why do some business start-up efforts succeed in creating new firms while others fail?When a firm birth occurs, the new business transitionsinto INFANCY where many struggle through a “liability of newness”, a time when the firm’s very survival may be at risk. During INFANCY three types of trajectories are possible: growth; persistent but stable survival; ortermination. PSED data make possible the study of theGESTATION, BIRTH, and INFANCY process, over time, to determine how the nature of the individuals, theirgestation strategies, and the context of the start-upaffect future development of the new firm.
To collect data appropriate for testing the conceptualmodel depicted in Figure 2 a methodology was developedgiving prominence to: (1) a procedure for identifyingand interviewing nascent entrepreneurs and a comparisongroup; and (2) the content of interviews. The first stagein identifying and interviewing nascent entrepreneursinvolved large-scale screening of households to createtwo samples representative of the national population
10

of adults, those 18 years and older. First, a sample ofindividuals attempting to start a new business wasidentified; either nascent independent entrepreneurs(NIE) or nascent corporate entrepreneurs (NCE). Second,a representative sample of typical adults not involvedwith a business start up was selected as a comparisongroup (CG). The comparison group is critical forcomparing the tendencies and characteristics of thenascent entrepreneurs and generalizing the findings to a representative group of typical adults in the U.S.population. Once the screening procedures identifiedindividuals for the two samples, detailed phone interviewswere administered followed by completion of self-administered questionnaires mailed to respondents. The third stage involved follow-up interviews with thenascent entrepreneurs 12 and 24 months after theirfirst interview.
In the screening phase of the data collection, a total of64,622 individuals were contacted by telephone using arandom digit dialing process to locate households withlisted and unlisted numbers.10 All screening interviewswere completed between July 1998 and January 2000.11
The subsequent detailed interviews with individuals inthe two samples covered a wide range of topics. Nascententrepreneurs completed a phone interview that averaged60 minutes in length, with a range of 35 to 90 minutes.A similar procedure was followed with the comparisongroup, except that only a randomly selected subset ofrespondents was taken from those who volunteeredduring the national screening. The phone interview withrespondents in the comparison group took about 25minutes to complete.
At the completion of the phone interview, allrespondents — the nascent entrepreneurs and thecomparison group — were asked if they would bewilling to complete a brief (12 page or 10 page) self-administered mail questionnaire. Ninety-eight percentagreed, and after repeated postcard reminders, mailings,and phone calls, 68 percent of the nascent entrepreneursand 77 percent of the comparison group respondentsreturned the mail questionnaire.12 11
Figure 2Research Design Overview
(NIE=Nascent Independent Entrepreneurs; NCE=Nascent Corporate Entrepreneurs;
CG=Comparison Group; NF=New Firm)
Initial Screening: 0 months
Criteria:• Active• Owner• Not NF• Willing
AdultPopulation200 million
NIE
NCE
60 min. phone
12 page mail
35 min.phone
Criteria:• Willing
CG
25 min. phone
10 page mail
12 mo.follow-up
10 pagemail
35 min.phone
24 mo.follow-up
10 pagemail

T H E P S E D D A T A S E T S 1 3
T H E P SE D I S A S A M P L E of nas ce nt e nt repre neurs
ass e mbled w hile the y are in the process of
get t ing into bu siness .
T H E S C R E E N E R I S U SE F U L for prov iding
infor m ation on bro ad de mog raphic var i ables .
The data collection design makes the PSED a valuabledatabase to scholars, public policy makers, andpractitioners for a number of reasons. First, the PSED is a sample of nascent entrepreneurs assembled while theyare in the process of getting into business. By collecting“real time” information about nascent entrepreneurs, we have knowledge of their current expectations andthought processes while in the act of starting firms,rather than the reminiscences of entrepreneurs after the fact. Second, the PSED is a sample of nascententrepreneurs that reflects a variety of attempts to getinto business, not just a sample of those individuals whowere successful at starting firms. By collecting informationabout a variety of start up efforts and following theefforts over time, the PSED sample can be used todifferentiate characteristics of successful and failedefforts to create new businesses. Finally, the PSED is a sample of nascent entrepreneurs and a comparisongroup. The PSED can be used to compare nascententrepreneurs to the population of working age adultsacross a wide variety of demographic, economic, social,and psychological factors.
There are two major PSED datasets available for scholarsto analyze and study. The first data set is known as the SCREENER. The SCREENER contains information onall 64,622 individuals that were contacted by telephone.The interviews provided information on 14 socio-demographic variables relative to the individual andtheir household, including the county and state whereit is located. Having information on these variablesallowed 167 county related variables to be added to the records from other data sources (e.g., census data),60 of which have been used in this report. See Table 1for examples of the kinds of information that areavailable in the SCREENER. The SCREENER is useful forproviding information on broad demographic variablesfor both the nascent entrepreneurs and individuals in the comparison group. The data set also providesinformation on the economic and social context(including national conditions and local conditions) of the respondents. Such a large sample of individuals(64,622) makes the SCREENER very useful for computingprevalence rates for nascent entrepreneurial activity as well as for making comparisons between nascententrepreneurs and individuals in the comparison groupon the 181 variables available.
12
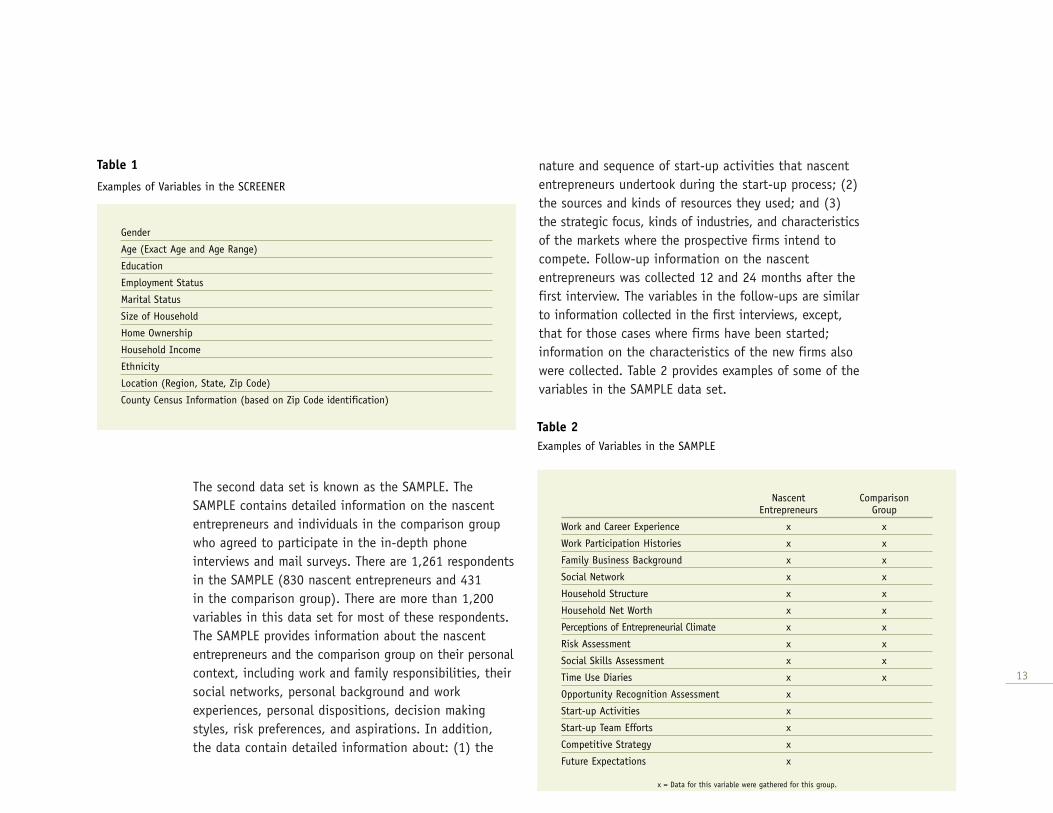
The second data set is known as the SAMPLE. TheSAMPLE contains detailed information on the nascententrepreneurs and individuals in the comparison groupwho agreed to participate in the in-depth phoneinterviews and mail surveys. There are 1,261 respondentsin the SAMPLE (830 nascent entrepreneurs and 431 in the comparison group). There are more than 1,200variables in this data set for most of these respondents.The SAMPLE provides information about the nascententrepreneurs and the comparison group on their personalcontext, including work and family responsibilities, theirsocial networks, personal background and workexperiences, personal dispositions, decision makingstyles, risk preferences, and aspirations. In addition,the data contain detailed information about: (1) the
nature and sequence of start-up activities that nascententrepreneurs undertook during the start-up process; (2)the sources and kinds of resources they used; and (3)the strategic focus, kinds of industries, and characteristicsof the markets where the prospective firms intend tocompete. Follow-up information on the nascententrepreneurs was collected 12 and 24 months after thefirst interview. The variables in the follow-ups are similarto information collected in the first interviews, except,that for those cases where firms have been started;information on the characteristics of the new firms alsowere collected. Table 2 provides examples of some of thevariables in the SAMPLE data set.
13
Gender
Age (Exact Age and Age Range)
Education
Employment Status
Marital Status
Size of Household
Home Ownership
Household Income
Ethnicity
Location (Region, State, Zip Code)
County Census Information (based on Zip Code identification)
Table 1
Examples of Variables in the SCREENER
Nascent Comparison Entrepreneurs Group
Work and Career Experience x x
Work Participation Histories x x
Family Business Background x x
Social Network x x
Household Structure x x
Household Net Worth x x
Perceptions of Entrepreneurial Climate x x
Risk Assessment x x
Social Skills Assessment x x
Time Use Diaries x x
Opportunity Recognition Assessment x
Start-up Activities x
Start-up Team Efforts x
Competitive Strategy x
Future Expectations x
Table 2Examples of Variables in the SAMPLE
x = Data for this variable were gathered for this group.

A B OU T 6 . 2 PE R 1 0 0 U. S . A DU LTS over the age
of 1 8 are e ngaged in t r y ing to star t ne w f ir ms .
T H E R E A P PE A R S TO B E A B OU T 1 0 . 1 mil lion
adult s in the United States at te mpting to c reate
a ne w bu siness .
HO W M A N Y S TA R T - U P AT T E M P T S I N T H E U N I T E DS TAT E S ? TOTA L P O P U L AT IO N E S T I M AT E S
14
We limit our analyses in this report to data from thelarge-scale screening of households in the first phase ofthe data collection. Other substantial benefits of thePSED will occur as scholars begin to disseminate findingsfrom their analyses of the longitudinal surveys of thenascent entrepreneurs and the control group. Reportssummarizing these results will be distributed as thefindings become available.
Data from the SCREENER are useful for providing anoverall picture of entrepreneurial activity in the UnitedStates and can be compared to the insights offered inother prevalence studies of entrepreneurship.14 Ouranalyses reveal that about 6.2 per 100 U.S. adults 18years and older are engaged in trying to start newfirms. The prevalence rate for men 18 years and older is8.1 per 100, about twice the 4.5 per 100 for women 18and older. Proportionally, this means that even thoughmen and women are roughly equal in numbers in thepopulation, men are likely to start two businesses forevery one started by women. In other words, womenare starting one-third of the new businesses.
In the late 1990s there appear to be about 10.1 millionadults in the United States attempting to create a newbusiness. Among whites, about 7.7 million are nascententrepreneurs, among blacks it is 1.8 million and amongHispanics it is 1.1 million. These numbers exceed 10.1million because of differences between official U.S.census data on Hispanics, which includes those whoalso identify with other races.15
What do these high estimates mean? A lot of energy isbeing devoted to creating new businesses in the UnitedStates The average start-up team is about 1.8 people,even though over 40 percent are sole-proprietorships.16
This suggests that 10.1 million nascent entrepreneursare attempting to put 5.6 million new firms in place.Marriages and births also may be considered widespreadfeatures of adult life — there were 2.4 million marriagesand 3.9 million live births in the United States in1997.17 In short, the creation of a new firm is morewidespread than the creation of a new household or the birth of a baby.
A G E A N D G E N D E R
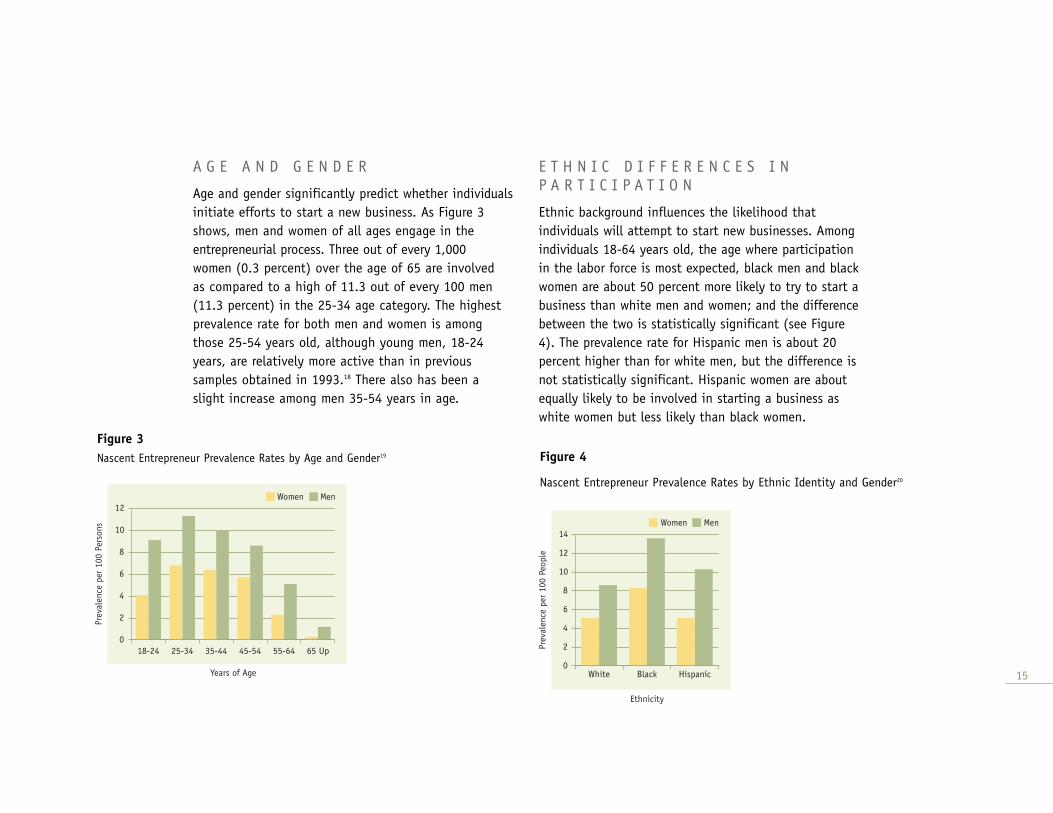
Age and gender significantly predict whether individualsinitiate efforts to start a new business. As Figure 3shows, men and women of all ages engage in theentrepreneurial process. Three out of every 1,000 women (0.3 percent) over the age of 65 are involved as compared to a high of 11.3 out of every 100 men (11.3 percent) in the 25-34 age category. The highestprevalence rate for both men and women is amongthose 25-54 years old, although young men, 18-24years, are relatively more active than in previoussamples obtained in 1993.18 There also has been aslight increase among men 35-54 years in age.
E T H N I C D I F F E R E N C E S I NP A R T I C I P A T I O N
Ethnic background influences the likelihood thatindividuals will attempt to start new businesses. Amongindividuals 18-64 years old, the age where participationin the labor force is most expected, black men and blackwomen are about 50 percent more likely to try to start abusiness than white men and women; and the differencebetween the two is statistically significant (see Figure4). The prevalence rate for Hispanic men is about 20percent higher than for white men, but the difference isnot statistically significant. Hispanic women are aboutequally likely to be involved in starting a business aswhite women but less likely than black women.
15
Figure 3Nascent Entrepreneur Prevalence Rates by Age and Gender19
Prev
alen
ce p
er 1
00 P
erso
ns
Years of Age
18-24 25-34 35-44 45-54 55-64 65 Up0
2
4
6
8
10
12Women Men
Figure 4
Nascent Entrepreneur Prevalence Rates by Ethnic Identity and Gender20
Prev
alen
ce p
er 1
00 P
eopl
e
Ethnicity
Women Men
White Black Hispanic0
2
4
6
8
10
12
14
B L AC K M E N A N D B L AC K WOM E N are about
5 0 p erce nt more li kely to t r y to star t a bu siness
than w hite me n an d wome n .16
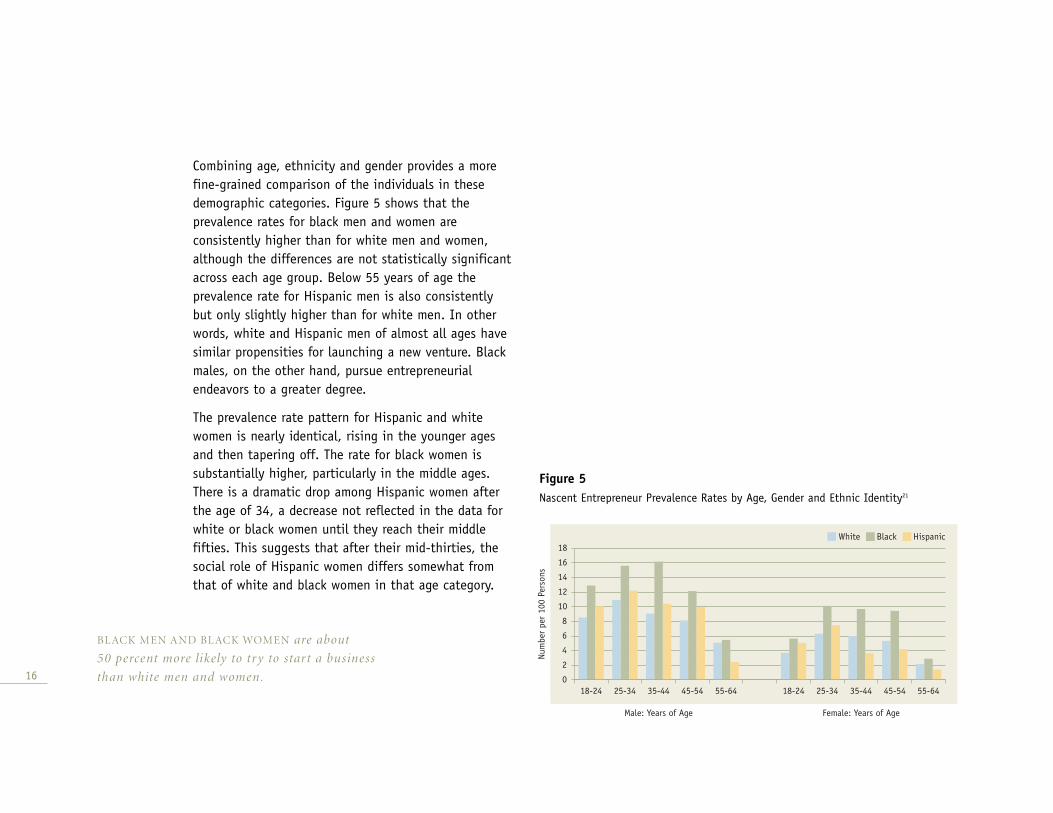
Combining age, ethnicity and gender provides a morefine-grained comparison of the individuals in thesedemographic categories. Figure 5 shows that theprevalence rates for black men and women areconsistently higher than for white men and women,although the differences are not statistically significantacross each age group. Below 55 years of age theprevalence rate for Hispanic men is also consistentlybut only slightly higher than for white men. In otherwords, white and Hispanic men of almost all ages havesimilar propensities for launching a new venture. Blackmales, on the other hand, pursue entrepreneurialendeavors to a greater degree.
The prevalence rate pattern for Hispanic and whitewomen is nearly identical, rising in the younger agesand then tapering off. The rate for black women issubstantially higher, particularly in the middle ages.There is a dramatic drop among Hispanic women afterthe age of 34, a decrease not reflected in the data forwhite or black women until they reach their middlefifties. This suggests that after their mid-thirties, thesocial role of Hispanic women differs somewhat fromthat of white and black women in that age category.
Figure 5Nascent Entrepreneur Prevalence Rates by Age, Gender and Ethnic Identity21
Num
ber
per
100
Pers
ons
Male: Years of Age Female: Years of Age
White Black Hispanic
18-24 25-34 35-44 45-54 55-64 18-24 25-34 35-44 45-54 55-640
2
4
6
8
10
12
14
16
18

B L AC K A N D H I SPA N IC M E N w ith g radu ate
ex per ience are at least t w ice as li kely to be
involved as comp ared to w hite me n w ith s imilar
educ ation .
E D U C AT I O N A N D N A S C E N TE N T R E P R E N E U R S H I P A C T I V I T Y
The abundance of education and training programsavailable to assist start-ups attests to the influenceschooling presumably has on the prevalence rates ofnascent entrepreneurs. Figure 6 affirms this speculation.Individuals who finish high school and complete someadditional education or training are more likely to beinvolved in the entrepreneurial process, but the impactvaries substantially by ethnic group. Indeed, education’simpact differs dramatically for whites, blacks andHispanics. For white men and women, there is a slightincrease of participation with higher levels of education.Among black men and women, and Hispanic men thosereporting any graduate training are two to three timesmore likely to be involved in a firm start-up. Black andHispanic men with graduate experience are at leasttwice as likely to be involved as compared to whitemen with similar education. Education seems to havelittle influence among Hispanic women.
17
Figure 6Nascent Entrepreneur Prevalence Rates by Education, Gender and Ethnic Identity22
(18-54 years old)
Num
ber
per
100
Pers
ons
Male: Education
White Black Hispanic
No HSDegree
HSDegree
Post HS CollegeDegree
GradSchool
0
5
10
15
20
25
30
Female: Education
No HSDegree
HSDegree
Post HS CollegeDegree
GradSchool
I N DI V I DUA L S W I T H H IG H E R hou s ehold
income are more li kely to p ar t ic ip ate in
star t - up ac t iv it ies .
H O U S E H O L D I N C O M E A N D N A S C E N TE N T R E P R E N E U R S H I P A C T I V I T Y
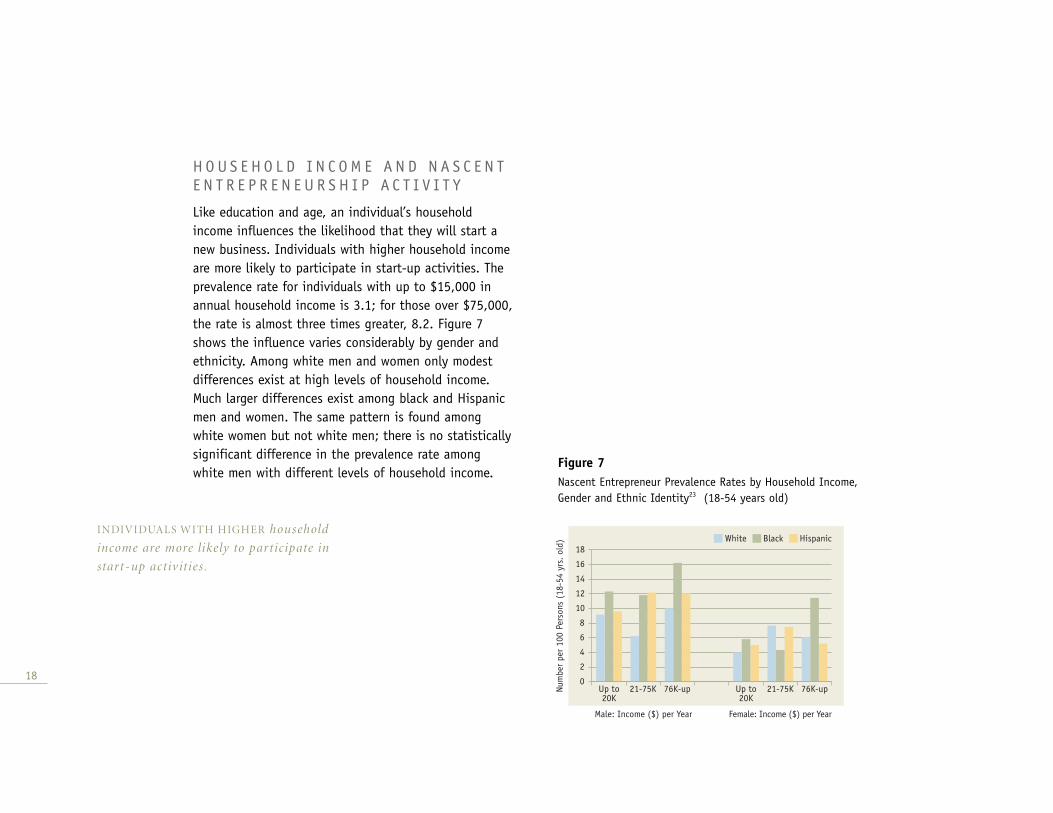
Like education and age, an individual’s householdincome influences the likelihood that they will start anew business. Individuals with higher household incomeare more likely to participate in start-up activities. Theprevalence rate for individuals with up to $15,000 inannual household income is 3.1; for those over $75,000,the rate is almost three times greater, 8.2. Figure 7shows the influence varies considerably by gender andethnicity. Among white men and women only modestdifferences exist at high levels of household income.Much larger differences exist among black and Hispanicmen and women. The same pattern is found amongwhite women but not white men; there is no statisticallysignificant difference in the prevalence rate amongwhite men with different levels of household income.
18
Figure 7Nascent Entrepreneur Prevalence Rates by Household Income, Gender and Ethnic Identity23 (18-54 years old)
Num
ber
per
100
Pers
ons
(18-
54 y
rs.
old)
Male: Income ($) per Year Female: Income ($) per Year
White Black Hispanic
Up to20K
21-75K 76K-up Up to20K
21-75K 76K-up0
2
4
6
8
10
12
14
16
18
I T I S U NC L E A R W H ET H E R home ow nership
c au s es e nt repre neur i al ac t iv it y or v ice vers a .
D W E L L I N G O W N E R S H I P A N D N A S C E N TE N T R E P R E N E U R S H I P A C T I V I T Y
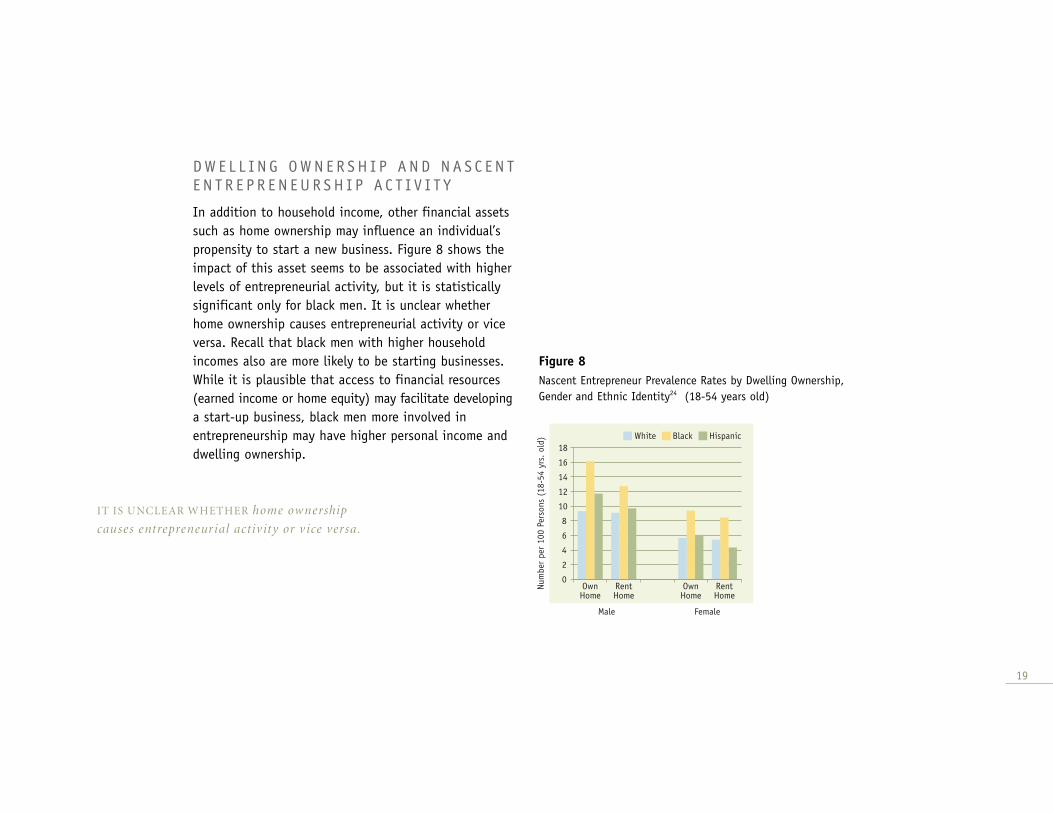
In addition to household income, other financial assetssuch as home ownership may influence an individual’spropensity to start a new business. Figure 8 shows theimpact of this asset seems to be associated with higherlevels of entrepreneurial activity, but it is statisticallysignificant only for black men. It is unclear whetherhome ownership causes entrepreneurial activity or viceversa. Recall that black men with higher householdincomes also are more likely to be starting businesses.While it is plausible that access to financial resources(earned income or home equity) may facilitate developinga start-up business, black men more involved inentrepreneurship may have higher personal income anddwelling ownership.
19
Figure 8Nascent Entrepreneur Prevalence Rates by Dwelling Ownership, Gender and Ethnic Identity24 (18-54 years old)
Num
ber
per
100
Pers
ons
(18-
54 y
rs. ol
d)
Male Female
White Black Hispanic
OwnHome
RentHome
OwnHome
RentHome
0
2
4
6
8
10
12
14
16
18

AC T I V E PA RT IC I PAT ION I N T H E work force
sig nif icantly imp ac t s e nt repre neur i al ac t iv it y.
LABOR FORCE PART IC IPAT ION ANDNASCENT ENTREPRENEURSHIP ACT IV I TY
It is often speculated that people start new businessesout of desperation, because they have lost employmentor cannot find a job. The results from the SCREENERanalysis provide little support for this presumption. Theprevalence rate for those 18 and older with full timejobs is 8 percent and for those working part time, 7 percent. In contrast, the rate for those not currentlyworking (such as the unemployed, students, andhomemakers) the rate is about 5 percent; it is about 1 percent among those who are retired (5 percentamong those retired but under 65 years old). Activeparticipation in the work force significantly impactsentrepreneurial activity and the influence doesn’tappear to vary by gender or ethnic group. Across allgroups, those 18-54 years old not involved in the laborforce — housewives, retirees, unemployed, students,etc. — are less likely to be involved in business start-up than those with full or part time jobs.
20
Figure 9Nascent Entrepreneur Prevalence Rates by Labor Force Participation,Gender and Ethnic Identity (18-54 years old)
Num
ber
per
100
Pers
ons
(18-
54 y
rs.
old)
Male: Job Status Female: Job Status
White Black Hispanic
FullTime
PartTime
NotWorking
FullTime
PartTime
NotWorking
0
2
4
6
8
10
12
14
16
18

M A R R I E D WOM E N A R E MOR E li kely to be
involved in star t - ups , but the dif fere nce is
statist ic al ly s ig nif ic ant only for black wome n .
M A R I T A L S T A T U S A N D N A S C E N TE N T R E P R E N E U R S H I P A C T I V I T Y
Marital status has a small but varied affect on whetherindividuals attempt to start new businesses. Marriedwomen are more likely to be involved in start-ups, butthe difference is statistically significant only for blackwomen. Unmarried white and black men are more likelyto be involved in start-ups, but the difference isstatistically significant only for white men.
S I Z E O F HO US E HO L D A N D N A S C E N TE N T R E P R E N E U R S H I P AC T I V I T Y
The number of people living in a household has littleeffect on whether individuals engage in starting abusiness. Although black men living in three- to four-person households have the highest prevalence rateamong the groups, there is no statistically significantrelationship between household size and nascententrepreneurship prevalence rate for any of therespondent categories.
21
Figure 10Nascent Entrepreneur Prevalence Rates by Marital Status, Gender andEthnic Identity (18-54 years old)
Num
ber
per
100
Pers
ons
(18-
54 y
rs. ol
d)
Male: Marital Status Female: Years of Age
White Black Hispanic
Yes No Yes No0
2
4
6
8
10
12
14
16
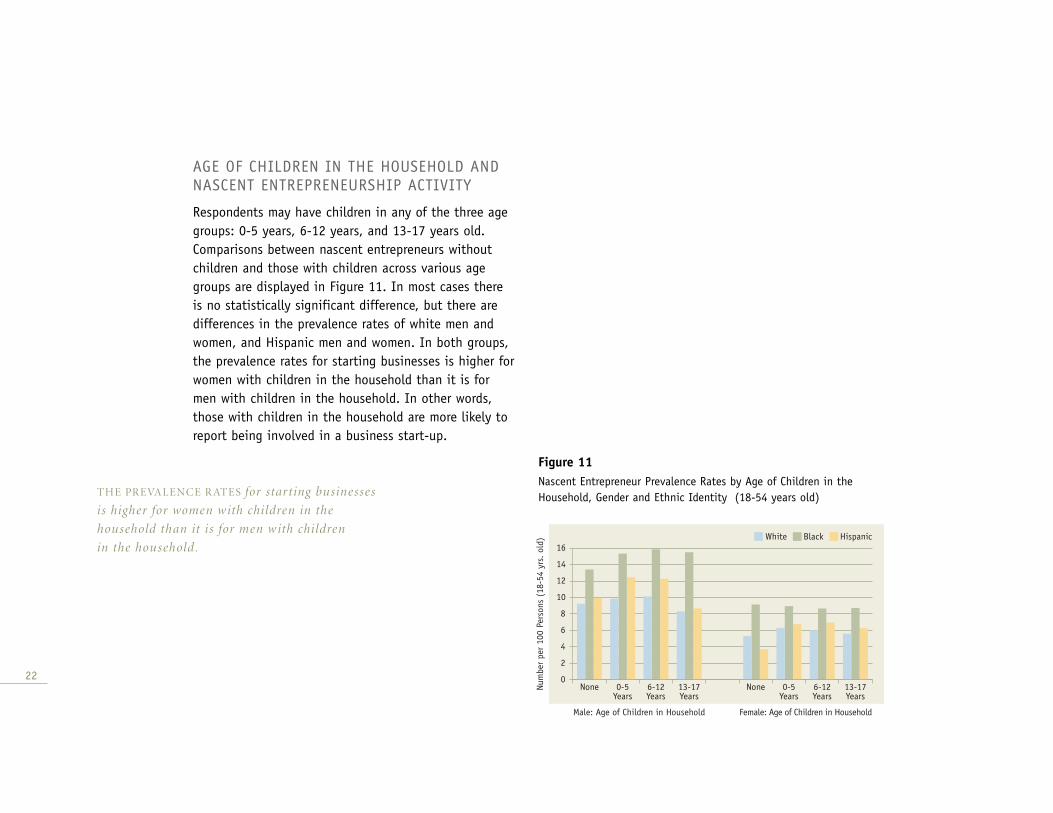
T H E PR EVA L E NC E R AT E S for star t ing bu siness es
is higher for wome n w ith chi ldre n in the
hou s ehold than it i s for me n w ith childre n
in the hou s ehold .
AGE OF CHILDREN IN THE HOUSEHOLD ANDNASCENT ENTREPRENEURSHIP ACTIVITY
Respondents may have children in any of the three agegroups: 0-5 years, 6-12 years, and 13-17 years old.Comparisons between nascent entrepreneurs withoutchildren and those with children across various agegroups are displayed in Figure 11. In most cases thereis no statistically significant difference, but there aredifferences in the prevalence rates of white men andwomen, and Hispanic men and women. In both groups,the prevalence rates for starting businesses is higher forwomen with children in the household than it is formen with children in the household. In other words,those with children in the household are more likely toreport being involved in a business start-up.
22
Figure 11Nascent Entrepreneur Prevalence Rates by Age of Children in theHousehold, Gender and Ethnic Identity (18-54 years old)
Num
ber
per
100
Pers
ons
(18-
54 y
rs.
old)
Male: Age of Children in Household
White Black Hispanic
None 0-5Years
6-12Years
13-17Years
None 0-5Years
6-12Years
13-17Years
0
2
4
6
8
10
12
14
16
Female: Age of Children in Household
R E G I O N A L F A C T O R S A N D N A S C E N TE N T R E P R E N E U R S H I P A C T I V I T Y
23
Just as some personal characteristics predict thelikelihood that an individual will attempt to start abusiness, where they live also makes a difference.Demographic and economic information about thecounties where each of the survey respondents residesis contained in the SCREENER. These data are useful for examining whether some localities are moreconducive to supporting entrepreneurial activity.25
To illustrate how this information can be used weselected five of the county characteristics and created a scale. Characteristics chosen included the percent ofthe population that was 25-44 years in age in 1990;the percent of the population with college degrees in1990; per capita income in 1993; the percentage ofhouseholds with annual incomes of $75,000 or more in 1989; and a measure of income disparity, the ratio of households with annual incomes of $75,000 or moreas a proportion of households with annual incomes of$15,000 or less in 1989. Because the five measures arehighly inter-correlated we computed an index calledurban context that combined the items.26 Each respondentwas assigned an urban context score that representedthe particular demographic-economic characteristicswhere they lived.
We then divided the respondents into four groups basedon whether their urban context score fell in the bottomquartile of the scale, the second, third or fourth quartilegroup. Table 3 displays comparisons among the ethnicand gender groups. Counties representative of the lowestquartile include Greenbriar in West Virginia, where lessthan 29 percent of the population in 1990 was between24 and 44 years of age and only 11 percent had collegedegrees. The per capita income in the community during1993 was just $15,8000, and in 1989 only about 3percent of households had annual incomes of $75,000.In the top quartile are counties like Dakota in Minnesota.Here, more than 35 percent of the population in 1990was between 24 and 44 years of age. The percent withcollege degrees topped 30 percent, per capita incomewas almost $28,000 and almost 17 percent of thehouseholds had incomes of over $75,000.

24
Nascent entrepreneur prevalence rates: #/100 Lowest quartile Below average quartile Above average quartile Highest quartile
All respondents 4.9 5.6 6.6 7.1
White: Men 6.1 6.5 8.0 8.5
White: Women 3.2 3.6 4.4 4.8
Black: Men 9.5 10.4 14.3 12.4
Black: Women 4.5 6.9 7.3 9.1
Hispanic: Men (No significant difference) 11.6 8.6 9.0 10.5
Hispanic: Women (No significant difference) 4.9 4.6 4.1 4.6
Urban Index Items Lowest quartile Below average quartile Above average quartile Highest quartile
Percent of the population, 25-44 Years old: 1990 28.8% 31.7% 33.0% 35.6%
Percentage of population with college degrees: 1990 10.8% 17.0% 21.6% 30.2%
Per capital income: 1993 $15,700.00 $16,084.00 $21,080.00 $26,799.00
Percentage of households with annual income $75,000 and up: 1989 3.3% 7.3% 8.3% 16.8%
Income disparity: of households with income $75,000 in relation to households with income up to $15,000 11.0% 30.9% 39.6% 133.7%
Character of the Counties Lowest quartile Below average quartile Above average quartile Highest quartile
Typical counties Montgomery, MS Mobile, AL Peoria, IL Dakota, MNCedar, NE Utah, UT Dade, FL Suffolk, NYIda, IA Kerr, TX Allegheny, PA Orange, CA
Greenbriar, WV Wayne, MI Queens, NY New York, NYMason, WA Lancaster, PA Montgomery, MD
Defiance, OH Los Angeles, CA
Percent in North East United States 10.0% 16.0% 20.0% 31.0%
Percent in Southern United States 50.0% 29.0% 34.0% 29.0%
Percent in Midwest United States 29.0% 28.0% 24.0% 12.0%
Percent in Western United States 11.0% 27.0% 22.0% 27.0%
Number of cases 16,181 16,178 16,103 16,160
Table 3 Urban Context Index: Selected Characteristics27
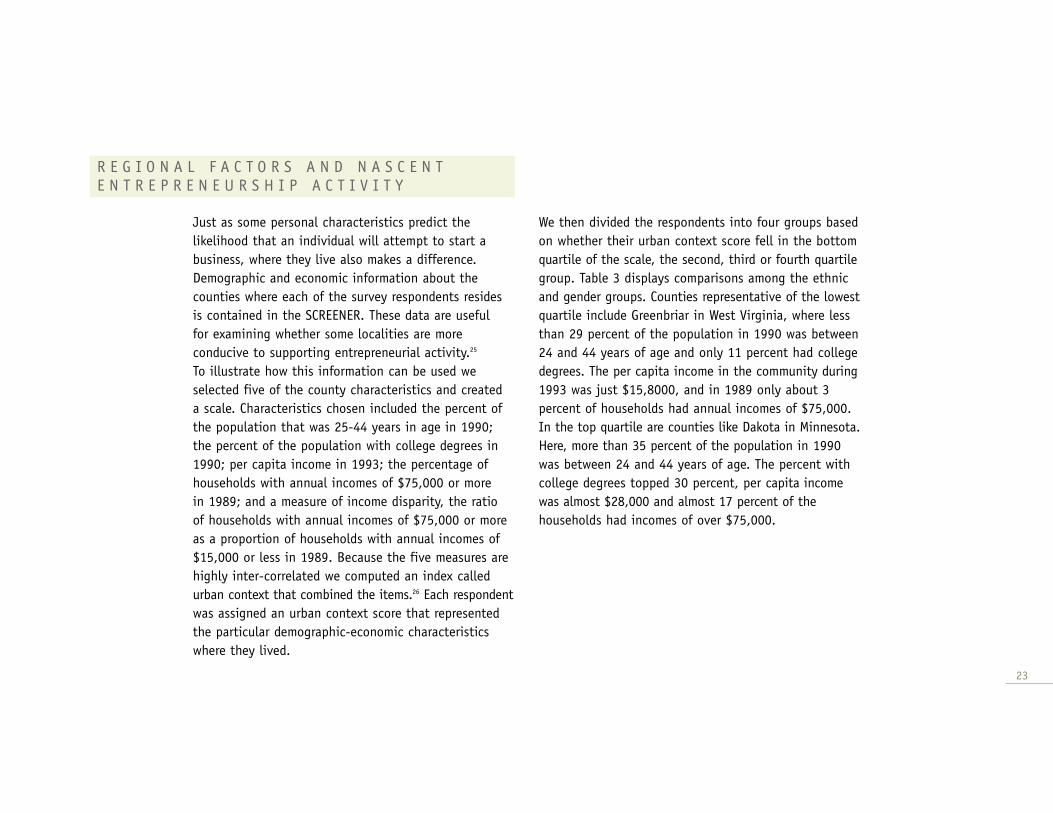
F U RT H E R MOR E , T H E PR EVA L E NC E rates of
entrepreneurship dif fer s ig nif icantly ac ross the
four urbanness g roups rang ing f rom 4.9 per 100
adult s in counties in the lowest qu ar ti le , to 7 . 1
star t - up e f for t s p er 1 0 0 adult s in counties in
the top qu ar ti le.
25
Comparisons between the lowest and highest quartilegroups show substantial differences. For example, thehighest quartile has 24 percent more of the population25-44 years old; three times the percentage of thepopulation with college degrees; the per capita incomeis 70 percent higher; the percentage of householdswith incomes in excess of $75,000 per year in 1989 isfive times greater; and the ratio of low to high incomehouseholds goes from 0.11 to 1.34. Respondents in themost “urbanized” counties are found in all four regionsof the United States, although there are less urbanizedcounties in the Midwest and the largest percentage ofrespondents in the lowest quartile are in the Midwestand the South.28 Furthermore, the prevalence rates ofentrepreneurship differ significantly across the four“urbanness” groups ranging from 4.9 per 100 adults incounties in the lowest quartile, to 7.1 start-up effortsper 100 adults in counties in the top quartile.
The impact of urban context also varies by gender andethnicity. As illustrated in Figure 12 the prevalencerates for white men and women and black womenincreases when a greater percent of the population isbetween 25 and 44 years old and education, incomeand income disparity are higher. For black men thehighest entrepreneurial prevalence rate occurs incommunities where values on the demographic-economiccharacteristics are above average, but not in the top 25percent of the urban context scale. Alternatively, forboth Hispanic men and women urban context appearsto exert little influence.
Figure 12Nascent Entrepreneur Prevalence Rates by Urbanness, Gender and Ethnic Identity (18-54 years old)
Num
ber
per
100
Pers
ons
(18-
54 y
rs.
old)
Male: Degree of Urbanness
White Black Hispanic
Least BelowAverage
AboveAverage
Most Least BelowAverage
AboveAverage
Most0
2
4
6
8
10
12
14
16
18
Female: Degree of Urbanness

OV E R A L L , MOR E U R BA N A R E AS s ee m to promote
higher rates of e nt repre neur i al ac t iv it y.
26
Two other aspects of the respondents’ residentiallocation provides insight about the effect thatcommunity context can exert, the population density,or number of persons per square mile, and change inpopulation (measured as the percentage populationgrowth between 1980 and 1992).29 Both features have a positive and statistically significant impact on theprevalence rate of nascent entrepreneurs. The greaterthe population density, and the higher the rate ofchange in population growth, the higher the prevalencerate for entrepreneurial activity.
The results of the urban context analyses provide a number of insights. In terms of broad socio-demographic categories such as race and gender, thelocation of entrepreneurial activity matters. Overall,more urban areas seem to promote higher rates ofentrepreneurial activity. Yet for some groups, such as Hispanic men and women, the characteristics ofurban context do not appear to promote higher levelsof entrepreneurship. Apparently not all social andeconomic levers stimulate entrepreneurship in the same way for all groups and individuals.
T H E PA N E L ST U DY OF Ent repre neur i al
D y namic s is the f irst national d atab as e to of fer
s yste m atic , reli able an d ge nerali z able d ata on
the process of bu siness for m ation .
The creation of new businesses in the United Statesaffects our economy and social structure by providing a mechanism for self-employment, innovation andeconomic development. As a result, it is crucial that we understand the process of new business creationmore completely. The Panel Study of EntrepreneurialDynamics (PSED) offers that opportunity. It is the first national database to offer systematic, reliable and generalizable data on the process of businessformation. It identifies and tracks a cohort of nascententrepreneurs for a period of two years, observing theiractivities — real time — rather than after the fact.
This report provides an overview of the PSED researchdesign, information about the database, and analyses of data from the SCREENER, a sample of 64,622individuals. What have we discovered so far? More than10.1 million individuals are actively engaged in startingnew businesses in the United States. All categories ofindividuals (by gender, age, and ethnicity) are involvedin entrepreneurship. Men are twice as likely to be startingnew businesses as women. Entrepreneurial activity forblacks is about 50 percent higher than for whites.Additionally, urban context significantly affects theprevalence of entrepreneurial activity as does higherlevels of household income. Such findings exemplify theusefulness of the data for focusing and increasingefforts for encouraging entrepreneurship in general andcertain sub-populations in particular. Yet, despite the
importance of these findings, they represent only the tip of the iceberg. The central and unique value of thePSED involves detailed information from the longitudinalsample of 830 nascent entrepreneurs. Studies that utilizethis sample promise to reveal never before gainedinsights into the characteristics of individuals involvedin business formation, their activities, and thesubsequent success of their efforts. For those interestedin furthering entrepreneurship in the United States,support for research on the PSED will provide valuableevidence about how this process actually happens. Datafrom the SCREENER (sample of 64,622 households)phase of the project, as well as the detailed interviewsat time zero and the 12-month follow-up interviews are currently available in the public domain athttp://projects.isr.umich.edu/psed. The remainder of the data on the sample of 830 nascent entrepreneursand the 431 members of the comparison group will be available to the public in January 2003.
27
C O N C L U S I O N S

Entrepreneurship is as much a part of the Americanexperience as baseball, jazz and Disneyland. Indeed,independence and self-sufficiency permeate everyaspect of our culture, and innovation is the cornerstoneof our business success. However, despite its prevalenceand contribution to society, surprisingly little is knownabout the process we call “entrepreneurship.” Seatedaround kitchen tables planning into the late hours ofthe night, or cloistered in garages endlessly tinkeringwith prototypes, nascent entrepreneurs have heretoforebeen obscured from inspection. All that we know aboutthem has been gleaned “after the fact” through theretrospective accounts of “successful” entrepreneurs
28
T H E E N T R E P R E N E U R N E X T D O O R
F I V E O F Y O U R N E I G H B O R S W H OA R E S T A R T I N G C O M P A N I E S
b y L a r r y W . C o x

SE AT E D A ROU N D K I TC H E N TA B L E S planning
into the late hours of the night , or c loistered in
garages e n d lessly t inker ing w ith protot y p es ,
n as c e nt e nt repre neurs h ave here tofore bee n
obs c ured f rom insp ec t ion .
29
who hit the radar when they hired personnel, filed a tax return or built a multibillion dollar business.Indeed, the Panel Study of Entrepreneurial Dynamics(PSED) is the very first research program to systematicallytrack a cohort of nascent entrepreneurs as they progressthrough the gestation phase, in order to betterunderstand this critical phenomenon and the peoplewho are central to it.
Initial findings from the PSED demonstrate conclusivelythat while entrepreneurship may be detected within allage and socioeconomic categories in the United States,there are certain demographic characteristics that maybe used to predict where one is most likely to findpeople in the process of starting companies. Whatremains to be investigated in the PSED program iswhether these same factors are able to foretell
successful transition into an infant firm or eventual riseto high-growth venture. The following stories highlightfive real “nascent entrepreneurs” who, in many ways,illustrate the results elaborated in the body of thisreport. They also exemplify the type of data containedin the PSED database. While these individuals were notsubjects in the PSED, they are representative of thepeople included in this program. They are the neighborsyou encounter at the store, invite over for barbeque,and with whom you share a carpool — ordinary peopleinvolved in the extraordinary process of launching anew venture.

D E S I G N I N G M E N
A l s t o n G r e e n
The epiphany occurred last year at a trade show in NewYork during his annual pilgrimage to designer-Mecca,Manhattan. After 30 years in the industry, working inestablished design houses, creating apparel, home décorand, most recently, greeting cards, it was suddenlyapparent to then 50-year-old Alston Green that it wastime to launch his own studio.
Over the past 12 years as a product designer forHallmark Cards in Kansas City, Missouri, Alston hashoned his skills in product and business development.Indeed, when he took over creative responsibility forHallmark’s “Mahogany” card line — products targetedspecifically for African-Americans — it consisted ofonly 20 items (i.e., 20 stock keeping units or SKUs).Today, however, it boasts approximately 900 SKUs. Thecurrent Mahogany line not only includes ethnic cards,gift wrap, hand bags, and specialty products fortraditional seasonal celebrations such as Christmas,Valentine’s Day, Easter, Mother’s Day and Father’s Day,but also features the same types of items for Kwanzaa,as well as a “Legacy of Greatness” line that highlightsrenowned African-Americans whose lifework hastransformed the United States.

Alston’s career in design began shortly after he receivedan associate’s degree in illustration, painting, anddesign from Parsons School of Design in New York City.It was further enhanced by a bachelor of fine artsdegree from the New School for Social Research, and advanced study in drawing and painting at theprestigious Hochschule Der Kuenste in Berlin. Alstonfigures that the unique combination of his ethnicheritage, formal training in design, and productdevelopment experience at Hallmark will provide himwith the competitive advantage he needs to survive onhis own with a service-oriented business located in thechallenging environment of New York City. It has alsoplaced him in the position to recognize an untappedmarket niche — design services with an ethnicorientation. He says that “most firms are out of touchwith Generation X and Y,” and few understand theneeds of potential ethnic audiences.
Alston is confident that he understands the ethnicmarket better than most and he feels that it isextremely underdeveloped. The burgeoning revenuesfrom Mahogany greeting cards would tend to supporthis thesis. In addition, formal market researchperformed by Alston as part of a FastTrac® businessfeasibility class has further convinced him that hisservices will be in great demand as time goes on. Hisinvestigation into the market has shown that by 2010,the majority of the U.S. population will be Hispanic,and by 2045, the ethnic market will be $6 trillion.
While he has not yet completed a business plan, Alstonis contemplating how to raise the $2 to $5 million heanticipates needing to open his doors. He is not lookingfor partners or debt financing. Rather, he has his sightsset on attracting professional investors, venturecapitalists, based on his track history at Hallmark, hisimpressive marketing numbers, and his ability tonetwork with and hire other creative individuals. When asked about his prospects, Alston says that he is“scared to death … but excited about the possibilities!”
Clearly, Alston Green’s heritage as an African-American has had an impact on the direction of his entrepreneurialendeavors — a design studio focusing on the ethnicmarket. But how has it affected his propensity to start a business in the first place? What are the odds that this 50-year-old black male would be actively involved in entrepreneurial activity? As demonstrated in the PSED,Alston’s ethnic background is highly predictive of his moveto start a business. While he is older than the mostentrepreneurially active age group, the fact that he is an African-American male with some graduate educationmade it highly likely (26 percent probability) that hewould eventually catch the bug to start his own firm.Future research into the PSED data may address the issueof whether or not the lack of a formal business plan, or his decision to seek venture capital may be used topredict Alston’s success at actually launching the venture.
31

N U R S I N G A S E C O N D B U S I N E S S
R o s e L e i d l
Rose Leidl describes starting a business much likeSinatra describes falling in love. That is, she says it’s “more comfortable the second time around” — well, at least more businesslike. Having completed her bachelor’s degree in nursing at the University ofSanto Thomas in the Philippines, Rose immigrated tothe United States in 1985 in response to a nursingshortage in this country. She soon found herself inBoonton, New Jersey where she held her first job as a registered nurse in a local community hospital. Rose moved to Los Angeles, California a year laterwhere she met and married her physician husband, Peter Leidl, while working at Charter CommunityHospital. Eventually Rose and Peter settled in LongBeach, where, by 1995, Rose was working for BlueShield of California and simultaneously starting her firstventure, Managed Healthcare Unlimited, Inc. (MHU).According to Rose, this was a time when she had“nothing to lose and nothing to protect,” but alsonothing to start with.
The original idea behind MHU was to provide managedhealthcare services for self-insured companies. However,by 1996, it was primarily subcontracting work from theHealth Care Financing Administration as well as one of the“big five” consulting firms that ensured a more promisingfuture for MHU in the area of managed care consulting. By the end of 1997, things were looking good for thisfledgling firm. Then the bottom fell out in the span of afew days, and MHU not only lost two large accounts butalso Rose’s partner who announced her intention to startanother (competing) company. Refusing to quit, Roseretrenched, eventually reducing her workforce to one(herself) and her office space to 400 square feet. By 1999,she was keeping MHU afloat only by farming herself outto a nearby HMO as a temporary employee. With Peterno longer willing to bankroll the business, Rose cleanedout her savings account and pumped her last $46,000 intoher dream. Finally, however, in July of 2000, Rose saysthat her luck changed. To her amazement, she landed asubstantial contract with the Department of ManagedHealthcare to develop a protocol for surveying HMOs withregard to their compliance to California regulations. Today,MHU is well known for this protocol throughout the stateof California, and business is better than ever.
Managed Healthcare Unlimited was a natural extension ofRose’s previous work. However, her experience as a nurseand in the managed healthcare industry did not make thestart-up process any easier. In fact, for the first four yearsof operation, MHU struggled to survive. It was only Rose’sdogged persistence that kept her company afloat. Everytime her friends suggested that it was time to call itquits, refusing to accept defeat, she stubbornly foundrenewed determination to make her business work.
32

So, now that MHU is on track, why start a new venturerecruiting nurses from foreign countries in order tosupply the nation’s demand for nursing services? In amuch more reasoned and far less emotional manner, Roseis simply diversifying her business and hedging her bets.She feels strongly that her current government contractscannot last forever. As a result, she must broaden herbusiness interests. Here is where her second foray intothe start-up process differs from her first one. This timeshe is not being pulled by her dreams, but rather pushedby her growing business acumen. She is performingmarket research and carefully weighing her options. Rosesays her first love is still compliance surveys (i.e., thecurrent focus of MHU), but nurse recruitment representsan excellent business opportunity.
Rose Leidl was working full-time when she started her firstbusiness, Managed Healthcare Unlimited. But is employmenta hindrance or a help for individuals considering anentrepreneurial venture? Are people who are employedmore likely to “play it safe,” remaining in their currentoccupation, or “take the plunge,” starting their owncompany? The PSED indicates that participation in thelabor force is significantly related to start-up activity. Thatis, it finds that individuals who are fully employed oremployed on a part-time basis are more likely than thosewho are unemployed (e.g., retired, working at home, orgoing to school) to start a company. Further research intothe PSED data should provide greater understanding asto why this is true. Is it the capital provided throughemployment, or the experience gained on the job thatincreases the likelihood of entrepreneurship?

¿ H A B L E S E N T R E P R E N E U R S H I P ?
M a r y D e L a R o s a
Immokalee, Florida, with its 15,000 residents, representsthe rural side of a state better known for Mickey Mouse,retirees, and South Beach. It doesn’t expand and contractwith the seasonal influx of elderly people escaping thewinds of winter, like nearby Fort Meyers. Nor does itentice shrieking crowds of young tourists with themeparks like those in Orlando, or throb to the beat of hipcosmopolitan culture and art deco as in Miami. Locatedon the edge of the Florida Everglades, the main businessof Immokalee is farming, primarily the cultivation ofwinter vegetables. Residents are steady and hard working,but not necessarily high-tech. So, is this the right placeto start a business?

Mary De La Rosa thinks so. The venture she is in theprocess of launching, MGD Bookkeeping, seeks to takeadvantage of the huge demographic shift occurringaround the country in towns like Immokalee — theimmigration of Hispanic workers. In the case ofImmokalee, the new residents are primarily farm laborersfrom Mexico who represent a substantial and largelyunder-served segment of the local market. “There are noSpanish-speaking bookkeepers in Immokalee,” says Mary.And this, she figures, will be her competitive advantage.
Mary is a Hispanic, 28-year-old, married mother of threewho has always been interested in the accountingprofession. She has an accounting certificate from alocal vocational school, and has kept the books for herbrother-in-law for several years. Most recently, she hasbeen the office manager in her uncle’s investmentbusiness. But what really drives Mary is a burning desireto be her own boss. For the past 10 years she has dreamtof little else. She sees it primarily as an opportunity tobuild security for her kids. However, it is obvious evento the casual observer that Mary is enjoying the challengeof building her own organization.
There is no business plan for MGD Bookkeeping. Nor hasMary performed any formal market research. However, shehas aligned herself with another more experienced book-keeper who will serve as her mentor and with whom shewill initially share an office. She has also sought helpfrom the local Small Business Development Center. Shedoesn’t need seed capital because she has been saving
for this enterprise for a long time. And although Marydoesn’t have ownership experience, she is confident thatshe can build MGD Bookkeeping into a million dollarbusiness in the next three years. Mary sees tremendousopportunity in Immokalee. She also wants to make heruncle eat his words. “He told me that I would neverbecome a member of the Chamber of Commerce becauseI am female. I want to prove him wrong.”
How important is location in the start-up process? Are inhabitants of urban areas more likely to start abusiness? Are nascent entrepreneurs who live in farmingcommunities like Mary’s the exception or the rule?According to the PSED, the inhabitants of urban areasare in fact, more likely to be involved in the start-upprocess than people who live in rural locations. Futureresearch may support the notion that, in general,companies are started where sizeable markets are readilyavailable. However, it must also explain why Hispanicsare an exception to this rule. For Hispanics, as seen inthe PSED data, the “urbanness” of a particular locationmakes no difference in the prevalence of start-up activity.With the substantial influx of Hispanics immigrants,nascent entrepreneurs like Mary may find entrepreneurialopportunity in the shifting demographics of small town America.
35

G E T T I N G A I R B O R N
M i g u e l H i d a l g o
Miguel Hidalgo is fascinated with high-speedtransportation — especially air transportation. That’swhy he’s trying to start a regional airline, “Voyager.” Hefeels strongly that attempts by other entrepreneurs tolaunch California-based regional air carriers have beenpoorly managed. “They were mostly looking for a quickdollar,” he explains, describing why no such airlines arecurrently in operation. Further, Miguel contends, “Theydidn’t have the training, regional experience, flexibilityor long-term commitment to pull it off.”
If knowledge of the industry is the key to launching anairline, then Miguel should have no problem. He’s beendreaming about this venture for the last 15 years,preparing himself at every juncture for this moment intime. Miguel has held jobs with AeroCalifornia and USAirways. He has a bachelor of arts degree in internationalcommunications from Pepperdine University. He also hasmaster of science degree in aeronautical managementfrom National University and is only two courses shy ofan MBA, also from National University. In 1991, Miguel’scompany, AeroCargo, opened a “fixed base operation”(FBO) at Brown Field in San Diego, just across theborder from Tijuana. The FBO featured hangars, rampfacilities, and offices, and spawned three additionalbusinesses: Baja AirWest Express, Nelly’s Pilot & OfficeSupply, and Brown Field Rental Car. Scheduled commuterflights were flown, where Miguel acquired hard-coreexperience. He has even written a book about how to fly into Baja California. Unfortunately, however,AeroCargo was forced to close in 1995 when AeroCargowas unable to get approvals from San Diego needed tocontinue operations.
Miguel has prepared an 800-page business plan,featuring a very detailed operations blueprint. He iscurrently paring this down to create an executivesummary suitable for distribution to potential investors.He figures that he will need around $250,000 just tocomplete the marketing and financial portions of theplan, as well as to fund his fundraising efforts. In total,
36

Miguel thinks he needs $19 million to launch Voyager.However, as with any sustained effort, the most importantassistance may be the intangible kind supplied by friendsand family. Yet, after 15 years of chasing this particulardream, moral support may be harder to obtain thanfinancing. Miguel’s father, a self-made millionaire whoimmigrated to the United States 72 years ago, andMiguel’s siblings are dismayed that he did not join thefamily law firm. His wife and children are counting onhim to succeed. Clearly, Miguel must keep his closestsupporters from abandoning ship. Wearily, he admitsthat “if you want to succeed, you’re going to have tobe persistent.”
Miguel Hidalgo has been preparing to launch Voyager for many years. During this time, his education, workexperience and attention have been narrowly focused onone goal — starting a regional airline. To what degreedoes job and industry experience play a role in thesuccessful launch and growth of such a venture? At whatpoint is it financially prudent and personally responsibleto abandon the entrepreneurial effort? Only by trackingnascent entrepreneurs like Miguel through to the realization(or abandonment) of their dreams will we be able toanswer these questions. The PSED provides an excellentvehicle for doing this. By following a representativesample of nascent entrepreneurs over the course of twoyears, this investigation is able to add insight into theseimportant issues.
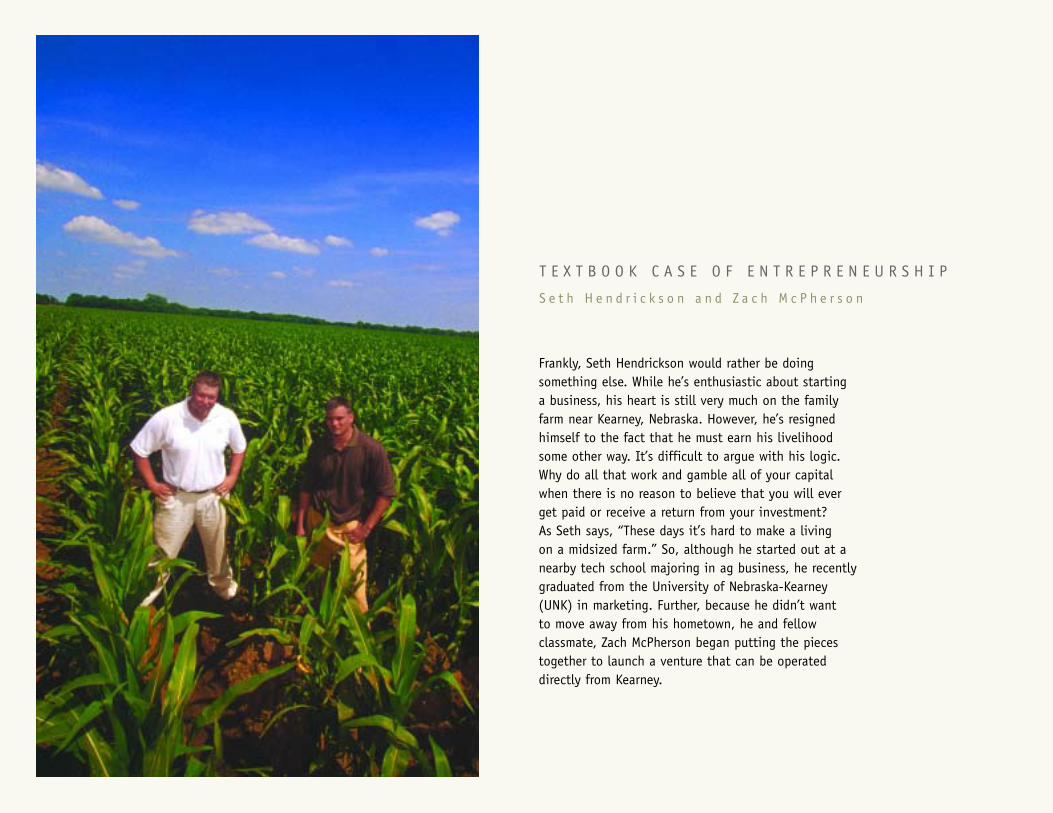
Frankly, Seth Hendrickson would rather be doingsomething else. While he’s enthusiastic about starting a business, his heart is still very much on the familyfarm near Kearney, Nebraska. However, he’s resignedhimself to the fact that he must earn his livelihoodsome other way. It’s difficult to argue with his logic.Why do all that work and gamble all of your capitalwhen there is no reason to believe that you will everget paid or receive a return from your investment? As Seth says, “These days it’s hard to make a living on a midsized farm.” So, although he started out at anearby tech school majoring in ag business, he recentlygraduated from the University of Nebraska-Kearney(UNK) in marketing. Further, because he didn’t want to move away from his hometown, he and fellowclassmate, Zach McPherson began putting the piecestogether to launch a venture that can be operateddirectly from Kearney.
T E X T B O O K C A S E O F E N T R E P R E N E U R S H I P
S e t h H e n d r i c k s o n a n d Z a c h M c P h e r s o n

The concept behind Peak Learning is to build a businessthat will transform college level textbooks into an audioformat. The idea first came to Seth and Zach last Octoberas they sat in class wondering how they were going toget everything read before finals. It occurred to themthat if they could listen to their books rather than readthem, they would be able to absorb the material whilewalking on campus or driving a car (or sitting on atractor), and not be confined to the library. Both studentshad taken an entrepreneurship class at UNK where theyhad learned how to perform market research and preparea business plan. So, one of their first steps was to seeif any publishers were already producing audio versionsof their textbooks. Next, they conducted a phone surveyof their fellow students. Finally, satisfied that noincumbents were already selling audio textbooks, and that other collegiates were interested in suchproducts, Seth and Zach began to focus their attentionon production.
Today, these young would-be entrepreneurs are nearlyfinished with their business plan and are in the processof completing their cash flow projections. They figurethat each audio textbook will cost approximately$18,000 to complete, but they intend to bootstraptheir operation rather than seek outside investors. Theyalso plan to outsource production, and they’re countingheavily on help from family members along the way.The two partners want to roll out two audio textbooksby fall of 2002, 125 in the next five years, and 250 byyear 10. They realize that there are no barriers blocking
the established publishing houses from entering theirmarket. As a result, Peak Learning must fly below theradar and make use of its first-mover advantages. Inlight of this, being headquartered in the middle of ruralAmerica may actually turn out to be an unexpectedstrategic advantage — Seth and Zach may just havefound a textbook solution to competing against large,established goliaths — obscurity.
Seth and Zach, like many of today’s young peoplegrowing up in a rural setting, would prefer to stay on the farm, working the land just as their parents andgrandparents did before them. However, the risk-rewardratio for tilling the soil is unacceptably high and they are usually forced to consider other options in an urbancontext where the payoff is more certain. Still, some mayfind a solution in entrepreneurship. The information age,the internet and the globalization of markets may createopportunities for them to remain in isolated areas whilemaking a living as an entrepreneur. Analysis of thescreening portion of the PSED tells us that whites andblacks in rural areas are less likely to be involved in the start-up process. But a more detailed look at thelongitudinal portion of the database is necessary to findout whether rural nascent entrepreneurs are more or lesslikely to actually create a viable business. Does the lackof a sizeable local market hinder successful businessformation? Is the infrastructure in a rural settingsufficient to support manufacturing or even information-based industries?
39

W H E R E D O W E G O F R O M H E R E ?
40
It is obvious from the Panel Study of EntrepreneurialDynamics that entrepreneurship is a widespread andimportant phenomenon in the United States. Entrepre-neurship affects our economy and social structure byproviding a much-needed mechanism for self-employment,innovation and economic development. As a result, it iscrucial that we understand it more completely. Whichindividuals are likely to enter the start-up process? Howcan we increase participation in entrepreneurship at alllevels of society? What are the processes by which newbusinesses are formed? What conditions are necessaryand/or sufficient to produce infant firms? Finally, arethere characteristics that might predict the successfullaunch of a high-growth venture?
The findings included in this report are clearly animportant first cut at these issues. However, they aredrawn exclusively from the initial “screening” portion of the PSED — truly the tip of the iceberg. Thus, whilethis report allows a quick peek into the life of a nascententrepreneur, a more thorough examination is certainlywarranted and possible. There is a tremendous richnessto the PSED data, and much remains to be done withthe more than 1,200 variables measured over the courseof two years. The good news is that the data analyzedfor this publication are currently available in the publicdomain30 and the remainder will be made available tothe public in January 2003. It is hoped that many ofthe subtleties and mysteries of the entrepreneurialprocess will be unraveled through further analysisutilizing this unique resource.
E N D N O T E S
41
W H Y S T U DY N A S C E N T E N T R E P R E N E U R S ?
1 The Ewing Marion Kauffman Foundation has, since 1999,sponsored a number of studies that have sought tounderstand the impact of new business formation activitieson economic growth in countries throughout the world. Thelatest study [Reynolds, P. D., Camp, S. M., Bygrave, W. D.,Autio, E. & Hay, M. (2001). Global Entrepreneurship Monitor:2001 Executive Report. Kansas City: Kauffman Center forEntrepreneurial Leadership] can be found at:
http://www.entreworld.org/gem2001.
A previous study [Reynolds, P. D., Hay, M., Bygrave, W. D.,Camp, S. M. & Autio, E. & (2000). Global EntrepreneurshipMonitor: 2000 Executive Report. Kansas City: Kauffman Centerfor Entrepreneurial Leadership] found a 0.7 correlationbetween entrepreneurial activity and economic growth.
2 Purrington, C. A. & Bettcher, K. E. (2001). From the garage tothe boardroom: The entrepreneurial roots of America’s largestcorporations. Washington, D.C.: National Commission onEntrepreneurship.
3 Purrington, C. A. & Bettcher, K. E. (2001). From the garage tothe boardroom: The entrepreneurial roots of America’s largestcorporations. Washington, D.C.: National Commission onEntrepreneurship, pp. 24-31.
4 Zoltan Acs and David Audretsch have published a number ofstudies that have explored the relationship betweenentrepreneurial activity and innovation. A good example ofthis research is:
Acs, Z. J. & Audretsch, D. B. (1988). Innovation in large andsmall firms: An empirical analysis. American Economic Review.78: 678-690.
5 Research on the relationship between new and small firmsand job creation is substantial. Thoughtful reviews of thesestudies can be found in books written by Kirchhoff (1994),and Reynolds and White (1997).
Birch, D. L. (1979). “The job generation process.”Unpublished report. Massachusetts Institute of TechnologyProgram on Neighborhood and Regional Change for theEconomic Development Administration, U.S. Department ofCommerce, Washington, D.C.
Birch, D. L. (1987). Job Creation in America. New York: The Free Press.
Kirchhoff, B. A. (1994). Entrepreneurship and DynamicCapitalism: The Economics of Business Firm Formation andGrowth. Westport, CT: Praeger.
Reynolds, P. D. & White, S. B. (1997). The EntrepreneurialProcess. Westport, CT: Quorum Books.
6 Acs, Z. J., Armington, C, & Robb, A.. (1999) Measures of JobFlow Dynamics in the U.S. Economy. Upper Marlboro, MD. U.S. Bureau of the Census, Center for Economic Studies,discussion paper.
7 Boden, R. (2000) Employment Establishment Changes andSurvival, 1992-1996. Upper Marlboro, Maryland. U.S. Bureauof the Census, Center for Economic Studies, discussion paper.
8 The PSED process built on earlier efforts by Paul Reynolds andcolleagues to study nascent entrepreneurs in Wisconsin(Reynolds, & White, 1993; 1997), as well as a small nationalsample of nascent entrepreneurs who were identified from astudy that was “piggy-backed” onto the University ofMichigan Institute for Social Research Survey of ConsumerAttitudes (Curtin, 1982; Reynolds, 1997). These prior studiesindicated that it was technically feasible, as well asfinancially possible, to locate and survey individuals from thegeneral population of all U.S. adults who were activelyengaged in starting businesses.

Curtin, R. (1982). Indicators of consumer behavior: TheUniversity of Michigan Survey of Consumers. Public OpinionQuarterly. 46: 340-362.
Reynolds, P. D. (1997). Who starts new firms? Preliminaryexplorations of firms-in-gestation. Small Business Economics.9: 449-462.
Reynolds, P. D. & White, S. B. (1993). Wisconsin’sEntrepreneurial Climate Study. Milwaukee: MarquetteUniversity Center for the Study of Entrepreneurship.
Reynolds, P. D. & White, S. B. (1997). The EntrepreneurialProcess. Westport, CT: Greenwood Publishing.
HOW TO S TUDY NASCENT ENTREPRENEURS : THE P S ED MODEL AND R E S EARCH DES IGN
9 This report is an overview of a broader research programfocusing on the general features of the entrepreneurialprocess that is described in detail in Reynolds (2000).
Reynolds, P. D. (2000). National PSED of U. S. business start-ups: Background and methodology. In J. A. Katz (Ed.),Advances in Entrepreneurship, Firm Emergence, and Growth(Vol. 4,). Stamford, CT: JAI Press, pp. 153-227.
10 National screening of the adult population was completed bya commercial market research firm (TeleNation Program,Market Facts, Inc.; Arlington Heights, IL). The screeningprocess identified three random samples of 1,000 adults eachweek in the contiguous 48 states. Random digit dial samplingprocedures (the actual phone numbers were randomlygenerated) were used to locate households, listed andunlisted. The first individual 18 years and older that wouldcomplete the phone interview was accepted as a respondent.Quota sampling was used to ensure that half of each samplewas men and the other half women. Each sample wascompleted in a three-day period with a three-call criterion
(initial call and two call-backs). However, up to 2 percent ofthe respondents were called from four to nine times. Theinterviews were controlled to be less than 30 minutes long tominimize mid-interview terminations.
There were five such subsamples that were generated from thetelephone screening. The first subsample (labeled below asERC) has been identified as the “ERC” sample or the “mixedgender” sample in other studies. The “ERC” sample wasfunded by the Entrepreneurial Research Consortium, a group ofuniversities, foundations and for-profit companies. The secondsubsample (labeled as CG-ERC) was the “mixed gender”comparison group, also funded by the ERC. The thirdsubsample (labeled as NSF-W) has been called the “NSFwomen only” subsample, as it was funded by a grant to NancyM. Carter from the National Science Foundation (NSF) to studywomen nascent entrepreneurs. The fourth subsample (labeledas NSF-MIN) is known as the “NSF minority over-sample,” asit was funded through a grant to Patricia G. Greene from theNSF to study minority nascent entrepreneurs. Finally, a fifthsubsample (labeled as CG-MIN) was collected that focused ona “minority over-sample comparison group,” that was alsofunded by the NSF grant to Greene.
Because the two different NSF grants came several monthsapart, the national screening process for identifying nascententrepreneurs occurred over two broad time periods.Screening of individuals targeted for the nascent entrepreneurERC group began in July of 1998 and ended in April of 1999.Screening of individuals targeted for the NSF-W over samplebegan in September of 1998 and ended in December of 1998.Together, these two samples of potential nascententrepreneurs comprised a total of 31,261 individuals.Screening for the CG-ERC comparison group began and wascompleted in November of 1998 with a total of 2,010.Screening for the NSF-MIN minority over-sample began in Julyof 1999 and ended in January of 2000 with a case listing of
42
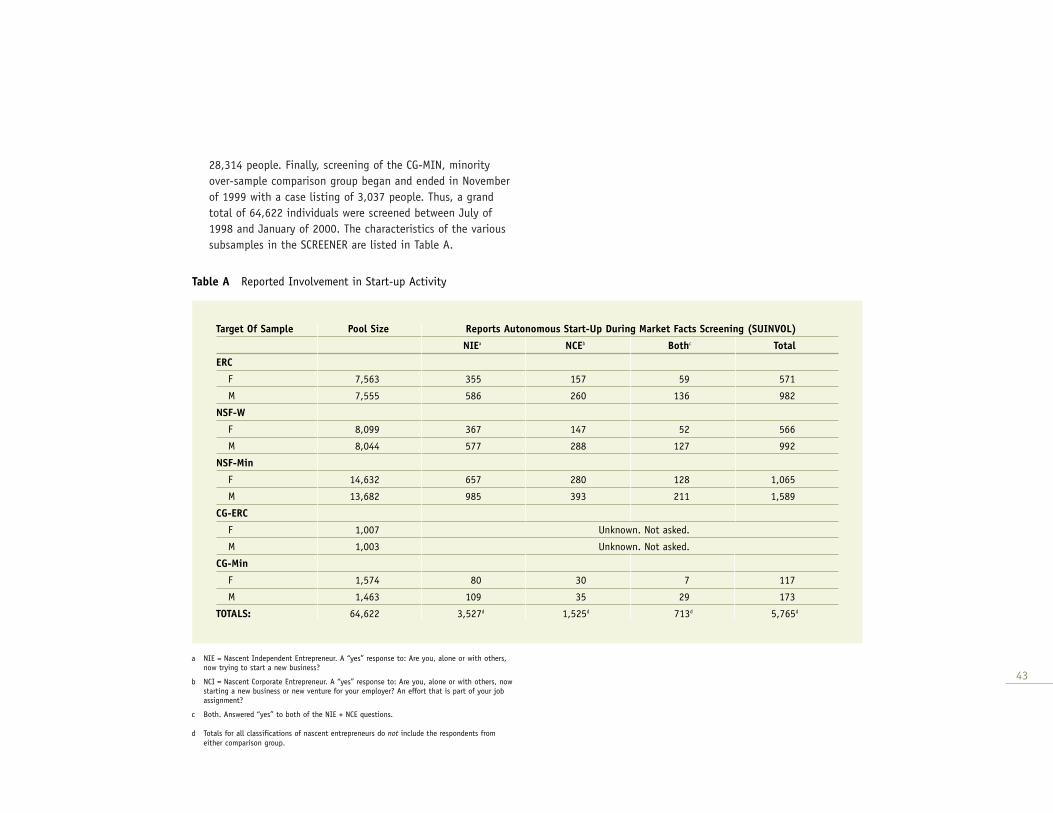
28,314 people. Finally, screening of the CG-MIN, minorityover-sample comparison group began and ended in Novemberof 1999 with a case listing of 3,037 people. Thus, a grandtotal of 64,622 individuals were screened between July of1998 and January of 2000. The characteristics of the varioussubsamples in the SCREENER are listed in Table A.
43
Target Of Sample Pool Size Reports Autonomous Start-Up During Market Facts Screening (SUINVOL)
NIEa NCEb Bothc Total
ERC
F 7,563 355 157 59 571
M 7,555 586 260 136 982
NSF-W
F 8,099 367 147 52 566
M 8,044 577 288 127 992
NSF-Min
F 14,632 657 280 128 1,065
M 13,682 985 393 211 1,589
CG-ERC
F 1,007 Unknown. Not asked.
M 1,003 Unknown. Not asked.
CG-Min
F 1,574 80 30 7 117
M 1,463 109 35 29 173
TOTALS: 64,622 3,527d 1,525d 713d 5,765d
Table A Reported Involvement in Start-up Activity
a NIE = Nascent Independent Entrepreneur. A “yes” response to: Are you, alone or with others,now trying to start a new business?
b NCI = Nascent Corporate Entrepreneur. A “yes” response to: Are you, alone or with others, nowstarting a new business or new venture for your employer? An effort that is part of your jobassignment?
c Both. Answered “yes” to both of the NIE + NCE questions.
d Totals for all classifications of nascent entrepreneurs do not include the respondents fromeither comparison group.
Whether members of the comparison groups were themselvesinvolved in start-up activity was unfortunately not asked ofthe mixed gender comparison group (the CG-ERC subsample).Follow-up interviews with these individuals revealed that fourof them had in fact started businesses, and in subsequentanalyses using the SAMPLE dataset these four individuals weredropped. Within the minority over-sample comparison group(the CG-Min) subsample, a total of 29 individuals reportedsome start-up activity, and so these individuals were alsodropped in analyses using the SAMPLE dataset. Details of thedistribution of males and females for the various subsamplesand descriptions of the decision rules for identifying nascententrepreneurs is found in:
Shaver, K. G., Carter, N. M., Gartner, W. B. and P. D. Reynolds.(2001). “Who is a nascent entrepreneur? Decision rules foridentifying and selecting entrepreneurs in the Panel Study ofEntrepreneurial Dynamics.” Paper presented at the BabsonCollege/Kauffman Foundation Entrepreneurship ResearchConference, Jonkoping, Sweden, June.
Because of the oversight about start-up activity in thecomparison group, the CG-ERC subsample (2010 respondents)was dropped in analyses using the SCREENER. In addition,another 40 respondents were dropped from analyses using theSCREENER because of problems with various variables thatmade these cases suspect. Therefore, the SCREENER reports onanalyses using 62,612 respondents.
11 To be labeled as a “nascent entrepreneur” a respondent hadto say, “yes” to either one or both of the following questions:
(1) Are you, alone or with others, now trying to start a newbusiness?
(2) Are you, alone or with others, now starting a newbusiness or new venture for your employer? An effort thatis part of your job assignment?
AND meet three addition criteria:
a. Were currently active in the start-up effort.
b. Anticipated full or part ownership of the new business.
c. The effort had not yet generated a positive monthly cashflow that covered all expenses and owner/manager salariesfor more than three months.
The initial stage of the detailed interviews, completed by theUniversity of Wisconsin Survey Research Laboratory, includedthe third criteria. Only three-criteria nascent entrepreneursreceived the full 60-minute phone and 12 page self-administered questionnaire. About one-fourth (27 percent) of the two-criteria nascent entrepreneurs were involved withbaby businesses, new firms in the first stages of operationalexistence, and did not quality as three-criteria nascents.Hence, the actual prevalence rate of three-criteria nascentswould be about three-fourths of that of two-criteria nascents.
On the other hand, the three callback criteria utilized in theinitial screening — three calls to each randomly selectedphone number — led to a lower prevalence rate. Theprevalence rate for two-criteria nascent entrepreneurs amongthree callback respondents was 6.2 per 100, compared to 7.5per 100 for five to nine callback respondents. This 21 percenthigher prevalence rate is statistically significant.
These two sources of attrition may, therefore, offset eachother. The prevalence rate of two-criteria nascent entrepreneurswith a three callback operational criteria may be equal to theprevalence rate of three-criteria nascent entrepreneurs with anine callback operational criteria. The impact of more callbackson the prevalence rate reflects the extreme time pressures onnascent entrepreneurs, most of whom have a full time role inthe labor force at the same time they are trying to start anew business. They are difficult to find and interview preciselybecause they are so busy trying to implement a new business.
44

Those that answered “yes” to either (6.1 percent to the firstand 2.8% to the second) or both (1.2 percent) of the first twoquestions were then asked about the first two a + b of thethree additional criteria. Analysis of population prevalencerates focus on these two-criteria nascent entrepreneurs.
About 87 percent of those respondents that met the a + bcriteria provided their first name and phone number forsubsequent survey efforts by the University of WisconsinSurvey Research Laboratory in Madison, Wisconsin.
A similar procedure was used to identify candidates for thecomparison group, except that all respondents in the samplewere offered a chance to participate in a “study of the work andcareer patterns of all Americans, including those not currentlyworking.” In this case, 62 percent agreed to participate.
In addition to providing candidates for the nascententrepreneur cohort and the comparison group, the resultingdata set includes basic sociodemographic information on therespondent and their household as well as the county andstate in which the household was located. This information isused in the analysis of factors affecting the prevalence ratesof two-criteria nascents.
If the respondent was involved in several start-up efforts,they were asked to focus on only the most recent start-upeffort. Up to one-third of the nascent entrepreneurs reportedsimultaneous participation in several start-ups. A series offour questions were used to determine if the start-up had nothad positive monthly cash flow that covered expenses andthe owner-manager salaries for more than three months.
An infant business was considered to be a business in whichthe start-up effort had a positive monthly cash flow thatcovered expenses and salaries for the owner/manager for morethan three months (91 days). In the phone interview fourquestions were asked that were used to make this determination:
1. Question 162: first year in which money, income, or fees were received.
2. Question 164: first year in which there was positivemonthly cash flow.
3. Question 165: whether business expenses included owner’s salary.
4. Question 166: first year in which expenses included owner’s salary.
Each of the “year” questions was followed by a corresponding“month” question (162a, 164a, 166a) to specify the timingmore precisely.
If so, the effort was considered an infant business and not astart-up effort and respondents were thanked for their timeand dropped from the procedure. Approximately one-fourth(27 percent) of the respondents were dropped at this stage,reflecting the ambiguity associated with the phrase “startinga business.”
12 Potential nascent entrepreneurs were more interested involunteering for the project than those in the comparisongroup, 87 percent versus 62 percent; but those in thecomparison group were more likely to complete all aspects of the data collection procedure, they have a 10 percenthigher return rate on the mailed questionnaires.
The time and effort required to obtain completed phoneinterviews is indicated by the time lags between the initialscreening and the phone interview, which average 51 days fornascent entrepreneurs and 62 days for the comparison grouprespondents, with a maximum of 250 days. It also is reflectedin the lag between completion of the phone interview andreceipt of the mail questionnaire, which averages 51 and 37days, respectively, for nascent entrepreneurs and comparisongroup respondents, with a maximum of 337 days. Further, thenumber of contacts required to obtain the phone interviews
45

averaged 8 for nascent entrepreneurs and 5 for the comparisongroup, with a maximum of 74. Twenty-five percent of thenascent entrepreneur phone interviews required more than 9calls and 25 percent of the comparison group phone interviewsrequired more than 7 calls.
Reactions of the respondents were measured in several ways.Nascent entrepreneurs were asked, at the end of the phoneinterview, how the experience affected their interest instarting a new firm: 59 percent said it increased their interest,39 percent said it had no effect, and 1.2 percent indicatedthat it reduced their interest in starting a new firm. In fact,the positive effect may cause some problems, since some ofthe respondents may claim that participation in the projecthas increased their interest in entrepreneurship and, becauseof the content of the interview schedules, their businessknowledge as well. Thus, participation may have improvedtheir chances for business success. This is known as the“Hawthorne effect” which argues that a known research focuson work activity may lead to higher levels of productivity.However, it may be offset by the “Heisenberg effect” whichholds that collecting data from a phenomenon actually takesenergy away from the process under study.
The most difficult information to collect from respondents insurvey research are details regarding their household financialstatus. It is easier to get candid responses about drug use,deviant or extramarital sexual behavior, cheating on incometax returns, and almost any other personal activity. In thisproject, however, over 95 percent of the nascent entrepreneursand 98 percent of the comparison group provided informationon both household income and net worth. On the self-administered questionnaires returned, 98 percent of the itemswere completed. In terms of respondent cooperation in surveyresearch in the United States at the end of the twentiethcentury — this is as good as it gets!
T H E P S E D DATA S E TS
13 Analyses based on the full screening sample of 62,612respondents are labeled as the SCREENER. Analyses of datafrom the the detailed interviews reflects comparisons amongthree-criteria nascents of different ethnic backgrounds as well as with appropriate comparison group individuals. Theunweighted counts of respondents by ethnic identification areindicated for the two types of analyses in Table B. Analysesconducted on data from the sample of 1,261 (nascententrepreneurs and comparison group individuals) are labeledas SAMPLE.
The attrition between the screening sample and the detaileddata on nascent entrepreneurs reflects losses during the datacollection process as well as purposeful sampling from thescreened population to enhance the female and minoritydetailed samples. The slight under-representation of Hispanicsin the screening sample reflects the practice, for this study, of restricting all interviews to English.
Ethnic identity was determined in two ways in the two surveys.In the screening interviews, individuals were asked twoquestions; one related to whether respondents consideredthemselves white, black, Asian, or other. The second questionasked respondents whether they considered themselves Hispanicor Latino: yes or no. In order to create a single variable, anyperson who responded, “white” or “other” to the first itemand “yes” to the Hispanic item was considered Hispanic. Ofthose in the Hispanic category, 44 percent responded, “white”to the first item, the remainder responded as “other.” Amongthose retained in the “black” category 3 percent had responded“yes” to the Hispanic item as had 8 percent of those in the“Asian” category. The ethnic identification of the respondentsis not, therefore, unambiguous in every case. In the detailedinterviews, each respondent answered a single item related to
46
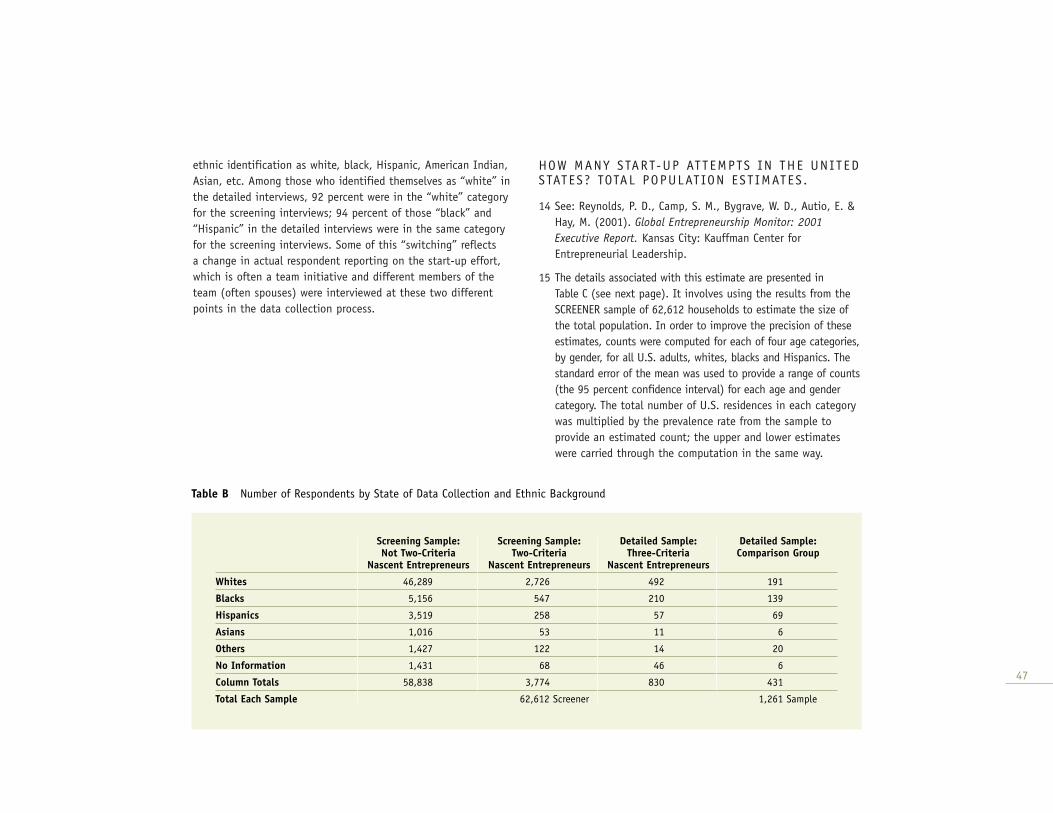
ethnic identification as white, black, Hispanic, American Indian,Asian, etc. Among those who identified themselves as “white” inthe detailed interviews, 92 percent were in the “white” categoryfor the screening interviews; 94 percent of those “black” and“Hispanic” in the detailed interviews were in the same categoryfor the screening interviews. Some of this “switching” reflects a change in actual respondent reporting on the start-up effort,which is often a team initiative and different members of theteam (often spouses) were interviewed at these two differentpoints in the data collection process.
HOW MANY START-UP ATTEMPTS IN THE UNITEDSTATES? TOTAL POPULATION EST IMATES .
14 See: Reynolds, P. D., Camp, S. M., Bygrave, W. D., Autio, E. &Hay, M. (2001). Global Entrepreneurship Monitor: 2001Executive Report. Kansas City: Kauffman Center forEntrepreneurial Leadership.
15 The details associated with this estimate are presented in Table C (see next page). It involves using the results from theSCREENER sample of 62,612 households to estimate the size ofthe total population. In order to improve the precision of theseestimates, counts were computed for each of four age categories,by gender, for all U.S. adults, whites, blacks and Hispanics. Thestandard error of the mean was used to provide a range of counts(the 95 percent confidence interval) for each age and gendercategory. The total number of U.S. residences in each categorywas multiplied by the prevalence rate from the sample toprovide an estimated count; the upper and lower estimateswere carried through the computation in the same way.
47
Screening Sample: Screening Sample: Detailed Sample: Detailed Sample:Not Two-Criteria Two-Criteria Three-Criteria Comparison Group
Nascent Entrepreneurs Nascent Entrepreneurs Nascent Entrepreneurs
Whites 46,289 2,726 492 191
Blacks 5,156 547 210 139
Hispanics 3,519 258 57 69
Asians 1,016 53 11 6
Others 1,427 122 14 20
No Information 1,431 68 46 6
Column Totals 58,838 3,774 830 431
Total Each Sample 62,612 Screener 1,261 Sample
Table B Number of Respondents by State of Data Collection and Ethnic Background

48
U.S. Count: 1997 Two-Criteria Nascent Standard Error of Two-Criteria Nascent 95% Confidence 95% Confidence Age Adjusted Estimate(1,000)a Entrepreneurs the Mean Entrepreneurs; Interval, Low Interval, High of NE Prevalence
(#/100) Estimated (1,000) (1,000) (1,000) Rates (#/100)
ALLMen: 18-24 Yrs 12,993 9.1 0.50 1,186 1,059 1,314Men: 25-44 Yrs 41,355 10.6 0.30 4,379 4,136 4,623Men: 45-64 Yrs 27,705 7.2 0.30 1,989 1,826 2,152Men: 65+ Yrs 14,198 1.2 0.20 169 113 225Men: All yrs 96,251 7,724 7,135 8,313 8.0Women: 18-24 Yrs 12,478 4.1 0.30 514 441 587Women: 25-44 Yrs 41,939 6.6 0.20 2,764 2,599 2,928Women: 45-64 Yrs 29,556 4.3 0.20 1,262 1,146 1,378Women: 65+ Yrs 18,203 0.4 0.01 64 60 67Women: All yrs 102,176 4,604 4,246 4,961 4.5All Adults 198,427 12,328 11,381 13,274 6.2WHITEMen: 18-24 Yrs 10,413 8.5 0.60 889 767 1,012Men: 25-44 Yrs 34,137 9.9 0.30 3,380 3,179 3,580Men: 45-64 Yrs 23,896 6.9 0.30 1,644 1,504 1,785Men: 65+ Yrs 12,691 1.2 0.20 147 97 197Men: All yrs 81,137 6,060 5,547 6,574 7.5Women: 18-24 Yrs 9,871 3.7 0.40 364 287 442Women: 25-44 Yrs 33,881 6.1 0.20 2,080 1,947 2,213Women: 45-64 Yrs 24,936 4.0 0.20 1,002 905 1,100Women: 65+ Yrs 17,934 0.3 0.01 61 57 64Women: All yrs 86,622 3,508 3,819 3,819 4.0All Adults 167,759 9,568 8,743 10,393 5.7BLACKMen: 18-24 Yrs 1,915 12.9 1.70 247 183 311Men: 25-44 Yrs 5,139 15.9 1.00 816 715 917Men: 45-64 Yrs 2,683 9.7 1.20 260 197 323Men: 65+ Yrs 1,118 0.4 0.40 4 0 13Men: All yrs 10,855 1,327 1,096 1,564 12.2Women: 18-24 Yrs 1,939 5.6 1.00 110 72 148Women: 25-44 Yrs 5,772 9.9 0.80 572 482 663Women: 45-64 Yrs 3,336 6.9 0.90 229 170 288Women: 65+ Yrs 1,734 0.8 0.50 15 0 32Women: All yrs 12,781 925 723 1,130 7.2All Adults 23,636 2,253 1,819 2,694 9.5HISPANICMen: 18-24 Yrs 1,915 10.1 1.40 193 140 245Men: 25-44 Yrs 5,001 11.4 1.00 570 472 668Men: 45-64 Yrs 2,080 7.5 1.50 155 94 217Men: 65+ Yrs 740 4.4 2.30 33 0 66Men: All yrs 9,736 951 707 1,196 9.8Women: 18-24 Yrs 1,773 5.1 1.00 90 55 125Women: 25-44 Yrs 4,722 5.8 0.80 272 198 346Women: 45-64 Yrs 2,262 3.3 0.90 75 35 115Women: 65+ Yrs 1,023 0.0 0.00 0 0 0Women: All yrs 9,780 437 288 585 4.5All Adults 19,516 1,388 995 1,781 7.1
Table C Estimated Number of Two-Criteria Nascent Entrepreneurs in the United States by Age, Gender and Ethnic Identity
a Population counts from Tables 21 and 23 for 1997, Statistical Abstracts of the United States: 1999, 119th Edition.

16 Ruef, M., Aldrich, H.E. and Carter, N.M. 2002. Don’t go tostrangers: Homophily, strong ties and isolation in the formationof organizational founding teams. American SociologicalAssociation, Chicago.
17 1999 Statistical Abstract of the United States, Tables 92 & 155
18 Reynolds, P.D. & White, S.B. (1977). The EntrepreneurialProcess. Westport, CT: Quorum Books.
19 Per 100 people. Women Sample N = 32,336. Men Sample N =30,276.
20 Prevalence rates for nascent entrepreneurs derived from theSCREENER.
21 Per 100 People. White Women N = 20,246. White Men N =19,861. Black Women N = 2,773. Black Men N = 2,271.Hispanic Women N = 1,778. Hispanic Men N = 1,759.
22 Per 100 People.
23 Per 100 People.
24 Per 100 People.
R E G IO N A L FAC TO R S A N D N A S C E N TE N T R E P R E N E U R S H I P AC T I V I T Y
25 The screening sample of 62,612 respondents is distributedamong the 3,124 U.S. counties in proportion to thepopulation of the counties. There are very few counties wherethe sample is large enough to provide a stable estimate ofthe prevalence of nascent entrepreneurs, by gender and ethnicbackground in each county. But, comparisons can be madebased on the characteristics of the counties.
26 The Chronbach measure of reliability was 0.89, indicating ahigh level of correspondence among the items as a measure ofcontext for the respondents.
27 Prevalence rates for nascent entrepreneurs derived from theSCREENER.
28 Differences across the four categories, including theprevalence rate of nascent entrepreneurs is statisticallysignificant at the p>.0000 level.
29 The correlations between these three features of the contextare presented in Table D for the 62,612 respondents. Althoughall correlations are statistically significant, even the negativecorrelation of -.13 between population density and populationgrowth, it is clear these reflect rather low levels of association.
30 For more details, visit the PSED website at:http://projects.isr.umich.edu/psed/.
49
Urban Index Population Density Population Growth
Urban Index 1.00
Population Density 0.26 1.00
Population Growth 0.23 -.13 1.00
Table E Selected Contextual Factors: Intercorrelations
White Black Hispanic
Women 5.1 8.3 5.1
Men 8.6 13.6 10.3
Table D Prevalence Rates by Gender and Ethnicity (percent)

We gratefully acknowledge funding support by the Entrepreneurial Research Consortium, the National Science Foundationunder Grant No. 9809841 (Nancy M. Carter, Principal Investigator) and Grant No. 9905255 (Patricia G. Greene, PrincipalInvestigator), and the Ewing Marion Kauffman Foundation. Any opinions, findings, and conclusions or recommendationsexpressed in this material are those of the authors and do not necessarily reflect the views of the National Science Foundation.
50

4801 ROCKHILL ROAD
KANSAS CITY, MISSOURI 64110
WWW.ENTREWORLD.ORG9/025M
This report also made possible by the following organizations:
This Report Sponsored by the Ewing Marion Kauffman Foundation
The Ewing Marion Kauffman Foundation and its partners look beyond need toidentify and develop pivotal opportunities to improve the education of children
and the creation of successful businesses in Kansas City and nationwide.Established in the mid-1960s by the late entrepreneur and philanthropist EwingMarion Kauffman, the Kauffman Foundation works to advance entrepreneurship
by reaching individuals of all ages through two focus areas: the delivery ofentrepreneurship education and development, and the promotion of anentrepreneurial environment. For more information about the Kauffman
Foundation, visit www.emkf.org.
For additional copies, contactwww.entreworld.org/psed2002
888-777-GROW (4769)
Babson College in Wellesley, Mass., recognized internationally as a leader in entrepreneurial managementeducation, grants BS, MBA and custom MS degrees through its Undergraduate Program and the F.W. OlinGraduate School of Business at Babson College, and offers executive development programs to experiencedmanagers worldwide through the Babson School of Executive Education. The College’s for-profit venture,Babson Interactive LLC, develops distance learning programs and business simulations for executives andgraduate students. More information about Babson is available at www.babson.edu.
The Henry W. Bloch School of Business and Public Administration supports the mission of the University of Missouri-Kansas City and provides high quality professional education for a changing world. The schooloffers undergraduate, graduate, executive, and other outreach programs, responsive to business andcommunity needs. These programs are delivered through a curriculum combining a solid preparation inbasic management functions with the skills of leadership, entrepreneurship, strategic decision-making, and an understanding of the technological and global environment. The school’s faculty is committed to teaching, scholarship, and service, and to continuously improving a learning environment that bringsdiscipline to the real-world challenges of management practice.
USC's Marshall School of Business provides the foundation for a process of lifetime learning and businesspractice. Both U.S. News & World Report and Business Week rank Marshall's programs among the top 25.For more than 80 years, Marshall has provided world-class research and scholarship, preparing students forthe future of business. Marshall with its many research centers and Leventhal School of Accounting focuseson a core set of skills and on strengthening its position as a global center of business education andresearch at the graduate, undergraduate and executive levels.
The University of St. Thomas, founded in 1885 by Archbishop John Ireland, is a Catholic,independent, liberal arts, archdiocesan university that emphasizes values-centered, career-oriented education. With more than 11,500 students and campuses in St. Paul, Minneapolis,Owatonna and Rome, Italy, St. Thomas is Minnesota’s largest independent college or university.Coeducational at the undergraduate level since 1977, St. Thomas welcomes students of all agesand nationalities and from all religious, racial, ethnic and financial backgrounds.