the enigmatic young, low-ma ss variable twa 30
TRANSCRIPT
THE ENIGMATIC YOUNG, LOW-MASS VARIABLE TWA 30
The MIT Faculty has made this article openly available. Please share how this access benefits you. Your story matters.
Citation Looper, Dagny L., Subhanjoy Mohanty, John J. Bochanski, Adam J.Burgasser, Eric E. Mamajek, Gregory J. Herczeg, Andrew A. West,et al. “THE ENIGMATIC YOUNG, LOW-MASS VARIABLE TWA 30.” TheAstrophysical Journal 714, no. 1 (May 1, 2010): 45–67.
As Published http://dx.doi.org/10.1088/0004-637x/714/1/45
Version Author's final manuscript
Citable link http://hdl.handle.net/1721.1/88265
Terms of Use Creative Commons Attribution-Noncommercial-Share Alike
Detailed Terms http://creativecommons.org/licenses/by-nc-sa/4.0/

arX
iv:1
003.
3447
v2 [
astr
o-ph
.GA
] 19
Mar
201
0
Accepted to ApJ 2010 Feb 9
The Enigmatic Young Low-Mass Variable TWA 301
Dagny L. Looper2,3, Subhanjoy Mohanty4, John J. Bochanski5, Adam J. Burgasser3,5,6, Eric E.
Mamajek7, Gregory J. Herczeg8, Andrew A. West9, Jacqueline K. Faherty3,10,11, John Rayner2,3,
Mark A. Pitts2,3, J. Davy Kirkpatrick12
ABSTRACT
TWA 30 is a remarkable young (7 ± 3 Myr), low-mass (0.12 ± 0.04 M⊙), late-type
star (M5 ± 1) residing 42 ± 2 pc away from the sun in the TW Hydrae Association. It
shows strong outflow spectral signatures such as [S II], [O I], [O II], [O III], and Mg I],
while exhibiting weak Hα emission (−6.8 ± 1.2 A). Emission lines of [S II] and [O I] are
common to T Tauri stars still residing in their natal molecular clouds, while [O III] and
Mg I] emission lines are incredibly rare in this same population; in the case of TWA
30, these latter lines may arise from new outflow material colliding into older outflow
1This paper includes data gathered with the 6.5-m Magellan Telescopes located at Las Campanas Observatory,
Chile.
2Institute for Astronomy, University of Hawai’i, 2680 Woodlawn Dr, Honolulu, HI 96822, USA;
3Visiting Astronomer at the Infrared Telescope Facility, which is operated by the University of Hawaii under
Cooperative Agreement no. NCC 5-538 with the National Aeronautics and Space Administration, Office of Space
Science, Planetary Astronomy Program
4Imperial College London, 1010 Blackett Lab., Prince Consort Road, London SW7 2AZ, UK
5MIT Kavli Institute for Astrophysics & Space Research, 77 Massachusetts Ave, Building 37-664B, Cambridge,
MA 02139, USA
6Center for Astrophysics and Space Science, University of California San Diego, 9500 Gilman Drive, Mail Code
0424, La Jolla, CA 92093, USA
7Department of Physics and Astronomy, University of Rochester, P.O. Box 270171; 500 Wilson Boulevard,
Rochester, NY 14627-0171, USA
8Max-Planck-Institut fr extraterrestriche Physik, Giessenbachstrae, 85748 Garching, Germany
9Department of Astronomy, Boston University, 725 Commonwealth Ave, Boston, MA 02215, USA
10Department of Physics and Astronomy, Stony Brook University, Stony Brook, NY 11794-3800, USA
11Department of Astrophysics, American Museum of Natural History, Central Park West at 79th Street, New York,
NY 10034, USA
12Infrared Processing and Analysis Center, MS 100-22, California Institute of Technology, Pasadena, CA 91125,
USA
– 2 –
fronts. The weak Hα emission and small radial velocity shifts of line emission relative
to the stellar frame of rest (generally .10 km s−1) suggest that the disk is viewed close
to edge-on and that the stellar axis may be inclined to the disk, similar to the AA Tau
system, based on its temporal changes in emission/absorption line strengths/profiles
and variable reddening (AV = 1.5–9.0). The strong Li absorption (0.61 ± 0.13 A) and
common kinematics with members of the TWA confirm its age and membership to
the association. Given the properties of this system such as its proximity, low mass,
remarkable outflow signatures, variability, and edge-on configuration, this system is a
unique case study at a critical time in disk evolution and planet-building processes.
Subject headings: Galaxy: open clusters and associations: individual (TW Hydrae
Association) – stars: circumstellar matter, stars: pre-main-sequence – stars: evolution
– stars: individual (2MASS J11321831−3019518, TWA 30) – stars: low-mass, brown
dwarfs
1. Introduction
Over the past 30 years, a universal but complex paradigm of star formation has been developed
through many observations and theoretical breakthroughs (e.g., Shu et al. 1987; Hartmann 1998).
Briefly, the stellar birth process begins with the gravitational collapse of material within giant
molecular cloud complexes (Class 0 objects; Adams et al. 1987) and progresses as the embedded
protostar accretes material from an enshrouding infall envelope (Class I), with this transition lasting
∼200 kyr (Enoch et al. 2008). As the gas clears, the revealed protostar continues to accrete from
a circumstellar disk of material (Class II, Classical T Tauri stars, cTTS; Appenzeller & Mundt
1989). By ∼10 Myr, accretion ceases (Fedele et al. 2009; Wyatt et al. 2003), and the object is now
a pre–main sequence star, possibly with a debris disk (Class III and later) capable of assembling
terrestrial planets over timescales of 10–100 Myr (Chambers 2004). This process from cloud core
to pre–main sequence star is marked by a wide array of dynamic phenomena, including outflows
and accretion.
Recent evidence suggests that the accretion processes at work in Class II systems oper-
ate in the regime of very low-mass stars and brown dwarfs as well (e.g., White & Basri 2003;
Mohanty et al. 2005). Accretion rates scale roughly as M ∼ M2 (Muzerolle et al. 2003; Natta et al.
2004; Calvet et al. 2004; Mohanty et al. 2005; Alexander & Armitage 2006), meaning lower mass
systems should display weaker signatures of accretion. Forbidden emission lines (FELs) in opti-
cal spectra, arising from low-density optically thin gas, have been used to identify a handful of
outflows originating from very low-mass stars and brown dwarfs (e.g., Fernandez & Comeron 2001;
Muzerolle et al. 2003; Luhman 2004; Mohanty et al. 2005). Only five young brown dwarfs have had
their outflows spatially resolved – three optical jets (via spectroastrometry; Whelan et al. 2005,
2007, 2009) and two molecular outflows (via direct imaging; Phan-Bao et al. 2008; Bourke et al.
– 3 –
2005). Identification of such systems is hampered not only by their intrinsic faintness but also
by the distances (d > 120 pc) to the nearest star-forming regions (e.g., Sco-Cen, Taurus, Orion),
making it difficult to resolve structure on the scales of disks (∼10–100 AU) and jets (a few hundred
AU). Hence, progress in understanding the size, morphology, and energetics of jets powered by very
low-mass stars and brown dwarfs is limited.
Fortunately, the recent identification of new low-mass members of the nearby TW Hydrae
Association (TWA) may provide more ideal systems for studies of disk and jet structures in
this mass regime. Indeed, one of the three brown dwarfs with a resolved optical jet, 2MASSW
J1207334−393254 (2M1207AB, also known as TWA 27AB; Gizis 2002; Chauvin et al. 2004), is a
member of the TWA. The namesake of the TWA, TW Hydrae, was the first cTTS found in isola-
tion (Henize 1976) – located only 54 ± 6 pc from the Sun (van Leeuwen 2007), 23 degrees above
the Galactic Plane and far from any molecular cloud (Herbig 1978; Rucinski & Krautter 1983;
Tachihara et al. 2009). More than a decade after the discovery of TW Hydrae, de la Reza et al.
(1989) and Gregorio-Hetem et al. (1992) found four more T Tauri stars in the same vicinity by using
the IRAS Point Source Catalog and targeting stars with infrared excess. Based on their common
X-ray activity, Kastner et al. (1997) postulated that these five objects formed a physical association
of young stars, which they termed the TW Hydrae Association. Soon after, targeted surveys using
ROSAT All-Sky Survey (RASS) data (Sterzik et al. 1999; Webb et al. 1999; Zuckerman et al. 2001),
kinematic surveys (Song et al. 2003; Scholz et al. 2005), and photometric near-infrared (NIR) sur-
veys (Gizis 2002; Looper et al. 2007) discovered several more members, bringing the total to 23
confirmed systems (Mamajek 2005), of which five contain brown dwarfs.
These systems share similar kinematics and indicators of youth such as strong chromospheric
activity and, for late-K to M type members, Li I λ6708 absorption. Isochronal ages derived from the
Hertzsprung-Russell diagram yield age estimates of ∼8 Myr for the TWA (Soderblom et al. 1998;
Webb et al. 1999; Weintraub et al. 2000; Barrado y Navascues 2006). At an average distance of 53
pc (Mamajek, in preparation), the TWA is the nearest association containing actively accreting
young stars1, making it an attractive target for studying planet formation and the evolution of
circumstellar disks. Moreover, members of the TWA span a range of disk evolutionary stages, with
some members showing signs of actively accreting disks, passive/non-accreting disks, or debris
disks, while other members show no signs of circumstellar material (e.g., Jayawardhana et al.
1999; Low et al. 2005).
We have undertaken a survey to identify additional low-mass members to the TWA, which could
provide important new case studies of accretion and outflow in substellar-mass objects residing at
close distances (∼50 pc). In this paper, we report the discovery of a new, low-mass member of the
TWA, 2MASS J11321831−3019518, which we term TWA 30. Its membership is confirmed by its
kinematics, Li I λ6708 absorption strength, and signatures of a low-gravity photosphere. TWA 30
1Although, a recently identified young brown dwarf, 2MASS J0041353−562112, shows signs of accretion and may
be a possible β Pic or Tuc-Hor member, placing it at ∼35–50 pc (Reiners 2009).
– 4 –
has strong forbidden lines of [O I], [O II] and [S II] within 30 km s−1 of the stellar rest velocity,
possibly indicating an outflow from a nearly edge-on system. The presence of [O III] and Mg I]
in the spectrum of TWA 30 are extremely rare for a cTTS and have not been observed before
in a young system residing outside of its natal molecular cloud. The fluctuating continua levels
from both the optical and the NIR spectra suggest that they may be affected by highly variable
reddening on timescales of a day to several weeks. In § 2, we describe the discovery and observations
of TWA 30; in § 3, we analyze the kinematics, spectral morphology, emission/absorption lines, X-
ray activity, and estimate an age and mass of TWA 30; in § 4, we discuss evidence for this system
having an inclined stellar axis to an edge-on disk and update the disk fraction of the TWA; finally
in §5, we give our conclusions.
2. Observations
2.1. Discovery
We searched for new members of the TWA that appear in the RASS X-ray Faint Source
Catalog (Voges et al. 2000) over the right ascension (RA) range 10h.5 − 12h.5 and declination
(DEC) range −25◦ to −40◦, with magnitudes of 7.5 < J < 10 in the Two Micron All-Sky Survey
(2MASS) Point Source Catalog (PSC; Cutri et al. 2003; Skrutskie et al. 2006). Previous searches
of RASS data for TWA members (Webb et al. 1999; Zuckerman et al. 2001) have relied on the
X-ray Bright Source Catalog (Voges et al. 1999), with the exception of the study by Sterzik et al.
(1999), which examined faint sources in RASS data over a much smaller field of view than our
survey. We identified TWA 30 in our sample as a faint X-ray source (1RXS J113217.7−302007)
with (2.47 ± 0.96) × 10−2 counts s−1, J = 9.64, and J − Ks = 0.88. TWA 30 is located in the
southwest region of the TWA (a finder chart for it is shown in Figure 1). Further details of our
search methodology, spurious candidates, and other new members will be reported in a forthcoming
paper.
This source was independently identified by Song et al. (2003) as SSS 113218−3019 on the
basis of unpublished optical spectral data. They deduced that it is distant (>100 pc), and hence
likely a member of the Lower Centaurus-Crux region. In the following sections we show evidence
that it is nearby and a member of the TWA.
2.2. Optical Spectroscopic Data
2.2.1. MagE Spectroscopy
TWA 30 was observed nine times with the Magellan Echellete (MagE; Marshall et al. 2008)
on the 6.5 m Clay Telescope at Las Campanas Observatory. The details of each observation are
recorded in Table 1. MagE is a medium resolution, cross–dispersed echellette, covering the optical
– 5 –
regime from 3,000 to 10,500 A. The 0.′′7 slit was employed for each observation, corresponding to
R ≡ λ / ∆λ ≈ 4100 with no binning. A flux standard was observed during each run, and ThAr arc
calibration images were obtained after each science exposure. The spectrum was reduced with the
MASE reduction tool pipeline (Bochanski et al. 2009). Briefly, MASE is written in the Interactive
Data Language (IDL) and incorporates the entire reduction and calibration process, including bias
subtraction, flat fielding, wavelength and flux calibration. Typical wavelength solutions are accurate
to ∼5–7 km s−1. The reduced spectrum from 2009 Jan 10 UT is shown in Figures 2, 3, and 4.
Three of the spectra were taken on the same night (2008 Nov 26 UT) in sequential exposures and
are identical to one another; we show the first spectrum of this series and the other six spectra
from different epochs in Figure 5.
2.2.2. MIKE Spectroscopy
High resolution spectroscopy was obtained with the Magellan Inamori Kyocera Echelle (MIKE;
Bernstein et al. 2003) on 2008 Nov 27 UT. TWA 30 was observed with the red camera and the 0.′′7
slit, with coverage from 4,900 to 9,200 A and R ∼ 24,000. Binning was set at 2 × 2. ThAr arcs
were obtained after the science exposure, and a flux standard was observed during the night for
relative flux calibration. The spectrum was reduced using the MIKE IDL pipeline2, producing a
calibrated 1D spectrum with wavelength solutions accurate to ∼1–2 km s−1.
2.3. NIR Spectroscopic Data
We observed TWA 30 eleven times with the SpeX spectrograph (Rayner et al. 2003) on the
3.0 m NASA Infrared Telescope Facility (IRTF) in three modes with the 0.′′5 slit: short cross-
dispersed (SXD: 0.8–2.4 µm; R ∼ 1200), long cross-dispersed (LXD: 1.9–4.2 µm; R ∼1500), and
prism (0.7–2.5; R ∼ 150). Details of these observations are listed in Table 1. Observations of a
nearby A0 V star for telluric correction were made immediately after each observation along with
internal flat-field and argon arc lamp frames for calibrations. Reductions were carried out using
the Spextool package version 3.4 (Cushing et al. 2004; Vacca et al. 2003). The LXD data were first
combined at each nod position; reductions using the Spextool package were otherwise standard.
2.4. Imaging
We observed TWA 30 at the Cerro Tololo 4.0 m Blanco telescope on 2008 Dec 13 UT as
part of an ongoing brown dwarf astrometric program. The Infrared Side Port Imager (ISPI;
2The pipeline is available at http://web.mit.edu/˜burles/www/MIKE/.
– 6 –
van der Bliek et al. 2004) was used along with the J-band filter. The detector has a ∼10 ar-
cmin field of view with a 0.′′3 pixel plate scale. Three images of 10 s exposures using 3 co-adds
were obtained at each of the three dither positions. Dark frames and domeflats were obtained at
the start of each evening. The raw images were median-combined to produce sky frames, which
were then subtracted from the raw data. The subsequent reduction procedures were based on the
prescriptions put together by the ISPI team3, utilizing a combination of IRAF routines as well as
publicly available software packages: WCSTOOLS and SWARP. Each image was flat-fielded, cor-
rected for bad pixels, and flipped to orient N up and E to the left using the IRAF routine osiris in
the cirred package. Individual point sources were selected in each image using the IDL routine find
and then input into the WCSTOOLS task imwcs , which matches stars to the 2MASS PSC. Once
an initial world coordinate system (WCS) was set, we used the IRAF routine ccmap to correct for
the distortion prominent across the ISPI detector. The final WCS residuals against 2MASS were
∼0.1 pixels in both the X and Y axes. We used the software package swarp to shift and add the
3 reduced dither positions and then used this final science frame to perform the astrometry. Final
RA, DEC coordinate positions of 11h 32m 18.19s, −30◦ 19′ 51.8′′ (equinox J2000) were determined
using the IRAF routine wcstran , which combines the standard WCS parameters with the higher
order distortion corrections calculated with ccmap.
3. Analysis
3.1. Kinematics
TWA 30 has proper motion estimates in the USNO-B1.0 catalog (Monet et al. 2003) and the
SSS catalog (Hambly et al. 2001a,b,c) of µα, µδ of −86 ± 5, −24 ± 11 and −81 ± 9, −28 ± 9
mas yr−1, respectively. It is also listed in the UCAC3 catalog (Finch et al. 2010) as 3UCAC 120-
147008 with a proper motion of µα, µδ of −89.6 ± 1.3, −25.8 ± 1.3 mas yr−1. We adopt this latter
measurement, which has the smallest errors, as the proper motion for TWA 30.
We determined the radial velocity (RV) of TWA 30 by measuring the line centers of Hα and
photospheric absorption lines in the MIKE spectrum (Li I λ6708, K I λ7699, and Na I λ8183)4,
yielding a heliocentric RV of 12.3 ± 1.5 kms−1 (Table 2). The uncertainty was calculated as the
1σ standard deviation in the measurements. To examine the RV variation over time, we calculated
RVs from the nine lower resolution MagE spectra by cross-correlating each spectrum with the M6
SDSS template from Bochanski et al. (2007) using the xcorl package in IDL (Mohanty & Basri
2003; West & Basri 2009). Our analysis included the wavelength region from 6600 A to 7200 A
that encompasses the TiO molecular bandhead that begins at 7056 A. We also calculated the
3See http://www.ctio.noao.edu/instruments/ir instruments/ispi/.
4We follow the convention of referring to lines in the optical regime at their rest velocity in air and round to the
nearest integer.
– 7 –
relative radial velocities by cross-correlating each MagE spectrum with the first spectrum taken
chronologically on 2008 Nov 26 UT. These RV values indicate a relative uncertainty of ∼2–3 km s−1.
They are consistent with each other except for the spectrum taken on 2009 March 4 UT (and
possibly 2009 May 31 UT), which shows a statistically smaller radial velocity than observed at
other epochs (see Table 3).
Since no parallax measurement of TWA 30 is available, we used the convergent point analysis
of Mamajek (2005) to estimate its distance. For these calculations, we adopt the mean velocity
of the TWA from Mamajek, in preparation based on revised Hipparcos astrometry (van Leeuwen
2007) for TWA 1, 4, and 11, as well as the recent ground-based astrometric analyses of 2M1207AB
(TWA 27AB; Gizis et al. 2007; Biller & Close 2007; Ducourant et al. 2008). The adopted TWA
velocity is (U, V, W ) = (−10.2, −18.3, −4.9) km s−1, with uncertainties of ± 0.5 km s−1 in each
component. The intrinsic 1D velocity dispersion in the TWA is approximately 0.8 kms−1 (Mamajek
2005).
Most of the proper motion of TWA 30 is moving towards the TWA convergent point with
near zero peculiar motion (1.2 km s−1), a strong indication of membership. The proper motion of
TWA 30 towards the convergent point is consistent with a cluster parallax of 23.8± 1.2 mas or a
distance of 42± 2 pc. This is much closer than the >100 pc spectrophotometric distance quoted by
Song et al. (2003). Given the highly variable nature of this object (see §3.2 & §3.3), the kinematic
distance is more reliable. The mean distance to TWA members is 53 pc (Mamajek, in preparation),
with individual members having distances between ∼ 20− 80 pc.
We conclude that both the radial velocity and proper motion are statistically consistent with
TWA 30 being a TWAmember. Using the stated distance estimate, we derive the inferred tangential
velocity and the (U,V,W ) space motion for TWA 30 with respect to the Sun (see Table 2). For
the latter we used the procedure of Johnson & Soderblom (1987) with updated galactic coordinate
transformations from Murray (1989) and followed the convention that U is positive towards the
Galactic Center (l=0,b=0).
3.2. Optical Spectroscopy
3.2.1. Spectral Morphology
We spectroscopically classified and determined the Av of each epoch of optical data from
comparison to M3–M5.75 η Cha templates (Luhman & Steeghs 2004). This association has a similar
age (∼7 Myr; Mamajek et al. 1999; Lawson et al. 2001) to the TWA and should therefore provide
a better continuum fit with comparable surface gravities than would comparison to field templates,
which have higher surface gravities. These templates are: η Cha 6 (M3), η Cha 12 (M3.25), η Cha
5 (M4), η Cha 9 (M4.5), η Cha 14 (M4.75), η Cha 17 (M5.25), η Cha 18 (M5.5), and η Cha 16
(M5.75). Both template and data were normalized at 7500 A, which was chosen as a normalization

– 8 –
point due to the small amount of absorption at this wavelength (Kirkpatrick et al. 1991). Then the
data were dereddened by increments of Av=0.1 using the reddening law of Cardelli et al. (1989)
(updated in the near-UV by O’Donnell 1994) to provide the best match to the template spectrum
over the wavelength range 6000–8000 A. We set the ratio of total-to-selective extinction RV ≡ AV /
E(B−V) to 3.1 (the standard for the ISM), although large grain sizes would have higher RV values
(e.g., Weingartner & Draine 2001). The spectral features over this regime cover many broadband
features typically used to classify M dwarfs such as TiO, VO, and CrH (Kirkpatrick et al. 1991).
The best fit to the continuum, by eye, was then chosen, which simultaneously determined the
spectral type and Av.
The optimal fit of each epoch is overlaid in Figure 6. The spectral type fits of the seven epochs
varied between M4 and M5.25, which span timescales of hours to weeks between epochs. The three
spectra obtained on 2008 Nov 26 UT have a best fit to the M4.75 template, the spectrum obtained
on 2008 Nov 27 UT has a best fit to an M4.5 template; the 2009 Jan 6, 10, and 11 UT spectra have
a best fit to an M4 template; and the 2009 Mar 5 and 2009 May 31 UT have a best fit to an M5.25
template. We discuss the possible underlying cause for these changes in spectral type, M4–M5.25,
in §4.2.
3.2.2. Emission and Absorption Lines
The alkali line strengths of Na I and K I, which are sensitive indicators of surface gravity
(Luhman 1999; Martın et al. 1999; Kirkpatrick et al. 2006; Cruz et al. 2009), are weaker in all of
the optical spectra of TWA 30 than in the template dwarf spectra, indicating that this object has a
lower surface gravity and is therefore younger than field dwarfs of similar spectral type. However,
K I λ7699 goes into emission in the 2009 Jan epochs, introducing some uncertainty in using it as
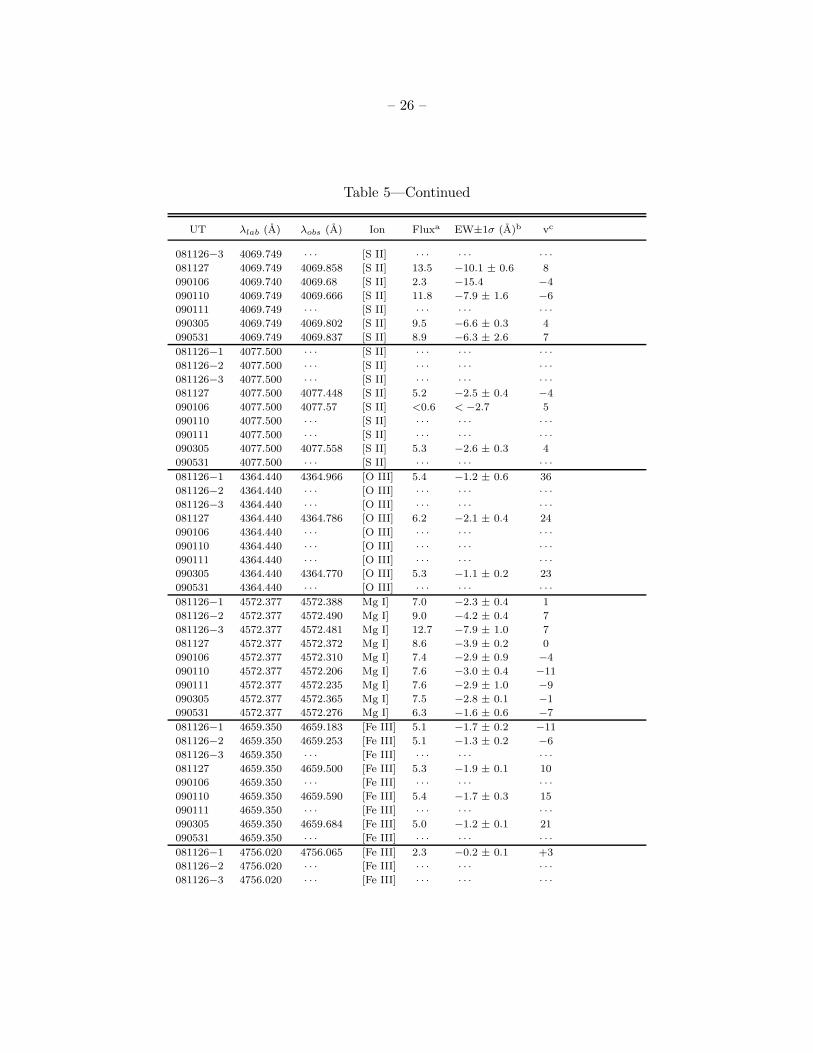
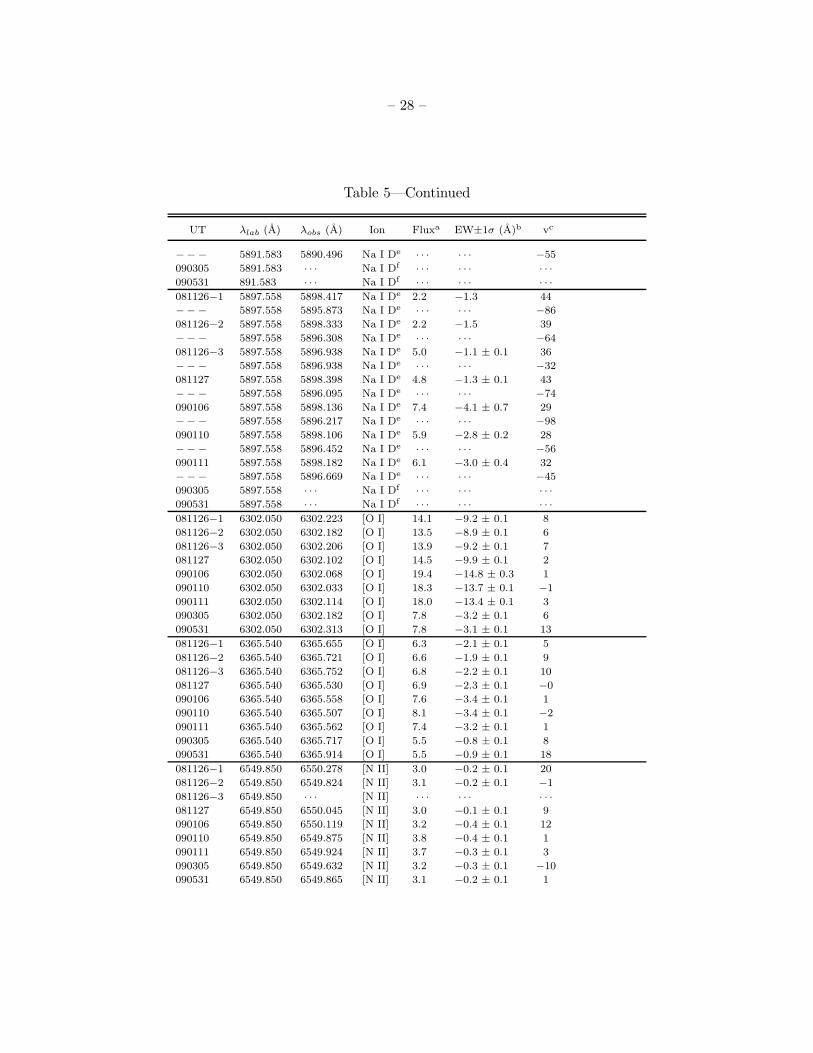
a low gravity indicator. We measured the equivalent widths (EW) of these lines along with many
permitted and forbidden emission features5 over our seven epochs of MagE data and report these
in Tables 4, 5, and 6 and show them in Figures 2, 3, and 4.
We report the average over all nights of the Li I absorption and the Hα emission EW, as
these are indicators of age and accretion/chromospheric activity, respectively. The prominent
Balmer emission lines are a sign of youth in low–mass stars (West et al. 2008, and references
therein). Furthermore, Li is fully depleted within ∼100 Myr for stars later than spectral type mid-
K (Zuckerman & Song 2004), placing an upper limit on the age of TWA 30. It should be noted
that for substellar objects with M < 0.059–0.062 M⊙, their core temperatures never become hot
enough to destroy Li (Nelson et al. 1993). The Li EW of TWA 30 (0.61 ± 0.13 A) is comparable
to other TWA M dwarf members (0.40 to 0.65 A) and stronger than β Pic M dwarf members (Li
5These lines were identified using the Atomic Line List v2.04 maintained at
http://www.pa.uky.edu/∼peter/atomic/ and from Kaminski et al. (2009) and references there-in.
– 9 –
EW < 0.4 A, age ∼12 Myr; Zuckerman & Song 2004).
The FELs of [O I] and [S II] identified in Figures 2 and 3 are present in the spectra of many
cTTS and are signs of an outflow and accretion (Muzerolle et al. 2003). These lines are typically
associated with [N II] emission, which is only weakly present at 6548 and 6583 A. We have also
identified the high ionization species [O III] and [Fe III], which typically arise in planetary nebulae
or winds from the most massive stars. They are rarely seen in cTTS but are detected in the two
high accretion rate cTTS: DG Tau (K5, Hartigan et al. 1995; Raga et al. 1996) and XZ Tau B
(M1, White & Ghez 2001). The emission of the high-excitation [OIII] line requires extremely high
temperatures and low densities, indicative of collisional shock fronts – e.g., bow shocks formed by
the jet running into the surrounding ambient medium (Schwartz 1983; Hartigan 1989; Bohm 1995;
Raga et al. 1996). Given the general lack of ISM gas in TWA (Tachihara et al. 2009), this medium
may consist of older outflow material from TWA 30, which is overtaken and shocked by the fast
moving jet.
Similarly, Mg I] λ4571 is clearly present in our spectra but is rarely seen in the spectra of cTTS.
Ercolano et al. (2008) have predicted the presence of Mg I] arising from gas in a circumstellar disk
but noted that the detection may be difficult due to the strong continuum at these wavelengths.
Mg I] has previously been detected in XZ Tau B (White & Ghez 2001) and the EXor pre-main
sequence star VY Tauri (M0; Herbig 1990), which resides in the Taurus-Auriga Cloud.
While TWA 30 has many strong spectral signatures indicating a strong outflow and hence an
actively accreting circumstellar disk, it lacks any detectable He I emission at 4471, 6678, and 7065 A
and has weak emission at 5876 A (see Table 5). He I emission lines are seen in the accreting M4.75–
M8 Taurus members in the sample of Herczeg & Hillenbrand (2008) and in the accreting late-M
TWA members TWA 27AB (2M1207AB) and TWA 28 (Herczeg et al. 2009). He I is only weakly
present in the accreting late-K TWA member TWA 1 and the early-M TWA 3A (Herczeg et al.
2009). He I emission in cTTS is thought to arise both in the infalling funnel flow (broad component)
and in the accretion shock region on the stellar surface (narrow component). We propose a scenario
for the absence/weakness of the He I lines in our spectra in §4.2.
We have also examined the radial velocity profiles of several FELs, Balmer lines, and absorption
features of our MagE spectra (see Figure 7). These profiles have been corrected for the star’s rest
velocity (12.3 km s−1) and normalized to the continuum at −250 km s−1. Of note, the K I λ7699
line goes from absorption into emission for the three 2009 Jan epochs. A very weak P Cygni profile
is seen in the profile of Hα at the 2009 Mar epoch. While all seven epochs of data show Na I D
λ5890, 5896 in emission, the last two epochs of data, 2009 Mar 5 and 2009 May 31 UT, have sharp
P Cygni profiles in this feature as well, indicating that we are seeing outflowing winds along the
line of sight.
– 10 –
3.3. NIR Spectroscopy
3.3.1. Spectral Morphology and Reddening
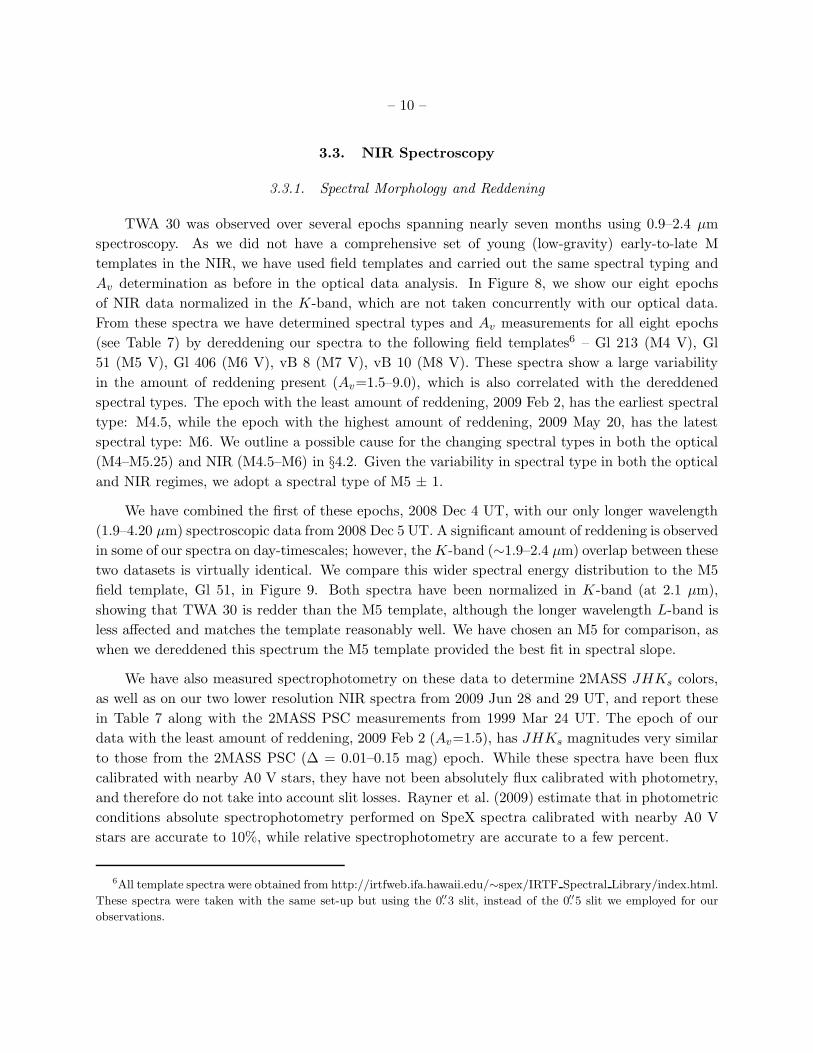
TWA 30 was observed over several epochs spanning nearly seven months using 0.9–2.4 µm
spectroscopy. As we did not have a comprehensive set of young (low-gravity) early-to-late M
templates in the NIR, we have used field templates and carried out the same spectral typing and
Av determination as before in the optical data analysis. In Figure 8, we show our eight epochs
of NIR data normalized in the K-band, which are not taken concurrently with our optical data.
From these spectra we have determined spectral types and Av measurements for all eight epochs
(see Table 7) by dereddening our spectra to the following field templates6 – Gl 213 (M4 V), Gl
51 (M5 V), Gl 406 (M6 V), vB 8 (M7 V), vB 10 (M8 V). These spectra show a large variability
in the amount of reddening present (Av=1.5–9.0), which is also correlated with the dereddened
spectral types. The epoch with the least amount of reddening, 2009 Feb 2, has the earliest spectral
type: M4.5, while the epoch with the highest amount of reddening, 2009 May 20, has the latest
spectral type: M6. We outline a possible cause for the changing spectral types in both the optical
(M4–M5.25) and NIR (M4.5–M6) in §4.2. Given the variability in spectral type in both the optical
and NIR regimes, we adopt a spectral type of M5 ± 1.
We have combined the first of these epochs, 2008 Dec 4 UT, with our only longer wavelength
(1.9–4.20 µm) spectroscopic data from 2008 Dec 5 UT. A significant amount of reddening is observed
in some of our spectra on day-timescales; however, theK-band (∼1.9–2.4 µm) overlap between these
two datasets is virtually identical. We compare this wider spectral energy distribution to the M5
field template, Gl 51, in Figure 9. Both spectra have been normalized in K-band (at 2.1 µm),
showing that TWA 30 is redder than the M5 template, although the longer wavelength L-band is
less affected and matches the template reasonably well. We have chosen an M5 for comparison, as
when we dereddened this spectrum the M5 template provided the best fit in spectral slope.
We have also measured spectrophotometry on these data to determine 2MASS JHKs colors,
as well as on our two lower resolution NIR spectra from 2009 Jun 28 and 29 UT, and report these
in Table 7 along with the 2MASS PSC measurements from 1999 Mar 24 UT. The epoch of our
data with the least amount of reddening, 2009 Feb 2 (Av=1.5), has JHKs magnitudes very similar
to those from the 2MASS PSC (∆ = 0.01–0.15 mag) epoch. While these spectra have been flux
calibrated with nearby A0 V stars, they have not been absolutely flux calibrated with photometry,
and therefore do not take into account slit losses. Rayner et al. (2009) estimate that in photometric
conditions absolute spectrophotometry performed on SpeX spectra calibrated with nearby A0 V
stars are accurate to 10%, while relative spectrophotometry are accurate to a few percent.
6All template spectra were obtained from http://irtfweb.ifa.hawaii.edu/∼spex/IRTF Spectral Library/index.html.
These spectra were taken with the same set-up but using the 0.′′3 slit, instead of the 0.′′5 slit we employed for our
observations.

– 11 –
The colors calculated from these measurements appear to be accurate between our SXD and
prism spectra (Table 7), with identical H −Ks colors and similar J −H (∆ = 0.06 mag) colors.
These values are shown in JHKs color space in Figure 10. Only the 2MASS PSC colors of TWA 30
lie along the dwarf track. All other epochs lie along the reddening vector described by Cardelli et al.
(1989). The sparse coverage of our data shows a full cycle over a six month period, however, the
rapid increase in Av over the period 2009 May 14–20 may indicate that the cycles are much shorter
if this behavior is periodic.
3.3.2. Emission and Absorption Lines
As seen in the optical data, typical surface gravity indicators such as the alkali metal lines, K
I and Na I, are weaker in TWA 30 than in the field M5 template (see Figures 9 and 11). While H
Balmer emission in the optical spectrum of TWA 30 is prevalent, H Paschen (Pa) is in absorption
in the NIR, with the exception of Pa γ, which is seen in emission in our lower resolution SXD data
(see Figure 9). A typical indicator of on-going accretion, H Brackett γ can be seen only weakly in
emission at 2.166 µm in the K-band spectrum of the 2008 Dec 4 UT data and is absent in the 2008
Dec 15 and 2009 Feb 2 UT data (see Figure 11).
3.4. Estimated Mass and Age
To derive the stellar mass and age we have used two estimates of the spectral type: (1) using
the 2MASS colors, which imply a spectral type of ∼M4.5, although this probably includes accretion
continuum excess emission (see §4.2) and (2) using the latest NIR spectral type, M6, which likely
has the least accretion continuum excess (see §4.2), although the spectral type may be slightly too
late due to our use of field templates for the NIR data.
For the first estimate, we assume that the 2MASS data point (Ks=8.77 ± 0.02 mag) has
AV , AK = 0. From the Teff scale7 for cTTS of Luhman et al. (2003), a spectral type of M4.5
gives an effective temperature of 3200 ± 100 K. The bolometric correction in K-band (BCK) from
Golimowski et al. (2004) begins at spectral type M6, yielding BCK = 3.03 ± 0.13 mag for M6 and
BCK = 3.06 ± 0.13 mag for M7. Although M4.5 is earlier than the beginning of this relation,
the change in BCK over 1 spectral type (∆ = 0.03 mag) is small in comparison to the root-mean-
square (RMS) in the uncertainty (0.13 mag). We therefore adopt a value of BCK = 3.0 ± 0.1
mag on the CIT photometric system. Applying the transformation of Carpenter (2001), 2MASS
Ks= CIT K − 0.024 mag, with negligible uncertainties and a color term of zero. Hence, 2MASS
Ks = 8.77 ± 0.02 mag transforms into CIT K = 8.79 ± 0.02 mag. For a distance of 42 ± 2 pc (the
kinematic distance), the distance modulus is 3.12 ± 0.10 mag, yielding CIT MK = 5.67 ± 0.10 mag.
7Luhman & Muench (2008) estimate an uncertainty of ∼100 K in this relation.
– 12 –
Applying the bolometric correction yields Mbol = 8.7 ± 0.1 mag. Adopting the IAU standard of
Mbol,⊙ = 4.75 mag, log Lbol/Lbol,⊙ = −1.58 ± 0.04 dex. With this Teff and Lbol, the evolutionary
models of Baraffe et al. (1998) give an age of 10 Myr and a mass of 0.16 M⊙.
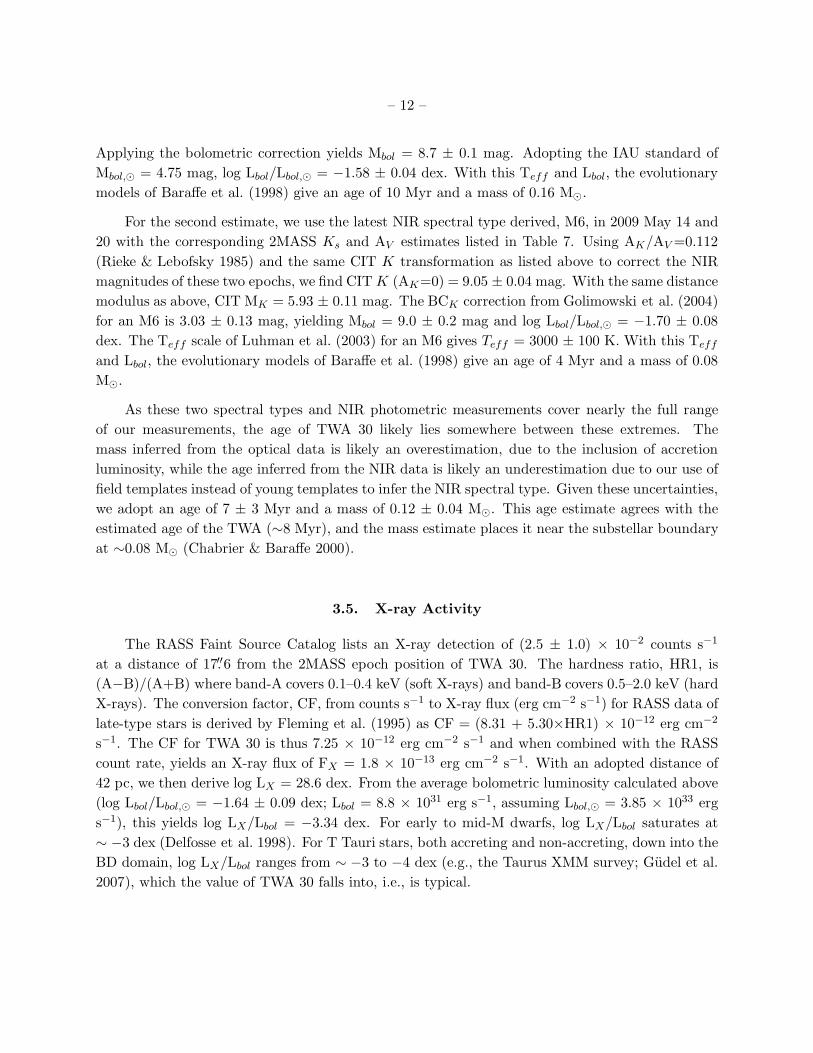
For the second estimate, we use the latest NIR spectral type derived, M6, in 2009 May 14 and
20 with the corresponding 2MASS Ks and AV estimates listed in Table 7. Using AK/AV =0.112
(Rieke & Lebofsky 1985) and the same CIT K transformation as listed above to correct the NIR
magnitudes of these two epochs, we find CITK (AK=0) = 9.05 ± 0.04 mag. With the same distance
modulus as above, CIT MK = 5.93 ± 0.11 mag. The BCK correction from Golimowski et al. (2004)
for an M6 is 3.03 ± 0.13 mag, yielding Mbol = 9.0 ± 0.2 mag and log Lbol/Lbol,⊙ = −1.70 ± 0.08
dex. The Teff scale of Luhman et al. (2003) for an M6 gives Teff = 3000 ± 100 K. With this Teff
and Lbol, the evolutionary models of Baraffe et al. (1998) give an age of 4 Myr and a mass of 0.08
M⊙.
As these two spectral types and NIR photometric measurements cover nearly the full range
of our measurements, the age of TWA 30 likely lies somewhere between these extremes. The
mass inferred from the optical data is likely an overestimation, due to the inclusion of accretion
luminosity, while the age inferred from the NIR data is likely an underestimation due to our use of
field templates instead of young templates to infer the NIR spectral type. Given these uncertainties,
we adopt an age of 7 ± 3 Myr and a mass of 0.12 ± 0.04 M⊙. This age estimate agrees with the
estimated age of the TWA (∼8 Myr), and the mass estimate places it near the substellar boundary
at ∼0.08 M⊙ (Chabrier & Baraffe 2000).
3.5. X-ray Activity
The RASS Faint Source Catalog lists an X-ray detection of (2.5 ± 1.0) × 10−2 counts s−1
at a distance of 17.′′6 from the 2MASS epoch position of TWA 30. The hardness ratio, HR1, is
(A−B)/(A+B) where band-A covers 0.1–0.4 keV (soft X-rays) and band-B covers 0.5–2.0 keV (hard
X-rays). The conversion factor, CF, from counts s−1 to X-ray flux (erg cm−2 s−1) for RASS data of
late-type stars is derived by Fleming et al. (1995) as CF = (8.31 + 5.30×HR1) × 10−12 erg cm−2
s−1. The CF for TWA 30 is thus 7.25 × 10⁻¹² erg cm−2 s−1 and when combined with the RASS
count rate, yields an X-ray flux of FX = 1.8 × 10⁻¹³ erg cm−2 s−1. With an adopted distance of
42 pc, we then derive log LX = 28.6 dex. From the average bolometric luminosity calculated above
(log Lbol/Lbol,⊙ = −1.64 ± 0.09 dex; Lbol = 8.8 × 1031 erg s−1, assuming Lbol,⊙ = 3.85 × 1033 erg
s−1), this yields log LX/Lbol = −3.34 dex. For early to mid-M dwarfs, log LX/Lbol saturates at
∼ −3 dex (Delfosse et al. 1998). For T Tauri stars, both accreting and non-accreting, down into the
BD domain, log LX/Lbol ranges from ∼ −3 to −4 dex (e.g., the Taurus XMM survey; Gudel et al.
2007), which the value of TWA 30 falls into, i.e., is typical.
– 13 –
4. Discussion
4.1. The Disk Fraction of the TWA
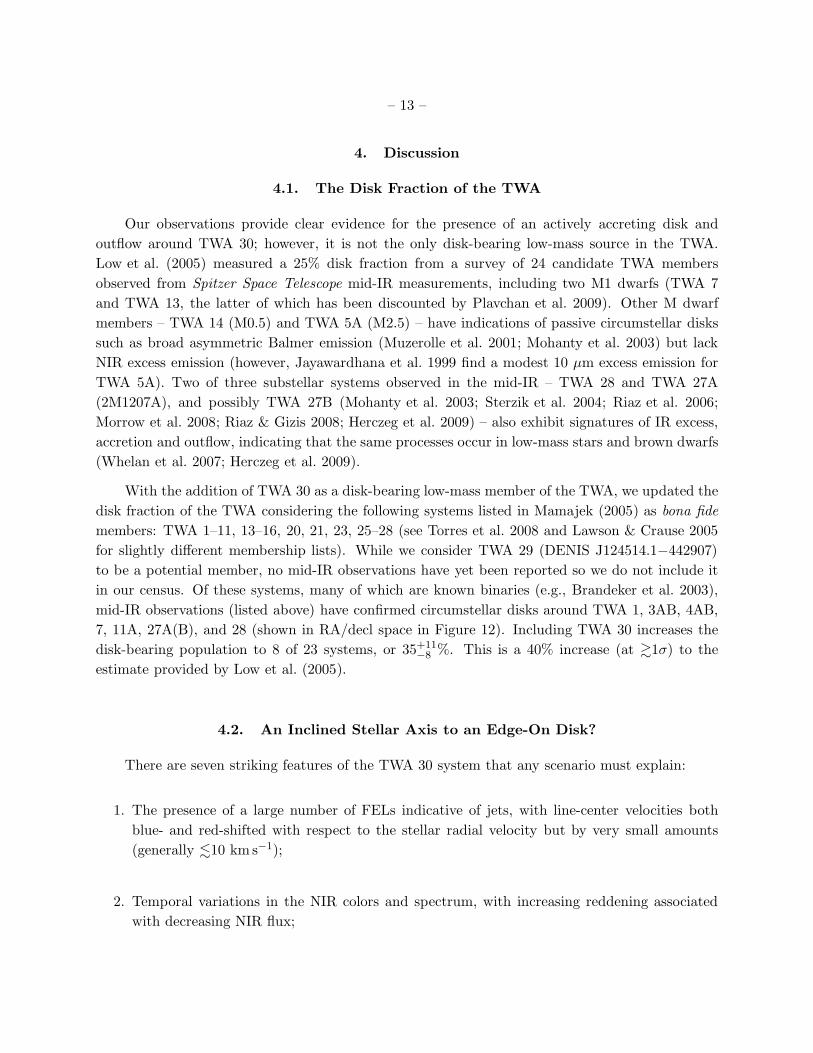
Our observations provide clear evidence for the presence of an actively accreting disk and
outflow around TWA 30; however, it is not the only disk-bearing low-mass source in the TWA.
Low et al. (2005) measured a 25% disk fraction from a survey of 24 candidate TWA members
observed from Spitzer Space Telescope mid-IR measurements, including two M1 dwarfs (TWA 7
and TWA 13, the latter of which has been discounted by Plavchan et al. 2009). Other M dwarf
members – TWA 14 (M0.5) and TWA 5A (M2.5) – have indications of passive circumstellar disks
such as broad asymmetric Balmer emission (Muzerolle et al. 2001; Mohanty et al. 2003) but lack
NIR excess emission (however, Jayawardhana et al. 1999 find a modest 10 µm excess emission for
TWA 5A). Two of three substellar systems observed in the mid-IR – TWA 28 and TWA 27A
(2M1207A), and possibly TWA 27B (Mohanty et al. 2003; Sterzik et al. 2004; Riaz et al. 2006;
Morrow et al. 2008; Riaz & Gizis 2008; Herczeg et al. 2009) – also exhibit signatures of IR excess,
accretion and outflow, indicating that the same processes occur in low-mass stars and brown dwarfs
(Whelan et al. 2007; Herczeg et al. 2009).
With the addition of TWA 30 as a disk-bearing low-mass member of the TWA, we updated the
disk fraction of the TWA considering the following systems listed in Mamajek (2005) as bona fide
members: TWA 1–11, 13–16, 20, 21, 23, 25–28 (see Torres et al. 2008 and Lawson & Crause 2005
for slightly different membership lists). While we consider TWA 29 (DENIS J124514.1−442907)
to be a potential member, no mid-IR observations have yet been reported so we do not include it
in our census. Of these systems, many of which are known binaries (e.g., Brandeker et al. 2003),
mid-IR observations (listed above) have confirmed circumstellar disks around TWA 1, 3AB, 4AB,
7, 11A, 27A(B), and 28 (shown in RA/decl space in Figure 12). Including TWA 30 increases the
disk-bearing population to 8 of 23 systems, or 35+11−8 %. This is a 40% increase (at &1σ) to the
estimate provided by Low et al. (2005).
4.2. An Inclined Stellar Axis to an Edge-On Disk?
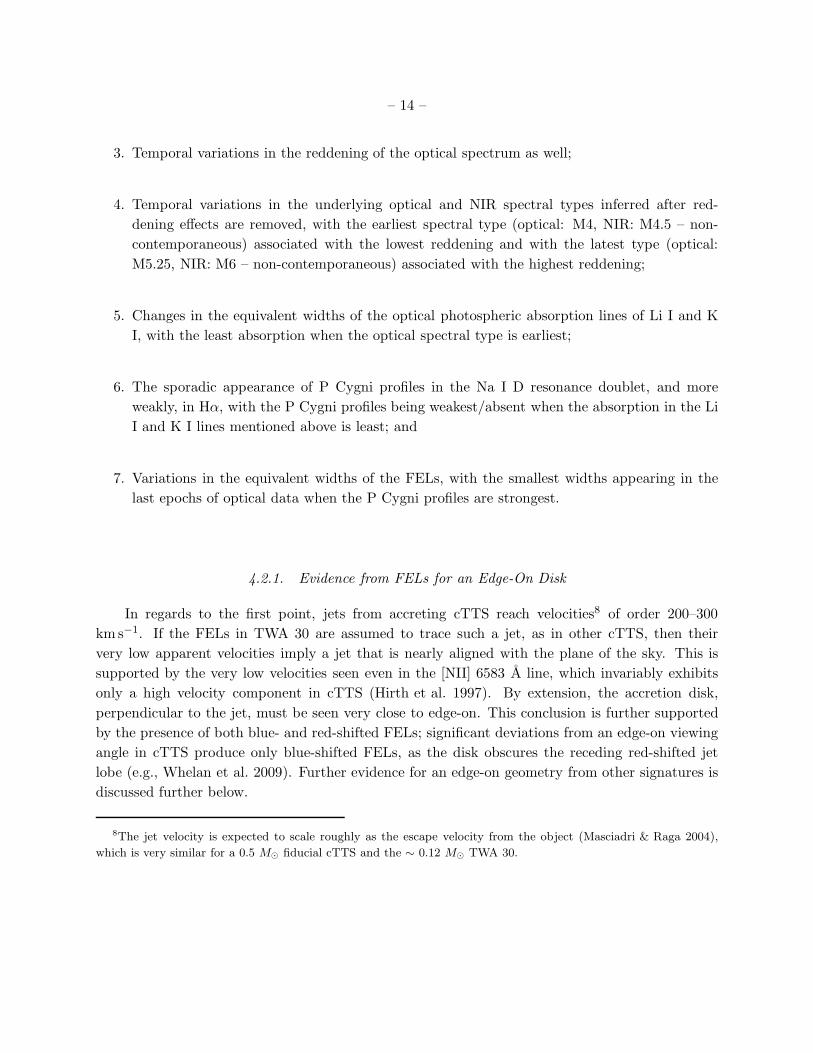
There are seven striking features of the TWA 30 system that any scenario must explain:
1. The presence of a large number of FELs indicative of jets, with line-center velocities both
blue- and red-shifted with respect to the stellar radial velocity but by very small amounts
(generally .10 km s−1);
2. Temporal variations in the NIR colors and spectrum, with increasing reddening associated
with decreasing NIR flux;
– 14 –
3. Temporal variations in the reddening of the optical spectrum as well;
4. Temporal variations in the underlying optical and NIR spectral types inferred after red-
dening effects are removed, with the earliest spectral type (optical: M4, NIR: M4.5 – non-
contemporaneous) associated with the lowest reddening and with the latest type (optical:
M5.25, NIR: M6 – non-contemporaneous) associated with the highest reddening;
5. Changes in the equivalent widths of the optical photospheric absorption lines of Li I and K
I, with the least absorption when the optical spectral type is earliest;
6. The sporadic appearance of P Cygni profiles in the Na I D resonance doublet, and more
weakly, in Hα, with the P Cygni profiles being weakest/absent when the absorption in the Li
I and K I lines mentioned above is least; and
7. Variations in the equivalent widths of the FELs, with the smallest widths appearing in the
last epochs of optical data when the P Cygni profiles are strongest.
4.2.1. Evidence from FELs for an Edge-On Disk
In regards to the first point, jets from accreting cTTS reach velocities8 of order 200–300
km s−1. If the FELs in TWA 30 are assumed to trace such a jet, as in other cTTS, then their
very low apparent velocities imply a jet that is nearly aligned with the plane of the sky. This is
supported by the very low velocities seen even in the [NII] 6583 A line, which invariably exhibits
only a high velocity component in cTTS (Hirth et al. 1997). By extension, the accretion disk,
perpendicular to the jet, must be seen very close to edge-on. This conclusion is further supported
by the presence of both blue- and red-shifted FELs; significant deviations from an edge-on viewing
angle in cTTS produce only blue-shifted FELs, as the disk obscures the receding red-shifted jet
lobe (e.g., Whelan et al. 2009). Further evidence for an edge-on geometry from other signatures is
discussed further below.
8The jet velocity is expected to scale roughly as the escape velocity from the object (Masciadri & Raga 2004),
which is very similar for a 0.5 M⊙ fiducial cTTS and the ∼ 0.12 M⊙ TWA 30.
– 15 –
4.2.2. Evidence for Stellar Reddening due to Disk Dust
The occasional yet significant reddening of the NIR spectrum (point 2), accompanied by a
simultaneous dimming of the star in NIR bands, is most easily explained as stellar reddening and
occultation by disk dust within the line of sight. In the edge-on case, this dust may be entrained
with the gas at the base of the outflow / accretion funnel-flow near the inner edge-of the disk, or
signify a disk warp produced in this region by the interaction of a tilted stellar magnetosphere with
the disk inner edge, as proposed for the cTTS AA Tau (Bouvier et al. 1999, 2003, 2007).
Similarly, the variable reddening observed in the optical spectrum (point 3) may then also
be interpreted as extinction/reddening caused by disk dust in the line of sight. Unfortunately, we
do not have simultaneous optical photometry to verify this, as possible in the NIR. Nevertheless,
the similar relationship between reddening and spectral type in the optical and NIR supports this
conclusion, as described further below.
4.2.3. Evidence for Accretion-related Veiling and Variability
In both the optical and NIR, the underlying spectral type varies by similar amounts after the
reddening effects are accounted for (point 4): from M4 to M5.25 in the optical (Table 8 and Figures
2, 3, and 4), and from M4.5 to M6 in the NIR (Table 8). For an accreting object, such changes
are most easily ascribed to changes in veiling, i.e., changes in the excess continuum emission due
to accretion. In this view, the earliest spectral type corresponds to maximum accretion, and the
latest spectral type to minimum accretion.
This interpretation is supported by the behavior of the photospheric lines of Li I λ6708 and
K I λ7699 (point 5). Both show variable absorption: the smallest absorption equivalent widths
(indeed, K I goes into emission) are seen in 2009, when the optical spectral type is earliest, while
the largest absorption widths occur in 2009 Mar and May, when the optical types are the latest. For
photospheric absorption, this cannot be due simply to changes in the stellar continuum (e.g., due
to suppression of the continuum by dust occlusion), since the lines and continuum would be equally
affected without changing the equivalent width. Instead, it points to a significant enhancement
of accretion during this period which partially fills in (veils) the Li I absorption through excess
continuum emission and also produces excess line emission in K I. The observed correlation between
decreasing absorption strength (i.e., enhanced accretion) and earlier spectral type then confirms
that the changes in the underlying optical spectral type are due to veiling effects. By Occam’s razor,
the similar variations in the NIR spectral type may then also be attributed to accretion-induced
veiling effects. Note that if this veiling interpretation is correct, then the true spectral type of the
star is likely to be ∼M5.25–M6, i.e., the latest and thus least veiling-affected types we see in the
optical and NIR. Nevertheless, given the additional complexity introduced by reddening variability
(see next sub-section), we have simply adopted M5 ± 1 which covers the full range seen in the data;
a more accurate classification will have to await time-resolved high-resolution spectroscopy.

– 16 –
4.2.4. Observed Relationship Between Reddening, Accretion and Wind Signatures
Moreover, we also see the least reddening AV in both the optical and the NIR, when the
underlying spectral type is earliest, and intermediate (in the optical) to highest (in the NIR) AV
when the inferred spectral type is the latest (point 4). If the spectral type changes are due to
variable accretion and if the extinction is due to dust in the line of sight, as we argue, then this
implies that the dust is mostly anti-correlated with accretion. A physical interpretation of this is
supplied further below.
P Cygni profiles (point 6) are clear signatures of cool outflowing winds along the line of sight
moving towards the observer (e.g., Edwards et al. 2003 and references therein). Their sporadic
appearance in the Na I D lines, and once weakly in Hα (2009 Mar, when the Na I D P Cygni
profiles are also strongest), implies that the wind from TWA 30 intersects our line of sight only
occasionally. Moreover, the P Cygni profiles are strongest in 2009 Mar and May, when the apparent
optical spectral type is latest, M5.25, and absorption in photospheric Li I and K I is greatest, i.e.,
by our above arguments, when the accretion is weakest. Conversely, the P Cygni profiles are
weakest/absent in 2009 Jan, when the optical spectral type is earliest, M4, and the Li I and K I
absorption is weakest – i.e, when accretion is strongest. It is noteworthy that the Na I D doublet
evinces the strongest, somewhat red-shifted emission in the same 2009 Jan spectra. This cannot
be explained simply by the absence of blue-shifted P Cygni emission, but instead again indicates
enhanced accretion when the P Cygni wind signatures are weakest.
There are two possible explanations for this behavior. The first is that the P Cygni profiles
are always present at similar strength, but completely filled in by accretion-induced veiling when
accretion is strongest. The other is that there is a real weakening of the wind signatures when
accretion is strongest. While some veiling of absorption profiles clearly occurs during enhanced
accretion (e.g., in Li I), we suggest that the second effect – a real weakening of the wind – is likely
to be present as well, due to the following physically-motivated argument.
4.2.5. A Physical Interpretation: An Inclined Stellar Magnetosphere Interacting with the Disk
Inner-Edge
We have noted earlier that the extinction/reddening signatures, caused by dust in the line
of sight, are anti-correlated with accretion, while now we find that the P Cygni wind signatures
show the same behavior. Both can be explained simultaneously by the interaction of a tilted stellar
magnetosphere interacting with the inner edge of the accretion disk. In this case, accretion is
energetically preferred along one half of the inner edge circumference (where the field lines bend
inwards towards the star) while outflow is preferred along the other half (where the field lines bend
outwards towards the disk). As the star rotates, an observer viewing the disk edge-on along either
the top or bottom disk surface would preferentially see outflow and accretion 180◦ out of phase in
time. This is precisely what is seen, for instance, in the cTTS SU Aur (e.g., Johns & Basri 1995),
– 17 –
and would explain the alternating P Cygni wind signatures and enhanced accretion we observe
in TWA 30. Furthermore, the interaction of an inclined magnetosphere is expected to create a
disk warp on theoretical grounds (Terquem & Papaloizou 2000), which would explain the variable
reddening observed in TWA 30. In the case of AA Tau, where such a warp has also been invoked
(Bouvier et al. 2003), it appears associated with the accretion funnel flow, i.e., is correlated instead
of anti-correlated with the accretion as we observed for TWA 30. However, Terquem & Papaloizou
(2000) show that the specific sense of the warp – i.e., whether the warp vertical extension is parallel
or anti-parallel to that of the accretion funnel flow or wind – depends on particular assumptions
about the nature of the field at the disk inner edge. Hence, a disk warp associated with the wind base
is possible as well. In summary, this single physical situation can explain the variable extinction,
variable wind signatures, variable accretion, and apparent anti-correlation of the two former with
the latter. On the other hand, if only increased veiling were responsible for the disappearance of the
wind-related P Cygni profiles during periods of enhanced accretion, we have no obvious reason for
the reddening to be anti-correlated with accretion. We therefore propose that there is in fact a real
change in the wind signatures. This must be checked through future high-resolution, time-resolved
optical spectroscopy, wherein the wavelength-dependent veiling can be characterized in detail.
4.2.6. Further Evidence for an Edge-On Geometry, and Implications for Accreting Gas
We further see that: the P Cygni profiles are strong in Na I D but weak in Hα; the Na I D
absorption is only moderately blue-shifted from the stellar rest-frame (mean ∼25 km s−1; Figure 7);
and the Hα emission varies by a factor of 1.8 (following the same trend as other accretion signatures
– such as veiling and line emission in K I and Na I D – of being enhanced in 2009 Jan compared
to 2009 Mar and May). All these are consistent with the edge-on hypothesis. In this geometry,
our line of sight intersects the cool dense base of the flow where the resonance lines of Na I and
K I are easily excited but not Hα, so we are more sensitive to changes in accretion and outflow in
the former lines than in the latter; this is also where a magneto-centrifugal wind has the smallest
velocity (and we see an even smaller component of it in our edge-on line of sight; Edwards 2007;
Kwan et al. 2007), yielding only a small shift in radial velocity in wind signatures relative to the
stellar rest frame.
In this regard, we also note that in many edge-on systems red-shifted, inverse P Cygni absorp-
tion is seen superimposed on the Hα emission, arising from infalling gas seen against the hotter
accretion shock on the stellar surface. No such feature is apparent in our Hα profiles. This may be
because the accreting gas is optically thick, completely obscuring the shock region, as supported
by the lack of detectable emission in He I at 4471, 6678, or 7065 A, as well as very weak narrow
emission in He I 5876 A (the strongest line in the series). In cTTS, He I appears to be produced
in both the accretion flow, giving rise to a broad component, and in the shock, yielding a narrow
component. The absence of a broad He I component in our data is consistent with an edge-on ge-
ometry, since this is a high-temperature line that would not be excited at the cool base of the flow.

– 18 –
The absence or extreme weakness of a He I narrow component in the presence of other accretion
signatures, further suggests that the shock region is obscured by optically thick accreting gas.
4.2.7. Evidence for Time-Variability in the FELs, and a Physical Interpretation
The scenario sketched so far is consistent with spatial variations alone: the changes in the
accretion/outflow/extinction signatures, due to inner-disk interactions with a tilted stellar magne-
tosphere, occur as the accretion flow, outflow and disk warp rotate into and out of our line of sight.
As such, these signatures should be periodic on the scale of the rotation period of the disk inner
edge. In cTTS, this is usually on the order of days. Our observations are very poorly sampled at
such short periods, and thus remain consistent with this picture of spatial changes alone. We note
that the very strong increase in NIR reddening in 2009 May over a period of only 6 days hints at
changes on the timescales expected from rotational effects. This will need to be verified by future
finely time-sampled monitoring.
However, spatial variability alone cannot be the whole story. Considering the FELs in TWA
30 (point 7), we note first that the equivalent widths of nearly all of these are weakest in the 2009
Mar and May optical data and strongest in the 2009 Jan optical data. This could be explained
if the stellar photosphere were severely occulted in 2009 Jan relative to 2009 Mar and May; i.e.,
if the FELs were seen in 2009 Jan against a much dimmer continuum. However, this appears in
contradiction to our argument above, where the optical data indicate that it is 2009 Jan when the
AV is least (indicating minimum dust reddening and occlusion) and 2009 March and May when
the AV is intermediate to highest (indicating maximum reddening/occlusion effects). Moreover,
the equivalent widths of different FELs change by different amounts, while they should all change
by the same proportion if it is the stellar continuum that is being suppressed. The FELs are also
expected to arise on scales of at least a few AU from the star, and thus cannot themselves be
expected to be affected by any occultation mechanisms operating near the star (e.g., a disk warp).
The only alternative is that the FELs are intrinsically time-variant. FEL time variations may
arise as the jet encounters inhomogeneities in its path, or represent temporal changes in the jet
launching. If the latter occurs in TWA 30, then the strengthening of the P Cygni profiles in 2009
Mar and May may indicate an actual increase in the outflow rate at these epochs instead of just
the outflow rotating into our line of sight. Such a scenario is not inconsistent with the FELs
being weakest in these epochs. An FEL can only arise when the critical density of that particular
species is reached, at a distance of tens of AUs for cTTS to perhaps a few AU for brown dwarfs
(Whelan et al. 2009). At the very least, there must be a time-lag between the observation (via P
Cygni profiles) of a strengthening in the wind at its base, and the corresponding increase in the
FELs a few AU away, representing the jet travel time. Assuming a fiducial jet velocity of ∼300
km s−1 and a distance of ∼5 AU to the critical density region, yields a time lag of ∼30 days.
Our interpretation of the FEL variations is then simply that at some point in the past there was
– 19 –
a strengthening in the outflow, which led (after some time-lag) to the brightening of the FELs in the
2009 Jan spectra. By the time of the 2009 Mar and May spectroscopy, the FELs have faded back
to their normal levels. The fact that these epochs coincide with an increase in accretion and wind
signatures near the star, respectively, would simply be coincidental. This is a plausible scenario if
changes in the latter signatures occur episodically (and maybe periodically) on timescales of days.
We note further that, relative to the 2008 Nov data, the FELs in the 2009 Jan data are stronger:
in [O I] λ6300 by 49%, in [S II] λ6731 by 165%, and in [N II] λ6583 by 63% (see Table 8). This
may be understood by noting that the requisite critical electron density is highest for [O I], smaller
for [S II] and least for [N II]. Thus, for a jet whose streamlines diverge (i.e., density decreases) with
increasing distance, the [O I] emission region lies closest to the star, [S II] appears further out, and
[N II] lies furthest away, as found earlier by Hirth et al. (1997) for cTTS. We thus posit that the
past outflow enhancement has nearly reached the [O I] critical region by 2008 Nov but has yet to
arrive at the [S II] and [N II] locations; by 2009 Jan the [O I] FELs have plateaued and the outflow
enhancement has arrived in the [S II] region, brightening this line considerably, but has not quite
reached [N II] yet; and at last, by 2009 Mar and May, the enhancement has passed all these regions,
and all the FELs have faded away again.
To clarify this model, multiple observations are needed: finely time-sampled photometry to
measure the periodicity of the disk rotation/outflow, mid-IR photometry to detect the disk, mid-
IR spectroscopy to detect the presence of silicates and infer grain sizes, high resolution broadband
imaging to resolve the disk, high resolution narrowband imaging to resolve the outflows, polarimetry
to investigate the dust-disk geometry, spectroastrometry to spatially map the outflow, and sub-mm
observations to measure the disk mass. As one of the few very low-mass stars/brown dwarfs for
which many of these observations are possible, TWA 30 could prove to be an invaluable case study
for accretion and outflow processes at the low-mass end.
5. Conclusion
We have identified a new and unusual member of the TW Hydrae Association, TWA 30, which
has emission lines of [O I], [O II], [O III], [S II], and Mg I] near the stellar rest velocity, indicating
it is powering an outflow. The temporal changes in reddening, absorption/emission EWs, and line
profiles, particularly for Na I D, suggests a stellar magnetospheric axis inclined with respect to a
disk that is viewed nearly edge-on. The presence of forbidden line emission [OIII] and Mg I] in the
spectra of TWA 30 marks the first time these lines have been seen in a young star not residing in
a molecular cloud and are rarely present even amongst cTTS in star formation regions. Both the
optical and NIR spectral types appear to vary in accordance with the reddening from M4–M5.25
and from M4.5–M6, respectively, so we have adopted a spectral type of M5 ± 1. We suggest that the
earlier spectral types are seen at periods of high accretion and include continuum excess emission.
The spectral type of TWA 30 therefore might be as late as M5.25–M6. From evolutionary models,
we estimate an age of 7 ± 3 Myr and a mass of 0.12 ± 0.04 M⊙. The close proximity of TWA 30,

– 20 –
42 ± 2 pc, makes it an excellent target for follow-up studies to spatially resolve the outflow and
circumstellar disk. With the inclusion of TWA 30, we have updated the disk census of the TWA,
finding that 35+11−8 % of observed TWA members still retain their circumstellar disks, a higher ratio
than previous estimates.
We thank our anonymous referee whose comments improved the quality of this paper. We
are grateful to George Herbig, Mike Cushing, Nathan Smith, Silvia Alencar, Silvie Cabrit, Bo
Reipurth, Klaus Hodapp, Brendan Bowler, Kevin Covey, George Wallerstein, and Suzanne Hawley
for useful discussions. We also thank our telescope operators at Magellan: Mauricio Martinez,
Hernan Nunez, and Ricardo Covarrubias, and at IRTF: Paul Sears, Bill Golisch, Dave Griep.
D.L.L. thanks Dave Sanders and George Herbig for financial support. This research has ben-
efitted from the M, L, and T dwarf compendium housed at DwarfArchives.org and maintained
by Chris Gelino, J. Davy Kirkpatrick, and Adam Burgasser. This research has made use of the
Atomic Line List v2.04 maintained at http://www.pa.uky.edu/$\sim$peter/atomic/; the SIM-
BAD database and VizieR catalogue access tool, operated at CDS, Strasbourg, France; and the facil-
ities of the Canadian Astronomy Data Centre operated by the National Research Council of Canada
with the support of the Canadian Space Agency. This paper uses data from the IRTF Spectral
Library (http://irtfweb.ifa.hawaii.edu/$\sim$spex/IRTF_Spectral_Library/index.html)
maintained by John Rayner, Michael Cushing, and William Vacca. This publication makes use
of data products from the Two Micron All Sky Survey, which is a joint project of the University of
Massachusetts and the Infrared Processing and Analysis Center/California Institute of Technology,
funded by the National Aeronautics and Space Administration and the National Science Founda-
tion. This research has made use of the NASA/IPAC Infrared Science Archive, which is operated by
the Jet Propulsion Laboratory, California Institute of Technology, under contract with the National
Aeronautics and Space Administration. As some spectroscopic follow-up data was obtained from
the summit of Mauna Kea, the authors wish to recognize and acknowledge the very significant and
cultural role and reverence that this mountaintop has always had with the indigenous Hawaiian
community. We are most fortunate to have the opportunity to conduct observations there.
Facilities: IRTF (SpeX), Magellan (MagE), Blanco (ISPI)
– 21 –
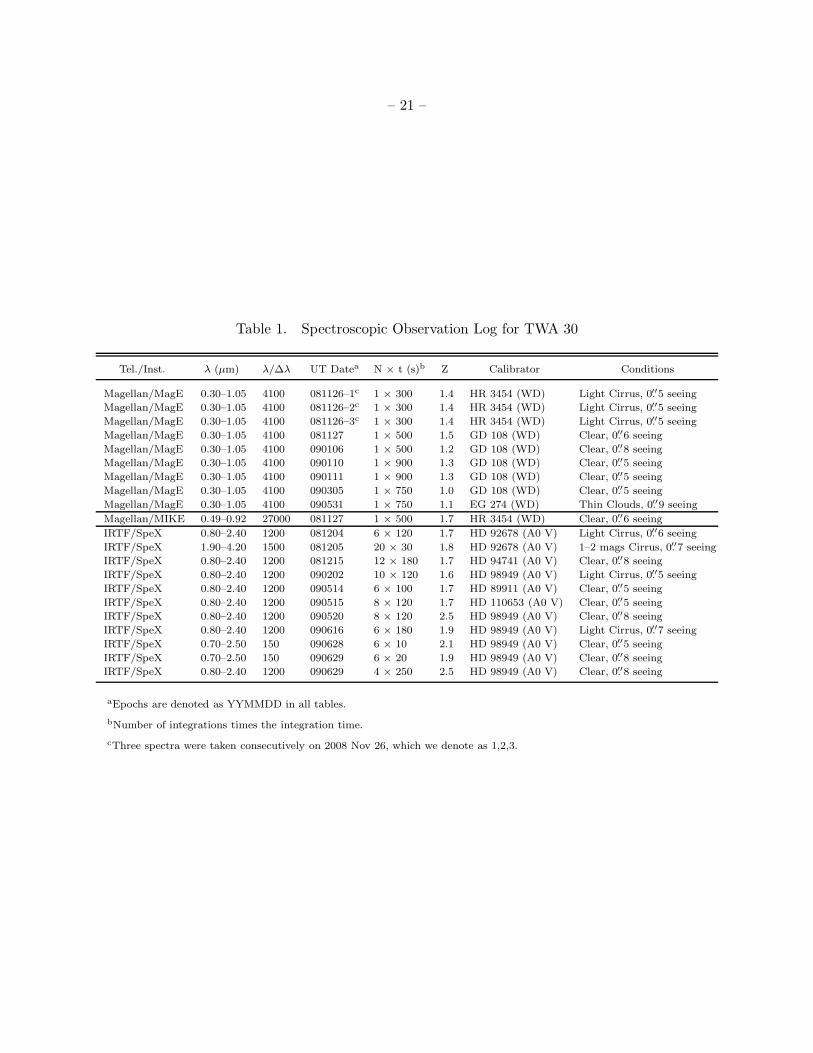
Table 1. Spectroscopic Observation Log for TWA 30
Tel./Inst. λ (µm) λ/∆λ UT Datea N × t (s)b Z Calibrator Conditions
Magellan/MagE 0.30–1.05 4100 081126–1c 1 × 300 1.4 HR 3454 (WD) Light Cirrus, 0.′′5 seeing
Magellan/MagE 0.30–1.05 4100 081126–2c 1 × 300 1.4 HR 3454 (WD) Light Cirrus, 0.′′5 seeing
Magellan/MagE 0.30–1.05 4100 081126–3c 1 × 300 1.4 HR 3454 (WD) Light Cirrus, 0.′′5 seeing
Magellan/MagE 0.30–1.05 4100 081127 1 × 500 1.5 GD 108 (WD) Clear, 0.′′6 seeing
Magellan/MagE 0.30–1.05 4100 090106 1 × 500 1.2 GD 108 (WD) Clear, 0.′′8 seeing
Magellan/MagE 0.30–1.05 4100 090110 1 × 900 1.3 GD 108 (WD) Clear, 0.′′5 seeing
Magellan/MagE 0.30–1.05 4100 090111 1 × 900 1.3 GD 108 (WD) Clear, 0.′′5 seeing
Magellan/MagE 0.30–1.05 4100 090305 1 × 750 1.0 GD 108 (WD) Clear, 0.′′5 seeing
Magellan/MagE 0.30–1.05 4100 090531 1 × 750 1.1 EG 274 (WD) Thin Clouds, 0.′′9 seeing
Magellan/MIKE 0.49–0.92 27000 081127 1 × 500 1.7 HR 3454 (WD) Clear, 0.′′6 seeing
IRTF/SpeX 0.80–2.40 1200 081204 6 × 120 1.7 HD 92678 (A0 V) Light Cirrus, 0.′′6 seeing
IRTF/SpeX 1.90–4.20 1500 081205 20 × 30 1.8 HD 92678 (A0 V) 1–2 mags Cirrus, 0.′′7 seeing
IRTF/SpeX 0.80–2.40 1200 081215 12 × 180 1.7 HD 94741 (A0 V) Clear, 0.′′8 seeing
IRTF/SpeX 0.80–2.40 1200 090202 10 × 120 1.6 HD 98949 (A0 V) Light Cirrus, 0.′′5 seeing
IRTF/SpeX 0.80–2.40 1200 090514 6 × 100 1.7 HD 89911 (A0 V) Clear, 0.′′5 seeing
IRTF/SpeX 0.80–2.40 1200 090515 8 × 120 1.7 HD 110653 (A0 V) Clear, 0.′′5 seeing
IRTF/SpeX 0.80–2.40 1200 090520 8 × 120 2.5 HD 98949 (A0 V) Clear, 0.′′8 seeing
IRTF/SpeX 0.80–2.40 1200 090616 6 × 180 1.9 HD 98949 (A0 V) Light Cirrus, 0.′′7 seeing
IRTF/SpeX 0.70–2.50 150 090628 6 × 10 2.1 HD 98949 (A0 V) Clear, 0.′′5 seeing
IRTF/SpeX 0.70–2.50 150 090629 6 × 20 1.9 HD 98949 (A0 V) Clear, 0.′′8 seeing
IRTF/SpeX 0.80–2.40 1200 090629 4 × 250 2.5 HD 98949 (A0 V) Clear, 0.′′8 seeing
aEpochs are denoted as YYMMDD in all tables.
bNumber of integrations times the integration time.
cThree spectra were taken consecutively on 2008 Nov 26, which we denote as 1,2,3.
– 22 –
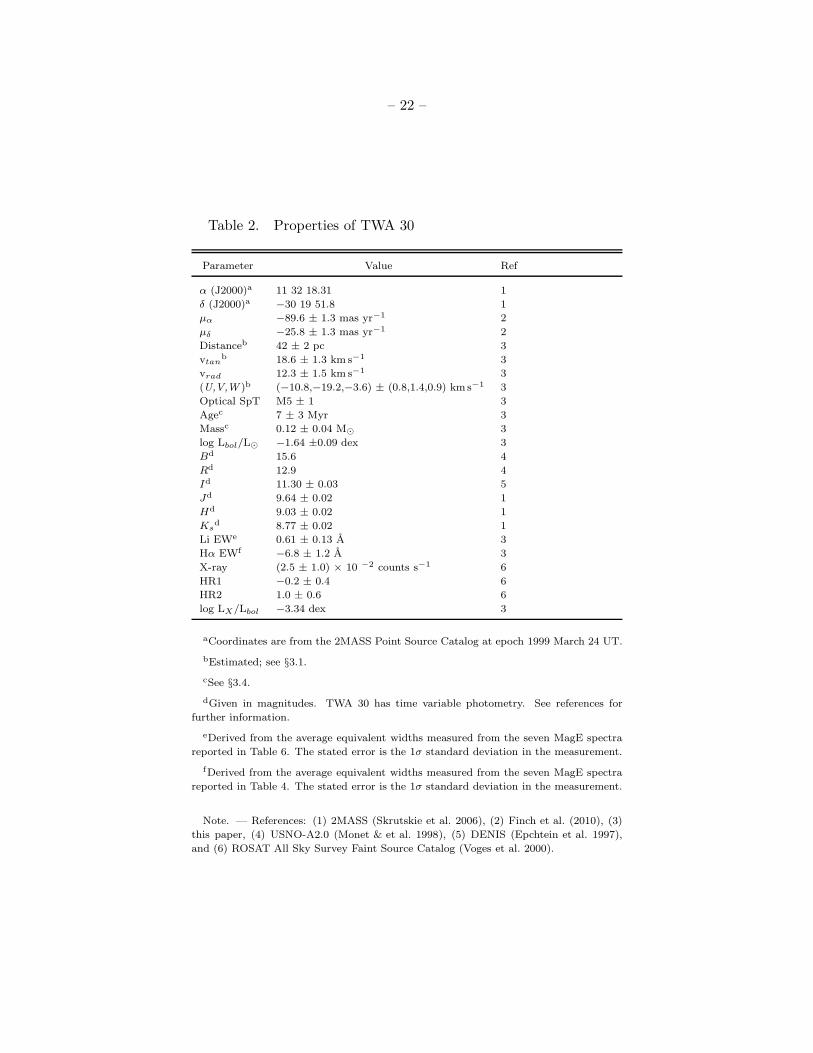
Table 2. Properties of TWA 30
Parameter Value Ref
α (J2000)a 11 32 18.31 1
δ (J2000)a −30 19 51.8 1
µα −89.6 ± 1.3 mas yr−1 2
µδ −25.8 ± 1.3 mas yr−1 2
Distanceb 42 ± 2 pc 3
vtanb 18.6 ± 1.3 km s−1 3
vrad 12.3 ± 1.5 km s−1 3
(U,V,W )b (−10.8,−19.2,−3.6) ± (0.8,1.4,0.9) km s−1 3
Optical SpT M5 ± 1 3
Agec 7 ± 3 Myr 3
Massc 0.12 ± 0.04 M⊙ 3
log Lbol/L⊙ −1.64 ±0.09 dex 3
Bd 15.6 4
Rd 12.9 4
Id 11.30 ± 0.03 5
Jd 9.64 ± 0.02 1
Hd 9.03 ± 0.02 1
Ksd 8.77 ± 0.02 1
Li EWe 0.61 ± 0.13 A 3
Hα EWf −6.8 ± 1.2 A 3
X-ray (2.5 ± 1.0) × 10 −2 counts s−1 6
HR1 −0.2 ± 0.4 6
HR2 1.0 ± 0.6 6
log LX/Lbol −3.34 dex 3
aCoordinates are from the 2MASS Point Source Catalog at epoch 1999 March 24 UT.
bEstimated; see §3.1.
cSee §3.4.
dGiven in magnitudes. TWA 30 has time variable photometry. See references for
further information.
eDerived from the average equivalent widths measured from the seven MagE spectra
reported in Table 6. The stated error is the 1σ standard deviation in the measurement.
fDerived from the average equivalent widths measured from the seven MagE spectra
reported in Table 4. The stated error is the 1σ standard deviation in the measurement.
Note. — References: (1) 2MASS (Skrutskie et al. 2006), (2) Finch et al. (2010), (3)
this paper, (4) USNO-A2.0 (Monet & et al. 1998), (5) DENIS (Epchtein et al. 1997),
and (6) ROSAT All Sky Survey Faint Source Catalog (Voges et al. 2000).
– 23 –
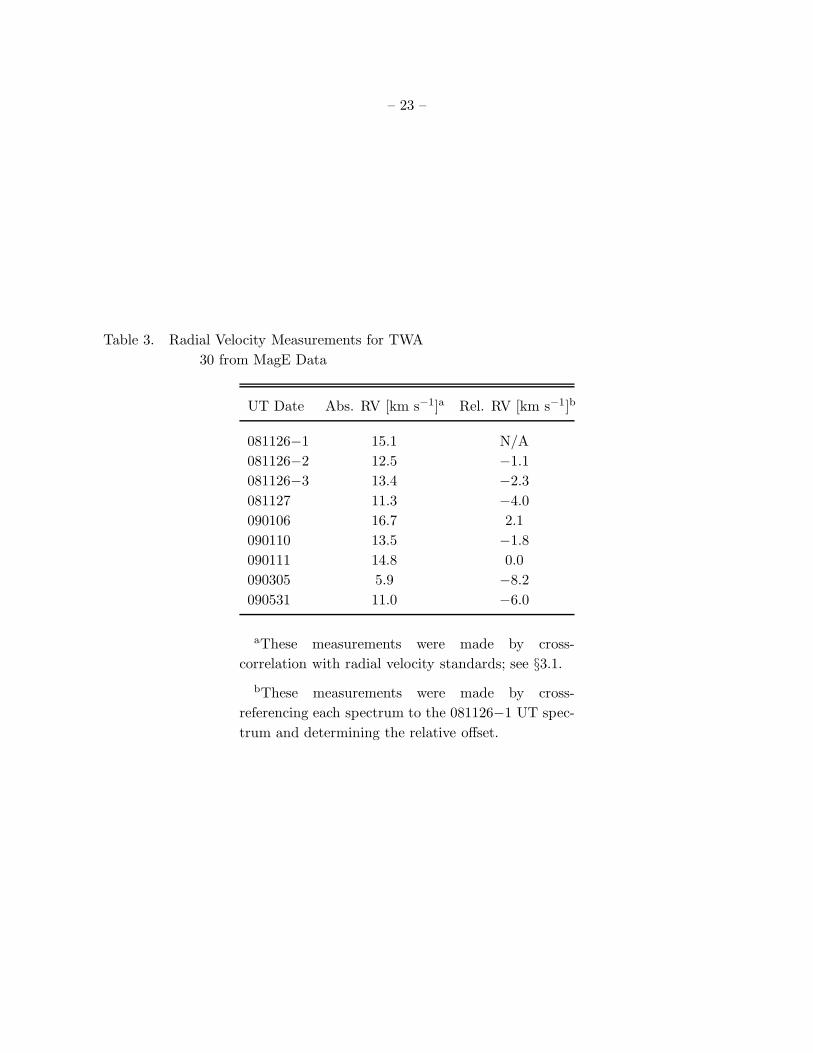
Table 3. Radial Velocity Measurements for TWA
30 from MagE Data
UT Date Abs. RV [km s−1]a Rel. RV [km s−1]b
081126−1 15.1 N/A
081126−2 12.5 −1.1
081126−3 13.4 −2.3
081127 11.3 −4.0
090106 16.7 2.1
090110 13.5 −1.8
090111 14.8 0.0
090305 5.9 −8.2
090531 11.0 −6.0
aThese measurements were made by cross-
correlation with radial velocity standards; see §3.1.
bThese measurements were made by cross-
referencing each spectrum to the 081126−1 UT spec-
trum and determining the relative offset.
– 24 –
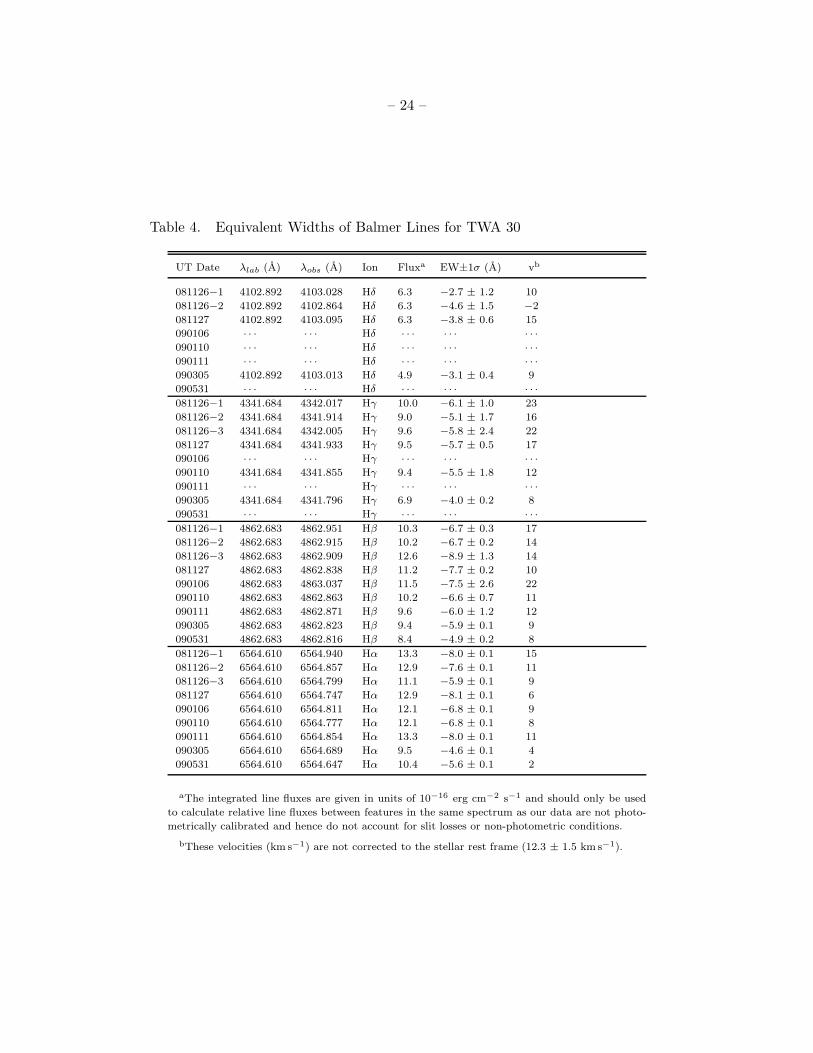
Table 4. Equivalent Widths of Balmer Lines for TWA 30
UT Date λlab (A) λobs (A) Ion Fluxa EW±1σ (A) vb
081126−1 4102.892 4103.028 Hδ 6.3 −2.7 ± 1.2 10
081126−2 4102.892 4102.864 Hδ 6.3 −4.6 ± 1.5 −2
081127 4102.892 4103.095 Hδ 6.3 −3.8 ± 0.6 15
090106 · · · · · · Hδ · · · · · · · · ·
090110 · · · · · · Hδ · · · · · · · · ·
090111 · · · · · · Hδ · · · · · · · · ·
090305 4102.892 4103.013 Hδ 4.9 −3.1 ± 0.4 9
090531 · · · · · · Hδ · · · · · · · · ·
081126−1 4341.684 4342.017 Hγ 10.0 −6.1 ± 1.0 23
081126−2 4341.684 4341.914 Hγ 9.0 −5.1 ± 1.7 16
081126−3 4341.684 4342.005 Hγ 9.6 −5.8 ± 2.4 22
081127 4341.684 4341.933 Hγ 9.5 −5.7 ± 0.5 17
090106 · · · · · · Hγ · · · · · · · · ·
090110 4341.684 4341.855 Hγ 9.4 −5.5 ± 1.8 12
090111 · · · · · · Hγ · · · · · · · · ·
090305 4341.684 4341.796 Hγ 6.9 −4.0 ± 0.2 8
090531 · · · · · · Hγ · · · · · · · · ·
081126−1 4862.683 4862.951 Hβ 10.3 −6.7 ± 0.3 17
081126−2 4862.683 4862.915 Hβ 10.2 −6.7 ± 0.2 14
081126−3 4862.683 4862.909 Hβ 12.6 −8.9 ± 1.3 14
081127 4862.683 4862.838 Hβ 11.2 −7.7 ± 0.2 10
090106 4862.683 4863.037 Hβ 11.5 −7.5 ± 2.6 22
090110 4862.683 4862.863 Hβ 10.2 −6.6 ± 0.7 11
090111 4862.683 4862.871 Hβ 9.6 −6.0 ± 1.2 12
090305 4862.683 4862.823 Hβ 9.4 −5.9 ± 0.1 9
090531 4862.683 4862.816 Hβ 8.4 −4.9 ± 0.2 8
081126−1 6564.610 6564.940 Hα 13.3 −8.0 ± 0.1 15
081126−2 6564.610 6564.857 Hα 12.9 −7.6 ± 0.1 11
081126−3 6564.610 6564.799 Hα 11.1 −5.9 ± 0.1 9
081127 6564.610 6564.747 Hα 12.9 −8.1 ± 0.1 6
090106 6564.610 6564.811 Hα 12.1 −6.8 ± 0.1 9
090110 6564.610 6564.777 Hα 12.1 −6.8 ± 0.1 8
090111 6564.610 6564.854 Hα 13.3 −8.0 ± 0.1 11
090305 6564.610 6564.689 Hα 9.5 −4.6 ± 0.1 4
090531 6564.610 6564.647 Hα 10.4 −5.6 ± 0.1 2
aThe integrated line fluxes are given in units of 10−16 erg cm−2 s−1 and should only be used
to calculate relative line fluxes between features in the same spectrum as our data are not photo-
metrically calibrated and hence do not account for slit losses or non-photometric conditions.
bThese velocities (km s−1) are not corrected to the stellar rest frame (12.3 ± 1.5 km s−1).
– 25 –
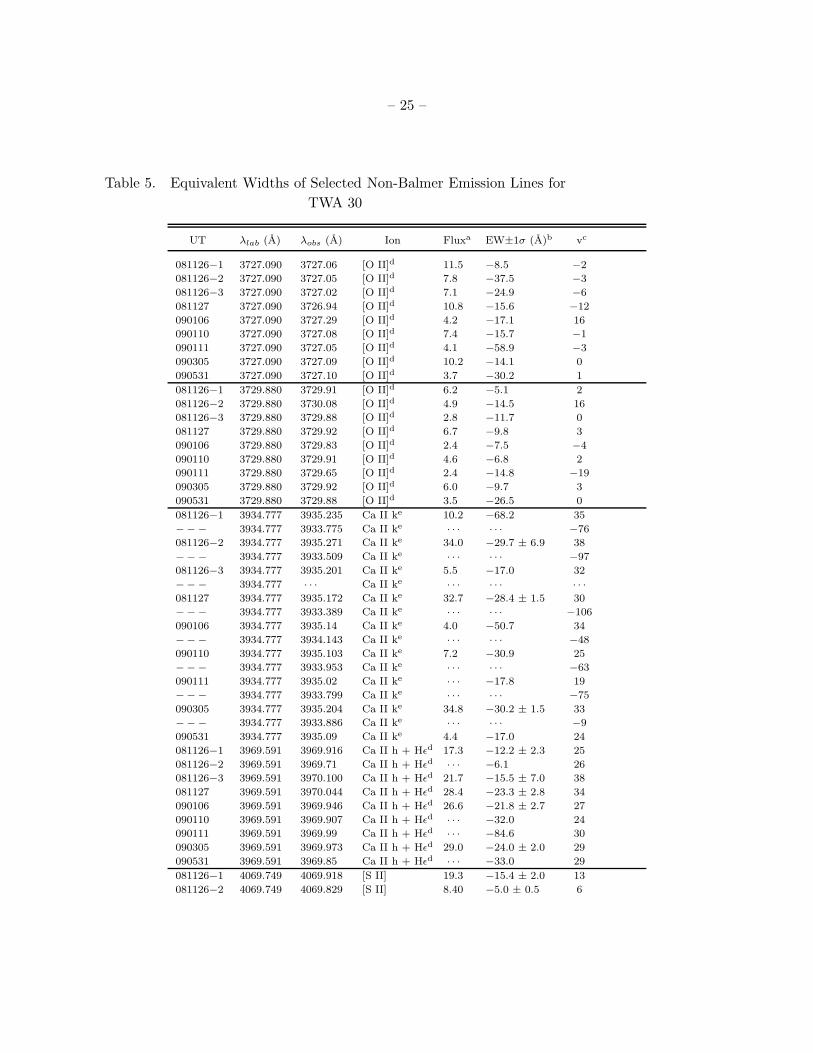
Table 5. Equivalent Widths of Selected Non-Balmer Emission Lines for
TWA 30
UT λlab (A) λobs (A) Ion Fluxa EW±1σ (A)b vc
081126−1 3727.090 3727.06 [O II]d 11.5 −8.5 −2
081126−2 3727.090 3727.05 [O II]d 7.8 −37.5 −3
081126−3 3727.090 3727.02 [O II]d 7.1 −24.9 −6
081127 3727.090 3726.94 [O II]d 10.8 −15.6 −12
090106 3727.090 3727.29 [O II]d 4.2 −17.1 16
090110 3727.090 3727.08 [O II]d 7.4 −15.7 −1
090111 3727.090 3727.05 [O II]d 4.1 −58.9 −3
090305 3727.090 3727.09 [O II]d 10.2 −14.1 0
090531 3727.090 3727.10 [O II]d 3.7 −30.2 1
081126−1 3729.880 3729.91 [O II]d 6.2 −5.1 2
081126−2 3729.880 3730.08 [O II]d 4.9 −14.5 16
081126−3 3729.880 3729.88 [O II]d 2.8 −11.7 0
081127 3729.880 3729.92 [O II]d 6.7 −9.8 3
090106 3729.880 3729.83 [O II]d 2.4 −7.5 −4
090110 3729.880 3729.91 [O II]d 4.6 −6.8 2
090111 3729.880 3729.65 [O II]d 2.4 −14.8 −19
090305 3729.880 3729.92 [O II]d 6.0 −9.7 3
090531 3729.880 3729.88 [O II]d 3.5 −26.5 0
081126−1 3934.777 3935.235 Ca II ke 10.2 −68.2 35
−−− 3934.777 3933.775 Ca II ke · · · · · · −76
081126−2 3934.777 3935.271 Ca II ke 34.0 −29.7 ± 6.9 38
−−− 3934.777 3933.509 Ca II ke · · · · · · −97
081126−3 3934.777 3935.201 Ca II ke 5.5 −17.0 32
−−− 3934.777 · · · Ca II ke · · · · · · · · ·
081127 3934.777 3935.172 Ca II ke 32.7 −28.4 ± 1.5 30
−−− 3934.777 3933.389 Ca II ke · · · · · · −106
090106 3934.777 3935.14 Ca II ke 4.0 −50.7 34
−−− 3934.777 3934.143 Ca II ke · · · · · · −48
090110 3934.777 3935.103 Ca II ke 7.2 −30.9 25
−−− 3934.777 3933.953 Ca II ke · · · · · · −63
090111 3934.777 3935.02 Ca II ke · · · −17.8 19
−−− 3934.777 3933.799 Ca II ke · · · · · · −75
090305 3934.777 3935.204 Ca II ke 34.8 −30.2 ± 1.5 33
−−− 3934.777 3933.886 Ca II ke · · · · · · −9
090531 3934.777 3935.09 Ca II ke 4.4 −17.0 24
081126−1 3969.591 3969.916 Ca II h + Hǫd 17.3 −12.2 ± 2.3 25
081126−2 3969.591 3969.71 Ca II h + Hǫd · · · −6.1 26
081126−3 3969.591 3970.100 Ca II h + Hǫd 21.7 −15.5 ± 7.0 38
081127 3969.591 3970.044 Ca II h + Hǫd 28.4 −23.3 ± 2.8 34
090106 3969.591 3969.946 Ca II h + Hǫd 26.6 −21.8 ± 2.7 27
090110 3969.591 3969.907 Ca II h + Hǫd · · · −32.0 24
090111 3969.591 3969.99 Ca II h + Hǫd · · · −84.6 30
090305 3969.591 3969.973 Ca II h + Hǫd 29.0 −24.0 ± 2.0 29
090531 3969.591 3969.85 Ca II h + Hǫd · · · −33.0 29
081126−1 4069.749 4069.918 [S II] 19.3 −15.4 ± 2.0 13
081126−2 4069.749 4069.829 [S II] 8.40 −5.0 ± 0.5 6
– 26 –
Table 5—Continued
UT λlab (A) λobs (A) Ion Fluxa EW±1σ (A)b vc
081126−3 4069.749 · · · [S II] · · · · · · · · ·
081127 4069.749 4069.858 [S II] 13.5 −10.1 ± 0.6 8
090106 4069.740 4069.68 [S II] 2.3 −15.4 −4
090110 4069.749 4069.666 [S II] 11.8 −7.9 ± 1.6 −6
090111 4069.749 · · · [S II] · · · · · · · · ·
090305 4069.749 4069.802 [S II] 9.5 −6.6 ± 0.3 4
090531 4069.749 4069.837 [S II] 8.9 −6.3 ± 2.6 7
081126−1 4077.500 · · · [S II] · · · · · · · · ·
081126−2 4077.500 · · · [S II] · · · · · · · · ·
081126−3 4077.500 · · · [S II] · · · · · · · · ·
081127 4077.500 4077.448 [S II] 5.2 −2.5 ± 0.4 −4
090106 4077.500 4077.57 [S II] <0.6 < −2.7 5
090110 4077.500 · · · [S II] · · · · · · · · ·
090111 4077.500 · · · [S II] · · · · · · · · ·
090305 4077.500 4077.558 [S II] 5.3 −2.6 ± 0.3 4
090531 4077.500 · · · [S II] · · · · · · · · ·
081126−1 4364.440 4364.966 [O III] 5.4 −1.2 ± 0.6 36
081126−2 4364.440 · · · [O III] · · · · · · · · ·
081126−3 4364.440 · · · [O III] · · · · · · · · ·
081127 4364.440 4364.786 [O III] 6.2 −2.1 ± 0.4 24
090106 4364.440 · · · [O III] · · · · · · · · ·
090110 4364.440 · · · [O III] · · · · · · · · ·
090111 4364.440 · · · [O III] · · · · · · · · ·
090305 4364.440 4364.770 [O III] 5.3 −1.1 ± 0.2 23
090531 4364.440 · · · [O III] · · · · · · · · ·
081126−1 4572.377 4572.388 Mg I] 7.0 −2.3 ± 0.4 1
081126−2 4572.377 4572.490 Mg I] 9.0 −4.2 ± 0.4 7
081126−3 4572.377 4572.481 Mg I] 12.7 −7.9 ± 1.0 7
081127 4572.377 4572.372 Mg I] 8.6 −3.9 ± 0.2 0
090106 4572.377 4572.310 Mg I] 7.4 −2.9 ± 0.9 −4
090110 4572.377 4572.206 Mg I] 7.6 −3.0 ± 0.4 −11
090111 4572.377 4572.235 Mg I] 7.6 −2.9 ± 1.0 −9
090305 4572.377 4572.365 Mg I] 7.5 −2.8 ± 0.1 −1
090531 4572.377 4572.276 Mg I] 6.3 −1.6 ± 0.6 −7
081126−1 4659.350 4659.183 [Fe III] 5.1 −1.7 ± 0.2 −11
081126−2 4659.350 4659.253 [Fe III] 5.1 −1.3 ± 0.2 −6
081126−3 4659.350 · · · [Fe III] · · · · · · · · ·
081127 4659.350 4659.500 [Fe III] 5.3 −1.9 ± 0.1 10
090106 4659.350 · · · [Fe III] · · · · · · · · ·
090110 4659.350 4659.590 [Fe III] 5.4 −1.7 ± 0.3 15
090111 4659.350 · · · [Fe III] · · · · · · · · ·
090305 4659.350 4659.684 [Fe III] 5.0 −1.2 ± 0.1 21
090531 4659.350 · · · [Fe III] · · · · · · · · ·
081126−1 4756.020 4756.065 [Fe III] 2.3 −0.2 ± 0.1 +3
081126−2 4756.020 · · · [Fe III] · · · · · · · · ·
081126−3 4756.020 · · · [Fe III] · · · · · · · · ·

– 27 –
Table 5—Continued
UT λlab (A) λobs (A) Ion Fluxa EW±1σ (A)b vc
081127 4756.020 4756.789 [Fe III] 3.0 −0.5 ± 0.1 48
090106 4756.020 · · · [Fe III] · · · · · · · · ·
090110 4756.020 · · · [Fe III] · · · · · · · · ·
090111 4756.020 · · · [Fe III] · · · · · · · · ·
090305 4756.020 4756.644 [Fe III] 2.5 −0.4 ± 0.1 39
090531 4756.020 · · · [Fe III] · · · · · · · · ·
081126−1 4960.300 4960.380 [O III] 13.2 −7.8 ± 0.2 5
081126−2 4960.300 4960.508 [O III] 15.1 −9.4 ± 0.2 13
081126−3 4960.300 4960.452 [O III] 16.3 −10.4 ± 0.7 9
081127 4960.300 4960.411 [O III] 12.7 −7.2 ± 0.1 7
090106 4960.300 4960.389 [O III] 17.8 −12.2 ± 1.8 5
090110 4960.300 4960.439 [O III] 17.9 −12.4 ± 1.0 8
090111 4960.300 4960.303 [O III] 20.7 −15.2 ± 3.7 0
090305 4960.300 4960.470 [O III] 10.0 −4.1 ± 0.1 10
090531 4960.300 4960.570 [O III] 9.0 −3.1 ± 0.4 16
081126−1 5008.240 5008.261 [O III] 33.6 −25.1 ± 0.2 1
081126−2 5008.240 5008.277 [O III] 31.6 −23.1 ± 0.3 2
081126−3 5008.240 5008.228 [O III] 36.4 −27.9 ± 0.6 −1
081127 5008.240 5008.219 [O III] 33.3 −24.8 ± 0.3 −1
090106 5008.240 5008.78 [O III] · · · −49.2 32
090110 5008.240 5008.337 [O III] 34.2 −25.6 ± 0.7 6
090111 5008.240 5008.313 [O III] 32.9 −24.6 ± 1.0 4
090305 5008.240 5008.268 [O III] 18.9 −10.5 ± 0.1 2
090531 5008.240 5008.299 [O III] 18.0 −9.6 ± 0.4 4
081126−1 5877.227 · · · He I · · · · · · · · ·
081126−2 5877.227 5876.947 He I 3.6 −0.2 ± 0.1 −14
081126−3 5877.227 5877.406 He I 4.0 −0.6 ± 0.1 9
081127 5877.227 5877.451 He I 3.8 −0.3 ± 0.1 11
090106 5877.227 · · · He I · · · · · · · · ·
090110 5877.227 · · · He I · · · · · · · · ·
090111 5877.227 · · · He I · · · · · · · · ·
090305 5877.227 5877.130 He I 4.4 −0.5 ± 0.1 −5
090531 5877.227 5877.381 He I 3.6 −0.2 ± 0.1 8
081126−1 5891.583 5892.387 Na I De 5.1 −1.6 ± 0.1 41
−−− 5891.583 5890.280 Na I De · · · · · · −66
081126−2 5891.583 5892.314 Na I De 5.3 −1.9 ± 0.1 37
−−− 5891.583 5890.062 Na I De · · · · · · −77
081126−3 5891.583 5892.286 Na I De 5.3 −1.4 ± 0.1 36
−−− 5891.583 5890.193 Na I De · · · · · · −71
081127 5891.583 5892.357 Na I De 5.5 −2.0 ± 0.1 39.
−−− 5891.583 5890.000 Na I De · · · · · · −81
090106 5891.583 5892.210 Na I De 9.7 −5.8 ± 0.7 32
−−− 5891.583 5890.436 Na I De · · · · · · −58
090110 5891.583 5892.171 Na I De 6.4 −3.3 ± 0.2 30
−−− 5891.583 5890.493 Na I De · · · · · · −56
090111 5891.583 5892.245 Na I De 6.9 −3.9 ± 0.4 34
– 28 –
Table 5—Continued
UT λlab (A) λobs (A) Ion Fluxa EW±1σ (A)b vc
−−− 5891.583 5890.496 Na I De · · · · · · −55
090305 5891.583 · · · Na I Df · · · · · · · · ·
090531 891.583 · · · Na I Df · · · · · · · · ·
081126−1 5897.558 5898.417 Na I De 2.2 −1.3 44
−−− 5897.558 5895.873 Na I De · · · · · · −86
081126−2 5897.558 5898.333 Na I De 2.2 −1.5 39
−−− 5897.558 5896.308 Na I De · · · · · · −64
081126−3 5897.558 5896.938 Na I De 5.0 −1.1 ± 0.1 36
−−− 5897.558 5896.938 Na I De · · · · · · −32
081127 5897.558 5898.398 Na I De 4.8 −1.3 ± 0.1 43
−−− 5897.558 5896.095 Na I De · · · · · · −74
090106 5897.558 5898.136 Na I De 7.4 −4.1 ± 0.7 29
−−− 5897.558 5896.217 Na I De · · · · · · −98
090110 5897.558 5898.106 Na I De 5.9 −2.8 ± 0.2 28
−−− 5897.558 5896.452 Na I De · · · · · · −56
090111 5897.558 5898.182 Na I De 6.1 −3.0 ± 0.4 32
−−− 5897.558 5896.669 Na I De · · · · · · −45
090305 5897.558 · · · Na I Df · · · · · · · · ·
090531 5897.558 · · · Na I Df · · · · · · · · ·
081126−1 6302.050 6302.223 [O I] 14.1 −9.2 ± 0.1 8
081126−2 6302.050 6302.182 [O I] 13.5 −8.9 ± 0.1 6
081126−3 6302.050 6302.206 [O I] 13.9 −9.2 ± 0.1 7
081127 6302.050 6302.102 [O I] 14.5 −9.9 ± 0.1 2
090106 6302.050 6302.068 [O I] 19.4 −14.8 ± 0.3 1
090110 6302.050 6302.033 [O I] 18.3 −13.7 ± 0.1 −1
090111 6302.050 6302.114 [O I] 18.0 −13.4 ± 0.1 3
090305 6302.050 6302.182 [O I] 7.8 −3.2 ± 0.1 6
090531 6302.050 6302.313 [O I] 7.8 −3.1 ± 0.1 13
081126−1 6365.540 6365.655 [O I] 6.3 −2.1 ± 0.1 5
081126−2 6365.540 6365.721 [O I] 6.6 −1.9 ± 0.1 9
081126−3 6365.540 6365.752 [O I] 6.8 −2.2 ± 0.1 10
081127 6365.540 6365.530 [O I] 6.9 −2.3 ± 0.1 −0
090106 6365.540 6365.558 [O I] 7.6 −3.4 ± 0.1 1
090110 6365.540 6365.507 [O I] 8.1 −3.4 ± 0.1 −2
090111 6365.540 6365.562 [O I] 7.4 −3.2 ± 0.1 1
090305 6365.540 6365.717 [O I] 5.5 −0.8 ± 0.1 8
090531 6365.540 6365.914 [O I] 5.5 −0.9 ± 0.1 18
081126−1 6549.850 6550.278 [N II] 3.0 −0.2 ± 0.1 20
081126−2 6549.850 6549.824 [N II] 3.1 −0.2 ± 0.1 −1
081126−3 6549.850 · · · [N II] · · · · · · · · ·
081127 6549.850 6550.045 [N II] 3.0 −0.1 ± 0.1 9
090106 6549.850 6550.119 [N II] 3.2 −0.4 ± 0.1 12
090110 6549.850 6549.875 [N II] 3.8 −0.4 ± 0.1 1
090111 6549.850 6549.924 [N II] 3.7 −0.3 ± 0.1 3
090305 6549.850 6549.632 [N II] 3.2 −0.3 ± 0.1 −10
090531 6549.850 6549.865 [N II] 3.1 −0.2 ± 0.1 1
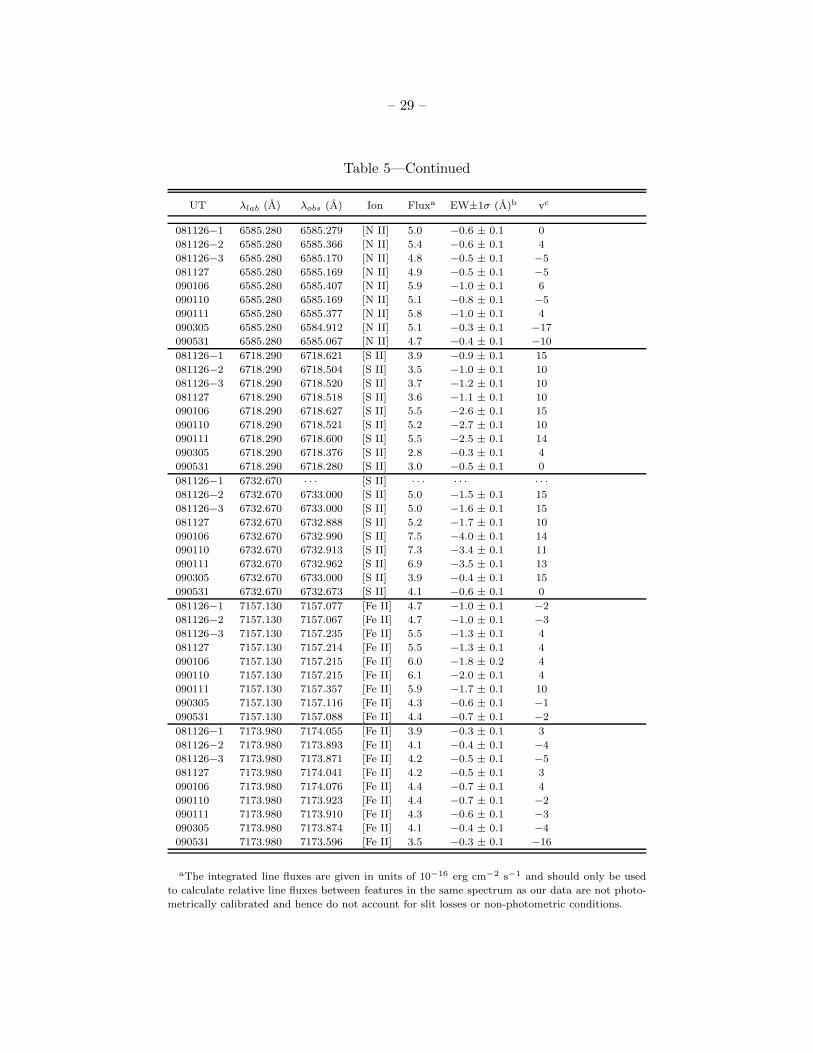
– 29 –
Table 5—Continued
UT λlab (A) λobs (A) Ion Fluxa EW±1σ (A)b vc
081126−1 6585.280 6585.279 [N II] 5.0 −0.6 ± 0.1 0
081126−2 6585.280 6585.366 [N II] 5.4 −0.6 ± 0.1 4
081126−3 6585.280 6585.170 [N II] 4.8 −0.5 ± 0.1 −5
081127 6585.280 6585.169 [N II] 4.9 −0.5 ± 0.1 −5
090106 6585.280 6585.407 [N II] 5.9 −1.0 ± 0.1 6
090110 6585.280 6585.169 [N II] 5.1 −0.8 ± 0.1 −5
090111 6585.280 6585.377 [N II] 5.8 −1.0 ± 0.1 4
090305 6585.280 6584.912 [N II] 5.1 −0.3 ± 0.1 −17
090531 6585.280 6585.067 [N II] 4.7 −0.4 ± 0.1 −10
081126−1 6718.290 6718.621 [S II] 3.9 −0.9 ± 0.1 15
081126−2 6718.290 6718.504 [S II] 3.5 −1.0 ± 0.1 10
081126−3 6718.290 6718.520 [S II] 3.7 −1.2 ± 0.1 10
081127 6718.290 6718.518 [S II] 3.6 −1.1 ± 0.1 10
090106 6718.290 6718.627 [S II] 5.5 −2.6 ± 0.1 15
090110 6718.290 6718.521 [S II] 5.2 −2.7 ± 0.1 10
090111 6718.290 6718.600 [S II] 5.5 −2.5 ± 0.1 14
090305 6718.290 6718.376 [S II] 2.8 −0.3 ± 0.1 4
090531 6718.290 6718.280 [S II] 3.0 −0.5 ± 0.1 0
081126−1 6732.670 · · · [S II] · · · · · · · · ·
081126−2 6732.670 6733.000 [S II] 5.0 −1.5 ± 0.1 15
081126−3 6732.670 6733.000 [S II] 5.0 −1.6 ± 0.1 15
081127 6732.670 6732.888 [S II] 5.2 −1.7 ± 0.1 10
090106 6732.670 6732.990 [S II] 7.5 −4.0 ± 0.1 14
090110 6732.670 6732.913 [S II] 7.3 −3.4 ± 0.1 11
090111 6732.670 6732.962 [S II] 6.9 −3.5 ± 0.1 13
090305 6732.670 6733.000 [S II] 3.9 −0.4 ± 0.1 15
090531 6732.670 6732.673 [S II] 4.1 −0.6 ± 0.1 0
081126−1 7157.130 7157.077 [Fe II] 4.7 −1.0 ± 0.1 −2
081126−2 7157.130 7157.067 [Fe II] 4.7 −1.0 ± 0.1 −3
081126−3 7157.130 7157.235 [Fe II] 5.5 −1.3 ± 0.1 4
081127 7157.130 7157.214 [Fe II] 5.5 −1.3 ± 0.1 4
090106 7157.130 7157.215 [Fe II] 6.0 −1.8 ± 0.2 4
090110 7157.130 7157.215 [Fe II] 6.1 −2.0 ± 0.1 4
090111 7157.130 7157.357 [Fe II] 5.9 −1.7 ± 0.1 10
090305 7157.130 7157.116 [Fe II] 4.3 −0.6 ± 0.1 −1
090531 7157.130 7157.088 [Fe II] 4.4 −0.7 ± 0.1 −2
081126−1 7173.980 7174.055 [Fe II] 3.9 −0.3 ± 0.1 3
081126−2 7173.980 7173.893 [Fe II] 4.1 −0.4 ± 0.1 −4
081126−3 7173.980 7173.871 [Fe II] 4.2 −0.5 ± 0.1 −5
081127 7173.980 7174.041 [Fe II] 4.2 −0.5 ± 0.1 3
090106 7173.980 7174.076 [Fe II] 4.4 −0.7 ± 0.1 4
090110 7173.980 7173.923 [Fe II] 4.4 −0.7 ± 0.1 −2
090111 7173.980 7173.910 [Fe II] 4.3 −0.6 ± 0.1 −3
090305 7173.980 7173.874 [Fe II] 4.1 −0.4 ± 0.1 −4
090531 7173.980 7173.596 [Fe II] 3.5 −0.3 ± 0.1 −16
aThe integrated line fluxes are given in units of 10−16 erg cm−2 s−1 and should only be used
to calculate relative line fluxes between features in the same spectrum as our data are not photo-
metrically calibrated and hence do not account for slit losses or non-photometric conditions.

– 30 –
bSome lines were measured by hand and have typical uncertainties of 0.5–3 A.
cThese velocities (km s−1) are not corrected to the stellar rest frame (12.3 ± 1.5 km s−1).
dThis line is blended or contaminated.
eThis line shows both blue- and red-shifted components. The position of the weaker line com-
ponent is reported but not the flux or EW.
fThis line has a p Cygni profile.

– 31 –
Table 6. Equivalent Widths of Selected Absorption Lines for TWA 30
UT λlab (A) λobs (A) Ion Fluxa EW±1σ (A) vb
081126−1 5330.014 5330.021 Fe I 1.8 0.6 ± 0.1 0
081126−2 5330.014 · · · Fe I · · · · · · · · ·
081126−3 5330.014 5329.688 Fe I 2.0 0.3 ± 0.1 −18
081127 5330.014 5329.742 Fe I 2.2 0.5 ± 0.1 −15
090106 5330.014 · · · Fe I · · · · · · · · ·
090110 5330.014 5329.991 Fe I 2.0 0.4 ± 0.1 −1
090111 5330.014 · · · Fe I · · · · · · · · ·
090305 5330.014 5329.659 Fe I 1.8 0.6 ± 0.1 −20
090531 5330.014 5329.668 Fe I 1.7 0.7 ± 0.1 −19
081126−1 5372.983 · · · Fe I · · · · · · · · ·
081126−2 5372.983 5373.160 Fe I 1.7 0.3 ± 0.1 10
081126−3 5372.983 5373.200 Fe I 1.8 0.6 ± 0.1 12
081127 5372.983 5373.262 Fe I 1.9 0.5 ± 0.1 16
090106 5372.983 · · · Fe I · · · · · · · · ·
090110 5372.983 · · · Fe I · · · · · · · · ·
090111 5372.983 · · · Fe I · · · · · · · · ·
090305 5372.983 5373.091 Fe I 1.6 0.4 ± 0.1 6
090531 5372.983 5373.176 Fe I 1.9 0.5 ± 0.1 11
081126−1 5398.629 5398.770 Fe I 1.6 0.4 ± 0.1 8
081126−2 5398.629 · · · Fe I · · · · · · · · ·
081126−3 5398.629 · · · Fe I · · · · · · · · ·
081127 5398.629 · · · Fe I · · · · · · · · ·
090106 5398.629 · · · Fe I · · · · · · · · ·
090110 5398.629 · · · Fe I · · · · · · · · ·
090111 5398.629 5398.521 Fe I 1.9 0.5 ± 0.1 −6
090305 5398.629 5398.597 Fe I 1.6 0.4 ± 0.1 −2
090531 5398.629 · · · Fe I · · · · · · · · ·
081126−1 5407.278 · · · Fe I · · · · · · · · ·
081126−2 5407.278 · · · Fe I · · · · · · · · ·
081126−3 5407.278 · · · Fe I · · · · · · · · ·
081127 5407.278 5407.324 Fe I 2.1 0.3 ± 0.1 3
090106 5407.278 · · · Fe I · · · · · · · · ·
090110 5407.278 5407.136 Fe I 2.5 0.3 ± 0.1 −8
090111 5407.278 · · · Fe I · · · · · · · · ·
090305 5407.278 5407.266 Fe I 2.0 0.4 ± 0.1 −1
090531 5407.278 5407.266 Fe I 2.0 0.4 ± 0.1 −1
081126−1 5411.276 5411.733 Cr I 2.5 0.3 ± 0.1 25
081126−2 5411.276 5411.443 Cr I 2.3 0.5 ± 0.1 9
081126−3 5411.276 · · · Cr I · · · · · · · · ·
081127 5411.276 5411.307 Cr I 2.4 0.3 ± 0.1 2
090106 5411.276 · · · Cr I · · · · · · · · ·
090110 5411.276 5411.713 Cr I 2.3 0.5 ± 0.1 24
090111 5411.276 · · · Cr I · · · · · · · · ·
090305 5411.276 · · · Cr I · · · · · · · · ·
090531 5411.276 · · · Cr I · · · · · · · · ·
081126−1 6123.912 6124.077 Ca I 2.6 0.5 ± 0.1 8
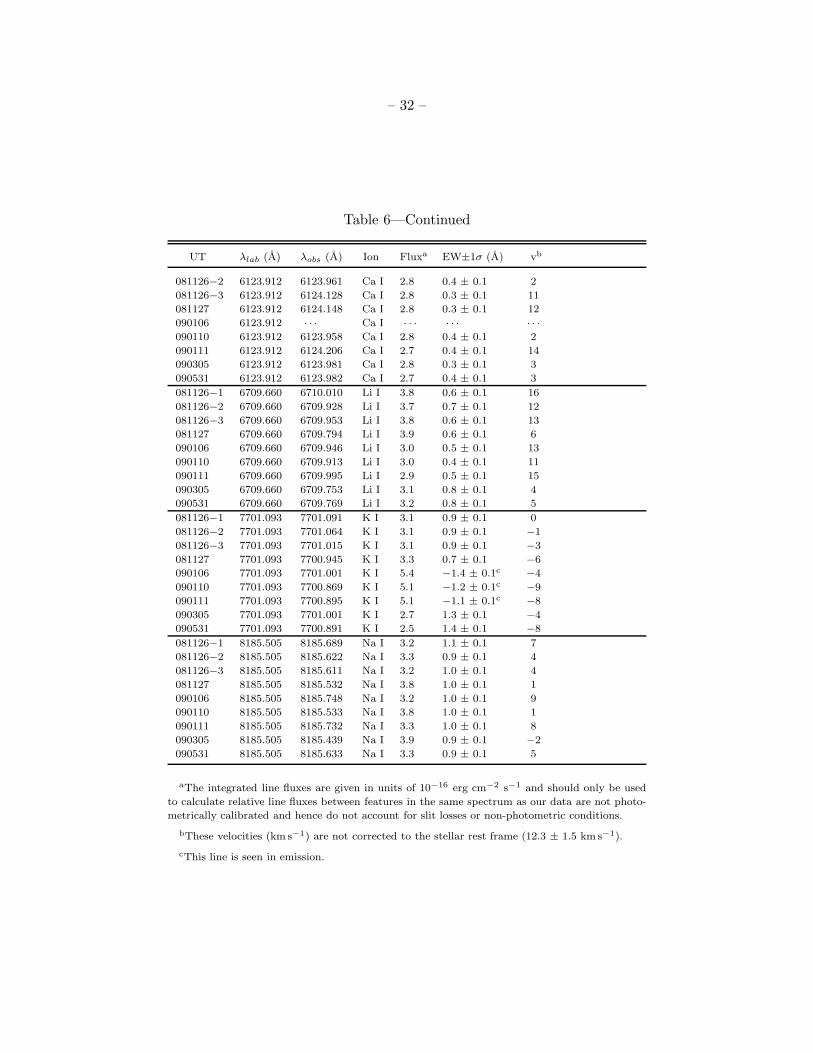
– 32 –
Table 6—Continued
UT λlab (A) λobs (A) Ion Fluxa EW±1σ (A) vb
081126−2 6123.912 6123.961 Ca I 2.8 0.4 ± 0.1 2
081126−3 6123.912 6124.128 Ca I 2.8 0.3 ± 0.1 11
081127 6123.912 6124.148 Ca I 2.8 0.3 ± 0.1 12
090106 6123.912 · · · Ca I · · · · · · · · ·
090110 6123.912 6123.958 Ca I 2.8 0.4 ± 0.1 2
090111 6123.912 6124.206 Ca I 2.7 0.4 ± 0.1 14
090305 6123.912 6123.981 Ca I 2.8 0.3 ± 0.1 3
090531 6123.912 6123.982 Ca I 2.7 0.4 ± 0.1 3
081126−1 6709.660 6710.010 Li I 3.8 0.6 ± 0.1 16
081126−2 6709.660 6709.928 Li I 3.7 0.7 ± 0.1 12
081126−3 6709.660 6709.953 Li I 3.8 0.6 ± 0.1 13
081127 6709.660 6709.794 Li I 3.9 0.6 ± 0.1 6
090106 6709.660 6709.946 Li I 3.0 0.5 ± 0.1 13
090110 6709.660 6709.913 Li I 3.0 0.4 ± 0.1 11
090111 6709.660 6709.995 Li I 2.9 0.5 ± 0.1 15
090305 6709.660 6709.753 Li I 3.1 0.8 ± 0.1 4
090531 6709.660 6709.769 Li I 3.2 0.8 ± 0.1 5
081126−1 7701.093 7701.091 K I 3.1 0.9 ± 0.1 0
081126−2 7701.093 7701.064 K I 3.1 0.9 ± 0.1 −1
081126−3 7701.093 7701.015 K I 3.1 0.9 ± 0.1 −3
081127 7701.093 7700.945 K I 3.3 0.7 ± 0.1 −6
090106 7701.093 7701.001 K I 5.4 −1.4 ± 0.1c −4
090110 7701.093 7700.869 K I 5.1 −1.2 ± 0.1c −9
090111 7701.093 7700.895 K I 5.1 −1.1 ± 0.1c −8
090305 7701.093 7701.001 K I 2.7 1.3 ± 0.1 −4
090531 7701.093 7700.891 K I 2.5 1.4 ± 0.1 −8
081126−1 8185.505 8185.689 Na I 3.2 1.1 ± 0.1 7
081126−2 8185.505 8185.622 Na I 3.3 0.9 ± 0.1 4
081126−3 8185.505 8185.611 Na I 3.2 1.0 ± 0.1 4
081127 8185.505 8185.532 Na I 3.8 1.0 ± 0.1 1
090106 8185.505 8185.748 Na I 3.2 1.0 ± 0.1 9
090110 8185.505 8185.533 Na I 3.8 1.0 ± 0.1 1
090111 8185.505 8185.732 Na I 3.3 1.0 ± 0.1 8
090305 8185.505 8185.439 Na I 3.9 0.9 ± 0.1 −2
090531 8185.505 8185.633 Na I 3.3 0.9 ± 0.1 5
aThe integrated line fluxes are given in units of 10−16 erg cm−2 s−1 and should only be used
to calculate relative line fluxes between features in the same spectrum as our data are not photo-
metrically calibrated and hence do not account for slit losses or non-photometric conditions.
bThese velocities (km s−1) are not corrected to the stellar rest frame (12.3 ± 1.5 km s−1).
cThis line is seen in emission.
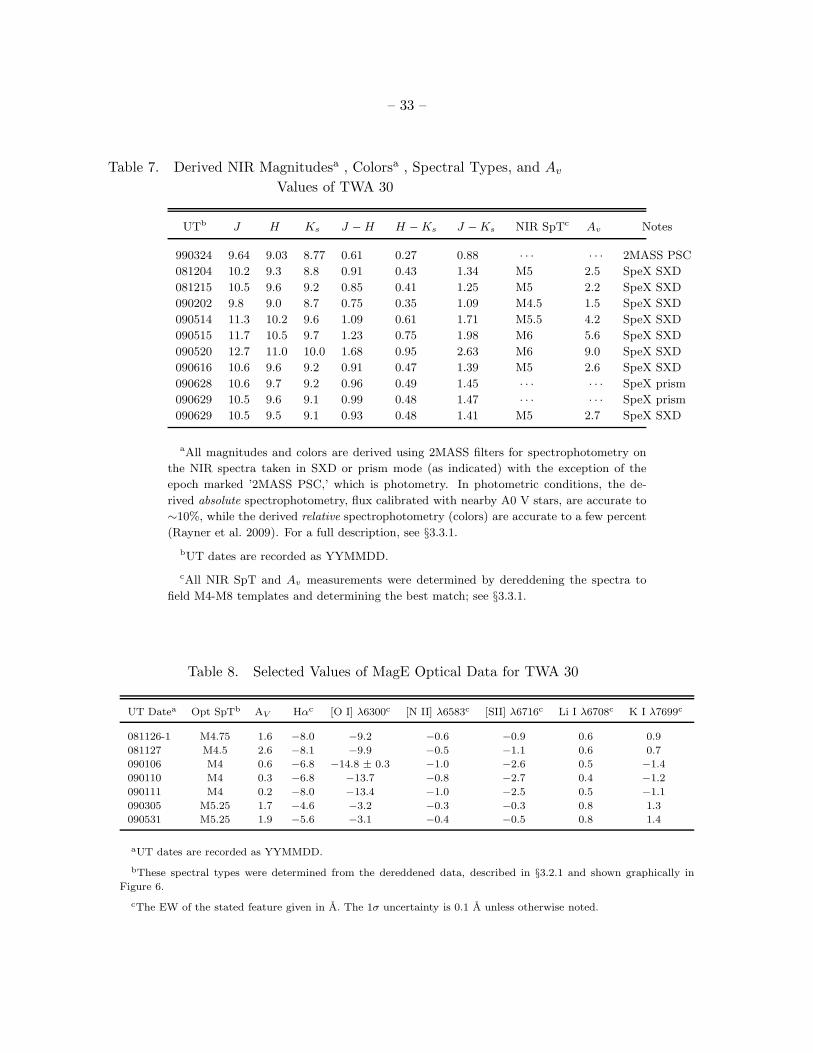
– 33 –
Table 7. Derived NIR Magnitudesa , Colorsa , Spectral Types, and Av
Values of TWA 30
UTb J H Ks J −H H −Ks J −Ks NIR SpTc Av Notes
990324 9.64 9.03 8.77 0.61 0.27 0.88 · · · · · · 2MASS PSC
081204 10.2 9.3 8.8 0.91 0.43 1.34 M5 2.5 SpeX SXD
081215 10.5 9.6 9.2 0.85 0.41 1.25 M5 2.2 SpeX SXD
090202 9.8 9.0 8.7 0.75 0.35 1.09 M4.5 1.5 SpeX SXD
090514 11.3 10.2 9.6 1.09 0.61 1.71 M5.5 4.2 SpeX SXD
090515 11.7 10.5 9.7 1.23 0.75 1.98 M6 5.6 SpeX SXD
090520 12.7 11.0 10.0 1.68 0.95 2.63 M6 9.0 SpeX SXD
090616 10.6 9.6 9.2 0.91 0.47 1.39 M5 2.6 SpeX SXD
090628 10.6 9.7 9.2 0.96 0.49 1.45 · · · · · · SpeX prism
090629 10.5 9.6 9.1 0.99 0.48 1.47 · · · · · · SpeX prism
090629 10.5 9.5 9.1 0.93 0.48 1.41 M5 2.7 SpeX SXD
aAll magnitudes and colors are derived using 2MASS filters for spectrophotometry on
the NIR spectra taken in SXD or prism mode (as indicated) with the exception of the
epoch marked ’2MASS PSC,’ which is photometry. In photometric conditions, the de-
rived absolute spectrophotometry, flux calibrated with nearby A0 V stars, are accurate to
∼10%, while the derived relative spectrophotometry (colors) are accurate to a few percent
(Rayner et al. 2009). For a full description, see §3.3.1.
bUT dates are recorded as YYMMDD.
cAll NIR SpT and Av measurements were determined by dereddening the spectra to
field M4-M8 templates and determining the best match; see §3.3.1.
Table 8. Selected Values of MagE Optical Data for TWA 30
UT Datea Opt SpTb AV Hαc [O I] λ6300c [N II] λ6583c [SII] λ6716c Li I λ6708c K I λ7699c
081126-1 M4.75 1.6 −8.0 −9.2 −0.6 −0.9 0.6 0.9
081127 M4.5 2.6 −8.1 −9.9 −0.5 −1.1 0.6 0.7
090106 M4 0.6 −6.8 −14.8 ± 0.3 −1.0 −2.6 0.5 −1.4
090110 M4 0.3 −6.8 −13.7 −0.8 −2.7 0.4 −1.2
090111 M4 0.2 −8.0 −13.4 −1.0 −2.5 0.5 −1.1
090305 M5.25 1.7 −4.6 −3.2 −0.3 −0.3 0.8 1.3
090531 M5.25 1.9 −5.6 −3.1 −0.4 −0.5 0.8 1.4
aUT dates are recorded as YYMMDD.
bThese spectral types were determined from the dereddened data, described in §3.2.1 and shown graphically in
Figure 6.
cThe EW of the stated feature given in A. The 1σ uncertainty is 0.1 A unless otherwise noted.
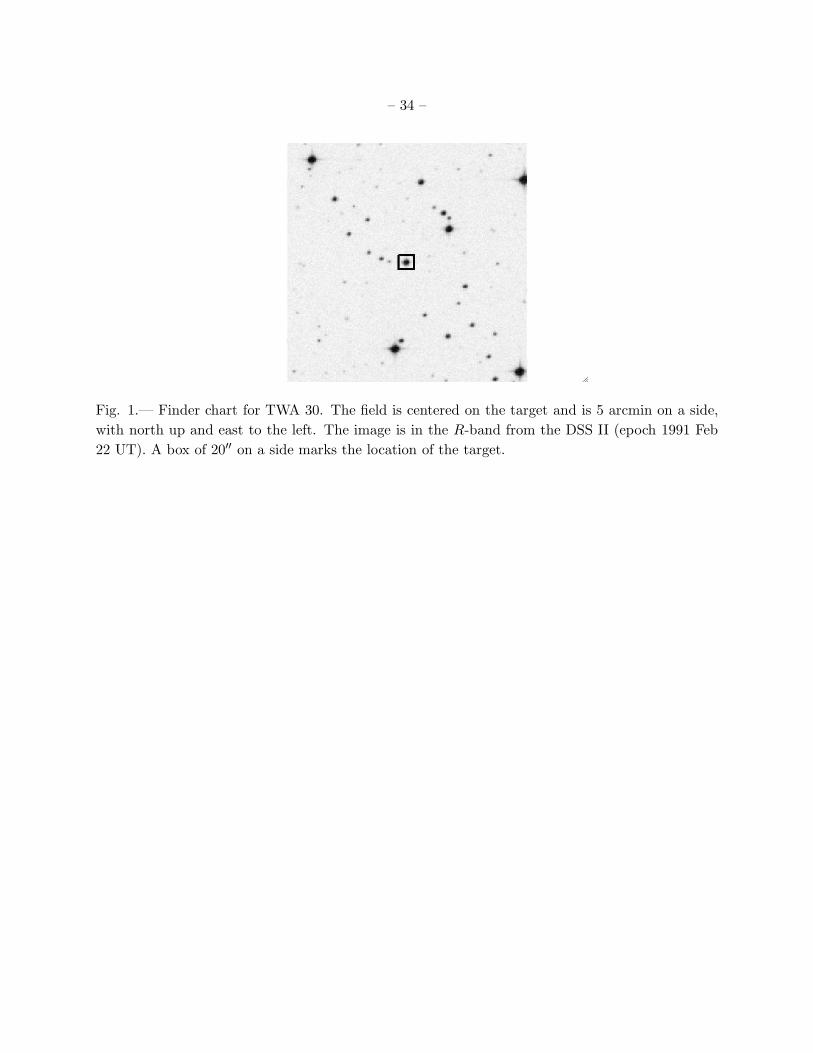
– 34 –
Fig. 1.— Finder chart for TWA 30. The field is centered on the target and is 5 arcmin on a side,
with north up and east to the left. The image is in the R-band from the DSS II (epoch 1991 Feb
22 UT). A box of 20′′ on a side marks the location of the target.
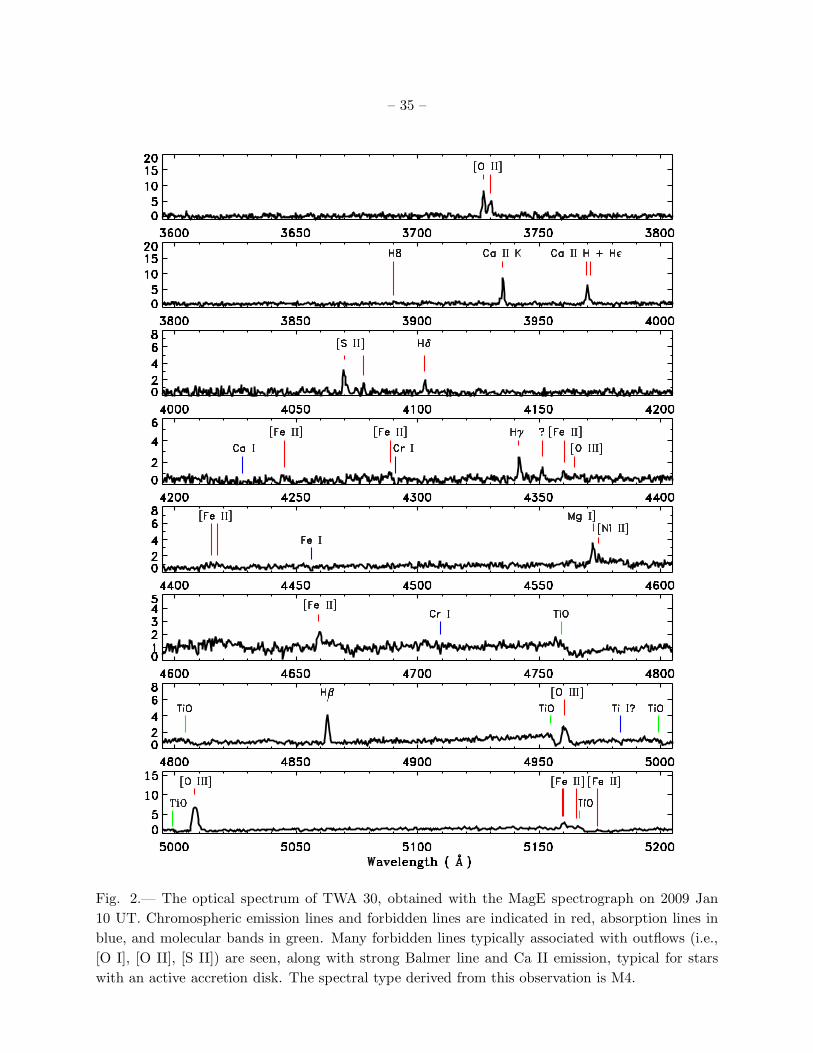
– 35 –
Fig. 2.— The optical spectrum of TWA 30, obtained with the MagE spectrograph on 2009 Jan
10 UT. Chromospheric emission lines and forbidden lines are indicated in red, absorption lines in
blue, and molecular bands in green. Many forbidden lines typically associated with outflows (i.e.,
[O I], [O II], [S II]) are seen, along with strong Balmer line and Ca II emission, typical for stars
with an active accretion disk. The spectral type derived from this observation is M4.
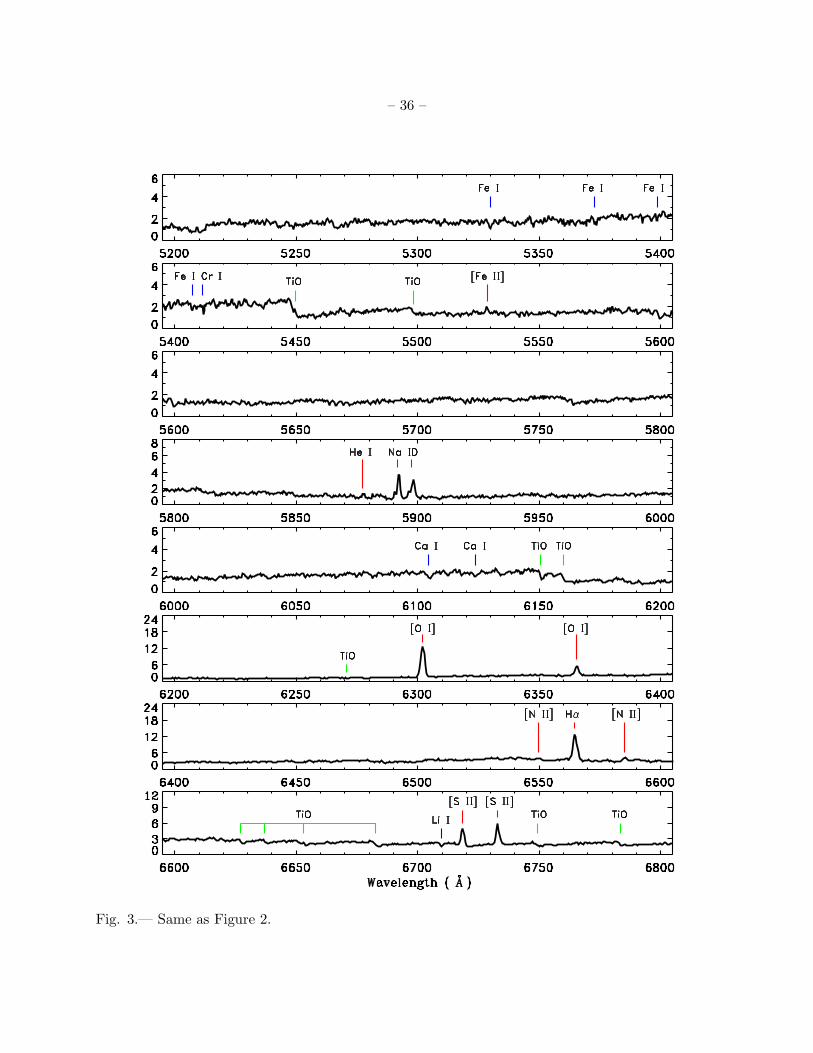
– 36 –
Fig. 3.— Same as Figure 2.
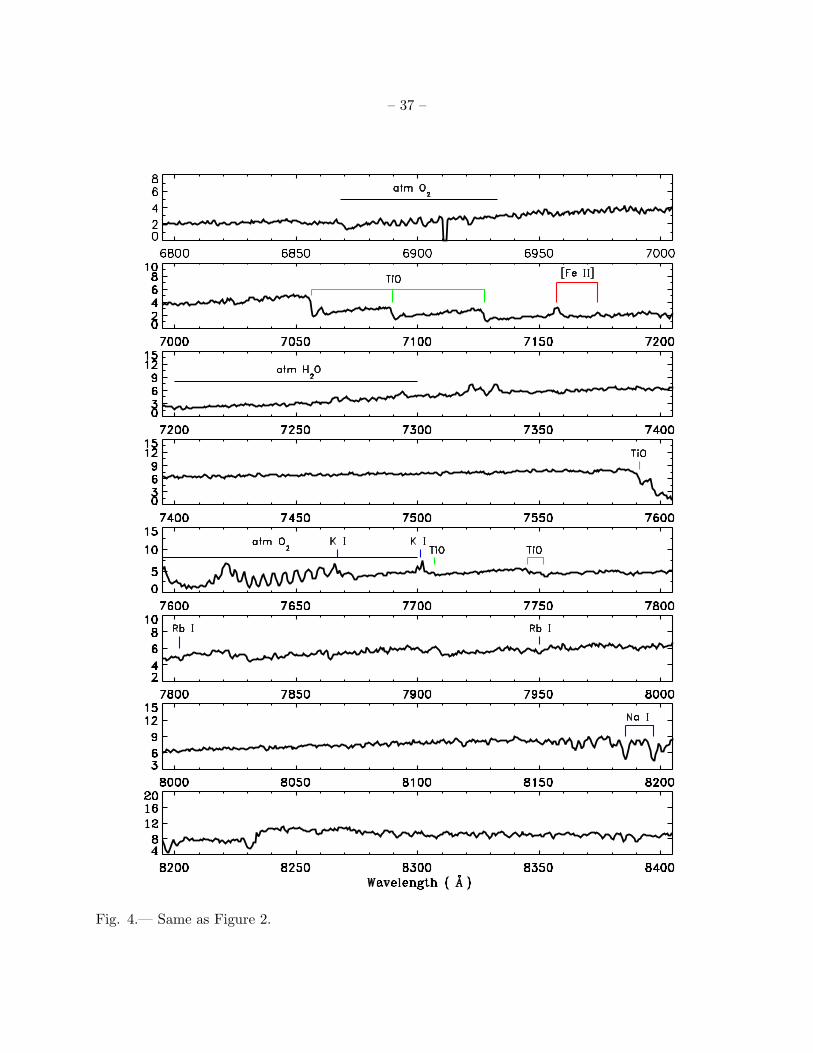
– 37 –
Fig. 4.— Same as Figure 2.
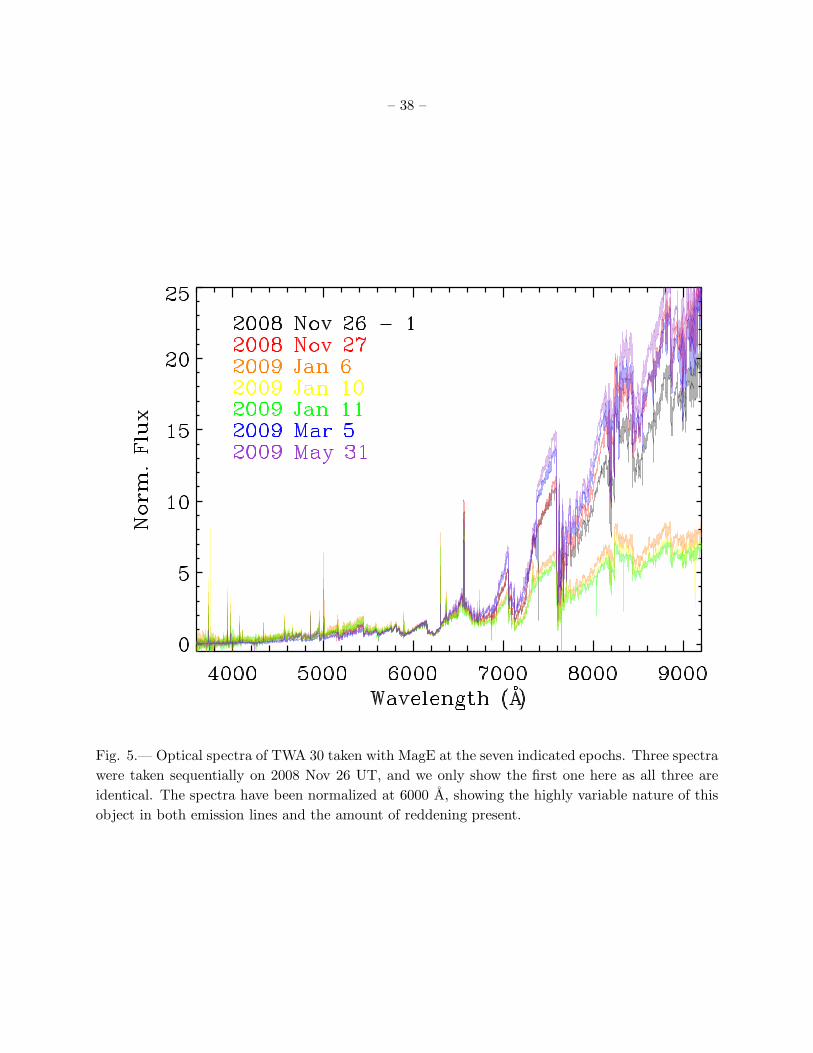
– 38 –
Fig. 5.— Optical spectra of TWA 30 taken with MagE at the seven indicated epochs. Three spectra
were taken sequentially on 2008 Nov 26 UT, and we only show the first one here as all three are
identical. The spectra have been normalized at 6000 A, showing the highly variable nature of this
object in both emission lines and the amount of reddening present.
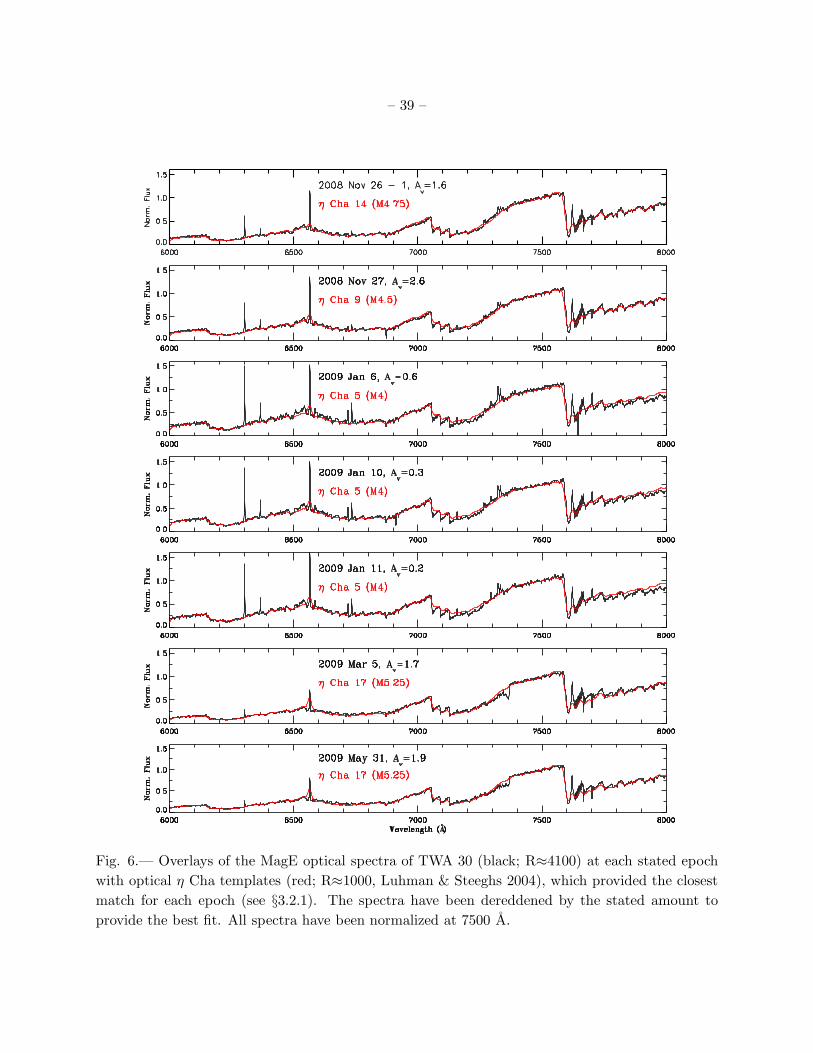
– 39 –
Fig. 6.— Overlays of the MagE optical spectra of TWA 30 (black; R≈4100) at each stated epoch
with optical η Cha templates (red; R≈1000, Luhman & Steeghs 2004), which provided the closest
match for each epoch (see §3.2.1). The spectra have been dereddened by the stated amount to
provide the best fit. All spectra have been normalized at 7500 A.
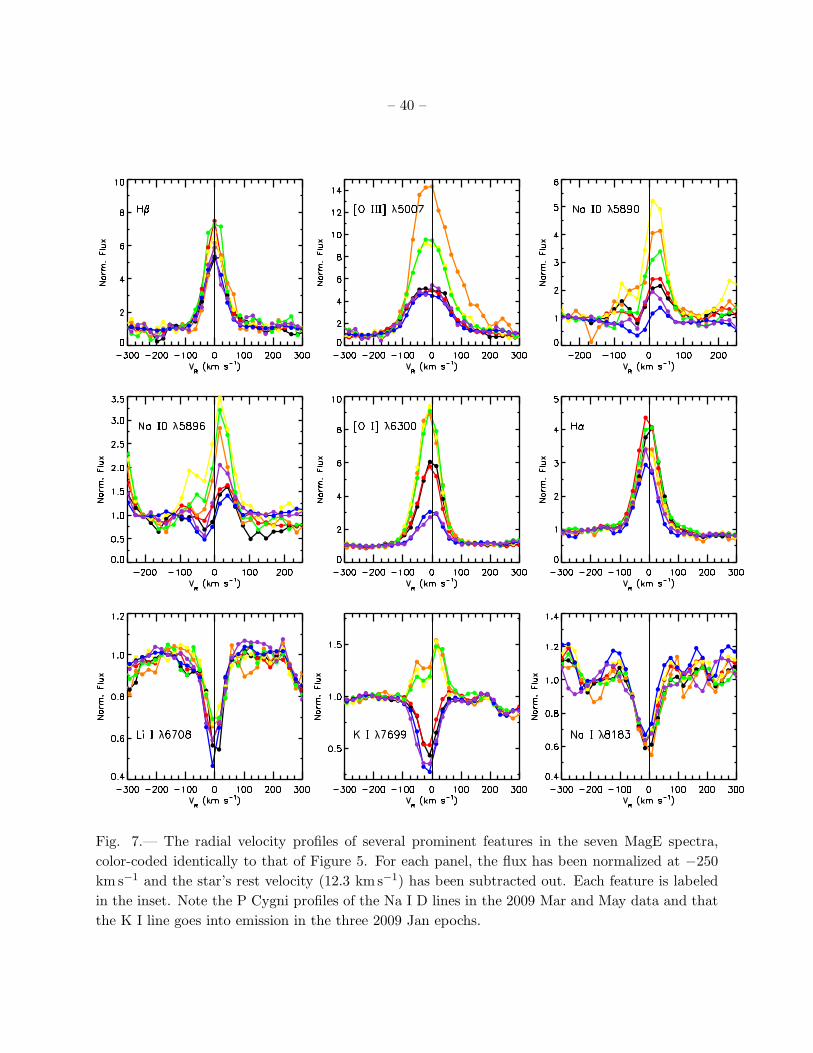
– 40 –
Fig. 7.— The radial velocity profiles of several prominent features in the seven MagE spectra,
color-coded identically to that of Figure 5. For each panel, the flux has been normalized at −250
km s−1 and the star’s rest velocity (12.3 kms−1) has been subtracted out. Each feature is labeled
in the inset. Note the P Cygni profiles of the Na I D lines in the 2009 Mar and May data and that
the K I line goes into emission in the three 2009 Jan epochs.
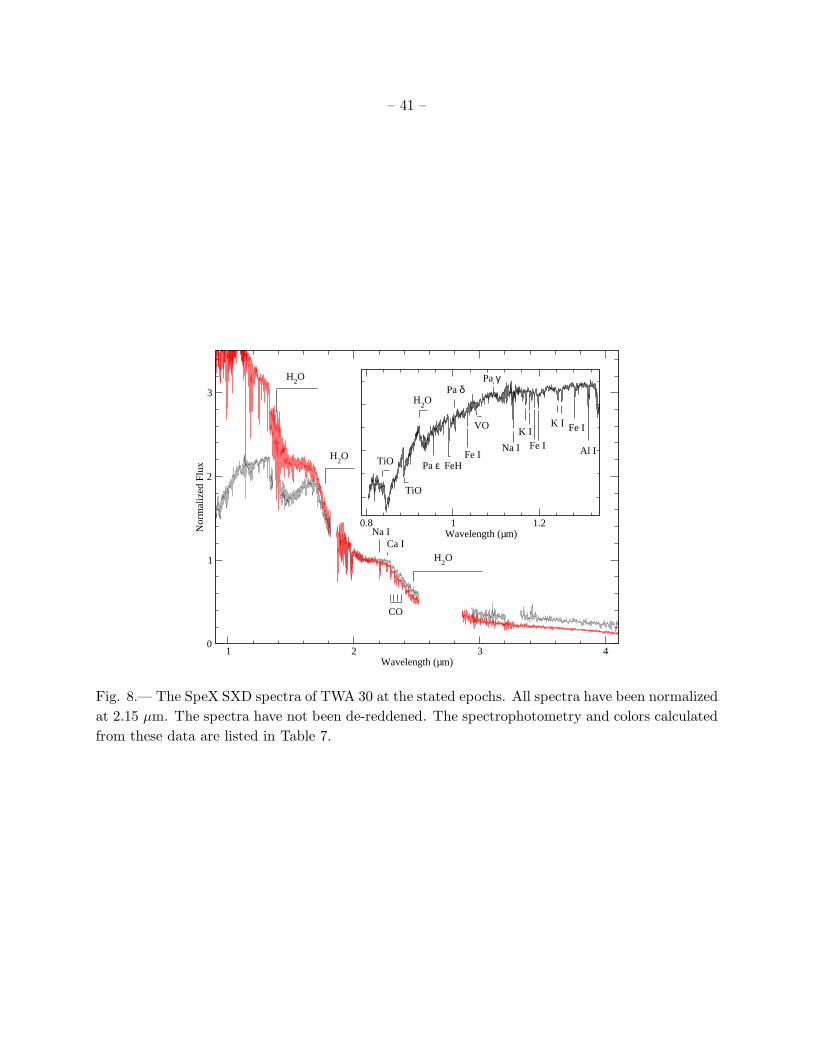
– 41 –
1 2 3 4Wavelength (µm)
0
1
2
3
Nor
mal
ized
Flu
x
0.8 1 1.2Wavelength (µm)
H2O
H2O
H2O
H2O
TiO
TiO
FeH
Na I
CO
Fe I
VO
Na I
K IFe I
K I Fe I
Al I
Ca I
Pa ε
Pa δPa γ
Fig. 8.— The SpeX SXD spectra of TWA 30 at the stated epochs. All spectra have been normalized
at 2.15 µm. The spectra have not been de-reddened. The spectrophotometry and colors calculated
from these data are listed in Table 7.
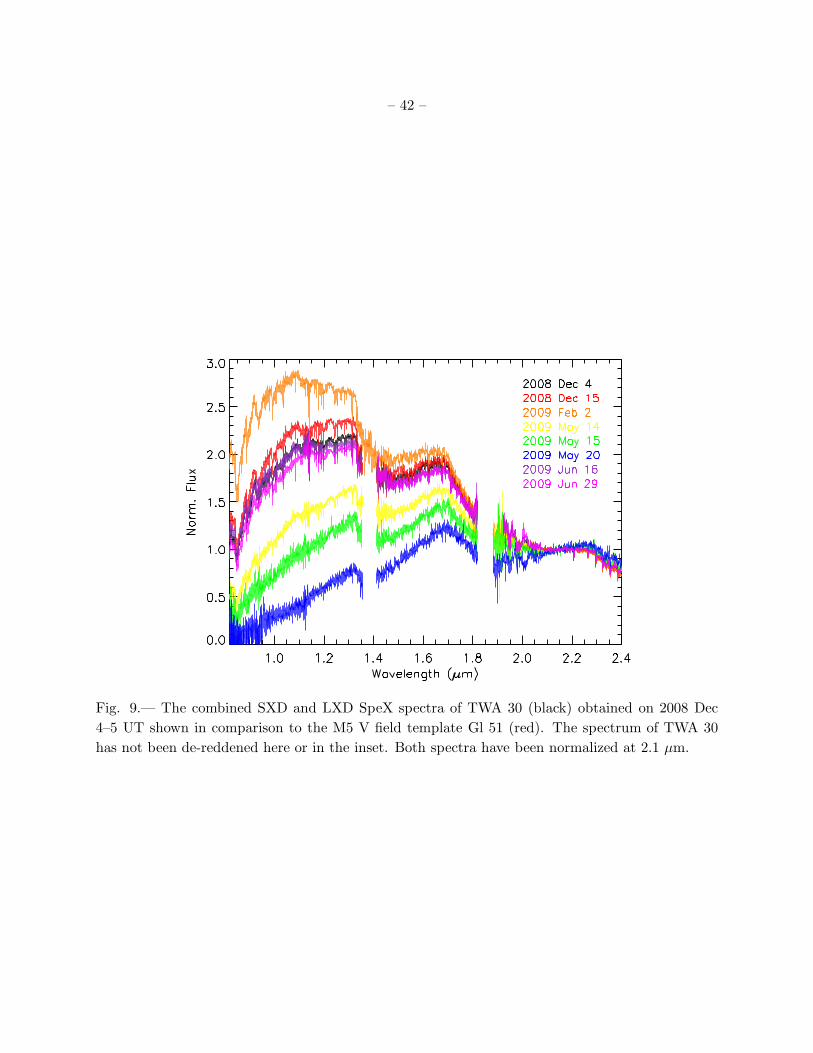
– 42 –
Fig. 9.— The combined SXD and LXD SpeX spectra of TWA 30 (black) obtained on 2008 Dec
4–5 UT shown in comparison to the M5 V field template Gl 51 (red). The spectrum of TWA 30
has not been de-reddened here or in the inset. Both spectra have been normalized at 2.1 µm.
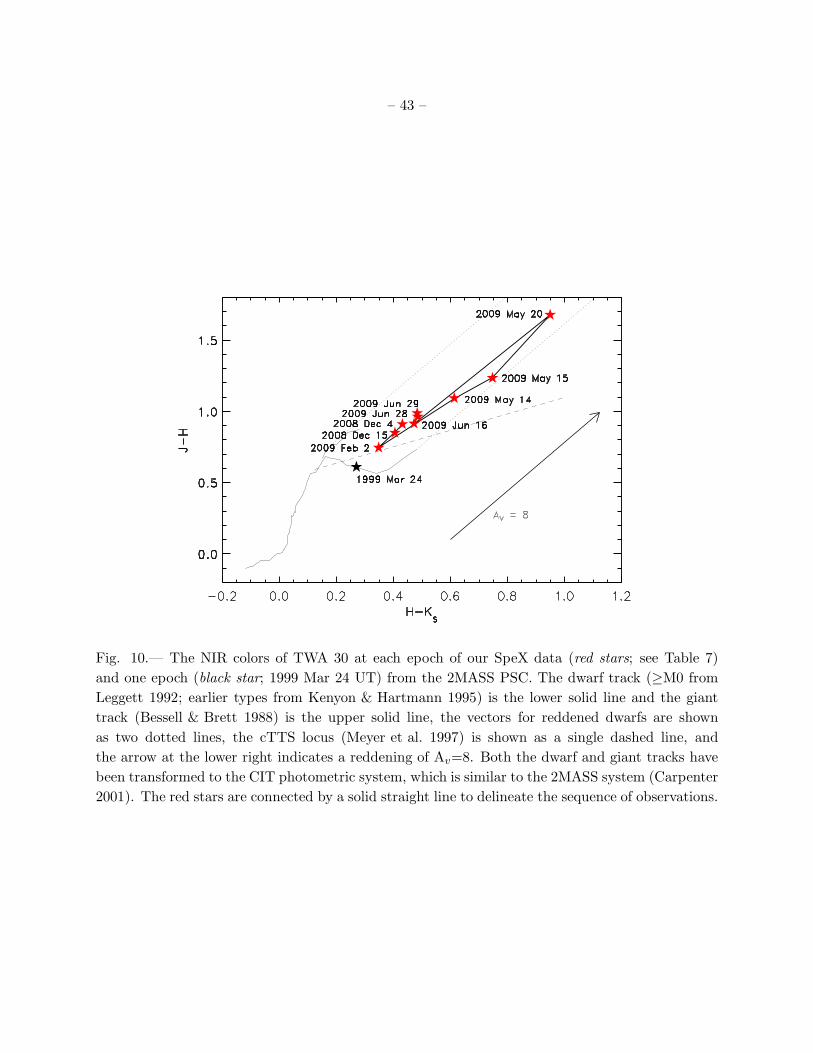
– 43 –
Fig. 10.— The NIR colors of TWA 30 at each epoch of our SpeX data (red stars; see Table 7)
and one epoch (black star; 1999 Mar 24 UT) from the 2MASS PSC. The dwarf track (≥M0 from
Leggett 1992; earlier types from Kenyon & Hartmann 1995) is the lower solid line and the giant
track (Bessell & Brett 1988) is the upper solid line, the vectors for reddened dwarfs are shown
as two dotted lines, the cTTS locus (Meyer et al. 1997) is shown as a single dashed line, and
the arrow at the lower right indicates a reddening of Av=8. Both the dwarf and giant tracks have
been transformed to the CIT photometric system, which is similar to the 2MASS system (Carpenter
2001). The red stars are connected by a solid straight line to delineate the sequence of observations.
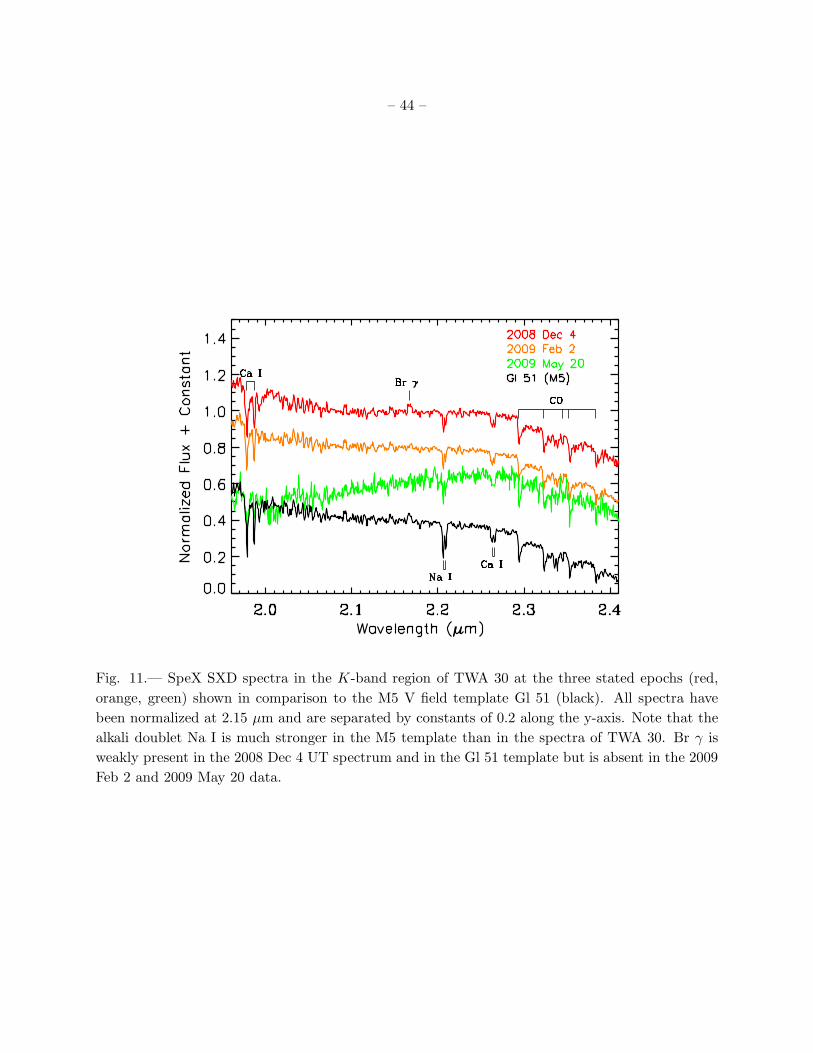
– 44 –
Fig. 11.— SpeX SXD spectra in the K-band region of TWA 30 at the three stated epochs (red,
orange, green) shown in comparison to the M5 V field template Gl 51 (black). All spectra have
been normalized at 2.15 µm and are separated by constants of 0.2 along the y-axis. Note that the
alkali doublet Na I is much stronger in the M5 template than in the spectra of TWA 30. Br γ is
weakly present in the 2008 Dec 4 UT spectrum and in the Gl 51 template but is absent in the 2009
Feb 2 and 2009 May 20 data.
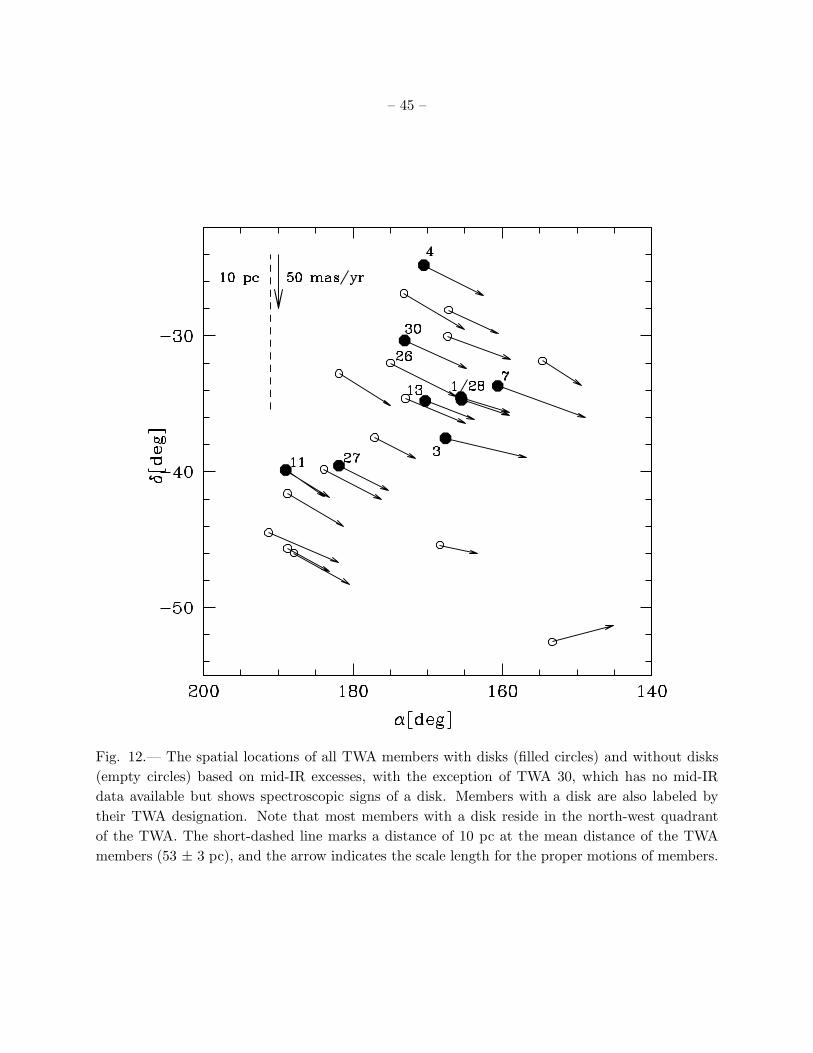
– 45 –
Fig. 12.— The spatial locations of all TWA members with disks (filled circles) and without disks
(empty circles) based on mid-IR excesses, with the exception of TWA 30, which has no mid-IR
data available but shows spectroscopic signs of a disk. Members with a disk are also labeled by
their TWA designation. Note that most members with a disk reside in the north-west quadrant
of the TWA. The short-dashed line marks a distance of 10 pc at the mean distance of the TWA
members (53 ± 3 pc), and the arrow indicates the scale length for the proper motions of members.
– 46 –
REFERENCES
Adams, F. C., Lada, C. J., & Shu, F. H. 1987, ApJ, 312, 788
Alexander, R. D., & Armitage, P. J. 2006, ApJ, 639, L83
Appenzeller, I., & Mundt, R. 1989, A&A Rev., 1, 291
Baraffe, I., Chabrier, G., Allard, F., & Hauschildt, P. H. 1998, A&A, 337, 403
Barrado y Navascues, D. 2006, A&A, 459, 511
Bernstein, R., Shectman, S. A., Gunnels, S. M., Mochnacki, S., & Athey, A. E. 2003, in Society
of Photo-Optical Instrumentation Engineers (SPIE) Conference Series, Vol. 4841, Society of
Photo-Optical Instrumentation Engineers (SPIE) Conference Series, ed. M. Iye & A. F. M.
Moorwood, 1694–1704
Bessell, M. S., & Brett, J. M. 1988, PASP, 100, 1134
Biller, B. A., & Close, L. M. 2007, ApJ, 669, L41
Bochanski, J. J., et al. 2009, PASP, 121, 1409
Bochanski, J. J., West, A. A., Hawley, S. L., & Covey, K. R. 2007, AJ, 133, 531
Bohm, K.-H. 1995, Ap&SS, 233, 11
Bourke, T. L., Crapsi, A., Myers, P. C., Evans, II, N. J., Wilner, D. J., Huard, T. L., Jørgensen,
J. K., & Young, C. H. 2005, ApJ, 633, L129
Bouvier, J., et al. 2007, A&A, 463, 1017
—. 1999, A&A, 349, 619
—. 2003, A&A, 409, 169
Brandeker, A., Jayawardhana, R., & Najita, J. 2003, AJ, 126, 2009
Calvet, N., Muzerolle, J., Briceno, C., Hernandez, J., Hartmann, L., Saucedo, J. L., & Gordon,
K. D. 2004, AJ, 128, 1294
Cardelli, J. A., Clayton, G. C., & Mathis, J. S. 1989, ApJ, 345, 245
Carpenter, J. M. 2001, AJ, 121, 2851
Chabrier, G., & Baraffe, I. 2000, ARA&A, 38, 337
Chambers, J. E. 2004, Earth and Planetary Science Letters, 223, 241
– 47 –
Chauvin, G., Lagrange, A.-M., Dumas, C., Zuckerman, B., Mouillet, D., Song, I., Beuzit, J.-L., &
Lowrance, P. 2004, A&A, 425, L29
Cruz, K. L., Kirkpatrick, J. D., & Burgasser, A. J. 2009, AJ, 137, 3345
Cushing, M. C., Vacca, W. D., & Rayner, J. T. 2004, PASP, 116, 362
Cutri, R. M., et al. 2003, VizieR Online Data Catalog, 2246, 0
de la Reza, R., Torres, C. A. O., Quast, G., Castilho, B. V., & Vieira, G. L. 1989, ApJ, 343, L61
Delfosse, X., Forveille, T., Perrier, C., & Mayor, M. 1998, A&A, 331, 581
Ducourant, C., Teixeira, R., Chauvin, G., Daigne, G., Le Campion, J.-F., Song, I., & Zuckerman,
B. 2008, A&A, 477, L1
Edwards, S. 2007, in IAU Symposium, Vol. 243, IAU Symposium, ed. J. Bouvier & I. Appenzeller,
171–182
Edwards, S., Fischer, W., Kwan, J., Hillenbrand, L., & Dupree, A. K. 2003, ApJ, 599, L41
Enoch, M. L., Evans, II, N. J., Sargent, A. I., Glenn, J., Rosolowsky, E., & Myers, P. 2008, ApJ,
684, 1240
Epchtein, N., et al. 1997, The Messenger, 87, 27
Ercolano, B., Drake, J. J., Raymond, J. C., & Clarke, C. C. 2008, ApJ, 688, 398
Fedele, D., van den Ancker, M. E., Henning, T., Jayawardhana, R., & Oliveira, J. M. 2009, ArXiv
e-prints
Fernandez, M., & Comeron, F. 2001, A&A, 380, 264
Finch, C. T., Zacharias, N., & Wycoff, G. L. 2010, ArXiv e-prints
Fleming, T. A., Schmitt, J. H. M. M., & Giampapa, M. S. 1995, ApJ, 450, 401
Gizis, J. E. 2002, ApJ, 575, 484
Gizis, J. E., Jao, W.-C., Subasavage, J. P., & Henry, T. J. 2007, ApJ, 669, L45
Golimowski, D. A., et al. 2004, AJ, 127, 3516
Gregorio-Hetem, J., Lepine, J. R. D., Quast, G. R., Torres, C. A. O., & de La Reza, R. 1992, AJ,
103, 549
Gudel, M., et al. 2007, A&A, 468, 353
Hambly, N. C., Davenhall, A. C., Irwin, M. J., & MacGillivray, H. T. 2001a, MNRAS, 326, 1315
– 48 –
Hambly, N. C., Irwin, M. J., & MacGillivray, H. T. 2001b, MNRAS, 326, 1295
Hambly, N. C., et al. 2001c, MNRAS, 326, 1279
Hartigan, P. 1989, ApJ, 339, 987
Hartigan, P., Edwards, S., & Ghandour, L. 1995, ApJ, 452, 736
Hartmann, L. 1998, Accretion Processes in Star Formation, ed. L. Hartmann
Henize, K. G. 1976, ApJS, 30, 491
Herbig, G. H. 1978, Can Post-T Tauri Stars Be Found? (Problems of Physics and Evolution of the
Universe), 171–+
—. 1990, ApJ, 360, 639
Herczeg, G. J., Cruz, K. L., & Hillenbrand, L. A. 2009, ApJ, 696, 1589
Herczeg, G. J., & Hillenbrand, L. A. 2008, ApJ, 681, 594
Hirth, G. A., Mundt, R., & Solf, J. 1997, A&AS, 126, 437
Jayawardhana, R., Hartmann, L., Fazio, G., Fisher, R. S., Telesco, C. M., & Pina, R. K. 1999,
ApJ, 521, L129
Johns, C. M., & Basri, G. 1995, ApJ, 449, 341
Johnson, D. R. H., & Soderblom, D. R. 1987, AJ, 93, 864
Kaminski, T., Schmidt, M., Tylenda, R., Konacki, M., & Gromadzki, M. 2009, ApJS, 182, 33
Kastner, J. H., Zuckerman, B., Weintraub, D. A., & Forveille, T. 1997, Science, 277, 67
Kenyon, S. J., & Hartmann, L. 1995, ApJS, 101, 117
Kirkpatrick, J. D., Barman, T. S., Burgasser, A. J., McGovern, M. R., McLean, I. S., Tinney,
C. G., & Lowrance, P. J. 2006, ApJ, 639, 1120
Kirkpatrick, J. D., Henry, T. J., & McCarthy, Jr., D. W. 1991, ApJS, 77, 417
Kwan, J., Edwards, S., & Fischer, W. 2007, ApJ, 657, 897
Lawson, W. A., & Crause, L. A. 2005, MNRAS, 357, 1399
Lawson, W. A., Crause, L. A., Mamajek, E. E., & Feigelson, E. D. 2001, MNRAS, 321, 57
Leggett, S. K. 1992, ApJS, 82, 351
Looper, D. L., Burgasser, A. J., Kirkpatrick, J. D., & Swift, B. J. 2007, ApJ, 669, L97
– 49 –
Low, F. J., Smith, P. S., Werner, M., Chen, C., Krause, V., Jura, M., & Hines, D. C. 2005, ApJ,
631, 1170
Luhman, K. L. 1999, ApJ, 525, 466
—. 2004, ApJ, 616, 1033
Luhman, K. L., & Muench, A. A. 2008, ApJ, 684, 654
Luhman, K. L., Stauffer, J. R., Muench, A. A., Rieke, G. H., Lada, E. A., Bouvier, J., & Lada,
C. J. 2003, ApJ, 593, 1093
Luhman, K. L., & Steeghs, D. 2004, ApJ, 609, 917
Mamajek, E. E. 2005, ApJ, 634, 1385
Mamajek, E. E., Lawson, W. A., & Feigelson, E. D. 1999, ApJ, 516, L77
Marshall, J. L., et al. 2008, in Society of Photo-Optical Instrumentation Engineers (SPIE) Confer-
ence Series, Vol. 7014, Society of Photo-Optical Instrumentation Engineers (SPIE) Confer-
ence Series
Martın, E. L., Basri, G., & Zapatero Osorio, M. R. 1999, AJ, 118, 1005
Masciadri, E., & Raga, A. C. 2004, ApJ, 615, 850
Meyer, M. R., Calvet, N., & Hillenbrand, L. A. 1997, AJ, 114, 288
Mohanty, S., & Basri, G. 2003, ApJ, 583, 451
Mohanty, S., Jayawardhana, R., & Barrado y Navascues, D. 2003, ApJ, 593, L109
Mohanty, S., Jayawardhana, R., & Basri, G. 2005, ApJ, 626, 498
Monet, D., & et al. 1998, VizieR Online Data Catalog, 1252, 0
Monet, D. G., et al. 2003, AJ, 125, 984
Morrow, A. L., et al. 2008, ApJ, 676, L143
Murray, C. A. 1989, A&A, 218, 325
Muzerolle, J., Hillenbrand, L., Calvet, N., Briceno, C., & Hartmann, L. 2003, ApJ, 592, 266
Muzerolle, J., Hillenbrand, L., Calvet, N., Hartmann, L., & Briceno, C. 2001, in Astronomical
Society of the Pacific Conference Series, Vol. 244, Young Stars Near Earth: Progress and
Prospects, ed. R. Jayawardhana & T. Greene, 245–+
Natta, A., Testi, L., Muzerolle, J., Randich, S., Comeron, F., & Persi, P. 2004, A&A, 424, 603
– 50 –
Nelson, L. A., Rappaport, S., & Chiang, E. 1993, ApJ, 413, 364
O’Donnell, J. E. 1994, ApJ, 422, 158
Phan-Bao, N., et al. 2008, ApJ, 689, L141
Plavchan, P., Werner, M. W., Chen, C. H., Stapelfeldt, K. R., Su, K. Y. L., Stauffer, J. R., & Song,
I. 2009, ApJ, 698, 1068
Raga, A. C., Bohm, K.-H., & Canto, J. 1996, Revista Mexicana de Astronomia y Astrofisica, 32,
161
Rayner, J. T., Cushing, M. C., & Vacca, W. D. 2009, ApJS, 185, 289
Rayner, J. T., Toomey, D. W., Onaka, P. M., Denault, A. J., Stahlberger, W. E., Vacca, W. D.,
Cushing, M. C., & Wang, S. 2003, PASP, 115, 362
Reiners, A. 2009, ApJ, 702, L119
Riaz, B., & Gizis, J. E. 2008, ApJ, 681, 1584
Riaz, B., Gizis, J. E., & Hmiel, A. 2006, ApJ, 639, L79
Rieke, G. H., & Lebofsky, M. J. 1985, ApJ, 288, 618
Rucinski, S. M., & Krautter, J. 1983, A&A, 121, 217
Scholz, R.-D., McCaughrean, M. J., Zinnecker, H., & Lodieu, N. 2005, A&A, 430, L49
Schwartz, R. D. 1983, ARA&A, 21, 209
Shu, F. H., Adams, F. C., & Lizano, S. 1987, ARA&A, 25, 23
Skrutskie, M. F., et al. 2006, AJ, 131, 1163
Soderblom, D. R., et al. 1998, ApJ, 498, 385
Song, I., Zuckerman, B., & Bessell, M. S. 2003, ApJ, 599, 342
Sterzik, M. F., Alcala, J. M., Covino, E., & Petr, M. G. 1999, A&A, 346, L41
Sterzik, M. F., Pascucci, I., Apai, D., van der Bliek, N., & Dullemond, C. P. 2004, A&A, 427, 245
Tachihara, K., Neuhauser, R., & Fukui, Y. 2009, PASJ, 61, 585
Terquem, C., & Papaloizou, J. C. B. 2000, A&A, 360, 1031
Torres, C. A. O., Quast, G. R., Melo, C. H. F., & Sterzik, M. F. 2008, Young Nearby Loose
Associations, ed. Reipurth, B., 757–+
– 51 –
Vacca, W. D., Cushing, M. C., & Rayner, J. T. 2003, PASP, 115, 389
van der Bliek, N. S., et al. 2004, in Society of Photo-Optical Instrumentation Engineers (SPIE)
Conference Series, Vol. 5492, Society of Photo-Optical Instrumentation Engineers (SPIE)
Conference Series, ed. A. F. M. Moorwood & M. Iye, 1582–1589
van Leeuwen, F. 2007, A&A, 474, 653
Voges, W., et al. 1999, A&A, 349, 389
—. 2000, IAU Circ., 7432, 3
Webb, R. A., Zuckerman, B., Platais, I., Patience, J., White, R. J., Schwartz, M. J., & McCarthy,
C. 1999, ApJ, 512, L63
Weingartner, J. C., & Draine, B. T. 2001, ApJ, 548, 296
Weintraub, D. A., Saumon, D., Kastner, J. H., & Forveille, T. 2000, ApJ, 530, 867
West, A. A., & Basri, G. 2009, ApJ, 693, 1283
West, A. A., Hawley, S. L., Bochanski, J. J., Covey, K. R., Reid, I. N., Dhital, S., Hilton, E. J., &
Masuda, M. 2008, AJ, 135, 785
Whelan, E. T., Ray, T. P., & Bacciotti, F. 2009, ApJ, 691, L106
Whelan, E. T., Ray, T. P., Bacciotti, F., Natta, A., Testi, L., & Randich, S. 2005, Nature, 435, 652
Whelan, E. T., Ray, T. P., Randich, S., Bacciotti, F., Jayawardhana, R., Testi, L., Natta, A., &
Mohanty, S. 2007, ApJ, 659, L45
White, R. J., & Basri, G. 2003, ApJ, 582, 1109
White, R. J., & Ghez, A. M. 2001, ApJ, 556, 265
Wyatt, M. C., Dent, W. R. F., & Greaves, J. S. 2003, MNRAS, 342, 876
Zuckerman, B., & Song, I. 2004, ARA&A, 42, 685
Zuckerman, B., Webb, R. A., Schwartz, M., & Becklin, E. E. 2001, ApJ, 549, L233
This preprint was prepared with the AAS LATEX macros v5.2.