the energy revolution in north america- …
TRANSCRIPT

THE ENERGY REVOLUTION IN NORTH
AMERICA--FACILITATING DYNAMIC SHIFTS
IN TRADE AND TRANSPORTATION
Zickie Allgrove
Director Ports and Terminals & Transportation
December 3, 2014

Current Market Drivers
• Renewed access to previously stranded Upstream Oil Developments• Canadian Oil Sands• Arctic Russian Finds• South American opening oil fields
• Natural Gas Markets in the USA (Bakken Crude, Natural Gas, Natural Gas Liquids –NGLs)
• Utica and Marcellus Shales• Persell and Barnett Shales• Permian Basin
• Inexpensive Natural gas is driving the Chemical processing industry around the production of ethylene and methanol which are energy intensive – 18 Projects valued at $US1B or more.
• Refining Resources• Coal Gasification to Produce DME• Oil “Trans-shipment” and Liquid Bulk Storage Regional Facilities
“For Shipping IMO Marpol VI”
“Not “Either-Or” but a part of the energy mix”

Map of Future Gas Flows
Marcellus& Utica

USA Net Energy Exporter
Marcellus& Utica

USA Shale Plays

Natural Gas Liquids
The “Process”
• Well known processes
• Different constraints = different outcomes for transportation and logistics
• Each connectivity line in the above diagram represents a need for
storage/transportation
Represents
opportunities for the
Infrastructure
Transportation Markets
Including Ports

What are Natural Gas Liquids?

Rail Networks USA
Marcellus& Utica
Bottlenecks
More flexibility…. but these people in grey
can be pricey
NGL Destination

Road Networks USA
Marcellus& Utica

Map of Future Gas Flows
Marcellus& Utica

USA Example of Energy Sector
Export Growth
Marcellus& Utica

Dollars and Sense
Marcellus& Utica
Date: 4-Feb-13
Sources: Wall Street Journal Cash Price; CME (OPIS); RBN Energy
Commodity
PriceUnit
Btu
HHV/gallon
$/MMBtu
HHV
Discount
Ratio
NG:Fuel
Price
Ratio
LNG:Fuel
WTI Crude Oil $97.77 bbl = 42 gal 140,500 $16.57 0.20 0.72
ULS Diesel: $3.23 gallon 138,490 $23.32 0.14 0.51
RBOB Gasoline: $3.05 gallon 121,848 $25.03 0.13 0.48
Condensate: Est Crude -$17 $80.77 bbl = 42 gal 112,000 $17.17 0.19 0.70
Butane: 77°F SG = 0.542 $1.70 gallon 95,553 $17.79 0.19 0.67
Propane: 77°F SG = 0.493 $0.87 gallon 88,370 $9.84 0.34 1.22
Ethane: -50°F SG = 0.50 $0.27 gallon 92,511 $2.92 1.14 4.11
Natural Gas (mostly methane): $3.34 MMBtu HHV NA $3.34 1.00 3.59
LNG: (NG price + ~prod. cost): $12.00 MMBtu HHV 84,820 $12.00 0.28 1.00
Note: Federal and state excise taxes, marketing and transportation costs are not included
Liquid Fuel Price Comparison:

Nearby Region Energy Projects
Marcellus& Utica
LPG IMPORTLNG Export
LNG ImportLNG Export
OIL TRANS-SHIPMENT
LNG Export
LNG Import
ETHANEIMPORT
LNG Import
OIL TRANS-SHIPMENT
DME COAL GAS
LPG IMPORT
OIL TRANS-SHIPMENT
LNG Import
LNG Import

What Does this Mean for the Shipping and Maritime Sector?

Marpol Annex VI Impacts
Emission Control Areas (ECA)

Global and ECA SOx Limits

Energy Sources for Shipping
and Shipping Opportunities
A number of studies are underway for alternative fuels or energy carriers
that are already used or could be potentially used in shipping in the
future. These fuels are:
• Liquefied Natural Gas (LNG)
• Liquefied Petroleum Gas (LPG)
• Methanol and Ethanol
• Di-Methyl Ether (DME)
• Synthetic Fuels (Fischer-Tropsch)
• Biodiesel
• Biogas
• Use of electricity for charging
• Batteries and cold ironing
• Hydrogen
• Nuclear Fuel

Factors affecting Alternate Fuels
for Shipping
• Physical and chemical characteristics
• Production, availability and cost: information on production methods,
current production volumes and prices, infrastructure, and future
forecast, where available
• Applications and current status: applications in the maritime and in
other sectors. Overview of technology including engines and storage
tanks
• Safety considerations
• Emissions and environmental considerations

Fuel Scrubbing Technologies
NOx

Fuel Scrubbing Technologies
SOx

Marpol Annex VI Impacts

FactorsInfrastructure
ChallengesSAFETY/SECURITY
LOADING ARM TECHNOLOGY
SHIPS AND NEW BUILD VS CONVERSION
• Cost of a new LNG vessel is 10 to 15% higher
• Abatement Sulphur scrubbing technology costs about USD$4M/vessel
• Payback times for LNG Vessels vs Scrubbers is about 2 to 4 years depending on LNG
price point assumed. Vessels above 2,500 TEU have even shorter payback periods in
ECA Zones
** DNV predicts that 30 percent of all newbuilds worldwide will have LNG propulsion by 2020 ** -

Ship New Build to 2025
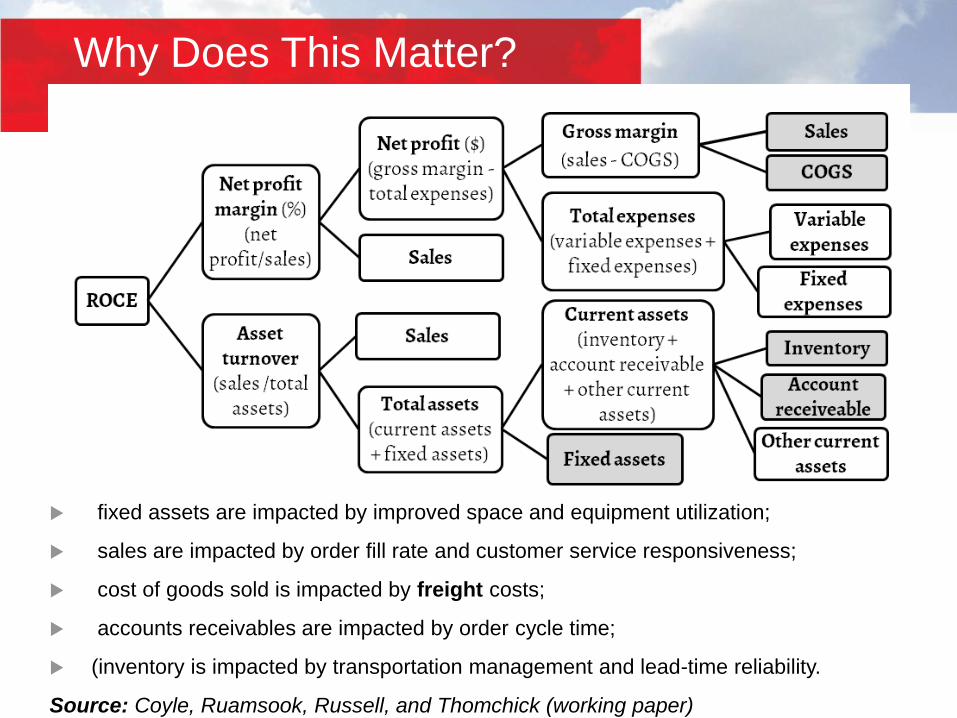
fixed assets are impacted by improved space and equipment utilization;
sales are impacted by order fill rate and customer service responsiveness;
cost of goods sold is impacted by freight costs;
accounts receivables are impacted by order cycle time;
(inventory is impacted by transportation management and lead-time reliability.
Source: Coyle, Ruamsook, Russell, and Thomchick (working paper)
Why Does This Matter?

Closing Thoughts
• There is an energy evolution underway rather than an energy revolution
• There will be a general push to cleaner burning fuels with high BTU and BTU/$ returns
• $/BTU of LPG, Ethane and LNG including CAPEX onshore development is approximately coming out at 20 to 25% cheaper than traditional oil/coal energy developments
• Cost of fleet vessel conversions and timeline scale for conversions (scrubbers/LNG) will have a longer horizon to see recognition of value from lower pricing for fuel
• Near term increase in fuel costs as vessels switch to low-sulphur MGO (RD or MD)• Resultant increase in cost of good sold regionally (and globally)
• Longer term fall in Fuel Costs as markets shake out and technology matures

DISCLAIMERThis presentation has been prepared by a representative of WorleyParsons for the AAPA Port Executive Management Seminar.
The presentation contains the professional and personal opinions of the presenter, which are given in good faith. As such, opinions presented herein may not always necessarily reflect the position of WorleyParsons as a whole, its officers or executive..
Any forward-looking statements included in this presentation will involve subjective judgment and analysis and are subject to uncertainties, risks and contingencies — many of which are outside the control of, and may be unknown to, WorleyParsons.
WorleyParsons and all associated entities and representatives make no representation or warranty as to the accuracy, reliability or completeness of information in this document and do not take responsibility for updating any information or correcting any error or omission that may become apparent after this document has been issued.
To the extent permitted by law, WorleyParsons and its officers, employees, related bodies and agents disclaim all liability — direct, indirect or consequential (and whether or not arising out of the negligence, default or lack of care of WorleyParsons and/or any of its agents)—for any loss or damage suffered by a recipient or other persons arising out of, or in connection with, any use or reliance on this presentation or information.

For more information, please contact:
Zickie Allgrove
Director – Ports, Marine Terminals and Transportation