the energy and global climate change challenges in the ...eneken.ieej.or.jp/data/6903.pdf6.singapore...
TRANSCRIPT
Energy and Global Climate Change
Challenges in the ASEAN Countries and the Significance of SETA in this Context
by
Tatchai Sumitra
Chairman, the Organizing Committee of SETA 2017
Presented at IEEJ, Tokyo, Japan on 9th August 2016
IEEJ:September 2016 © IEEJ2016

Outlines
1. Energy Outlook for ASEAN countries.
2. Energy Outlook for Thailand.
3. Summary of SETA 2016.
4. SETA 2017 Prospectus.
5. Why SETA ?
IEEJ:September 2016 © IEEJ2016
• ASEAN Energy Characteristics
• ASEAN Energy Resources
• ASEAN Primary Energy Demand
• GHG Emissions from ASEAN Countries
• ASEAN Key Energy Challenges
• ASEAN Countries’ Energy Policies
• ASEAN Power Grid
• ASEAN Gas Pipelines
IEEJ:September 2016 © IEEJ2016

ASEAN Energy Characteristics
Country Main Characteristics
1. Indonesia 238 millions population (largest in ASEAN), largest energy consumer, world’s largest coal exporter, major LNG exporter.
2. Thailand 69.5 millions population, second largest energy consumer,
gas is dominant fuel in electricity, increasingly dependent on energy import
3. Malaysia 28.9 millions population , third largest energy consumer, world’s second largest LNG exporter.
4.Philippines 95.7 millions population, World’s 2nd largest geo-thermal producer, dependent on energy import.
5.Vietnam
87.9 millions population, growing energy demand, increasing energy import, introducing nuclear.
IEEJ:September 2016 © IEEJ2016

ASEAN Energy Characteristics (cont’d)
Country Main Characteristics
6.Singapore
5.2 millions population, small size, most develo-ped ASEAN
economy, entirely dependent on energy import, refining and petrochemical hub.
7.Myanmar 54 millions population, low level of energy access, accelerating economic development.
8.Brunei Darussalam
0.4 millions population, significant oil and gas exporter, gas is dominant in electricity.
9.Lao PDR
6.3 millions population, significant hydro and wind power, exporter of electricity to neighbors.
10.Cambodia
15 millions population, low level of energy access, low per-capita energy demand.
IEEJ:September 2016 © IEEJ2016

ASEAN Energy Resources
Country Oil BBl Gas TCF Coal
MMT
Hydro
MW
Geoth
MW
Wood
kTon
1.Indo. 10 169.5 38,000 75,625 19,658 439,049
2.Thai 0.156 12.2 1,240 5,000 n.d. 67,180
3.Malay. 3.42 84.4 1,024.5 25,000 n.d. 137,301
4.Phil. 0.285 4.6 346 9,150 n.d. 89,267
5.Viet. 5 19.2 4,500 68,500 n.d. 48,960
IEEJ:September 2016 © IEEJ2016

ASEAN Energy Resources (cont.d)
Country Oil BBl
Gas TCF Coal
MMT
Hydro
MW
Geoth
MW
Wood
kTon
6.Sing. n.d. n.d. n.d. n.d. n.d. n.d.
7.Brunei 6 34.8 n.d. n.d. n.d. n.d.
8.Myanm. 3.1 12.1 n.d. 108,000 n.d. 129,935
9.Lao n.d. 3.6 600 26,500 n.d. 46,006
10.Cambo n.d. 9.89 n.d. 10,000 n.d. 81,565
IEEJ:September 2016 © IEEJ2016
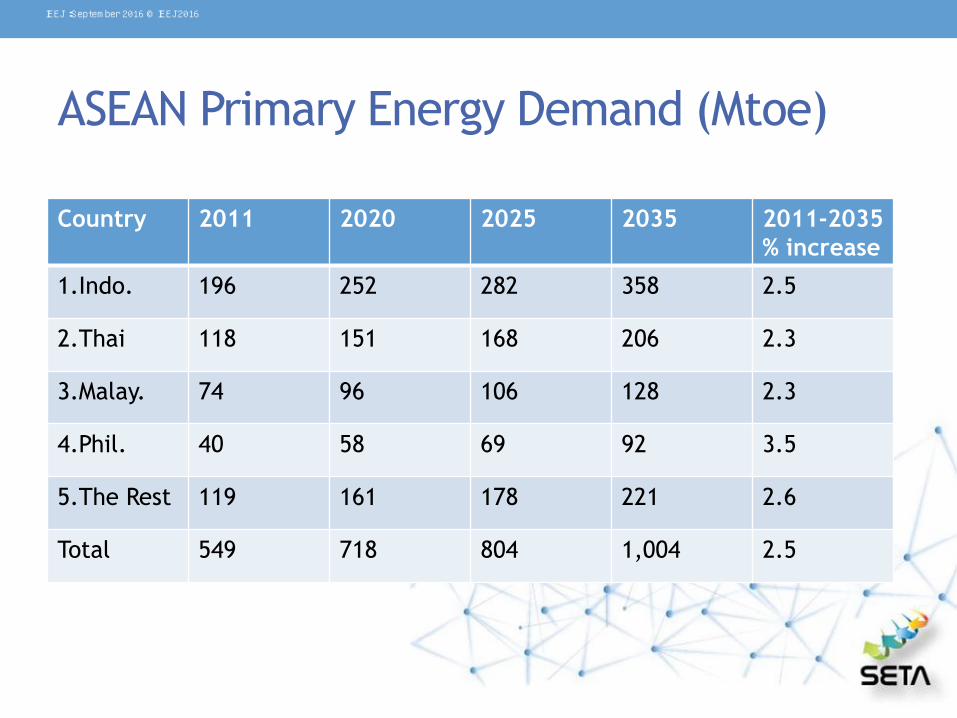
ASEAN Primary Energy Demand (Mtoe)
Country 2011 2020 2025 2035 2011-2035
% increase
1.Indo. 196 252 282 358 2.5
2.Thai 118 151 168 206 2.3
3.Malay. 74 96 106 128 2.3
4.Phil. 40 58 69 92 3.5
5.The Rest 119 161 178 221 2.6
Total 549 718 804 1,004 2.5
IEEJ:September 2016 © IEEJ2016

GHG Emission from ASEAN
No. Country GHG emiss.( 1000 tons)
1 Indonesia 433,989
2 Thailand 295,262
3 Malaysia 216,804
4 Vietnam 150,230
5 Philippines 81,591
6 Singapore 13,520
7 Myanmar 8,995
8 Brunei Darussalam 9,160
9 Lao 1,874
10 Cambodia 4,180
IEEJ:September 2016 © IEEJ2016

ASEAN Key Energy Challenges
2030
1.Primary Demand Growth Rate 2007-2030 to increase +2.5%
2.Fossil fuel to increase +76%
3.Coal to increase +24%
4.Oil to decrease -15%
5.Accessibility (now 160 Millions) to increase +63 Millions
6.Energy Investment (cumulative to 2030) to increase
Investment in Power Sector alone
1.1 Trillion USD
55%
7.Carbon Footprint (now 3.5%) to increase 5%
IEEJ:September 2016 © IEEJ2016

ASEAN Countries’ Energy Policies
Country E.E. R.E. Climate Change Nuclear
1.Indonesia 1% /y en. Inten.
Reduc. until 2030
23% by 2035, 31%
by 2050
26% GHG emis.
Reduc. by 2020,
41% with help
n.d.
2.Thailand 30%. En.Inten.
Reduc. by 2036
20% power gen.,
20% bio fuel for
transp. By 2036
20-25% GHG
emission Reduc. By
2036
2,000 MW by
2036
3.Malaysia Promote E.E. in
Indus.,Building,
Domestic
2,000 MW in
2020, 4,000 MW
in 2030
40% GHG reduc. By
2020
Feasibility
4.Phillippines Energy saving eq.
to 15% final en.
Demand/y
Triple cap. To 15
GW by 2030
n.d. n.d.
5.Vietnam Reduce energy
consumption
8-10% by 2020
6% by 2030
n.d. n.d. 10.7 GW by
2030
IEEJ:September 2016 © IEEJ2016
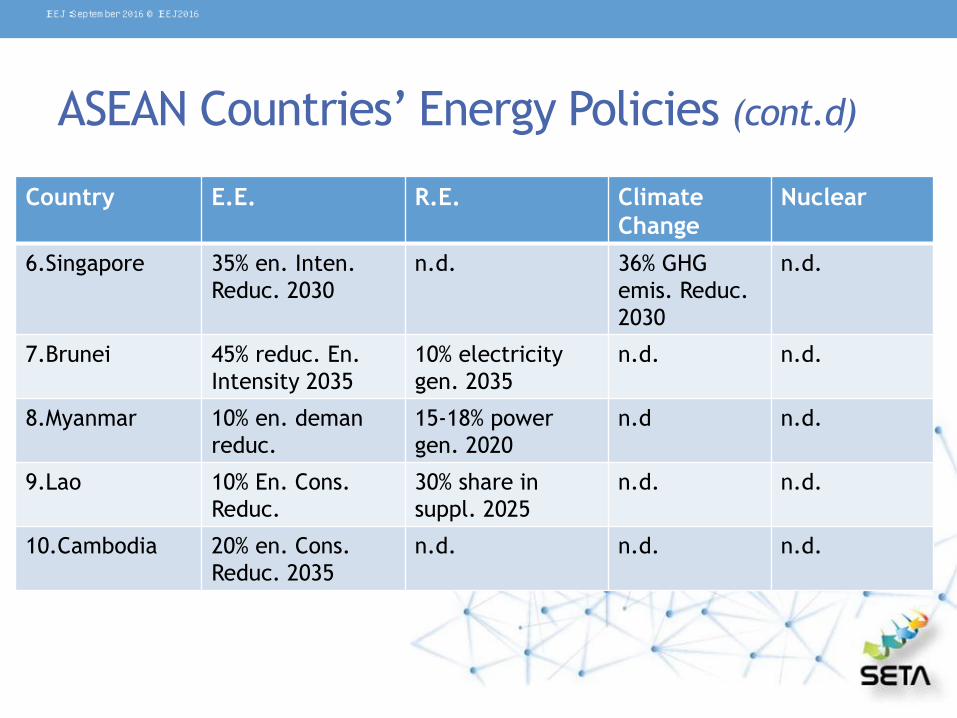
ASEAN Countries’ Energy Policies (cont.d)
Country E.E. R.E. Climate
Change
Nuclear
6.Singapore 35% en. Inten.
Reduc. 2030
n.d. 36% GHG
emis. Reduc.
2030
n.d.
7.Brunei 45% reduc. En.
Intensity 2035
10% electricity
gen. 2035
n.d. n.d.
8.Myanmar 10% en. deman
reduc.
15-18% power
gen. 2020
n.d n.d.
9.Lao 10% En. Cons.
Reduc.
30% share in
suppl. 2025
n.d. n.d.
10.Cambodia 20% en. Cons.
Reduc. 2035
n.d. n.d. n.d.
IEEJ:September 2016 © IEEJ2016

ASEAN Power Grid Existing and Planned Interconnection Grid-to-Grid Grid-to-Load
1.Peninsular Malaysia-Singapore x
2.Thailand-Peninsular Malaysia x
3.Thailand-Lao x
4.Lao-Vietnam x
5.Thailand-Cambodia x
6.Thailand-Myanmar x
7.Peninsular Malaysia-Sumatra-Java x
8.Peninsular Malaysia-Sarawak x
9.Sarawak-Sabah-Brunei X
10.Sarawak-Kalimantan X
11.Sabah-Philippines X
12.Vietnam-Cambodia X
13.Lao Cambodia x
IEEJ:September 2016 © IEEJ2016

ASEAN Gas Pipelines
Pipelines Country-to-
country
Country-to-
reserv.
1.Thailand-Myanmar X
2.Thailand-JDA X
3.JDA-Malaysia X
4.Singapore-Malaysia X
5.Singapore-Sumatra X
6.Malaysia-West Natuna X
7.West Natuna-Singapore X
8.Malaysia-CAA X
9.CAA-Vietnam x
IEEJ:September 2016 © IEEJ2016

• The Challenges for Thailand’s Energy Future
• Thailand Primary Energy Demand
• Types of Primary Energy in 2036
• Final Energy Demand
• Power Development Plan (PDP 2015)
• Energy Efficiency Targets
• Alternative Energy Targets
IEEJ:September 2016 © IEEJ2016
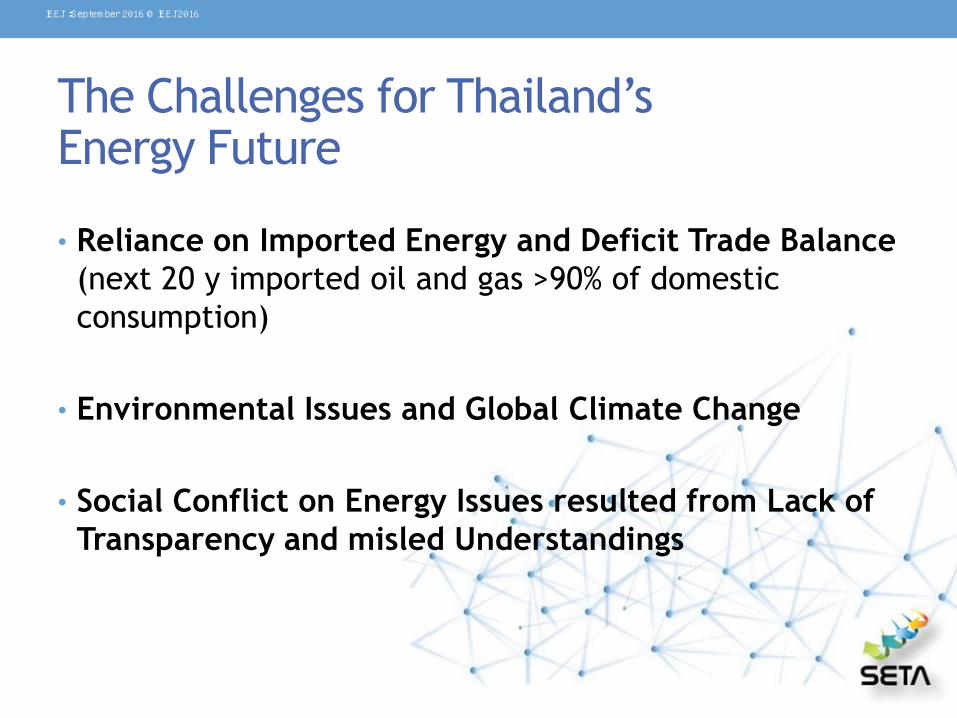
The Challenges for Thailand’s Energy Future
• Reliance on Imported Energy and Deficit Trade Balance
(next 20 y imported oil and gas >90% of domestic
consumption)
• Environmental Issues and Global Climate Change
• Social Conflict on Energy Issues resulted from Lack of
Transparency and misled Understandings
IEEJ:September 2016 © IEEJ2016
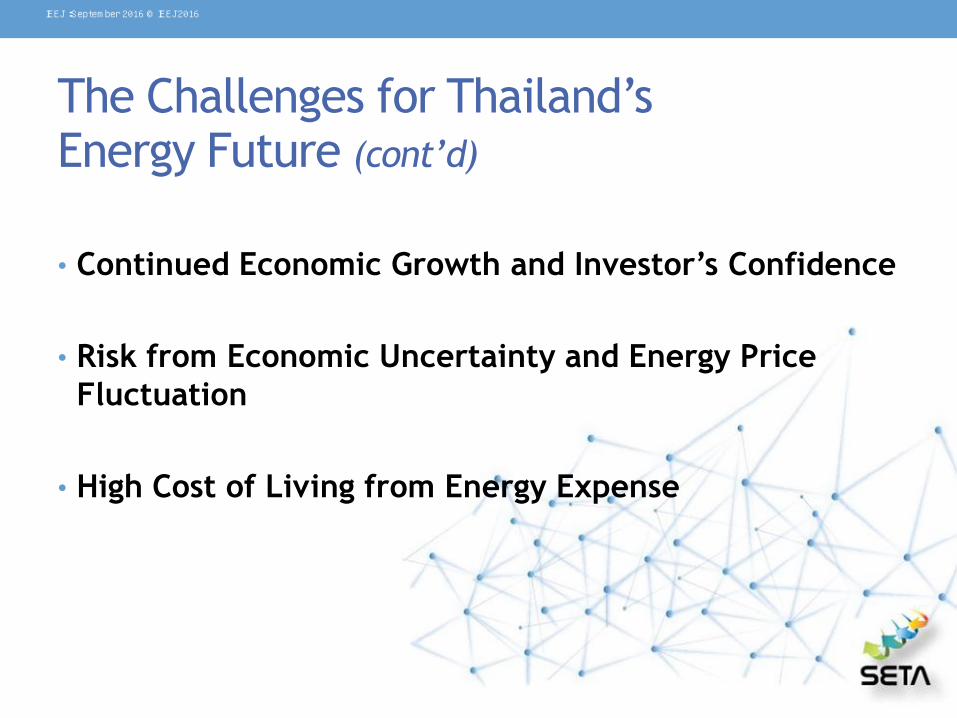
The Challenges for Thailand’s Energy Future (cont’d)
• Continued Economic Growth and Investor’s Confidence
• Risk from Economic Uncertainty and Energy Price
Fluctuation
• High Cost of Living from Energy Expense
IEEJ:September 2016 © IEEJ2016
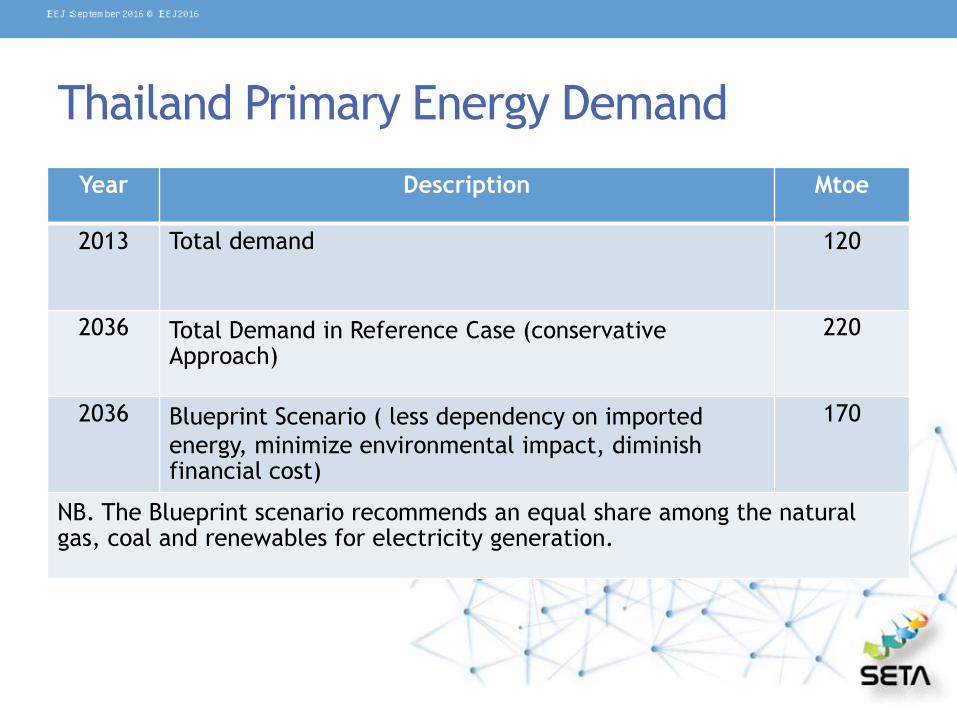
Thailand Primary Energy Demand
Year Description Mtoe
2013 Total demand 120
2036 Total Demand in Reference Case (conservative Approach)
220
2036 Blueprint Scenario ( less dependency on imported
energy, minimize environmental impact, diminish financial cost)
170
NB. The Blueprint scenario recommends an equal share among the natural gas, coal and renewables for electricity generation.
IEEJ:September 2016 © IEEJ2016
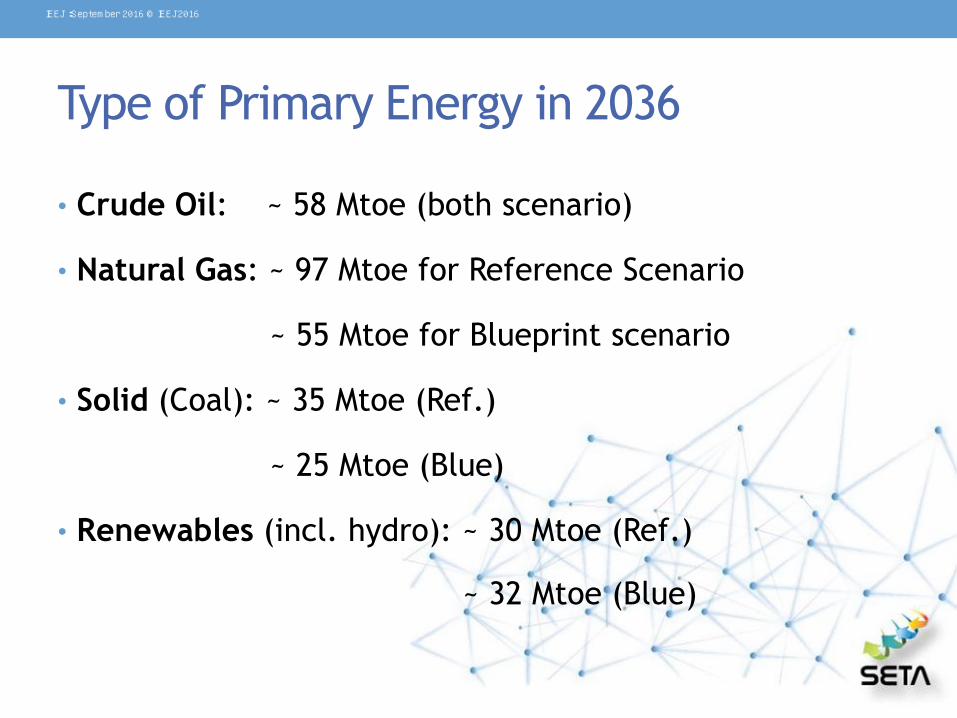
Type of Primary Energy in 2036
• Crude Oil: ~ 58 Mtoe (both scenario)
• Natural Gas: ~ 97 Mtoe for Reference Scenario
~ 55 Mtoe for Blueprint scenario
• Solid (Coal): ~ 35 Mtoe (Ref.)
~ 25 Mtoe (Blue)
• Renewables (incl. hydro): ~ 30 Mtoe (Ref.)
~ 32 Mtoe (Blue)
IEEJ:September 2016 © IEEJ2016
Final Energy Demand
The final energy demand is shared almost equally among:
• Industry Sector
• Transport Sector
• Business/Service Sector and Households
IEEJ:September 2016 © IEEJ2016
Power Development Plan
3 Basic Principles:
• Security: incl. fuel diversification to reduce risk
• Economy: incl. cost of production and tariff
• Ecology: minimize impacts on the environment and the global climate change
IEEJ:September 2016 © IEEJ2016

Fuel Diversification
• Reduce the use of Natural Gas
• Increase the use of Clean Coal
• Import more electricity
• Increase the use of Renewable Energies
• Nuclear Power may be introduced at the end
IEEJ:September 2016 © IEEJ2016
Investment in Infrastructure
• Invest in Transmission and Distribution lines to support
the AEC and GMS
• Development of Smart Grid to optimize the integration
of Renewable Energies
IEEJ:September 2016 © IEEJ2016
Other Principles
• Reserve Margin: 15% of Peak Power Demand
• Integrate with
Energy Efficiency Plan
Alternative Energies Plan
IEEJ:September 2016 © IEEJ2016

Current Electricity Generation
by Fuel Types
Fuel Type Percentage (%) MW
Natural Gas 64 24,072
Coal (Lignite) 20 7,522
Renewable Energies 8 3,009
Imported/Hydro 7 2,633
Diesel/Fuel Oil 1 376
IEEJ:September 2016 © IEEJ2016

PDP 2015
Fuel Type 2014 (%) 2026 (%) 2036 (%)
Natural Gas 64 40-50 30-40
Clean Coal (incl. Lignite) 20 20-25 20-25
Renewable Energy 8 10-20 15-20
Imported / Hydro 7 10-15 15-20
Diesel/ Fuel Oil 1 - -
Nuclear - - 0-5
IEEJ:September 2016 © IEEJ2016

Summary of PDP 2015
Installed Capacity MW
Existing Installed Capacity (2014) 37,612
New Installed Capacity (2014-2036)
Retired Power Plants (2014-2036)
57,459
-24,736
Total Installed Capacity (2036) 70,336
IEEJ:September 2016 © IEEJ2016
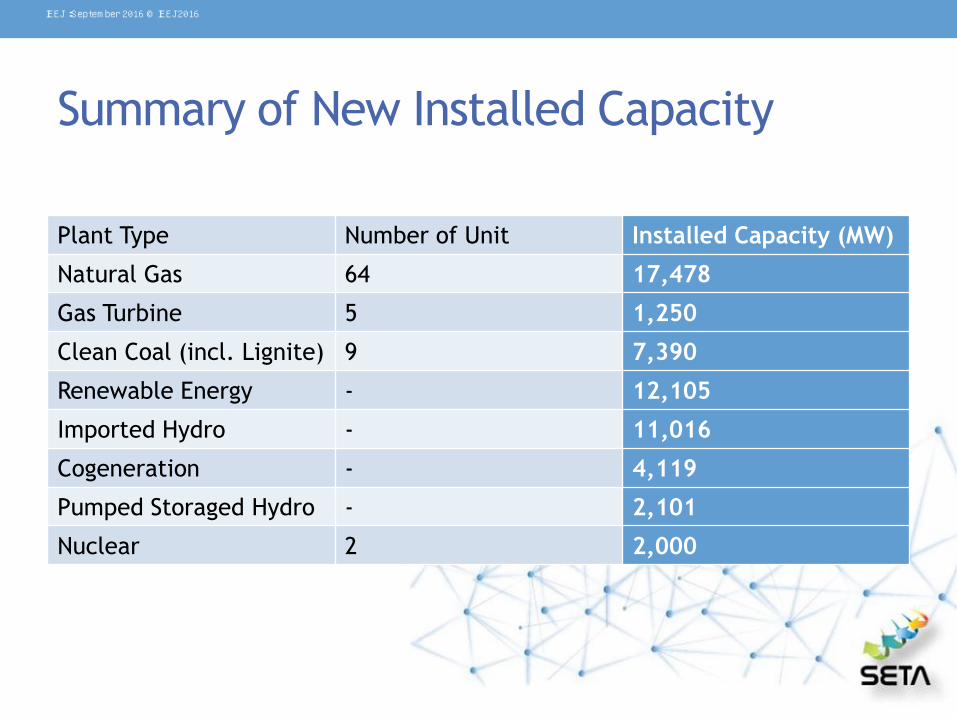
Summary of New Installed Capacity
Plant Type Number of Unit Installed Capacity (MW)
Natural Gas 64 17,478
Gas Turbine 5 1,250
Clean Coal (incl. Lignite) 9 7,390
Renewable Energy - 12,105
Imported Hydro - 11,016
Cogeneration - 4,119
Pumped Storaged Hydro - 2,101
Nuclear 2 2,000
IEEJ:September 2016 © IEEJ2016

Energy Efficiency Target (GWh)
Residen. Industry Business Gov. Total
1.ENCON Act (spec. consump.) - 10,814 5,654 3,180 19,648
2.BEC (Building Energy Code) - - 11,975 1,711 13,686
3.HEP & MEP (High and Min.
Performance Standards)
8,936 6,226 7,609 - 23,760
4.Financial Incentives - 9,133 5,941 - 15,074
5.LED (Promotion) 3,354 3,303 3,711 1,264 11,632
6.EERS (Energy Efficiency
Resource Standards)
Total
1,343
13,633
15%
2,367
31,843
36%
2,162
37,052
41%
-
7,144
8%
5,872
89,672
IEEJ:September 2016 © IEEJ2016

Alternative Energy Target (MW)
Type 2014 2036
Solar 1,298.5 6,000
Wind 224.5 3,002
Hydro 2,906.4 2,906.4
Mini Hydro (<12 MW) 142 376
MSW 65.7 500
Bio-gas 311.5 600
Bio-mass 2,541.8 5,570
Energy Crop - 680
Total (MW) 7,490.4 19,634.4
IEEJ:September 2016 © IEEJ2016

• SETA 2016 consisted of
International Conference
Exhibition
• Over 5,300 participants
• 41 countries represented
• 12 Side Events
• 97% of attendees rated the Event between good and excellent
IEEJ:September 2016 © IEEJ2016
International Conference
• Theme: Sustainable Energy and Technology Asia
• Speakers: 140
• Delegates: 1225
• Conference Sub-topics: 4 tracks
• Other Parallel Conferences: 12
IEEJ:September 2016 © IEEJ2016
Track 1 Energy Policy and Planning
• COP 21 was very much concerned
• 5 main issues were raised
Energy accessibility, energy affordability, energy security, energy
sustainability, energy efficiency
Technologies are needed to effectively combat the Global
Climate Change
Collaboration between countries are needed
Diversification to include low-carbon sources are necessary
Fossil fuels will be around for many years
IEEJ:September 2016 © IEEJ2016
Track 2 Electrical System Technology
• Grid-to-Grid connection
• Smart grid and micro grid
• Energy storage systems
• Clean coal technology
• Nuclear Power
IEEJ:September 2016 © IEEJ2016
Track 3 Transportation and alternative fuels
• Green Vehicles such as EV, HV, PHV, FCV
• Alternative fuels
• Hydrogen
• Freights and Logistics
IEEJ:September 2016 © IEEJ2016

Track 4 Sustainable Energy and Green Technology
• Solar PV
• Wind
• Bio-mass and Bio-gas
• Green urbanization
• Low-carbon cities
IEEJ:September 2016 © IEEJ2016

Fact of Statistics
IEEJ:September 2016 © IEEJ2016

Highlights : Opening Ceremony IEEJ:September 2016 © IEEJ2016
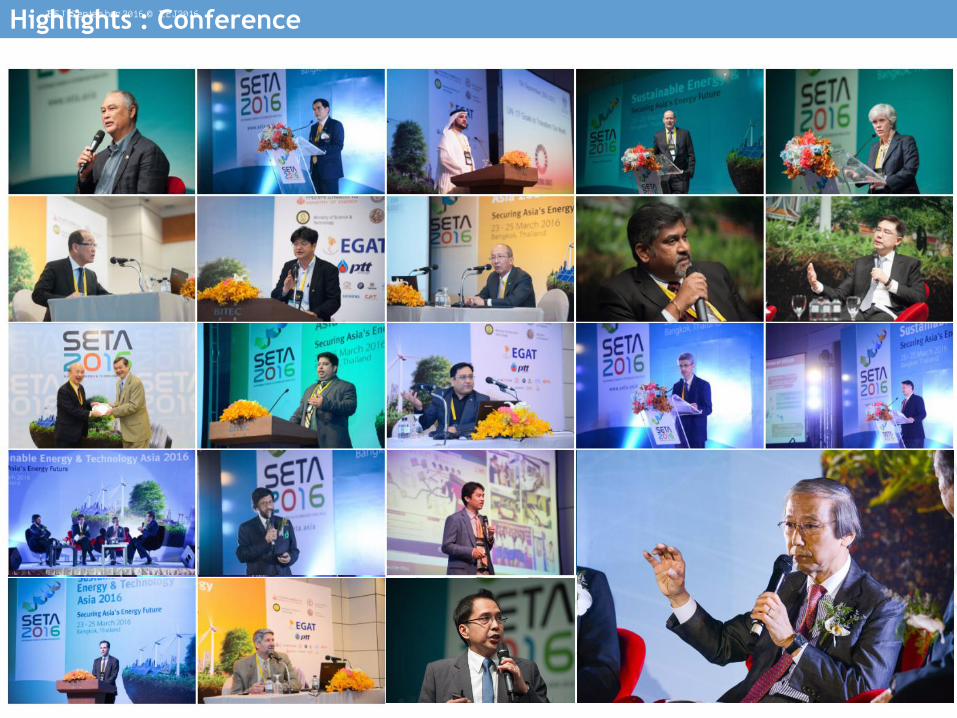
Highlights : Conference IEEJ:September 2016 © IEEJ2016

Highlights : Exhibition IEEJ:September 2016 © IEEJ2016
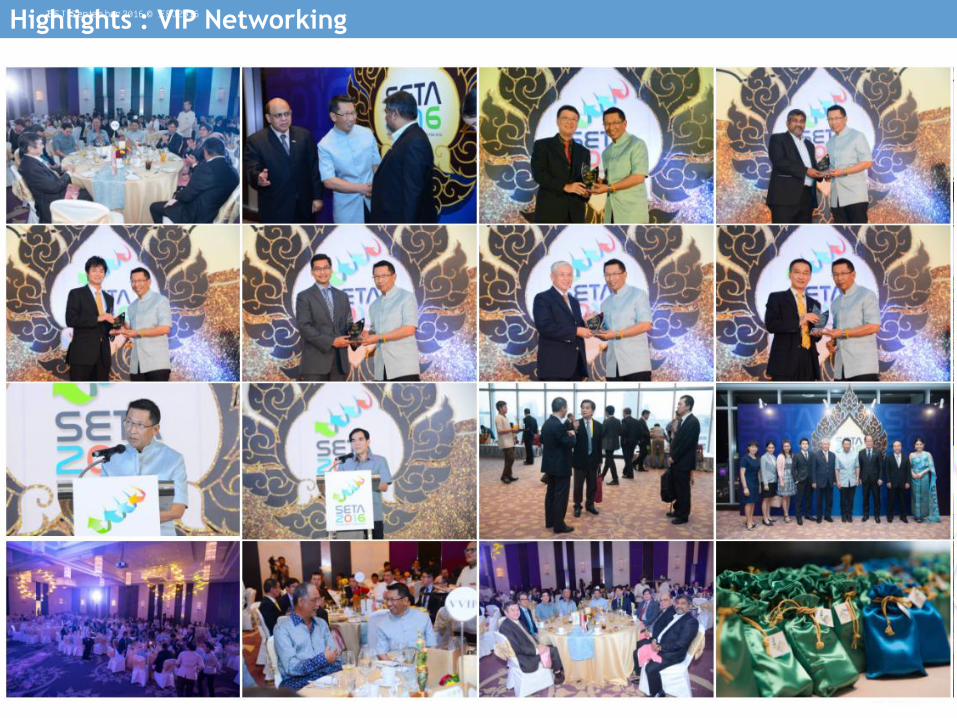
Highlights : VIP Networking IEEJ:September 2016 © IEEJ2016

Highlights : Side Events IEEJ:September 2016 © IEEJ2016
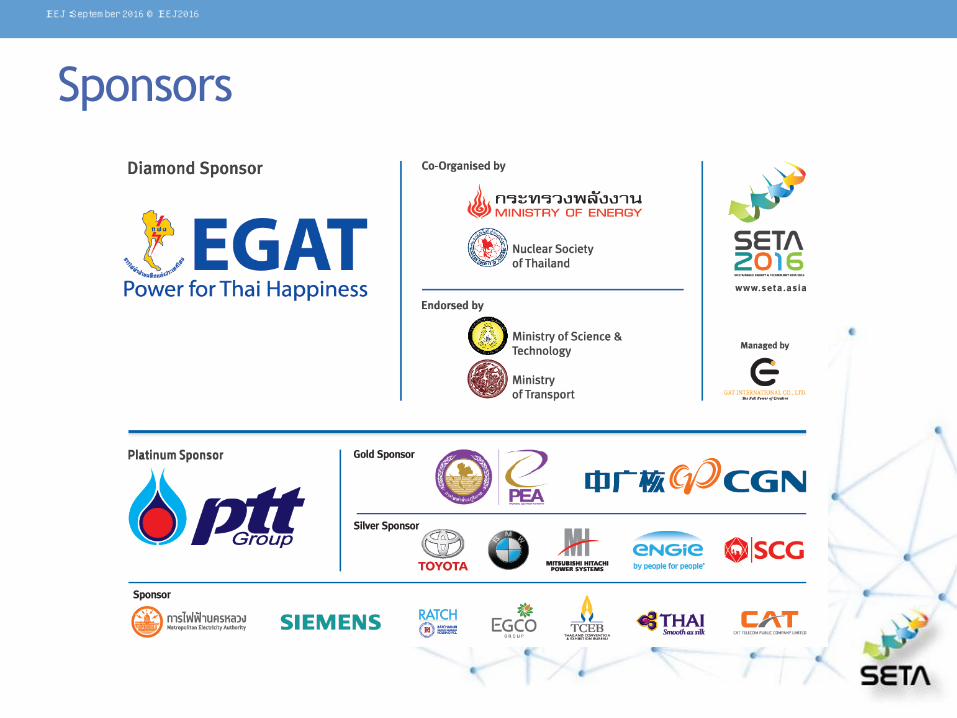
Sponsors
IEEJ:September 2016 © IEEJ2016
Supporting Organizations
IEEJ:September 2016 © IEEJ2016

• Same format as SETA 2016:
International Conference
Exhibition
• Topics subdivided into 4 tracks:
• Sustainable Energy Policy and Planning
• Low-Carbon Electricity Generation
• Green Transport and Logistics
• Smart City and Green Industry
IEEJ:September 2016 © IEEJ2016

Track 1 Sustainable Energy Policy and Planning
• Energy Planning at a Regional, National and Local Scale
• Energy Pricing
• Fiscal and Regulatory Policies at Supply
• Existing and Emerging Energy Markets and Reforms
• Alternative Energy Market and Policies
IEEJ:September 2016 © IEEJ2016

Track 1 (cont’d) Sustainable Energy Policy and Planning
• Financing and Investments for Energy Supply
• Energy Integration Plan, Experiences, Challenges and
Opportunities
• Regional Energy Supply Infrastructure
• Regional Energy Integration
• Energy Sustainability
IEEJ:September 2016 © IEEJ2016
Track 2 Low-Carbon Electricity Generation
• New Trend in Electric Power Systems (Generation,
Transmission, Distribution)
• Electricity Storage Systems
• Smart Grids in Power Systems
• Extended Generation of Electricity by Renewable Energy
in Asia
IEEJ:September 2016 © IEEJ2016
Track 2 (cont’d) Low-Carbon Electricity Generation
• Bio-mass and Bio-gas as Alternative Fuels
• Energy Efficiency and Management
• Co-Generation
• State of the Art in Clean Coal Technology
• Nuclear Power in Asia
IEEJ:September 2016 © IEEJ2016

Track 3 Green Transport and Logistics
• Novel Hybrid Vehicles
• Electric Vehicles and Infrastructure
• Novel Battery Development and Charging Systems
• Hydrogen and Fuel Cell Vehicles
• Green Transport
IEEJ:September 2016 © IEEJ2016

Track 3 (cont’d) Green Transport and Logistics
• Fuel Pricing and Tax Incentives for Transportation
• Bio-fuels for Transportation
• Pipeline Transport and Regional Connectivity
• Green Logistics
• Floating LNG Terminal
IEEJ:September 2016 © IEEJ2016
Track 4 Smart City and Green Industry
• Green City
• Green Urbanization
• Green Building and Infrastructure
• BEMS and HEMS
• ESCO Approach to Smart City
• ICT Application in Smart City
IEEJ:September 2016 © IEEJ2016

Track 4 (cont’d) Smart City and Green Industry
• Low-energy and Low-carbon City
• Digital Utilities
• Smart Grid for Smart City
• Renewable Energy Integration in Urban Area
• Smart Waste Management
• Green Industry
IEEJ:September 2016 © IEEJ2016

• Asia is one of the World’s big centers for manufacturing
thus consuming a lot of energy
• Current energy uses lead to GHG emissions
• Need to mitigate the Global Climate Change following
the Paris Agreement (COP21)
• Not enough technologies available at a reasonable price
to attain sustainability
• No platform to discuss freely the burning issues
IEEJ:September 2016 © IEEJ2016
A Unique Platform for Asia
• A unique non-governmental platform in Asia
• A Flexible platform that can change the topics according
to interests
• Strongest support by policy makers in Asia
• Biggest participation from ASEAN economies
• Combine important issues of energy in a single event:
policy, electricity generation, transport and sustainable
energy development
IEEJ:September 2016 © IEEJ2016

Some critical issues towards sustainability
• SETA2016 showed the willingness of Asian economies to
reduce GHG emissions
• To attain a sustainable development in Asia more
innovative technologies should be used
• A need for effective technologies for Asia to mitigate the
Global Climate Change
• A need for cooperation and connectivity among
economies in Asia
IEEJ:September 2016 © IEEJ2016
Towards a Low-carbon Society
• SETA2017 responds to this need by focusing on the way
towards a Low–carbon Society
• Balanced topics:
Sustainable Energy Policy and Planning
Low-carbon Electricity Generation
Green Transport and Green logistics
Smart City and Green Industry
IEEJ:September 2016 © IEEJ2016
