the end of primary school test - iaea end of primary school test ... is compulsory until the end of...
TRANSCRIPT
Marleen van der Lubbe, Cito, The Netherlands
1
The End of Primary School Test Marleen van der Lubbe, Cito, The Netherlands
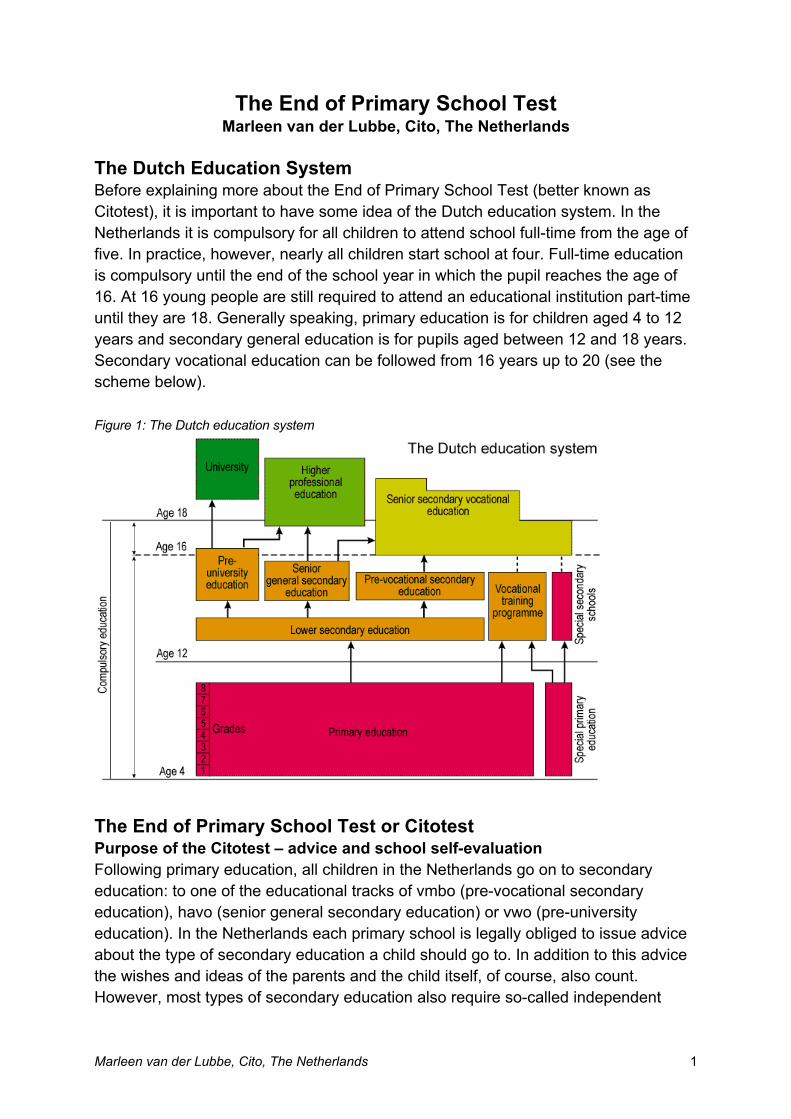
The Dutch Education System Before explaining more about the End of Primary School Test (better known as Citotest), it is important to have some idea of the Dutch education system. In the Netherlands it is compulsory for all children to attend school full-time from the age of five. In practice, however, nearly all children start school at four. Full-time education is compulsory until the end of the school year in which the pupil reaches the age of 16. At 16 young people are still required to attend an educational institution part-time until they are 18. Generally speaking, primary education is for children aged 4 to 12 years and secondary general education is for pupils aged between 12 and 18 years. Secondary vocational education can be followed from 16 years up to 20 (see the scheme below).
Figure 1: The Dutch education system
The End of Primary School Test or Citotest Purpose of the Citotest – advice and school self-evaluation Following primary education, all children in the Netherlands go on to secondary education: to one of the educational tracks of vmbo (pre-vocational secondary education), havo (senior general secondary education) or vwo (pre-university education). In the Netherlands each primary school is legally obliged to issue advice about the type of secondary education a child should go to. In addition to this advice the wishes and ideas of the parents and the child itself, of course, also count. However, most types of secondary education also require so-called independent
Marleen van der Lubbe, Cito, The Netherlands
2
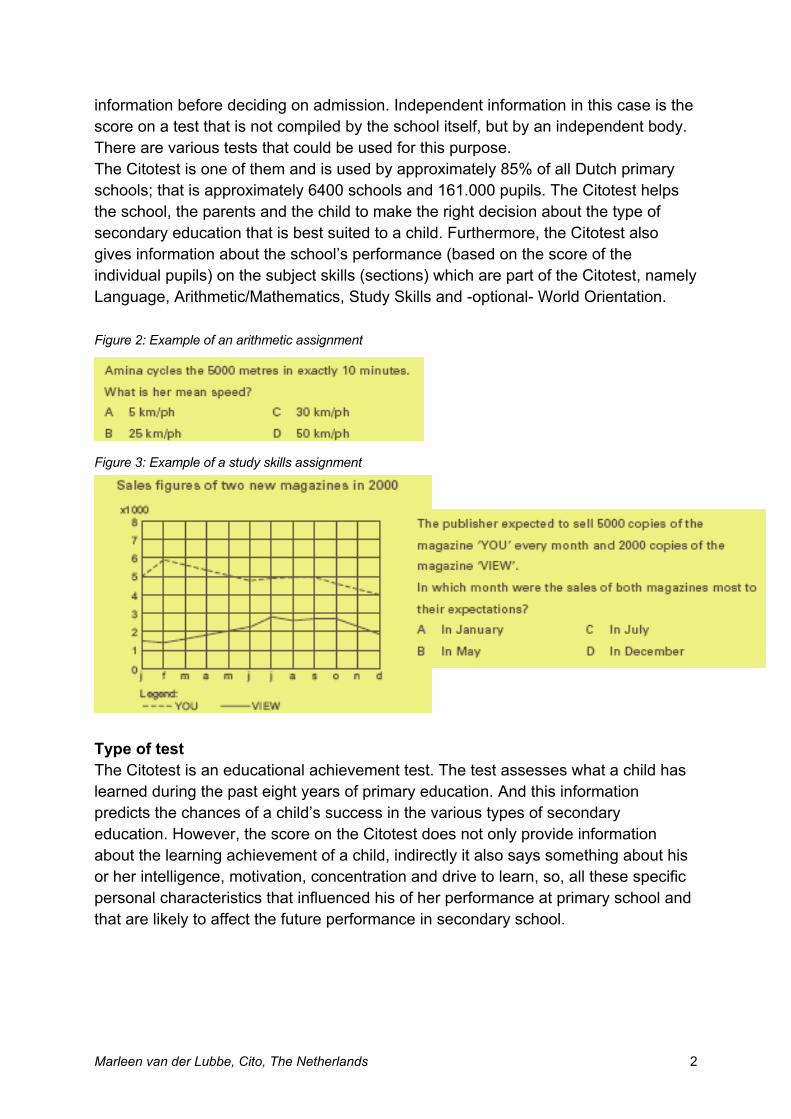
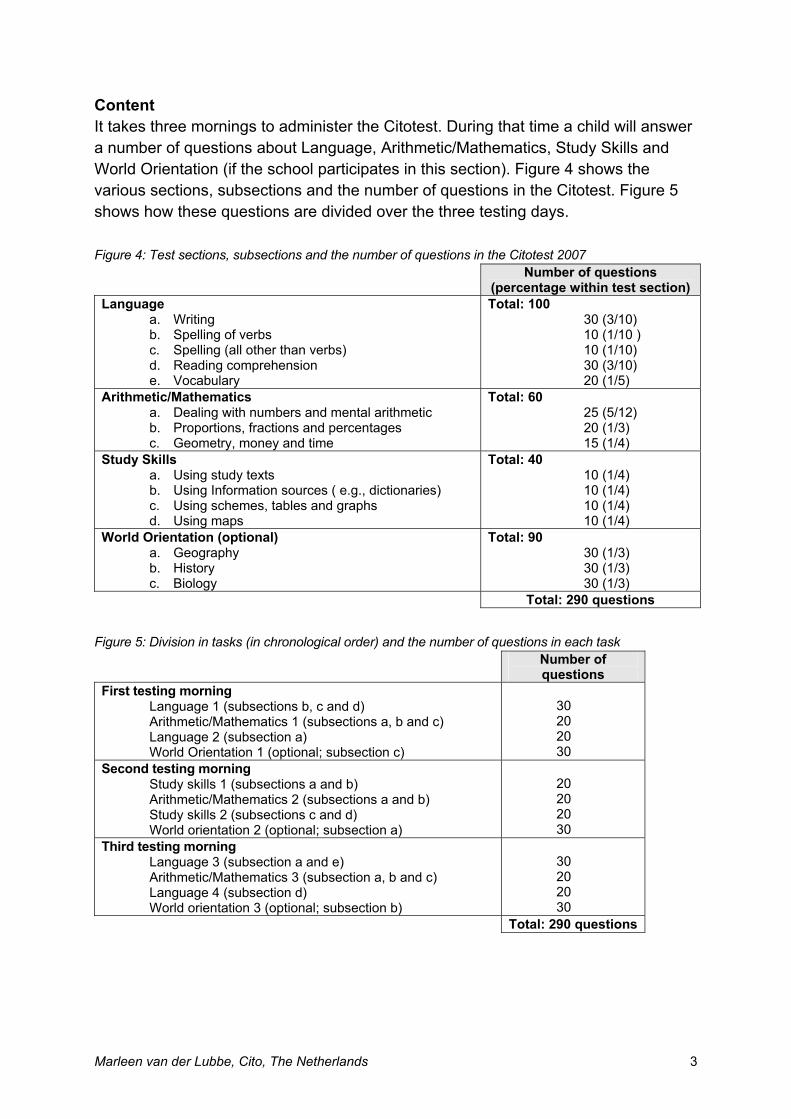
information before deciding on admission. Independent information in this case is the score on a test that is not compiled by the school itself, but by an independent body. There are various tests that could be used for this purpose. The Citotest is one of them and is used by approximately 85% of all Dutch primary schools; that is approximately 6400 schools and 161.000 pupils. The Citotest helps the school, the parents and the child to make the right decision about the type of secondary education that is best suited to a child. Furthermore, the Citotest also gives information about the school’s performance (based on the score of the individual pupils) on the subject skills (sections) which are part of the Citotest, namely Language, Arithmetic/Mathematics, Study Skills and -optional- World Orientation. Figure 2: Example of an arithmetic assignment Figure 3: Example of a study skills assignment Type of test The Citotest is an educational achievement test. The test assesses what a child has learned during the past eight years of primary education. And this information predicts the chances of a child’s success in the various types of secondary education. However, the score on the Citotest does not only provide information about the learning achievement of a child, indirectly it also says something about his or her intelligence, motivation, concentration and drive to learn, so, all these specific personal characteristics that influenced his of her performance at primary school and that are likely to affect the future performance in secondary school.
Marleen van der Lubbe, Cito, The Netherlands
3
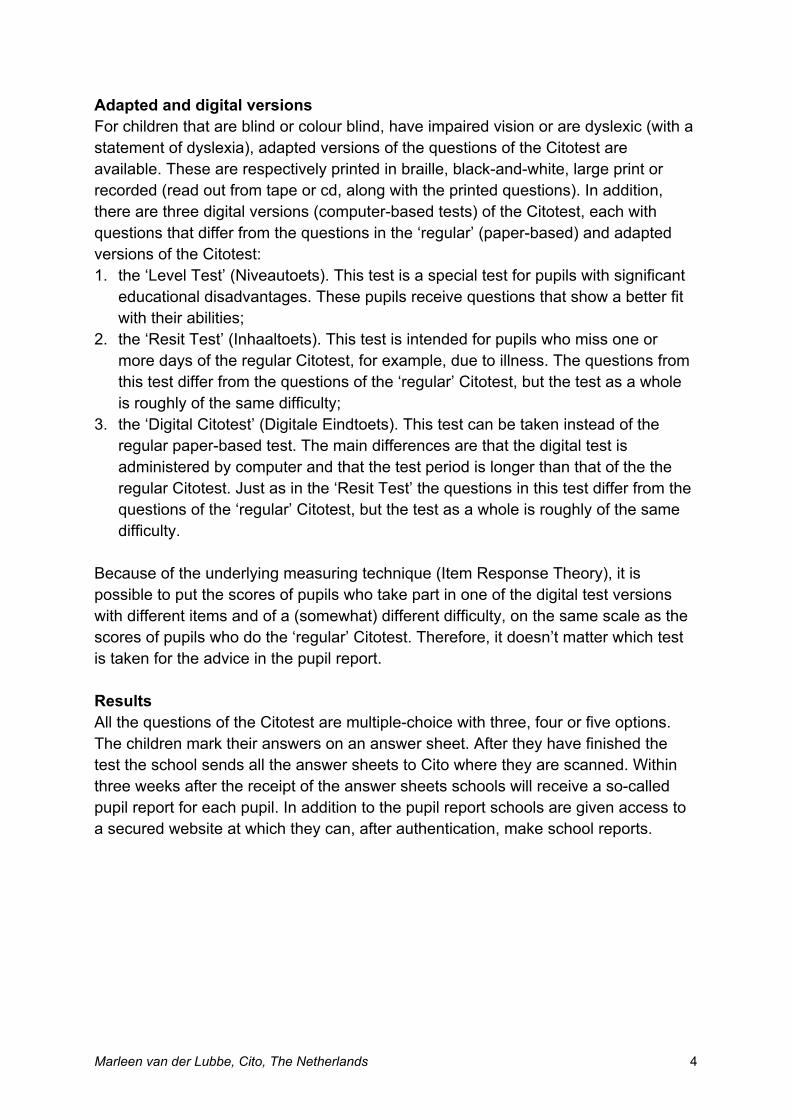
Content It takes three mornings to administer the Citotest. During that time a child will answer a number of questions about Language, Arithmetic/Mathematics, Study Skills and World Orientation (if the school participates in this section). Figure 4 shows the various sections, subsections and the number of questions in the Citotest. Figure 5 shows how these questions are divided over the three testing days. Figure 4: Test sections, subsections and the number of questions in the Citotest 2007 Number of questions
(percentage within test section) Language
a. Writing b. Spelling of verbs c. Spelling (all other than verbs) d. Reading comprehension e. Vocabulary
Total: 100 30 (3/10) 10 (1/10 ) 10 (1/10) 30 (3/10) 20 (1/5)
Arithmetic/Mathematics a. Dealing with numbers and mental arithmetic b. Proportions, fractions and percentages c. Geometry, money and time
Total: 60 25 (5/12) 20 (1/3) 15 (1/4)
Study Skills a. Using study texts b. Using Information sources ( e.g., dictionaries) c. Using schemes, tables and graphs d. Using maps
Total: 40 10 (1/4) 10 (1/4) 10 (1/4) 10 (1/4)
World Orientation (optional) a. Geography b. History c. Biology
Total: 90 30 (1/3) 30 (1/3) 30 (1/3)
Total: 290 questions
Figure 5: Division in tasks (in chronological order) and the number of questions in each task Number of
questions First testing morning
Language 1 (subsections b, c and d) Arithmetic/Mathematics 1 (subsections a, b and c) Language 2 (subsection a) World Orientation 1 (optional; subsection c)
30 20 20 30
Second testing morning Study skills 1 (subsections a and b) Arithmetic/Mathematics 2 (subsections a and b) Study skills 2 (subsections c and d) World orientation 2 (optional; subsection a)
20 20 20 30
Third testing morning Language 3 (subsection a and e) Arithmetic/Mathematics 3 (subsection a, b and c) Language 4 (subsection d) World orientation 3 (optional; subsection b)
30 20 20 30
Total: 290 questions
Marleen van der Lubbe, Cito, The Netherlands
4
Adapted and digital versions For children that are blind or colour blind, have impaired vision or are dyslexic (with a statement of dyslexia), adapted versions of the questions of the Citotest are available. These are respectively printed in braille, black-and-white, large print or recorded (read out from tape or cd, along with the printed questions). In addition, there are three digital versions (computer-based tests) of the Citotest, each with questions that differ from the questions in the ‘regular’ (paper-based) and adapted versions of the Citotest: 1. the ‘Level Test’ (Niveautoets). This test is a special test for pupils with significant
educational disadvantages. These pupils receive questions that show a better fit with their abilities;
2. the ‘Resit Test’ (Inhaaltoets). This test is intended for pupils who miss one or more days of the regular Citotest, for example, due to illness. The questions from this test differ from the questions of the ‘regular’ Citotest, but the test as a whole is roughly of the same difficulty;
3. the ‘Digital Citotest’ (Digitale Eindtoets). This test can be taken instead of the regular paper-based test. The main differences are that the digital test is administered by computer and that the test period is longer than that of the the regular Citotest. Just as in the ‘Resit Test’ the questions in this test differ from the questions of the ‘regular’ Citotest, but the test as a whole is roughly of the same difficulty.
Because of the underlying measuring technique (Item Response Theory), it is possible to put the scores of pupils who take part in one of the digital test versions with different items and of a (somewhat) different difficulty, on the same scale as the scores of pupils who do the ‘regular’ Citotest. Therefore, it doesn’t matter which test is taken for the advice in the pupil report. Results All the questions of the Citotest are multiple-choice with three, four or five options. The children mark their answers on an answer sheet. After they have finished the test the school sends all the answer sheets to Cito where they are scanned. Within three weeks after the receipt of the answer sheets schools will receive a so-called pupil report for each pupil. In addition to the pupil report schools are given access to a secured website at which they can, after authentication, make school reports.
Marleen van der Lubbe, Cito, The Netherlands
5
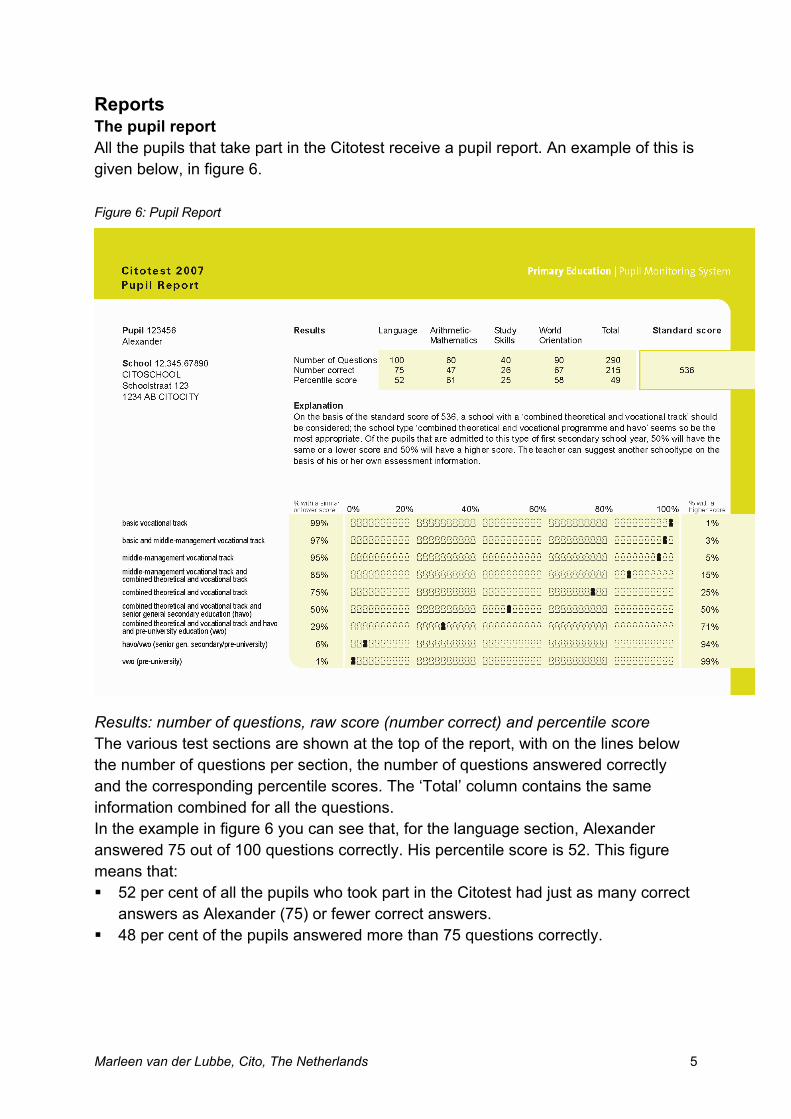
Reports The pupil report All the pupils that take part in the Citotest receive a pupil report. An example of this is given below, in figure 6. Figure 6: Pupil Report
Results: number of questions, raw score (number correct) and percentile score The various test sections are shown at the top of the report, with on the lines below the number of questions per section, the number of questions answered correctly and the corresponding percentile scores. The ‘Total’ column contains the same information combined for all the questions. In the example in figure 6 you can see that, for the language section, Alexander answered 75 out of 100 questions correctly. His percentile score is 52. This figure means that: 52 per cent of all the pupils who took part in the Citotest had just as many correct
answers as Alexander (75) or fewer correct answers. 48 per cent of the pupils answered more than 75 questions correctly.
Marleen van der Lubbe, Cito, The Netherlands
6
Results: standard score The standard score is a very important part of the pupil report (see top right). The standard score is a figure between 501 and 550 and is based on a transformation of the number of correct answers for Language, Arithmetic/Mathematics and Study Skills. The standard scores are set on a scale to which the number of correct answers on different editions of the Citotest can be transformed. Just in the same way as you can convert the English pound and the Euro into dollars, so that you can easily compare their value. Because of the scale of standard scores we are able to compare the scores from year to year despite the difference in difficulty of the tests. For example, the Citotest in 2007 was (a little) less difficult than the Citotest in 2006. That made it impossible to compare scores based on the number of questions answered correctly. However, it is possible to compare scores if we transform the number of questions answered correctly to the same scale. In the example in figure 6 you can see that Alexander has a standard score of 536. In the ‘Figurine Graph’ you can see how Alexander, with his standard score, would do in different types of secondary education. Figurine Graph The data in the figurine graph are based on a Cito study of pupils’ admission to secondary education and their subsequent success rate (the so-called Admission- and moving on research). In the left-hand column the various types of secondary education are listed. You can see that Alexander, with his score of 536, is among the very best pupils in the basic/vocational educational track of vmbo: only 1 per cent of the pupils there have a higher standard score. As to the ‘combined theoretical and vocational track and senior general secondary education (havo)’ he has an average score: 50 per cent of the pupils in that track scored the same or lower, while 50 per cent scored higher. At vwo level, Alexander would be among the pupils with the lowest scores: 99 per cent in that track scored higher. No child wants to end up in a school type that is either too difficult or too easy. It is therefore important to take the following into account: If the black figurine on a child’s pupil report is shown in the leftmost column of a
specific type of education (0% tot 20%), this type of education might be (far) too difficult for a child
If the black figurine is in the rightmost column (80% tot 100%), then chances are that this type of education is too easy
Explanation The explanation at the centre of the Pupil Report states which type of secondary education best fits that child based on his or her standard score on the Citotest. However, in no way does the Cito Test prescribe which type of school a child should enter. The Citotest is an independent assessment that should be used in combination
Marleen van der Lubbe, Cito, The Netherlands
7
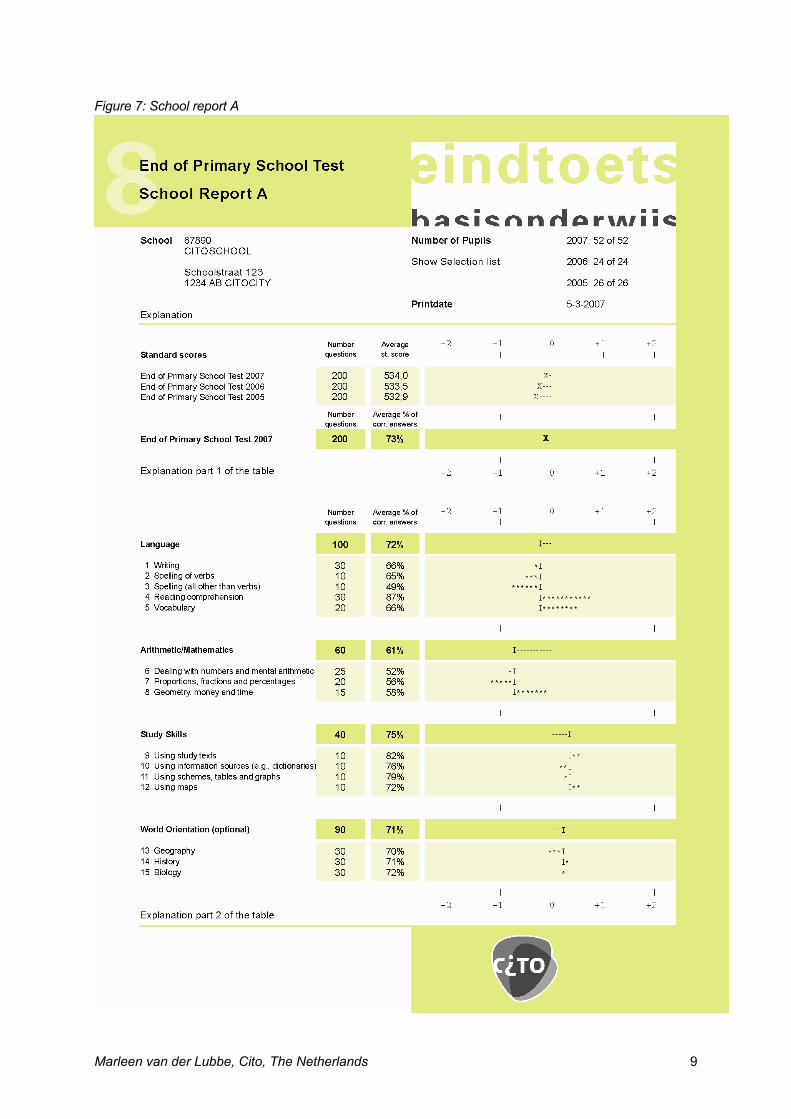
with (and in addition to) the primary school’s advice. In the vast majority of cases though, the results of the Citotest and the advice of the primary school are identical. And of course the parents and child’s own ideas and wishes also count when the parents choose an educational track. The school report for school self-evaluation Schools can make three different kinds of school reports based on the scores of their pupils (from grade 8): 1. School report A 2. School report B 3. the so-called IC-Table1 In school report A the score of a school is compared with the score of all the schools that took part in the Citotest. In school report B the score of a school is compared with the score of those schools that are very similar as far as their population of pupils goes (in relation to the socio-economic and cultural/ethnic background of the pupils). To this means schools are classified in ‘school groups’ which extend from 1 to 7. School group 1 consists of schools which have only children from a relatively high socio-economic and cultural/ethnic background, while school group 7 consists of schools which have only children from relatively low socio-economic and cultural/ethnic backgrounds. In figure 7 (on page 9) you see an example of school report A. At top of the report you can see information about the school (name, address and number of pupils). You can also see the date on which the report is generated. Part 1 of the report: the average standard score and total percentage of questions answered correctly Below the information about the school you see the number of questions and the average standard score of the school in the last three years (if a school has taken part in the test in all those years). For the most recent year (in this example 2007) you can also see the average total percentage of questions answered correctly. The average standard score and average percentage of questions answered correctly are not only given as an overall score, but are also graphically displayed underneath the -2..-1..0..+1..+2 area (displayed as X). -2, -1, 0, +1 en +2 are standardized scores (not the same as standard scores) with an average of 0. On both sides of 0, between -1 and 0 and 0 and +1, lies approximately 33% of the scores. Between -2 en -1 and +1 en +2 lies approximately 14% of the scores and below -2 and above +2 lies approximately 2,5% of the scores.
1 The abbreviation IC is an abbreviation in Dutch that indicates that this table consists of scores which are adjusted for variables related to the pupil population of a school.
Marleen van der Lubbe, Cito, The Netherlands
8
To sum up: 2,5% of the schools score lower than -2 16,5% of the schools score lower than -1 50% of the schools score lower than 0 83% of the schools score lower than 1 97,5% of the schools score lower than 2
In other words you could say that a score under or around -2 can be classified as far below average, a score under or around -1 below average, a score around 0 average, a score around or above 1 above average and a score around or above 2 far above average. In the example in figure 7 you can see that on the Citotest 2007 this school scores around average. Part 2 of the report: the percentage of questions answered correctly for each test section and subsection In the second part of the report you can see how the school scores on the different test sections and subsections. For each test section and subsection the number of questions and the average percentage of questions answered correctly is shown. The score is also graphically displayed underneath the -2..-1..0..+1..+2 area. For the graphical display of the score on the test sections (the figure I in the rows Language, Arithmetic/Mathematics, Study Skills and World Orientation), the score of the school is compared to the score of all the other schools that took part in the Citotest 2007 (for this is School report A). For the graphical display of the score on the subsections, the score of the school on the subsection (corresponding with the furthest *) is compared to the school’s score on the test section. In this way, within a test section, you can see on which subsection the school scores very high or low. In the example in figure 7 the score on the test section Arithmetic/Mathematics lies furthest below the average. If we look at the subsections within Arithmetic/Mathematics we see that the score on the subsection geometry, money and time lies relatively high above the average score of the school on the test section Arithmetic/Mathematics (however compared to all the other schools it is an average score). The score on the subsection proportions, fractions and percentages on the other hand is relatively low. This information is relevant for school self-evaluation purposes.
Marleen van der Lubbe, Cito, The Netherlands
9
Figure 7: School report A
Marleen van der Lubbe, Cito, The Netherlands
10
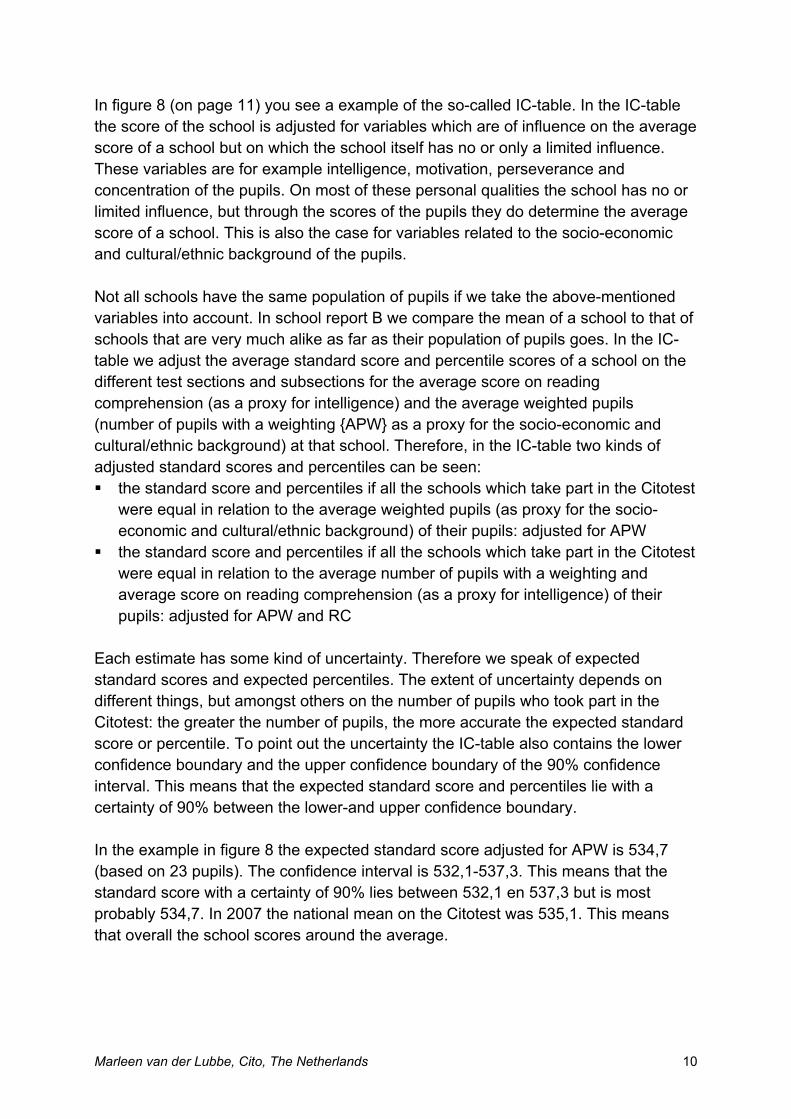
In figure 8 (on page 11) you see a example of the so-called IC-table. In the IC-table the score of the school is adjusted for variables which are of influence on the average score of a school but on which the school itself has no or only a limited influence. These variables are for example intelligence, motivation, perseverance and concentration of the pupils. On most of these personal qualities the school has no or limited influence, but through the scores of the pupils they do determine the average score of a school. This is also the case for variables related to the socio-economic and cultural/ethnic background of the pupils. Not all schools have the same population of pupils if we take the above-mentioned variables into account. In school report B we compare the mean of a school to that of schools that are very much alike as far as their population of pupils goes. In the IC-table we adjust the average standard score and percentile scores of a school on the different test sections and subsections for the average score on reading comprehension (as a proxy for intelligence) and the average weighted pupils (number of pupils with a weighting {APW} as a proxy for the socio-economic and cultural/ethnic background) at that school. Therefore, in the IC-table two kinds of adjusted standard scores and percentiles can be seen: the standard score and percentiles if all the schools which take part in the Citotest
were equal in relation to the average weighted pupils (as proxy for the socio-economic and cultural/ethnic background) of their pupils: adjusted for APW
the standard score and percentiles if all the schools which take part in the Citotest were equal in relation to the average number of pupils with a weighting and average score on reading comprehension (as a proxy for intelligence) of their pupils: adjusted for APW and RC
Each estimate has some kind of uncertainty. Therefore we speak of expected standard scores and expected percentiles. The extent of uncertainty depends on different things, but amongst others on the number of pupils who took part in the Citotest: the greater the number of pupils, the more accurate the expected standard score or percentile. To point out the uncertainty the IC-table also contains the lower confidence boundary and the upper confidence boundary of the 90% confidence interval. This means that the expected standard score and percentiles lie with a certainty of 90% between the lower-and upper confidence boundary. In the example in figure 8 the expected standard score adjusted for APW is 534,7 (based on 23 pupils). The confidence interval is 532,1-537,3. This means that the standard score with a certainty of 90% lies between 532,1 en 537,3 but is most probably 534,7. In 2007 the national mean on the Citotest was 535,1. This means that overall the school scores around the average.
Marleen van der Lubbe, Cito, The Netherlands
11
Figure 8: The IC-table
Marleen van der Lubbe, Cito, The Netherlands
12
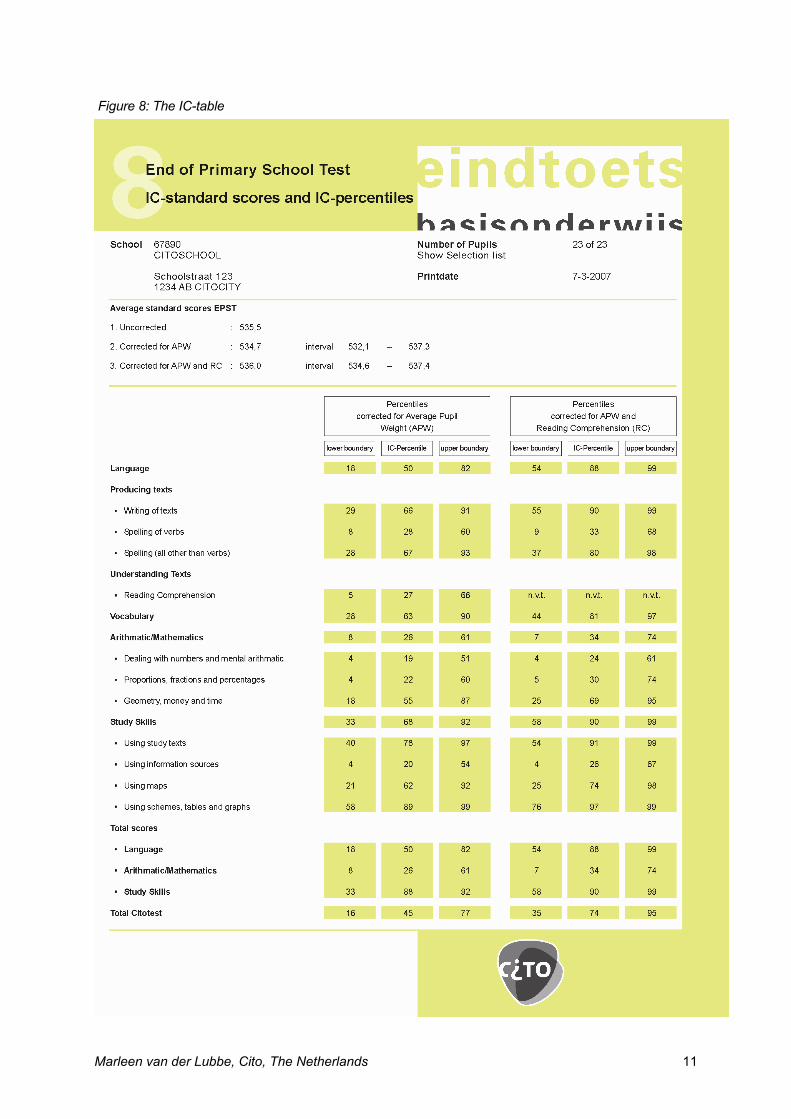
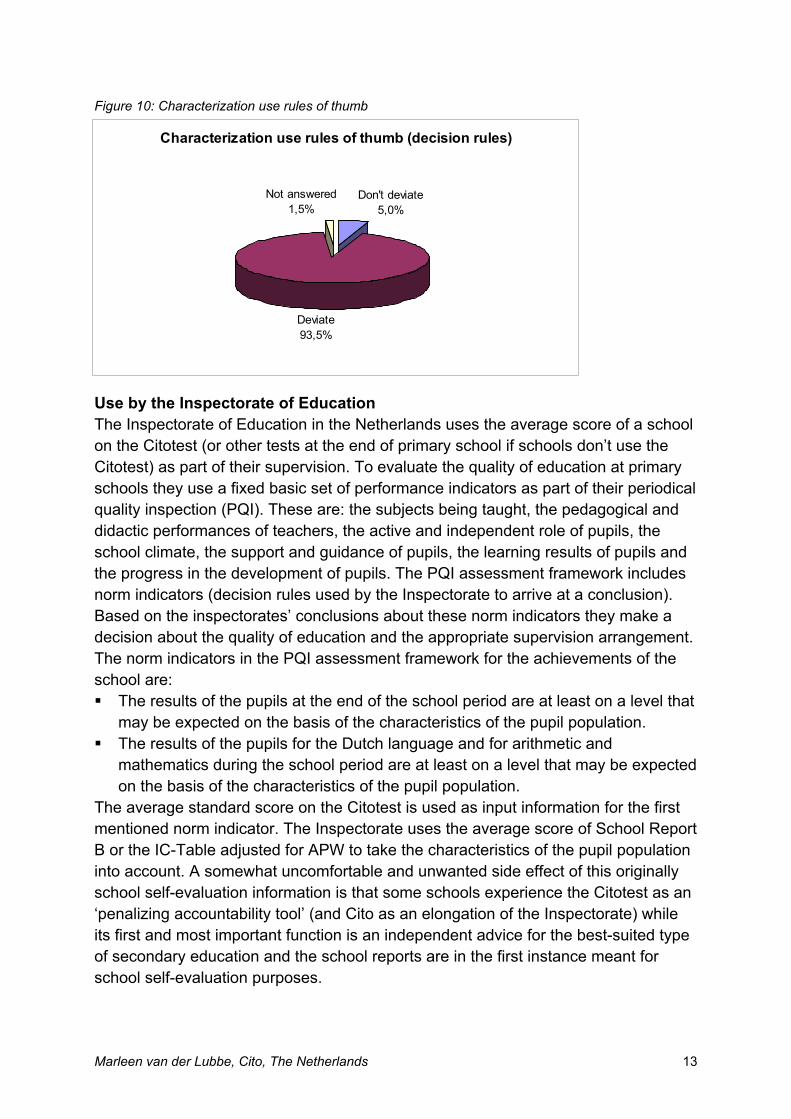
Use of the score on the Citotest Use by schools for secondary education The standard score and advice on the Pupil Report are used by schools for secondary education in the admission process. In the last couple of years there is a lot of media attention for the Citotest and especially for this topic. It is said that in the admission process schools for secondary education only take into account the standard score (and the advice based on the standard score) and that they do not use the advice of the primary school in cases of discrepancies between the two information sources. Cito had a different idea of the practice in schools for secondary education but could not substantiate this impression with research results. That is why Cito did some research in the school year 2004/2005 to find out how schools for secondary education use the standard score and advice on the Citotest. The most important finding was that most schools for secondary education interpret and use the score on the Citotest as meant by Cito, namely as a second opinion and a good predictor and not as a formal prescription of the type of secondary education a child must enter. In figure 9 you can see that in case of discrepancies schools of secondary education mostly consult the school for primary education (50,1%) in a personal contact about the pupils. Sometimes they want those pupils to do an additional test (7,8%) or they simply follow the advice of the primary school directly (8,3%). In only 0,3% of the cases they take exclusively the score on the Citotest into account. Figure 9: Basis of admission decision in case of discrepancies Most schools however (74%) use rules of thumb (decision rules) based on the standard scores in their admission process. That in itself is no problem if there is the possibility to deviate from the rules of thumb in case of discrepancies. In figure 10 is shown that 93,5% of the schools for secondary education do deviate from their own rules if necessary; 5% of the schools do not.
Basis of admission decision in case of discrepancies
Advice primary school 8,3%
Advice Citotest 0,3%
Consultation primary school
50,1%Additional research
7,8%
Other answer 11,3%
Not answered 22,2%
Marleen van der Lubbe, Cito, The Netherlands
13
Figure 10: Characterization use rules of thumb Use by the Inspectorate of Education The Inspectorate of Education in the Netherlands uses the average score of a school on the Citotest (or other tests at the end of primary school if schools don’t use the Citotest) as part of their supervision. To evaluate the quality of education at primary schools they use a fixed basic set of performance indicators as part of their periodical quality inspection (PQI). These are: the subjects being taught, the pedagogical and didactic performances of teachers, the active and independent role of pupils, the school climate, the support and guidance of pupils, the learning results of pupils and the progress in the development of pupils. The PQI assessment framework includes norm indicators (decision rules used by the Inspectorate to arrive at a conclusion). Based on the inspectorates’ conclusions about these norm indicators they make a decision about the quality of education and the appropriate supervision arrangement. The norm indicators in the PQI assessment framework for the achievements of the school are: The results of the pupils at the end of the school period are at least on a level that
may be expected on the basis of the characteristics of the pupil population. The results of the pupils for the Dutch language and for arithmetic and
mathematics during the school period are at least on a level that may be expected on the basis of the characteristics of the pupil population.
The average standard score on the Citotest is used as input information for the first mentioned norm indicator. The Inspectorate uses the average score of School Report B or the IC-Table adjusted for APW to take the characteristics of the pupil population into account. A somewhat uncomfortable and unwanted side effect of this originally school self-evaluation information is that some schools experience the Citotest as an ‘penalizing accountability tool’ (and Cito as an elongation of the Inspectorate) while its first and most important function is an independent advice for the best-suited type of secondary education and the school reports are in the first instance meant for school self-evaluation purposes.
Characterization use rules of thumb (decision rules)
Deviate93,5%
Not answered1,5%
Don't deviate5,0%
Marleen van der Lubbe, Cito, The Netherlands
14
Use by local authorities It is possible for local authorities to obtain the data of ‘their’ schools on the Citotest from Cito if they have permission for this from the proper authorities (the governing bodies) of the concerning schools. In that way they can see how ‘their’ schools are performing and which schools or subjects need extra attention. Just as with the Inspectorate this can have the side effect of the Citotest being used as ‘penalizing accountability tool’. Related to this use it is very important to keep in mind that it is not possible to draw simple conclusions about the quality of education based only on the score of the Citotest, especially if you take into account that there are various (some of them still unknown) variables which are of influence on the average score of a school, but on which the school itself has no or only a limited influence. Cito stresses the importance of that fact and the right use of the data in their communication.