the end of informality in mexico?services.iadb.org/wmsfiles/products/publications/37642208.pdf ·...
TRANSCRIPT

The End of Informality in Mexico?
Fiscal Reform for Universal Social Insurance
Arturo Antón Fausto Hernández Santiago Levy

The End of Informality in Mexico?
Fiscal Reform for Universal Social Insurance
Arturo Antón, Fausto Hernández and Santiago Levy
Inter-American Development Bank
2012

Cataloging-in-Publication data provided by theInter-American Development BankFelipe Herrera Library
Antón, Arturo.
The end of informality in Mexico? : fiscal reform for universal social insurance /
Arturo Antón, Fausto Hernández, and Santiago Levy.
p. cm.
Includes bibliographical references.
1. Social security taxes—Mexico. 2. Taxation—Mexico. 3. Informal sector
(Economics)—Mexico. I. Hernández, Fausto. II. Levy, Santiago. III. Inter-American
Development Bank.
HJ2466.A58 2012
Publication Code: IDB-MG-146
JEL Classification: J38; H26; O17
Copyright © 2013 Inter-American Development Bank. All rights reserved; may be
freely reproduced for any non-commercial purpose. The unauthorized commercial
use of Bank documents is prohibited and may be punishable under the Bank’s pol-
icies and/or applicable laws.
Inter-American Development Bank
1300 New York Avenue, NW
Washington, DC 20577
The opinions expressed in this publication are those of the authors and do not
necessarily reflect the views of the Inter-American Development Bank, its Board
of Directors, or the countries they represent.
Acknowledgements .................................................................................................... v
Abstract .....................................................................................................................vii
1. Introduction .......................................................................................................... 1
2. Informality, Illegality and Social Insurance .......................................... 11
3. Four Relevant Stylized Facts about Mexico........................................... 13
3.1 Low Tax Revenues and High VAT Evasion ..............................................13
3.2 High Firm Informality and Skewed Size Distribution ............................ 14
3.3 High Informal Employment ........................................................................15
3.4 High Mobility between Formal and Informal Employment ................... 16
4. The Model............................................................................................................ 19
4.1 The Intermediate Goods Sector ...............................................................20
4.2 The Final Good A Sector ........................................................................... 24
4.3 The Final Good B Sector ......................................................................... 25
4.4 Social Insurance, Wage Rates and the Labor Market ............................ 26
4.5 The Government’s Budget Constraint under the CSI+NCSI Configuration ...............................................................................................31
5. Data and Model Calibration ...........................................................................35
5.1 Data ............................................................................................................. 35
5.2 Model Fitness .............................................................................................36
6. Four Preliminary Questions .............................................................................41
6.1 Who Pays for Social Insurance? ............................................................... 41
6.2 What are the Effects of SI on Employment? ..........................................44
6.3 What are the Fiscal Costs of Subsidies to CSI and NCSI? ...................46
6.4 What is the Trade-off between VAT and CSI Taxes? .............................. 47
6.5 Assessment .................................................................................................49
Contents
iv
The end of informaliTy in mexico?
7. Universal Social Insurance and the End of Informality ............................. 51
7.1 What Does USI Consist of? ........................................................................51
7.2 The Labor Market and the Fiscal Balance under USI ............................ 53
7.3 Fiscal Reform under CSI and NCSI versus USI ..................................... 55
7.4 The End of Informality? ............................................................................ 59
7.5 Decomposition of the Increase in VAT Revenues ..................................60
7.6 Are VAT Collections of 7.1 Percent of GDP Feasible? ........................... 63
7.7 Costs of Labor Contracts: USI versus CSI+NCSI ....................................65
8. Complementary Social Insurance for Salaried Workers .............................67
8.1 A Second Pillar for Pensions ................................................................... 67
8.2 Complementary Pension Benefits and Taxes on Salaried Labor .........69
8.3 Complementary Pension Benefits and Savings ........................................71
8.4 Unemployment Insurance as Part of USI? .............................................. 73
9. Some Implications of USI for Poverty and Inequality, and for Productivity .................................................................................................. 75
9.1 The VAT, Poverty and Inequality .............................................................. 75
9.2 Labor Market Distortions, USI and Productivity .................................... 78
10. Implementation Issues .....................................................................................81
10.1 Registration and Reporting Requirements .............................................. 81
10.2 Pension Benefits......................................................................................... 83
10.3 Health Benefits .........................................................................................85
11. Concluding Thoughts .........................................................................................89
Appendix 1. Model Structure .................................................................................91
Appendix 2. Data and Model Calibration ....................................................99
Appendix 3. Costs of USI ......................................................................... 107
References ................................................................................................109

We thank Maria Victoria Fazio, Carlos Herrera and Oscar Palacios for excellent
collaboration with us, and Jaime Acosta, Emma Aguila, Alberto Barreix, Mariano
Bosch, Ana Corbacho, Guillermo Cruces, Carlos Elizondo, Eduardo Lora, Carlos
Sales, Jose Sidaoui, Teresa Ter-Minassian, Michael Walton and seminar participants
at the Economia workshop in Lacea in Santiago de Chile, CIDE, Coneval, BBVA-
Mexico and World Bank for very useful suggestions. Antón and Hernández are with
the Centro de Investigación y Docencia Económicas (CIDE); Levy with the Inter-
American Development Bank (IDB). The views expressed here are the authors’ and
do not necessarily coincide with those of the institutions with which they are affil-
iated. Antón and Hernández’s work was financed by the IDB as part of the Bank’s
research program on informality, productivity and social policy.
Acknowledgements

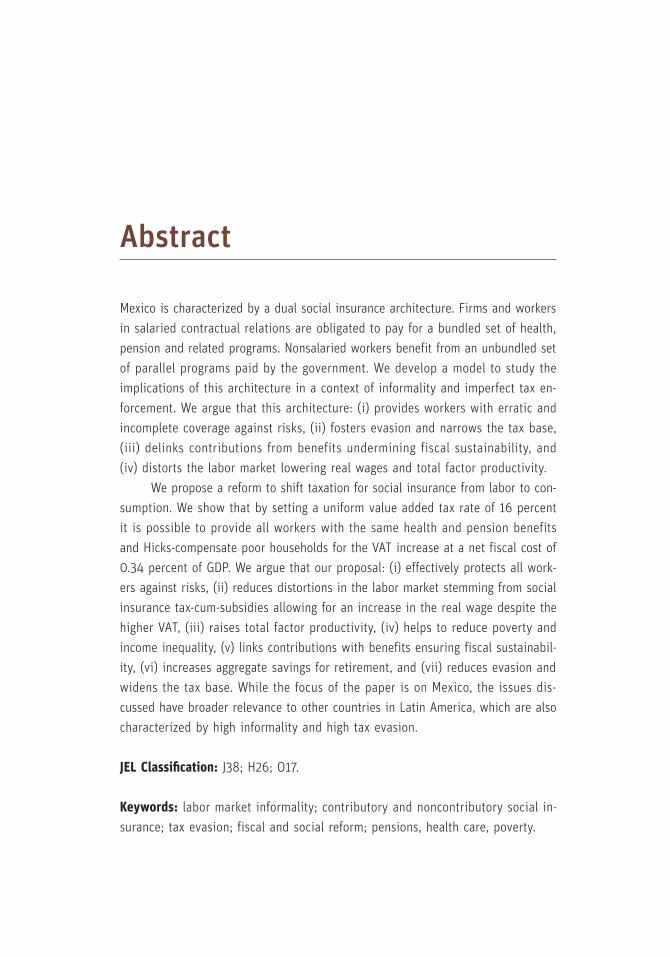
Mexico is characterized by a dual social insurance architecture. Firms and workers
in salaried contractual relations are obligated to pay for a bundled set of health,
pension and related programs. Nonsalaried workers benefit from an unbundled set
of parallel programs paid by the government. We develop a model to study the
implications of this architecture in a context of informality and imperfect tax en-
forcement. We argue that this architecture: (i) provides workers with erratic and
incomplete coverage against risks, (ii) fosters evasion and narrows the tax base,
(iii) delinks contributions from benefits undermining fiscal sustainability, and
(iv) distorts the labor market lowering real wages and total factor productivity.
We propose a reform to shift taxation for social insurance from labor to con-
sumption. We show that by setting a uniform value added tax rate of 16 percent
it is possible to provide all workers with the same health and pension benefits
and Hicks-compensate poor households for the VAT increase at a net fiscal cost of
0.34 percent of GDP. We argue that our proposal: (i) effectively protects all work-
ers against risks, (ii) reduces distortions in the labor market stemming from social
insurance tax-cum-subsidies allowing for an increase in the real wage despite the
higher VAT, (iii) raises total factor productivity, (iv) helps to reduce poverty and
income inequality, (v) links contributions with benefits ensuring fiscal sustainabil-
ity, (vi) increases aggregate savings for retirement, and (vii) reduces evasion and
widens the tax base. While the focus of the paper is on Mexico, the issues dis-
cussed have broader relevance to other countries in Latin America, which are also
characterized by high informality and high tax evasion.
JEL Classification: J38; H26; O17.
Keywords: labor market informality; contributory and noncontributory social in-
surance; tax evasion; fiscal and social reform; pensions, health care, poverty.
Abstract


On November 17, 1881, Germany’s Emperor William the First delivered an
Imperial Message to the National Parliament (Reichstag), expressing his
conviction that “the healing of social wrongs must be sought not solely
through the repression of social democratic excesses but just as much by posi-
tively advancing the well-being of workers”. Soon after this announcement, under
the leadership of his Chancellor Otto von Bismarck, the Reichstag approved the
Law Concerning Health Insurance for Workers (1883), the Accident Insurance Act
(1884) and the Law on Invalidity and Old Age Insurance for Workers, Journeymen
and Apprentices (1889). Thus was social insurance born, the cornerstone of the
modern Welfare State.
On December 1, 1940, Mexico’s President Avila Camacho delivered his
Inaugural Address to Congress, expressing his conviction that “we should all pur-
sue the goal, to which I shall devote all my energies, that soon social security
laws protect all Mexicans in times of adversity, when children are orphaned, when
women are widowed, in sickness, unemployment and old age, to replace these
hardships that we have all lived with as a result of the poverty of the nation”.
Soon after this announcement, in January 1943, Congress approved the country’s
first Social Security Law. Thus was social insurance born in Mexico.
Bismarck’s social insurance model was based on a key idea: benefits for
workers would be paid by the firms hiring them through an ear-marked tax (or
contribution) proportional to workers’ wages (initially set at 6 per cent!). As a re-
sult, the adjective contributory has been added to this model of social insurance
(henceforth CSI). Why was this method of financing chosen? Two motivations
stand out. The first, which we call the administrative convenience motive, is that
wages can be measured more easily by the fiscal authorities than other sources
of income; as a result, compliance can be exercised by auditing firms’ payrolls
Introduction
CHAPTER 1
2
The end of informaliTy in mexico?
1 Mexico has designed schemes to promote the affiliation of nonsalaried workers to CSI, but they have failed. In 2006 only 0.5 million out of a potential universe of 25 million of workers were enrolled in such a scheme called Voluntary Affiliation into the Obligatory Regime (Levy, 2008). They key difficulty, of course, is its voluntary nature. But even if the law obligated non-salaried workers to enroll, there would be no enforcement mechanism since observing their earnings is difficult, and even if such earnings could be observed, collection and enforcement costs would make this prohibitive. One can tax the wage bill of a firm with 100 workers in a fixed location with relative ease, and credibly impound the firm’s assets if it does not comply; it is a different matter to individually tax the earnings (out of wages? capital?) of 100 self-em-ployed workers dispersed through many locations, and to impound assets that may be worth less than the taxes due, or the costs of collection.
and by the fact that firms have a fixed location where assets can be impounded.
The obligatory nature of CSI—critical from the point of view of risk pooling—can
thus be enforced. The second, which we call the redistributive motive, is that it
can be argued that through CSI a share of firm’s profits is re-distributed to work-
ers. These are clearly important motivations. But Bismarck’s idea has a fatal flaw:
by design, the coverage of social insurance is limited by the method of financing.
While all workers are exposed to the risks being insured, even under full compli-
ance only workers hired by firms and receiving payments in the form of wages
are actually insured; self-employed workers and those who work with firms with
nonsalaried contracts are excluded.
Administrative convenience and redistribution motivations loom large in
Mexico’s case because of its high income inequality and because the Mexican
state has historically been characterized by its weak capacity to tax. In this con-
text, a tax that could be collected easily and also served to reduce inequality
was attractive indeed. Thus, the fatal flaw in Bismarck’s social insurance mod-
el was replicated in Mexico’s model. Despite President’s Avila Camacho goal
that “… soon social security laws protect all Mexicans…”, coverage was limited
to salaried workers (and their families). As a result, almost 70 years after the
country’s social security law was enacted, more than half of Mexican workers
are still excluded. Mexico’s Welfare State was born truncated, has remained so
since then, and, following its current path, will remain so forever.
Nonsalaried workers represent a major challenge for social insurance
(henceforth, SI). Under CSI there is no possibility of extending coverage to them
precisely because they are nonsalaried.1 But they need insurance nonetheless:
they can get sick, suffer from disability, fail to save for retirement, or die sudden-
ly as much as salaried workers can. As a result, over the last seven decades, the
Mexican government has gradually created programs to provide nonsalaried work-
ers with at least a subset of the benefits that salaried workers receive through CSI.

3
INTRODUCTION
These efforts began with low quality health programs (relative to those provided
by CSI). However, as years have gone by, and particularly since the mid 1990s,
these health programs, and new ones in pensions, day care and housing, have
expanded markedly in scope, quality, budget and coverage.2 In 2008, the govern-
ment spent at least 1.25 percent of GDP subsidizing health, housing, pension and
day care programs for those excluded from CSI; this contrasts with subsidies of
0.5 percent of GDP for CSI. Willy nilly, a parallel system of SI is being created in
Mexico, financed from revenues other than wage taxes.3 Following standard prac-
tice, we label this parallel system noncontributory social insurance, NCSI.4
Elsewhere, one of us has argued that the CSI+NCSI configuration is bad so-
cial policy and bad economic policy (Levy, 2008). It is bad social policy because,
first, during their working lives workers switch between salaried and nonsala-
ried status. Thus, sometimes they receive SI through CSI and sometimes through
NCSI: sometimes they are protected against some risks, and sometimes not; some-
times coverage is obligatory and sometimes it is voluntary.5 And second, because
CSI taxes are an ineffective redistributive tool as their incidence falls mainly on
workers (the letter and intention of the social security law notwithstanding). As
a result, neither the insurance nor the redistributive objectives are reached ef-
fectively. It is also bad economic policy because the CSI+NCSI configuration
translates into a tax on salaried labor and a subsidy to nonsalaried labor. Firms
and workers naturally react to this tax-cum-subsidy by shifting into activities that
2 See Levy (2008).3 From 1998 to 2007 subsidies for NCSI programs grew by 110 percent. In February 2006 President Fox issued a decree creating the National Council for Social Protection to “…ensure the functional integration of benefits in health, housing and savings for retirement, among oth-ers, that the federal government offers to the population lacking social security coverage”; see Levy (2008).4 Of course, there is no such thing as noncontributory social insurance, as benefits need to be paid by someone. More precise expressions are “social insurance contributory from wages” and “social insurance contributory from general sources of revenues”. However, to avoid confusion we follow standard practice and use the contributory and noncontributory labels. Importantly, NCSI programs should not be confused with targeted programs for the poor that transfer income through various means including conditional cash transfer programs like Progresa-Oportunidades (sometimes labeled social assistance programs); NCSI programs target beneficiaries on the ba-sis of their labor status, not income levels. Also, to avoid even more confusion we eschew the expressions “social protection” or “social safety nets”. 5 This is an inappropriate design from an insurance perspective as it reduces the scope for risk pooling, creates adverse selection problems and induces moral hazard behavior. It also se-riously limits the effectiveness of retirement pensions (regardless of whether they are defined benefit or defined contribution), as workers accumulate for their pensions only during the frac-tion of their working lives that they have a salaried job with a firm that complies with the law.

4
The end of informaliTy in mexico?
are intensive in nonsalaried labor, and when the production technology limits this,
by evading the tax on salaried labor adjusting the size of the firm, the duration
of contracts, and other variables, resulting in factor misallocations that are costly
from the point of view of productivity and growth (Busso, Fazio and Levy, 2012).
In this context, Levy (2008) has argued that there is a better alternative to
the CSI+NCSI configuration: providing all workers with the same SI, regardless of
their salaried or nonsalaried status. This can be accomplished by changing the
mix of financing from the current blend of wage taxes and other sources of reve-
nues, to a single source based on an ear-marked consumption tax. The proposal
rests on a simple idea: by changing the point where SI contributions are col-
lected from “the door of the factory” to “the door of the store”, the fatal flaw of
Bismarck’s idea can be overcome since the second door, as opposed to the first,
does not discriminate between salaried and nonsalaried workers; contributions
“at the door of the store” cannot be evaded by modifying the nature of the labor
contract or its duration, or the legal status of the firm.
More particularly, the proposal recognizes that because CSI taxes reduce sal-
aried workers’ wages, they basically change the composition of their consumption:
workers have less free disposable income in exchange for SI benefits. Put differ-
ently, CSI taxes are equivalent to a consumption tax on salaried workers that is
ear-marked for SI benefits. Two questions are relevant in this context. Why are
salaried workers obligated to pay directly for their SI through lower wages, while
nonsalaried workers get it from other sources of revenue? Would it not be more
efficient to lower all workers’ disposable income through the same mechanism—a
consumption tax—, and pursue redistribution objectives through another mecha-
nism? And while a consumption tax creates its own distortions (and can also be
evaded), these are substantially less costly than those created by the combination
of taxes on salaried labor and subsidies to nonsalaried labor implicit in Mexico’s
current CSI+NCSI model. A new SI architecture based on an ear-marked consump-
tion tax allows the government to minimize distortions in the market for the most
important nontraded input: labor. At the same time, critically, it allows the gov-
ernment to provide the same SI to all workers.
This paper studies a fiscal reform that changes wage-based contributions to
consumption-based contributions to achieve universal social insurance, USI. In
particular, we provide a quantitative evaluation of the four main aspects of Levy’s
proposal: to unify the differentiated structure of value added tax (VAT) rates at
the level of the highest existing rate; ear-mark the additional revenues together
with existing subsidies for CSI and NCSI to fund the same SI benefits for all work-
ers; drastically reduce CSI taxes so that they only finance risks specific to salaried

5
INTRODUCTION
status and complementary pension benefits; and compensate low-income house-
holds for the negative income effects of the VAT increase.6
Mexico, like other countries with a dual model of SI, is characterized by the
co-existence of formal and informal economic activity, a phenomenon directly re-
lated to this dualism. Mexico is also characterized by high tax evasion. Because
the interplay between formality and informality, on one hand, and legality and ille-
gality, on the other, is of the essence to the problem at hand, we develop a model
where these features are prominent (see Appendix 1). To capture the core distinc-
tion created by Bismarckian SI, we assume there are two sectors with alternative
contractual relations: one where firms and workers have salaried contractual rela-
tions and the other where workers are self-employed or where firms and workers
have nonsalaried contractual relations.7 Workers are formal when they are cov-
ered by CSI and informal when they are covered by NCSI. In parallel, we assume
enforcement is imperfect and focus on firm’s incentives to engage in illegal be-
havior by evading CSI or value added taxes. In this context, firms may not enroll
all their salaried workers in CSI; informal employment is thus made up of nonsal-
aried and illegally hired salaried workers.
A central feature of our model is that the division of employment between
salaried and nonsalaried, on one hand, and between formal and informal, on the
other, is endogenous to the taxes and subsidies implicit in the CSI+NCSI config-
uration and to the VAT. The same holds for the degree of firm compliance with
value added and CSI taxes. Firms are price takers and maximize profits in the
usual fashion, and as part of their maximizing strategies they may evade CSI or
value added taxes. If firms evade these levies, they face an endogenous proba-
bility of being detected and fined by the relevant authority, with such probability
depending positively on the firm’s size in the case of VAT, and on the firm’s size
and level of illegal salaried employment in the case of CSI taxes. These assump-
tions, which reflect the institutional context of Mexico where VAT is collected by
the Finance Ministry and CSI taxes by the Social Security Institute, imply that the
rates of tax compliance (and thus the rates of tax evasion) are specific to each tax
and firm. For example, firms may optimally choose not to pay CSI taxes on some
6 Narro, Moctezuma and Orozco (2011) also call for a major revision of the functioning of Mexico’s social security system, but do not dwell on its fiscal implications.7 This includes production in small family firms, production by farmers in sharecropping agree-ments, or agreements by firms to remunerate workers on the basis of units sold. The key point is that there are no salaried contractual relations—no subordination of a worker to a boss/firm in exchange for a wage—and therefore, according to Mexico’s labor and social security laws, no obligation that workers be enrolled in CSI.

6
The end of informaliTy in mexico?
workers if the probability of detection is relatively low. In that case, firms hire
some salaried workers legally and some illegally. At the same time, also depend-
ing on the probabilities of detection and on being fined, firms may also partly
or fully evade the VAT, and this behavior may also affect their compliance with
CSI taxes. Put differently, the VAT itself may augment informal employment. As
a result, the tax base and actual revenues depend on the array of CSI+NCSI and
value added taxes and subsidies, and on the extent of informality in the economy.
Our model incorporates intermediate inputs, an important feature given
our focus on the VAT. Firms producing intermediate inputs can also evade taxes.
Because the VAT is assumed to work via the credit method, where firms that pay
VAT on an intermediate input can receive a credit only if they pay VAT on their
own output, the model allows for a mechanism where informality is transmitted
across the production chain, as in de Paula and Scheinkman (2010).
To capture how the economy responds to the fiscal-cum-social reform that
we propose, we first focus on how evasion of CSI and value added taxes changes
under different policy combinations, given the government’s enforcement efforts.
In doing this we stress a very important point, often missed in discussions of
SI: the composition of public spending on SI is as important as the level. Higher
subsidies to NCSI enlarge the size of the informal sector directly, induce more
evasion, and lower total tax revenues; higher CSI taxes also induce more evasion
and enlarge the informal sector, but increase total revenues. On the other hand,
subsidies to CSI reduce the incentives to evade, increase formal employment and
expand the tax base and total tax revenues. Differently put, in an economy char-
acterized by the CSI+NCSI duality, the method of increasing public spending to
expand the coverage of SI has large fiscal implications. Thus, our model captures
the sharp trade-offs between social and economic objectives present in a dual sys-
tem of SI: on one hand, attempts to complete Mexico’s truncated Welfare State by
expanding NCSI will have negative implications for fiscal sustainability (and for
productivity); on the other, not attempting to do so would leave millions of work-
ers with no or limited coverage of SI.
The key result of our paper is to show that these trades-offs can be avoided
by moving to a model of universal social insurance. The proposed fiscal-cum-social
reform yields important gains in workers’ real wages and welfare, without plac-
ing an undue burden on the government’s fiscal balance. In our central estimate
we find that after fully compensating various groups, the fiscal deficit under USI
would be 0.34 percent of GDP higher vis-à-vis the status quo. The effort needed
to accommodate this figure by raising revenues or reducing expenditures else-
where would need to be balanced against what the proposal implies: namely, by

7
INTRODUCTION
far the most ambitious social reform in Mexico since the birth of SI in 1943, a
drastic reduction of productivity-reducing distortions in the labor market, and the
medium term fiscal sustainability of SI policy.
To illustrate this key result, we calibrate our model to replicate key features
of Mexican data observed in 2008, including the distribution of employment by
firm size and formality status, the observed levels of CSI and VAT evasion and,
critically, the government’s fiscal balance. We next proceed to evaluate our pro-
posal in two stages. First, we model a fiscal reform that simultaneously imposes
a 16 percent VAT on all goods and completely eliminates all CSI taxes and NCSI
subsidies; second, we examine the same reform reintroducing taxes on salaried
labor—but at drastically lower rates than under CSI—, to ensure that pension ben-
efits for salaried workers are at least as generous as under CSI.
In the first stage we find that, after taking tax evasion by firms into account,
a complete shift from labor to consumption taxes increases the VAT revenue/GDP
ratio from 0.038 to 0.071. This large increase in revenues results from eliminating
distortions in both labor and goods markets at the same time.8 These resources
more than compensate for the revenues lost by eliminating CSI taxes, and at the
same time finance the extra expenditure required to sustain USI. We estimate that
after the VAT increase, real wages would be 15 percent higher, as labor is allocat-
ed more efficiently when the tax on salaried labor and the subsidy to nonsalaried
labor are eliminated. In parallel, the associated contraction in nonsalaried em-
ployment helps expand the tax base and therefore helps increase VAT revenues
(since both tax rates and tax compliance are lower for the self-employed and for
family firms). Finally, we estimate that the transition from the current CSI+NCSI
to the USI model implies an increase in public spending in social insurance of
2.8 percent of GDP, as all workers receive the same health and pension benefits.
Critically, this large increase in social spending can occur while labor market dis-
tortions are substantially diminished and fiscal sustainability strengthened, as
opposed to what would occur if the same expansion in SI occurred by raising the
benefits provided by NCSI to the level of CSI (as has been gradually happening
over the last few decades).
In the second stage, to ensure that salaried workers receive at least
the same pension benefits as they do under CSI, we extend our proposal
8 The simultaneity of the changes in CSI and value added taxes is central to our results, in par-ticular to the reduction of informality. As shown below, a pure increase in value added taxes, while increasing revenues, raises as well the level of informality, a result consistent with the literature; see Emran and Stiglitz (2005) and Keen (2008).
8
The end of informaliTy in mexico?
complementing the VAT-financed USI benefits for all workers with additional bene-
fits for salaried workers paid from wage-based taxes. As a result, these latter taxes
would not be completely eliminated; nevertheless, we estimate that they would
fall from 32 percent of the wage under CSI to an average of 5.5 percent under our
proposal. This drastic reduction in the wedge between what firms pay for salaried
labor and what salaried workers earn allows for both lower labor costs and high-
er real wages (despite the VAT increase, as noted). This reduction in firms’ labor
costs is de facto equivalent to a real depreciation of approximately 10 percent (a
result at times labeled as “fiscal devaluation”).
To avoid any regressive effect of the VAT increase on the poor, we calcu-
late the resources needed to Hicks-compensate households in the first two deciles
of the distribution. When these compensations are considered, the proposal has
a large and unambiguously positive effect on reducing poverty: under USI poor
Mexican workers would earn a higher real wage, would be covered by the same
SI as other workers, would pay no net additional taxes, and would experience
the largest reduction in wage-based taxes (from 32 percent 1.5 percent). Equally
importantly, our proposal would complement current efforts to combat poverty
through direct income transfers, particularly those effected through the Progresa-
Oportunidades program, with significant improvements in the functioning of the
labor market and in poor workers’ possibilities of finding more stable jobs with
better prospects for productivity gains through their working lives.
Although we think these results are interesting in their own right, the focus
of the paper is on the policy implications. As a result, the robustness of our nu-
merical estimates is critical, particularly those centered on the additional revenues
produced by the VAT reform. To assess this issue, we note that the core transmis-
sion mechanism in our model is the re-allocation of labor, which shifts between
nonsalaried and legal and illegal salaried employment in response to changes in
the VAT and CSI+NCSI taxes and subsidies.9 In this context, we estimate the same
VAT reform but maintain CSI+NCSI taxes and subsidies. As expected, in this case
informal employment increases in response to the higher VAT (as firms evade
more and self-employment and family firms expand), so the revenue to GDP ratio
increases only from 0.038 to 0.068, as opposed to the increase to 0.071 when
9 Throughout the paper we assume an inelastic labor supply. There is a large literature on the impact of taxes on participation rates (see, for example, OECD, 2011); on the other hand, the impact on the formal/informal and salaried/nonsalaried composition of the labor force is rela-tively less studied and, for Mexico, central.
9
INTRODUCTION
CSI+NCSI taxes and subsidies are eliminated. This result highlights the importance
of the simultaneous reduction in CSI+NCSI taxes and subsidies to reduce infor-
mality in the face of the VAT reform. But, more importantly for our purposes, it
provides reassurance to policymakers that even if, after eliminating CSI taxes and
subsidies, labor is re-allocated in the opposite direction as that predicted by our
model—an overly pessimistic result contrary to theory and evidence—, the associ-
ated loss in VAT revenues is in the order of 0.3 percent of GDP.
Our proposal has implications for productivity. A growing literature focuses
on policies that generate productivity losses by inducing resource misallocations.10
In our case, misallocations arise from differences in VAT rates between sectors,
differences in the price of labor depending on whether the contractual relation
is salaried or nonsalaried, and differences in the expected price of salaried labor
across firms of different size given that the expected costs of evasion increase
with firm size. The proposal eliminates these differences, and results in better
factor allocation and, in principle, productivity gains. We do not quantify these
gains, but note only that our proposal would result in higher productivity. This is
also a critical result because, first, lagging productivity growth is the main rea-
son why Mexico’s growth performance has been lackluster over the last decades
(Levy, 2010); and second, because in Mexico the distortions implicit in the for-
mal-informal dichotomy are associated with large total factor productivity losses
(Busso, Fazio and Levy, 2012).
Bismarckian SI is the norm rather than the exception in Latin America.
Many countries in the region are also characterized by large informality and high
tax evasion. In parallel, in some of these countries NCSI programs are also pres-
ent. One can reasonably expect such programs to expand in the years ahead as
the region’s governments respond to the desire for increased coverage of SI and,
more generally, greater social equity. Under the current CSI+NCSI architecture,
many of these countries may be expanding the coverage of SI at the cost of high-
er fiscal vulnerability and larger productivity-reducing distortions. Thus, while the
focus of the paper is on Mexico, we believe the issues discussed here have broad-
er relevance.
The rest of the paper is organized as follows. Section 2 contains a brief dis-
cussion of Mexican SI policies and informality. Section 3 presents relevant stylized
facts on tax evasion, informality and labor mobility. Section 4 builds a simple
10 See Gollin, 2006; Restuccia and Rogerson, 2008; Guner, Ventura and Xu, 2008; Hsieh and Klenow, 2009a, 2009b; and Leal, 2010.

10
The end of informaliTy in mexico?
model to capture the behavior described above, while data and calibration are
discussed in section 5. Section 6 studies the distortionary effects of CSI+NCSI tax-
es and subsidies. Sections 7 and 8 present our proposal. Section 7 describes the
impact of a fiscal reform to finance USI on the government’s fiscal balance and
worker’s welfare. Section 8 addresses coverage of risks that are specific to sala-
ried workers and complementary pension benefits. Section 9 briefly touches on
the implications of our proposal for poverty and productivity. Section 10 discuss-
es implementation issues. Section 11 concludes.
Informality is a term that has the dubious distinction of combining maximum policy importance and political salience with minimal conceptual clarity and
coherence in the analytical literature” (Kanbur, 2009). In this context, we follow
Kanbur and define informality with respect to the inobservance of a particular reg-
ulation. Given our focus on SI, the relevant regulation is coverage of CSI.
Our definition of informality allows us to clearly identify formal and infor-
mal workers, since at any point in time an individual worker is either enrolled in
CSI or not. The same does not hold for firms, however, since at the same point
of time an individual firm may enroll only a subset of its workers with CSI; thus,
in this case it is better to think of a formality-informality continuum, with indi-
vidual firms located in this continuum as a function of their degree of evasion
of CSI taxes. The impossibility of defining firms as unambiguously formal or in-
formal implies in turn that the formal and informal sectors cannot be measured
with precision. In some general sense, however, it is clear that as the number of
informal workers increases (salaried or nonsalaried), and firm evasion of CSI tax-
es grows, the size of the informal sector expands.
Informality and illegality are not equivalent. Even if value added and CSI
taxes were perfectly enforced, there would be self-employment and family firms,
and thus an informal sector as some workers would not be covered by CSI. Put
differently, there would be no illegality but there would be informality. On the
other hand, illegality can occur with respect to either CSI or value added taxes.
Because for the reasons explained below firm’s evasion of both taxes is correlat-
ed, informality and illegality will overlap. That said, firms may comply with VAT
but evade CSI taxes; this is relevant in a context like Mexico’s, where firms face
different VAT rates depending on the good they produce and, more particularly,
Informality, Illegality and Social Insurance
CHAPTER 2

12
The end of informaliTy in mexico?
because some goods are exempt from VAT. In this case, firms exhibit legality with
regard to the VAT and illegality with regard to CSI taxes.
Informality is not defined by the size of firms. This is because depending
on the probabilities of detection, some firms may enroll all of their workers in
CSI while others may not. Of course, to the extent that these probabilities are
correlated with the size of the firm, the tendency will be to find proportionately
more small firms in the informal end of the formal-informal continuum, and pro-
portionately more large firms on the other end. But note that the distribution of
firms in this continuum is endogenous to the incentives they face. Put differently,
the same firm may be more or less formal depending on the configuration of CSI,
NCSI and value added taxes and subsidies, given enforcement.
Informality is also not equal to self-employment and or employment in fami-
ly firms, precisely because some salaried workers may not be covered by CSI. Nor
is informality, finally, equivalent to poverty because, on one hand, the evidence
shows that some poor salaried workers are enrolled in CSI, and because, on the
other, many non-poor workers are either nonsalaried or not registered by the firms
that hire them with CSI. In fact, there are almost twice as many informal workers
in Mexico as there are poor workers (although most poor workers are informal; see
Levy, 2008).
The distinction between informality and illegality is important from the
perspective of SI because in Mexico CSI and NCSI programs are not the same.
Workers enrolled in CSI are obligated to purchase a bundle of benefits that can-
not be separated; workers covered by NCSI can voluntarily access any of the
benefits that are freely offered. As a result, only in the first case is the gov-
ernment assured that workers are protected against the risks that it considers
relevant.1 Indeed, if the scope and obligatory nature of CSI and NCSI programs
were the same, the distinction between formality and informality would not be
relevant; workers would always be covered against the same risks regardless of
their salaried or nonsalaried status, and regardless of firm’s behavior. On the
other hand, even if this was the case, it would still be relevant if firms evaded
their tax obligations. Put differently, informality is a concern from the perspec-
tive of the government’s social objectives; illegality from the perspective of its
fiscal objectives.
1 Thus, only under CSI are workers forced to save for their retirement pension and forced to purchase life and disability insurance. See Levy (2008) for a fuller discussion.
3.1 Low Tax Revenues and High VAT Evasion
Mexico’s tax system is strongly centralized, as approximately 96 percent of total
revenues are levied and collected by the federal government (including income,
value added, foreign trade and most excise taxes). In addition, the tax code is
characterized by many exemptions and special regimes which, combined with im-
perfect enforcement, translates into a low tax to GDP ratio (Antón and Hernández,
2010; Elizondo-Mayer, 2010). In 2008 this ratio equaled 0.098 compared to a
Latin American average of 0.173.
Special regimes are particularly relevant with respect to VAT. The general
rate is 16 per cent (15 percent in 2008), but food and medicine are zero-taxed
while other services are tax-exempted (education, cultural activities, private med-
ical expenses, some financial services, books and magazines). Furthermore, rates
at Mexico’s border zones are 11 per cent (10 percent in 2008). These features,
combined with high levels of evasion, resulted in a VAT to GDP ratio of 0.037 in
2008. Importantly, Antón and Hernández (2010) estimate that with the current
exemptions but without evasion this ratio would equal 0.061, suggesting that in
2008 VAT evasion resulted in losses of revenue of 2.4 percent of GDP.
Special tax regimes go beyond sectors. Self-employed workers and fami-
ly firms may be exempt from the VAT and income tax regime. Instead, these two
taxes can be substituted by one on gross sales as long as sales are below an ex-
ogenous threshold. This regime is known as Repeco, the Spanish acronym for
Régimen de Pequeños Contribuyentes (roughly, Minor Taxpayer Regime). Three
features of this regime are relevant. First, it prohibits firms from issuing invoices
to firms that pay taxes under the normal VAT regime. Second, firms whose sales
increase beyond the exogenous threshold and thus pay taxes under the normal
Four Relevant Stylized Facts about Mexico
CHAPTER 3
14
The end of informaliTy in mexico?
value added and income tax regime cannot re-enter as Repecos even if their sales
fall below the same threshold. These two features serve to, de facto, permanently
segment firms between those that contribute as Repecos and those that contrib-
ute under the normal regime.1 The third feature is evasion. While there are no
estimates of the potential revenues that under full compliance would be collect-
ed from Repecos, it is nonetheless surprising that in 2008 total collections were
only 0.0004 percent of GDP.
3.2 High Firm Informality and Skewed Size Distribution
Workers in Mexico can be enrolled in CSI only if the firm that hires them is reg-
istered with the Mexican Institute of Social Security (henceforth IMSS, for its
Spanish acronym). As a result, the number of firms registered with IMSS can be
used as a proxy of firm formality, even if firms do not fully pay CSI taxes. On the
other hand, the Economic Census captures firms in Mexico regardless of whether
they are registered with IMSS or not. That said, we note that despite its name,
the Census captures only economic activity taking place in fixed establishments
in urban areas; urban employment in the streets and other non-fixed locations is
excluded, as is rural employment. Table 1 compares the number of establishments
captured in the 2008 Census with those registered with IMSS in the same year.
According to the Census, there were 3,724,019 establishments in 2008; IMSS,
however, recorded only 795,466 establishments in that year.2
As can be seen, the discrepancy between IMSS and Census data is inversely
associated with firm size (measured by the number of workers). Firm compli-
ance with IMSS registration increases with size. On the other hand, note that 89
1 Valero and Sánchez-Vela (2010) show that the co-existence of the Repeco and normal val-ue added and income tax regimes introduces a discontinuity in the profit function of tax com-pliant firms, implying that if both regimes were fully observed there would be a range of sales volumes for which profit maximizing firms would not exist. Also note that the prohibition for firms under the Repeco regime to issue invoices to firms under the normal VAT regime implies the breakdown of the value added chain for purposes of accrediting the VAT. In particular, tax-compliant firms under the normal VAT regime will be dissuaded from purchasing intermediate inputs from firms under the Repeco regime. 2 The correspondence between Census and IMSS data is imperfect. The unit of observation in the Census is the establishment; for IMSS it is the firm. Some firms may have more than one establishment, so the comparison may overestimate the number of unregistered firms. This problem affects mostly very large firms, as most small firms have only one establishment. On the other hand, some firms may have more than one registry in IMSS. Again, this occurs most-ly for very large firms, who for accounting or tax purposes report as two or more legally sep-arate firms (this explains why there are 2 percent more firms with 50 or more workers in the IMSS than in the Census data).

15
FOUR RELEVANT STYLIzED FACTS ABOUT MEXICO
percent of firms captured by the Census have fewer than five workers, 95 percent
less than ten, and only 1 percent more than fifty. The picture that emerges from
Table 1 is that of an economy characterized by a skewed size distribution of firms.
On one end, there is a large number of mostly small informal firms evading or
eluding CSI taxes (and by-and-large paying no VAT with perhaps a few contribut-
ing under the Repeco regime). On the other end, there is a very small number of
mostly formal large establishments that comply with their CSI and value added
and income taxes. In the middle, there are relatively small number of semi-for-
mal firms partly complying with both CSI and value added and income taxes.3
3.3 High Informal Employment
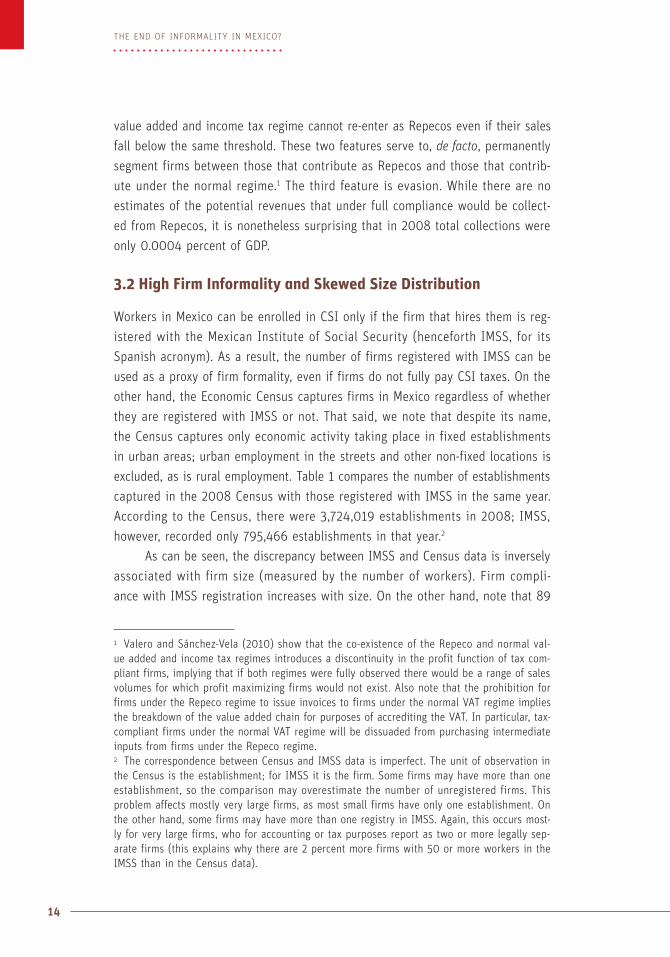
Table 2 presents the distribution of employment by firm size and formality sta-
tus in 2008. Panel A presents data on urban employment in firms included in the
Economic Census. Panels B and C show, respectively, urban employment not as-
sociated with firms included in the Census and rural employment (see Appendix
2 for details of data and methodology).4
Various aspects are of interest. First, the Census underestimates economic
activity in Mexico; in fact, it accounts for only 51 percent of all private workers
(19.6 million/38.4 million). Second, even within employment captured by the
Table 1: Registries of Firms, 2008
Firm size (number of
workers)
Census (number of
firms)
IMSS (number of
firms)IMSS/Census
(percent)
Share in Census total
(percent)
1–5 3,312,092 542,064 0.16 0.89
6–10 224,086 101,231 0.45 0.06
11–50 149,968 113,458 0.76 0.04
51+ 37,873 38,713 1.02 0.01
Total 3,724,019 795,466 0.21 1.00
Source: Economic Census and IMSS data.
3 Leal (2010) compares the distribution of employment by firm size in Mexico with the United States. When only employment in formal firms is compared, the two distributions overlap con-siderably; when employment in informal firms in Mexico is added, however, the distributions differ importantly as a result of large left tail of employment in mostly small and informal firms.4 The occupied labor force includes also 4.6 million public sector workers who, however, have their separate SI regime. In the reminder of the paper we focus only in non-public employment.
16
The end of informaliTy in mexico?
Census, informal employment is larger than formal (10.9 million vs. 8.7 million);
in addition, note that informality is inversely related to firm size, a fact that is
consistent with firm evasion of CSI taxes noted in Table 1. Third, the majority of
workers not captured by the Census are informal (16.8 million out of 18.8 mil-
lion in Panels B and C). All in all, 72 percent of private employment is informal,
with a large share accounted by self-employed workers, or by firms with up to
five workers (47 percent of all private employment). Thus, Table 2 complements
Table 1 and indicates that informal employment in Mexico occurs both in firms
(presumably illegal) or in establishments without a fixed location (street mar-
kets and stands), or by self-employed individuals (street vendors and the like,
and rural workers).
3.4 High Mobility between Formal and Informal Employment
Lastly, Mexico’s labor market is characterized by high mobility of individual work-
ers between formal and informal status. Table 3 exploits the panel structure of
Table 2: Total Private Occupied Labor Force, 2008 (thousands of workers)
Firm size Formal Informal Total
Panel A: Urban employment captured in Census
1–5 596 8,174 8,770
6–10 733 981 1,714
11–50 2,731 1,060 3,791
50+ 4,665 687 5,352
Total 8,725 10,902 19,629
Panel B: Urban employment not captured in Census
Self-employment 9 4,064 4,073
2–5 213 6,015 6,228
6 + 1,517 1,403 2,920
Total 1,739 11,482 13,223
Panel C: Rural employment not captured in Census
Distribution by size not available
283 5,354 5,638
Total 10,747 27,738 38,485
Source: Authors’ calculations with Economic Census and Employment Survey data.
17
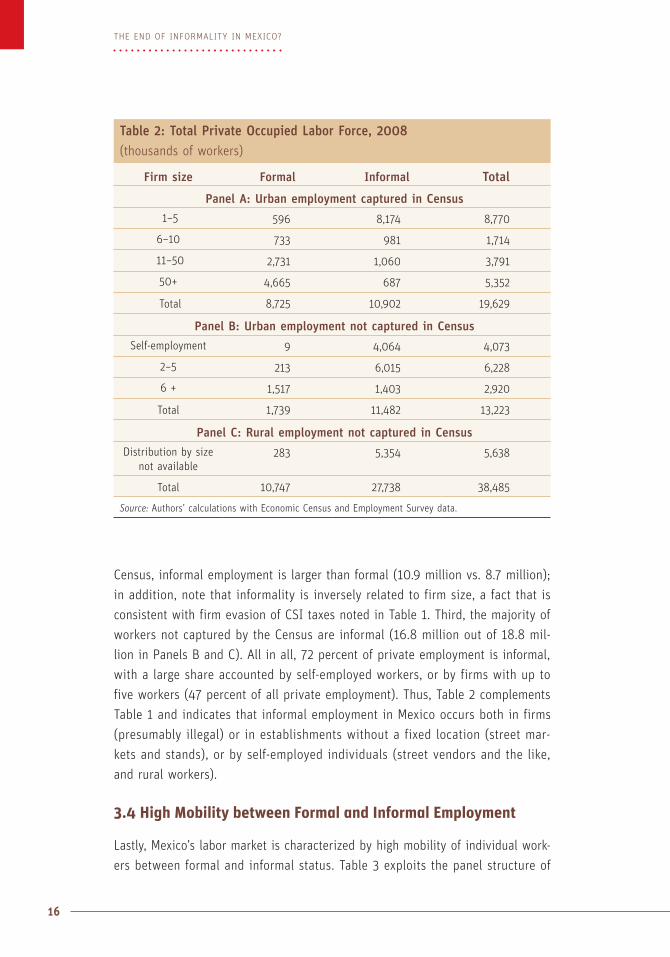
FOUR RELEVANT STYLIzED FACTS ABOUT MEXICO
Mexico’s employment survey to separate job and status changes between 2007
and 2008. The data are presented as a transition matrix, with the rows referring
to the status of workers in 2007, and the columns to the status of the same work-
ers one year later.
As can be seen, 80 percent of workers who were formal in 2007 kept the
same job and their formal status one year later, while 20 percent changed either
job or status or both. Of the latter, 8.6 percent had the same job one year later,
but transited to informal status. This change, which at first sight may sound con-
tradictory, is a reflection of firm’s evasion strategies, as they register only a subset
of their workers with CSI and rotate who they register.5 An additional 7.1 percent
changed jobs, but kept their formal status. This change is what is normally con-
sidered as churning, as a worker changes jobs from one formal firm to another,
but with no implications for the coverage of SI. Finally, 4.2 percent changed both
jobs and formality status, meaning that they changed from a job with a firm that
registered them with CSI to another job with a firm that failed to register them
with CSI, or to self-employment or a family firm. Similarly, 77 percent of work-
ers who were informal in 2007 kept that status one year later; 6 percent kept
the same job, but transited to formality (presumably because their firm registered
them with CSI); 13 percent changed into another informal job; and 3 percent into
a formal job.
Table 3: Workers Job and Status Change, 2007–2008(shares)
Status in 2008
No job or
status change
Status change, no job change
Job change,
no status change
Job and status change Total
Status in 2007
Formal 80.1 8.6 7.1 4.2 100.0
Informal 77.3 6.0 13.5 3.2 100.0
Source: Authors’ calculations based on Employment Survey data.
5 Levy (2008) reports that IMSS experiences about 15 million changes in worker registration a year, with a total stock of formal workers of around 13 million. Some of these registration changes reflect true hiring and firing as firms adjust employment to various shocks, but some also reflect registration rotation without any changes in the individuals working in the firm.

18
The end of informaliTy in mexico?
On average, 11 percent of all workers changed status in one year, with or
without a job change. This phenomenon, which needs to be distinguished from the
normal churning of a labor market, implies that 11 percent of workers transited in
one year between coverage of CSI and coverage of NCSI. More generally, and over
longer time spans, Mexican workers experience various episodes of CSI and NCSI
coverage during their working life, with the associated implications for the cov-
erage of risks at the individual level, risk pooling at the aggregate level, and the
accumulation of savings for retirement at both individual and aggregate levels.6
6 Levy (2008) uses the IMSS records to construct a panel data of all workers registered in IMSS in 1997 and follows them over the 1997–2006 period, dividing workers between those earning high and low wages (more or less than three times the minimum wages). He finds that high wage workers spent 77 percent of that decade in formal jobs, compared to 49 percent for low wage workers. He also finds greater frequency of entry and exit from formality for low wage workers than for high wage workers. These results are consistent with data of contribu-tion densities to individual retirement accounts, which in the same period averaged about 45 percent, and which were lower for low wage workers.
We model an economy with special tax regimes, imperfect enforcement
and a dual system of SI. Here we only describe the features need-
ed to interpret our empirical results; Appendix 1 gives further details
and derivations. The economy produces two intermediate and two final goods.
Intermediate goods I1 and I
2 are produced with capital and labor by firms and
workers in salaried contractual relations. Workers receive CSI benefits when firms
comply with the law; they receive NCSI benefits if firms do not. I1 and I
2 are ag-
gregated into a final consumption good A, which for simplicity is produced only
with intermediate inputs. The second consumption good, B, is produced without
intermediate inputs by self-employed workers, or by workers in family firms with
nonsalaried contractual relations, receiving NCSI. Value added from A, B and in-
termediate goods I1 and I
2 makes up total GDP. We focus attention on the labor
market and assume the economy is small and open to world markets, so produc-
er prices p1, p
2 and p
B are given by the world market.1
Firms producing I1, I
2 and A are legally required to pay income and value
added taxes under the regular regime, though they may partly evade these obli-
gations.2 VAT rates for I1 and I
2 differ. I
1 is assumed to be exempt (as is currently
The Model
CHAPTER 4
1 Prices are normalized such that p1 + p
2 + p
B = 1, and the model satisfies the usual condition
of homogeneity of degree zero (one) of all real (nominal) variables. The price of A follows from p
1 and p
2; see equation (20). One could also treat good B as nontraded. This considerably com-
plicates the model without much additional insight. As discussed in Appendix 1, a negatively-sloped demand curve for B would partly offset the labor re-allocations produced by changes in taxes and subsidies as p
B responds to changes in employment in this sector.
2 Income taxes are included here to capture the fact that as the tax base changes revenues from corporate income taxes change as well. But the corporate income tax does not affect be-havior, and we ignore personal income taxes.
20
The end of informaliTy in mexico?
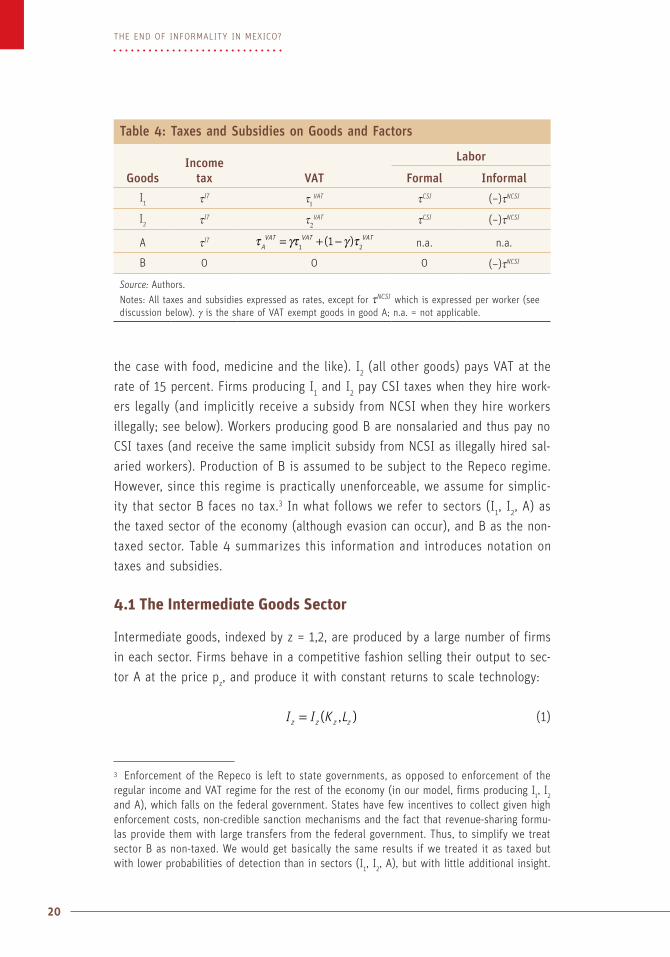
the case with food, medicine and the like). I2 (all other goods) pays VAT at the
rate of 15 percent. Firms producing I1 and I
2 pay CSI taxes when they hire work-
ers legally (and implicitly receive a subsidy from NCSI when they hire workers
illegally; see below). Workers producing good B are nonsalaried and thus pay no
CSI taxes (and receive the same implicit subsidy from NCSI as illegally hired sal-
aried workers). Production of B is assumed to be subject to the Repeco regime.
However, since this regime is practically unenforceable, we assume for simplic-
ity that sector B faces no tax.3 In what follows we refer to sectors (I1, I
2, A) as
the taxed sector of the economy (although evasion can occur), and B as the non-
taxed sector. Table 4 summarizes this information and introduces notation on
taxes and subsidies.
4.1 The Intermediate Goods Sector
Intermediate goods, indexed by z = 1,2, are produced by a large number of firms
in each sector. Firms behave in a competitive fashion selling their output to sec-
tor A at the price pz, and produce it with constant returns to scale technology:
=I I K L( , )z z z z (1)
Table 4: Taxes and Subsidies on Goods and Factors
GoodsIncome
tax VAT
Labor
Formal Informal
I1 τIT τ1
VAT τCSI (–)τNCSI
I2 τIT τ2
VAT τCSI (–)τNCSI
A τIT τ γτ γ τA
VAT VAT VAT= + −1 2
1( ) n.a. n.a.
B 0 0 0 (–)τNCSI
Source: Authors.
Notes: All taxes and subsidies expressed as rates, except for τNCSI which is expressed per worker (see discussion below). γ is the share of VAT exempt goods in good A; n.a. = not applicable.
3 Enforcement of the Repeco is left to state governments, as opposed to enforcement of the regular income and VAT regime for the rest of the economy (in our model, firms producing I
1, I
2
and A), which falls on the federal government. States have few incentives to collect given high enforcement costs, non-credible sanction mechanisms and the fact that revenue-sharing formu-las provide them with large transfers from the federal government. Thus, to simplify we treat sector B as non-taxed. We would get basically the same results if we treated it as taxed but with lower probabilities of detection than in sectors (I
1, I
2, A), but with little additional insight.

21
THE MODEL
Capital per firm Kz is given, so the representative firm makes positive prof-
its in equilibrium.4 Kz is continuous and distributed among firms according to a
distribution function F(Kz), with support k K K[ , ]z z z= . The corresponding densi-
ty is denoted by ƒ (Kz). Capital endowment in the economy is given by K . Since
good B is only produced with labor, the economy’s capital resource constraint is:
∫∫ + =K f K dK K f K dK K( ) ( )K
K
K
K
1 1 1 2 2 2
2
2
1
1
(2)
Firms make two critical decisions: how many salaried workers to hire, and
the optimal combination of legal and illegal workers. The firm’s total labor in-
put, Lz, is:
= +L L Lz fz iz (3)
where Lfz and Liz refer to legally and illegally hired workers, respectively. In this
case this corresponds to formal and informal workers. If firms hire workers for-
mally, they pay the formal wage, wf, and CSI taxes (expressed as a proportion of
the wage). Note, however, that in Mexico a share of CSI taxes is paid by the gov-
ernment, denoted [0,1]θ ∈ .5 Thus:
Unit cost of legally hired salaried workers = θ τ+ −w [1 (1 ) ].fCSI
(4)
On the other hand, informal labor occurs precisely because CSI taxes are
evaded, so labor costs are simply given by the informal wage rate wi. However, if
a firm evades CSI taxes, there is an endogenous probability λz
CSIiz z
L K( , ) that it
will be discovered by the authority (Levy, 2008). This probability is proportion-
al to firm’s size as measured by both the amount of informal labor employed and
the firm’s capital. For example, if relatively little labor is required to conduct busi-
ness, the probability that such firm is discovered evading CSI taxes is near zero,
and the firm will hire mostly informal workers. In contrast, if conducting busi-
ness requires hiring many workers, the firm will have an incentive to hire mostly
formal workers as the probability of being discovered evading by the authority
4 Alternatively, Kz may be interpreted as entrepreneurial ability as in Lucas (1978).5 This reflects the “tripartite” nature of CSI (with contributions from firms, workers and the government). In particular, the government subsidizes the health, life and disability insurance and retirement pension components of CSI. All in all, 16 percent of CSI taxes are paid by the government; see Appendix 2.
22
The end of informaliTy in mexico?
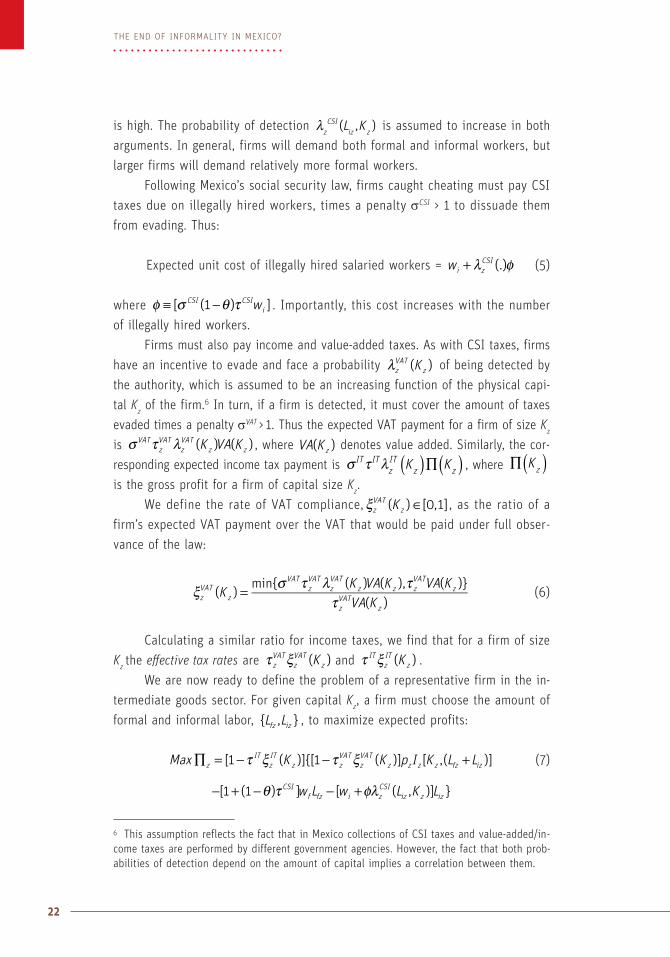
is high. The probability of detection λz
CSIiz z
L K( , ) is assumed to increase in both
arguments. In general, firms will demand both formal and informal workers, but
larger firms will demand relatively more formal workers.
Following Mexico’s social security law, firms caught cheating must pay CSI
taxes due on illegally hired workers, times a penalty σCSI > 1 to dissuade them
from evading. Thus:
Expected unit cost of illegally hired salaried workers = λ φ+w (.)i zCSI (5)
where φ σ θ τ≡ − w[ (1 ) ]CSI CSIi . Importantly, this cost increases with the number
of illegally hired workers.
Firms must also pay income and value-added taxes. As with CSI taxes, firms
have an incentive to evade and face a probability λ K( )zVAT
z of being detected by
the authority, which is assumed to be an increasing function of the physical capi-
tal Kz of the firm.6 In turn, if a firm is detected, it must cover the amount of taxes
evaded times a penalty σVAT > 1. Thus the expected VAT payment for a firm of size Kz
is σ τ λ K VA K( ) ( )VATzVAT
zVAT
z z , where VA K( )z denotes value added. Similarly, the cor-
responding expected income tax payment is σ τ λIT ITzIT
z zK K( )∏( )ˆ, where
ˆ∏( )Kz
is the gross profit for a firm of capital size Kz.
We define the rate of VAT compliance, K( ) [0,1]zVAT
zξ ∈ , as the ratio of a
firm’s expected VAT payment over the VAT that would be paid under full obser-
vance of the law:
ξ σ τ λ ττ
=KK VA K VA KVA K
( )min{ ( ) ( ), ( )}
( )zVAT
z
VATzVAT
zVAT
z z zVAT
z
zVAT
z
(6)
Calculating a similar ratio for income taxes, we find that for a firm of size
Kz the effective tax rates are K( )zVAT
zVAT
zτ ξ and K( )ITzIT
zτ ξ .
We are now ready to define the problem of a representative firm in the in-
termediate goods sector. For given capital Kz, a firm must choose the amount of
formal and informal labor, L L{ , }fz iz , to maximize expected profits:
τ ξ τ ξ∏ = − − +Max K K p I K L L[1 ( )]{[1 ( )] [ ,( )]zIT
zIT
z zVAT
zVAT
z z z z fz iz (7)
θ τ φλ− + − − +w L w L K L[1 (1 ) ] [ ( , )] }CSIf fz i z
CSIiz z iz
6 This assumption reflects the fact that in Mexico collections of CSI taxes and value-added/in-come taxes are performed by different government agencies. However, the fact that both prob-abilities of detection depend on the amount of capital implies a correlation between them.
23
THE MODEL
The solution is a pair of demand functions for formal and informal labor of
the form:
τ τ θ τ τ τ τ=L L K p w w[ , ; , , ; ( , ), ( , )]fz fz z z zVAT CSI
fCSI NCSI
iCSI NCSI (8)
τ τ θ τ τ τ τ=L L K p w w[ , ; , , ; ( , ), ( , )]iz iz z z zVAT CSI
fCSI NCSI
iCSI NCSI (9)
Equations (8) and (9) are very important. They capture how firms combine
formal and informal (illegal) salaried labor in a context of evasion. As expect-
ed, demand for both types of labor increases with output price and decreases
with the VAT rate, as the net price received by firms falls (for a given level of
evasion). However, given output price and VAT rates and the government’s en-
forcement efforts, the composition of the firm’s labor demand depends on CSI
and NCSI taxes and subsidies, as firms optimally mix formal and informal work-
ers. Higher CSI taxes increase the price of formal vs. informal labor and induce
firms to hire more informal workers. Conversely, higher subsidies for CSI, θ, low-
er the relative price of formal vs. informal labor and induce more formal hiring.
On the other hand, individual firms take wage rates for formal and informal la-
bor as given. However, as elaborated below, these wage rates depend on the
level of CSI and NCSI benefits, and on how workers value those benefits. Thus,
even though NCSI benefits do not appear directly in the firm’s labor demand
functions (8) and (9), they do so indirectly through their effect on wages. As a
result, the level and composition of firms’ labor demands depends on the dual
structure of SI.
We next define the aggregate rate of tax compliance in the intermediate
goods sector, ξ ∈� [0,1]z
VAT, as total revenue collected over potential revenue (if
all firms fully complied with their tax obligations):
∫
∫ξ
τ ξ
τ=�
K VA K f K dK
VA K f K dK
( ) ( ) ( )
( ) ( )z
VATzVAT
zVAT
z z z zK
K
zVAT
z z zK
Kz
z
z
z
(10)
A similar expression applies to income taxes.
The aggregate compliance rate determines the extent to which the VAT im-
pacts intermediate goods prices. In particular, the “VAT included” prices of I1 and
I2 are:

24
The end of informaliTy in mexico?
τ ξ= +� �p p (1 )z z zVAT
z
VAT (11)
reflecting the fact that under imperfect compliance the VAT is not fully transmit-
ted to prices.
4.2 The Final Good A Sector
This sector is composed of a large number of representative firms that behave
in a competitive fashion. Firms use intermediate goods I1 and I
2 to produce A,
and must pay income and value-added taxes. Firms can also evade and, as be-
fore, ξAVAT
and ξAIT
are the rates of compliance with each tax, which are assumed
to be a weighted average of the corresponding aggregate rates of compliance in
the intermediate goods sector. Thus, the tax rates effectively paid by firms in the
final sector are τ ξAVAT
AVAT and τ ξIT
AIT .
VAT in Mexico is collected by the credit method: the tax applies to each
sale, and firms in the final good sector receive a credit for the VAT paid in the
previous stage of production. Hence if the cost of the intermediate good (before
taxes) is p Iz z , the firm in the final good sector receives a tax credit of τ ξ� p IzVAT
z
VAT
z z
. As a result, tax evasion by firms in the intermediate sector implies a trade-off
for firms in the final sector. On one hand, a lower rate of compliance (that is,
higher evasion) in the intermediate sector implies that taxes effectively paid by
firms in the final sector are lower. On the other, lower compliance rates in the in-
termediate sector translate into lower tax credit claims by final sector firms. In
the extreme case where tax evasion in the intermediate sector is zero, the rate
of compliance in the final sector is one and, in principle, these firms have the
right to a full tax claim (unless final firms understate sales to reduce VAT pay-
ments in the last phase of the value added chain). Thus, the intermediate-final
good structure of our model gives place to a transmission mechanism of tax eva-
sion between sectors, as in de Paula and Scheinkman (2010). Since tax credits
cannot be generated from informal suppliers and tax payments from formal sup-
pliers cannot be used by informal buyers, there is an incentive for informal firms
to conduct business with other informal firms. This scheme thus predicts that tax
evasion of a firm in the final good sector is correlated to the tax evasion of firms
from which it buys intermediate goods.7
7 De Paula and Sheinkman (2010) present empirical evidence for Brazil supporting this idea, labeled by them as “chain effects”. In Table 13 we illustrate that these effects are quantitative-ly relevant for Mexico.
25
THE MODEL
In such context, the problem of a representative firm in the final good sec-
tor is to choose intermediate goods I I{ , }1 2 to maximize expected profits:
∑τ ξ τ ξ τ ξ∏ = − − − −=
�Max p A I I p I(1 ){(1 ) ( , ) (1 ) }AIT
AIT
AVAT
AVAT
A zVAT
z
VAT
z zz
1 21
2
(12)
taking prices p p{ , }1 2 , tax rates τ τ τ{ , , }IT VAT VAT1 2 , and rates of compliance by firms
in the intermediate sector ξ ξ =� �{ , }z
VAT
z
IT
z 1,2as given.8 The solution is a pair of de-
mand functions for I1 and I
2, whose proportions will depend on relative prices and
the substitution possibilities allowed by the technology. Appendix 1 shows that
when this function takes the standard CES form, these proportions are:
γγ
τ ξ
τ ξ=
−−
−µ−
�
�II
pp
[(1
)(1
1)( )]
VAT VAT
VAT VAT1
2
1 1
2 2
1
2
1/(1 ) (13)
where γ and µ are parameters of the production function.
This expression indicates that the relative sizes of the two intermediate
good sectors are affected by the degree of compliance with the VAT in each sec-
tor, as well as by the existence of differentiated VAT rates. In particular, since
0VAT1τ = as a result of the exemption given to food, medicine and related ne-
cessities, there is an underlying distortion that negatively affects the size of the
non-exempt sector. This is an important observation, as the fiscal reform contem-
plated in Section 7 consists precisely in eliminating this exemption.
4.3 The Final Good B Sector
This sector captures economic activity by self-employed workers and workers in
family firms. The key aspect, of course, is that these workers are not obligated to
enroll in CSI. The cost of labor is simply the informal wage wi:
Unit cost of nonsalaried labor = wi (14)
Sector B faces the special Repeco tax regime. However, as noted, high en-
forcement costs and non-credible sanction mechanisms imply that in practice such
8 When evasion rates are zero (� � 1z
VAT
z
ITξ ξ= = for all z) and VAT rates are identical, the prof-
it function is
Max p A I I p I(1 ){(1 ) ( , ) }AIT VAT
A z zz
1 21
2
∑τ τ∏ = − − −=
,
as expected in an economy with no evasion.
26
The end of informaliTy in mexico?
economic activity is not taxed. As a result, the relationship between establishment
size and evasion is not central here, and little is lost by treating this sector as
consisting of many identical establishments where output is produced only with
labor, LB, which is sold only to final consumers at the exogenous price p
B.9 The
production function, B B L( )B= , is assumed to have decreasing returns to scale.
Thus, the profit function is simply Max p B L w L( )B B B i B∏ = − . This leads to a de-
mand for nonsalaried labor of the form:
τ τ=L L p w[ ; ( , )]B B B iCSI NCSI (15)
Equation (15) is very important. Notice that, as with the demands for legal
and illegal salaried labor in equations (8) and (9), LB depends on CSI and NCSI
taxes and subsidies. Of course, self-employed workers and family firms do not
directly pay for either τCSI or τNCSI; but this fact does not invalidate the more im-
portant fact that, as discussed immediately below, wage rates are determined in
the labor market, where these taxes and subsidies play a prominent role.
4.4 Social Insurance, Wage Rates and the Labor Market
Equations (8), (9) and (15) determine the demand side of the market for labor.
Assuming an inelastic labor supply L, equilibrium in the labor market is given by:
∫∫∫∫ + + + + =L f K dK L f K dK L f K dK L f K dK L L( ) ( ) ( ) ( )f f i i BK
K
K
K
K
K
K
K
1 1 1 2 2 2 1 1 1 2 2 2
2
2
1
1
2
2
1
1
(16)
The first two terms are firms’ demand for legal salaried labor given by (8);
the next two terms are firms’ demand for illegal salaried labor given by (9); the
9 This is true only as long as sales by self-employed workers or family firms do not exceed the threshold established to qualify for Repeco (or else taxation would occur under the normal VAT/income tax regime). Our model fails to capture this discontinuity; see Valero and Sánchez (2010) for a proper treatment. The assumption that good B requires no intermediate inputs is not innocuous. If good B required I
1 and I
2 as intermediates, a VAT reform like the one we con-
sider below would also serve to indirectly tax sector B, as input prices would increase without firms having the possibility of crediting the higher VAT on inputs since they are in the Repeco regime (or, more likely, are not registered and pay no taxes at all). Thus, the combination of ei-ther high evasion and/or the Repeco regime implies that the VAT is not fully a tax on final con-sumption, and a higher VAT through this channel would serve to tax the informal sector. This important point is emphasized by Keen (2008).
27
THE MODEL
fifth term, lastly, is the demand for nonsalaried labor given by (15). In turn, for-
mal employment (henceforth denoted as Lf) is given by the first two terms, while
informal employment (henceforth Li) is given by the next three, comprised of ille-
gal salaried employment and legal nonsalaried employment.
When salaried workers are formally employed they are paid the formal
wage and receive the benefits of CSI; when they are informally employed (either
as illegally hired salaried workers or as nonsalaried workers), they are paid the
informal wage and receive the benefits of NCSI. As opposed to CSI, the benefits
of NCSI are expressed as a monetary value which is simply the amount that the
government spends in SI benefits per informal worker. Thus the utility of formal
and informal employment are:10
β τ= +U w (1 )f fCSI CSI (17)
β τ= +U wi iNCSI NCSI (18)
Parameters β β ∈, [0,1]CSI NCSI capture the value that workers give to SI
benefits. They represent the benefit side of SI taxes and subsidies, in the under-
standing that from the point of view of workers’ behavior what matters is how
they perceive these benefits. Thus, the fact that CSI benefits are bundled while
NCSI benefits are unbundled is important. In the first case workers are forced
to consume a basket of goods and services of fixed composition. In the second
workers are given the option to consume any combination of benefits. Further,
matters of quality and access to service are key (particularly for health care), as
are workers perceptions of the value of contingent benefits (like death or disabili-
ty insurance) or benefits that accrue in the long run (like savings for retirement).11
Table 5 pulls together the information of firms and workers, and contrasts
the unit cost of labor on the basis of the labor contracts as given by (4), (5) and
(14), on one hand, with the value of those contracts to workers as given by (17)
and (18), on the other.
10 We could separate the utility of informal employment between that of salaried and nonsal-aried employment, and assume nonsalaried workers also derive utility from not having a boss, having flexible working hours, and so on; see Maloney (1999, 2004). As long as these factors are invariant to wage rates and the benefits of SI, they do not matter for our analysis, and to avoid cluttering the notation we ignore them here.11 See Levy (2008) for further discussion.

28
The end of informaliTy in mexico?
The last column of Table 5 highlights the structure of taxes and subsi-
dies to different labor contracts implicit in the CSI+NCSI configuration. Whenβ θ+ <( ) 1CSI , formal labor is subject to a “pure” tax, which arises because work-
ers do not fully value the benefits of CSI on a peso-by-peso basis. As a result,
firms pay more for labor than what workers receive (despite the fact that CSI is
partly subsidized by the government). On the other hand, in a context in which
enforcement of CSI taxes is imperfect, illegal salaried labor is implicitly subsi-
dized by NCSI. Moreover, this subsidy is inversely proportional to firm size, as
smaller firms face lower probabilities of detection than larger ones. Finally, non-
salaried labor is unambiguously subsidized by NCSI. Note that the implicit subsidy
to informal employment is larger for nonsalaried vs. salaried labor given that self-
employed workers and family firms are not obligated to pay CSI taxes at all, with
the difference between the two narrowing as firm size falls (given falling detection
costs).12 It is natural to expect that a tax-cum-subsidy structure that depends on
the size of the firms and the type of labor contract will bias the size distribution
of firms towards smaller firms, and the distribution of workers towards nonsalaried
and illegal salaried contracts. These biases are consistent with the size distribu-
tion of firms and the composition of employment presented in Tables 1 and 2.
A critical question is how CSI+NCSI tax-cum-subsidies impact the labor mar-
ket. If this market was fully segmented, with no possibility for formal workers to
obtain informal jobs, and no possibility for informal workers to obtain formal jobs,
these taxes and subsidies would separately impact the formal and the informal
wage. For instance, a decrease in CSI taxes would increase firms’ demand for for-
mal workers. Under complete segmentation, informal workers could not become
12 Figure 2 in Section 7 maps the precise shape of these taxes and subsidies.
Table 5: Costs and Benefits of Labor Contracts
Labor contract Firms pay Workers receiveImplicit
tax/subsidy
Legal salaried(formal)
wf
CSI[ ( ) ]1 1+ −θ τ wf
CSI CSI( )1 + β τ 1 − +( )β θCSI
Illegal salaried(informal)
wi z
CSI+ φλ (.) wi
NCSI NCSI+ β τ φλ β τz
CSI NCSI NCSI(.) −
Nonsalaried(informal) wi
wi
NCSI NCSI+ β τ −β τNCSI NCSI
Source: Authors.
29
THE MODEL
formal because there are barriers to entry into formality; as a result, the for-
mal wage would increase, but the informal wage would not change. Similarly, an
increase in NCSI benefits would increase the utility of workers who are self-em-
ployed, work in a family firm or are illegally hired, but firms would not be able to
change the composition of their work force in favor of more illegal workers, nor
would it induce any salaried workers to enter self-employment or start a family
firm, because there are barriers to entry into informal employment. As a result,
the formal wage would remain invariant.
The empirical evidence for Mexico does not support the hypothesis of a
completely segmented labor market, with no transits of individual workers be-
tween formal and informal status. On the contrary, large formal-informal mobility
has been extensively documented.13 A key implication is that formal and infor-
mal wage rates cannot be determined by two independent mechanisms. On the
contrary, one expects that as τCSI increases the demand for formal labor will
fall, increasing the supply of labor to the informal sector and putting downward
pressure on the informal wage. Conversely, one expects that a higher τNCSI will
stimulate the supply of labor to the informal sector, putting upward pressure on
the formal wage.
In fact, as shown in Section 6, and in accordance with the available empiri-
cal evidence for Mexico, CSI taxes are not fully shifted to formal workers, implying
in turn that firms adjust employment as a response to higher labor costs, or that
τ∂ ∂ <L / 0fCSI .14 On the other hand, more recent evidence shows that for individ-
ual programs that comprise τNCSI it is the case that τ∂ ∂ >L / 0iNCSI .15 Here we take
advantage of these results, and of the observed large mobility of workers between
13 See Maloney (1999, 2004), Gong, Soest and Villagomez (2004), Navarro and Schrimpf (2004) and Calderon-Madrid (2000, 2006). These studies exploit the panel structure of Mexico’s employment survey, allowing them to follow individual worker transitions between formal and informal status, finding that in any given year between 10 to 15 percent of workers change labor status; see also Table 3. Levy (2008) uses the social security registries to follow individual workers over a ten year period and finds high mobility between the formal and the informal sector. Duval and Smith (2010) test the hypothesis of segmentation in Mexico’s labor market and find that when public sector employment is excluded and segmentation is measured as the share of informal salaried workers unable to find a formal salaried job at any wage, less than 27 percent of informal workers are rationed from formal jobs. Bell (1997) and Maloney and Nunez-Mendez (2004), on the other hand, provide evidence that the minimum wage is not binding; Duval and Smith (2010) find that 99 percent of informal workers have a reservation wage higher than the minimum wage. 14 See Marrufo (2010), Heckman and Pages (2004) and Kugler (2011).15 The available evidence refers to individual NCSI programs, as opposed to CSI programs which almost always are legislated and their effects captured under a single statutory rate τCSI.

30
The end of informaliTy in mexico?
formal and informal status, to assume that worker’s utilities are equalized across
forms of employment. Given (17) and (18), this implies a relationship between wf
and wi of the form:16
β τ β τ= + −w w (1 )i fCSI CSI NCSI NCSI (19)
Given this relationship, one can use condition (16) in the labor market to
find the equilibrium formal and informal wage rates that are consistent with firm’s
and worker’s decisions, given value added, income and CSI and NCSI taxes and
subsidies, and the government’s enforcement efforts.
It is useful, finally, to introduce an index of the real wage. In Appendix 1
we show that the “VAT included” price of good A is:
γ γ
=
+
−
µ µ µ µ
µµ
− −
−
�� �
pp p
1A1
11
2
11
1
(20)
Juárez (2009) finds that a health program for female workers in Mexico City increases the prob-ability of informal employment for those with low education and decreases informal wages. Galiani and Gertler (2009) find that a pension program for adults over 70 years of age lowers participation in salaried employment for workers close to retirement age. For a health program for informal workers introduced in 2002 known as Seguro Popular, studies by Barros (2009), Gallardo-García (2006) and Campos-Vázquez and Knox (2010) find no impact on informal em-ployment. However, recent evidence points to positive effects on informal employment or a de-crease in the share of formal employment, although the magnitude varies depending on the data used; see Azuara and Marinescu (2011), Duval and Smith (2011) and Aterido, Hallward-Driemer and Pages (2011). Bosch and Campos (2010) find decreases in formal employment and in the share of formal employment, and Bosch and Cobacho (2011) find decreases in for-mal employment for young workers in small firms. Pérez-Estrada (2011) finds decreases in for-mal employment and a decrease in informal wages. See Bosch, Cobacho and Pages (2012) for a survey. To the best of our knowledge, however, there are no studies of the joint effects of all NCSI programs on L
i (which conceptually is what one should measure, and for which we pres-
ent some estimates in Section 6). 16 The assumption of utility equalization simplifies the math, but is not essential. One can pos-it as well that for some unspecified reason there is a utility differential across sectors such thatU U 0f i κ− = > . Then a variant of (19) is
LU UU U
[/
/]fi f i
fo
ioκ κ∆ = −η ,
where the superscript o refers to an initial equilibrium, Lfi∆ to the flows of workers between the formal and informal sector after any exogenous change, and 0η ≥ the elasticity of labor flows to utility differentials. The key point is not whether utilities are fully equalized or not, but whether, given any differential (including no differential), at the margin there is any change in labor flows as utilities change.
31
THE MODEL
Since there is no VAT in good B, = �p pB B . Thus, the consumer price index,
CPI, is:
δ δ= + −� �CPI p p(1 )A B (21)
where δ is the share of final good A in total consumer expenditures. We next de-
fine indices of the real formal and informal wage rates, respectively, as w CPI/f ,
and w CPI/i . The important point, of course, is that real wages depend on out-
comes in the labor market as determined by the incentives faced by firms and
workers coming from the VAT and SI taxes and subsidies, but also directly on the
VAT regime as it affects consumer prices.
4.5 The Government’s Budget Constraint under the CSI+NCSI Configuration
Given our focus on the fiscal implications of the CSI+NCSI duality, we turn to the
government’s budget constraint. Revenues consist of endogenously determined val-
ue added, income and CSI taxes, plus other exogenous revenues denoted by R(including oil rents). The corresponding expressions for value added and income
tax revenues are in Appendix 1. They are derived aggregating over all firms pro-
ducing intermediates given the compliance rate of each firm, and also calculating
value added and income taxes on final good A (netting out VAT paid on interme-
diates). In turn, expenditures consist of endogenously determined subsidies to CSI
and NCSI programs, and all other expenditures, which we take as exogenous and
denote by G . Importantly, spending in Progresa-Oportunidades and other target-
ed programs that transfer income to the poor, as well as all non-insurance related
social spending is included in G .17 The government’s fiscal balance, FB, is:
θ τ= + + + −FB R R R w L[ (..) (..) (1 ) (..) (..)]VAT IT CSIf f (22)
θ τ θτ τ− + − + +G w L w L L[ (1 ) (..) (..) (..) (..) (..)]CSIf f
CSIf f
NCSIi
where (..) highlights the variables that are endogenously determined in our mod-
el. Note that the revenue side includes only CSI taxes paid by firms and workers,
17 In 1997 Mexico transited from a pay-as-you-go to a defined contribution system of retirement pensions. As a result, the pensions of the transition generation are paid directly from govern-ment revenues. This is included in G as this spending has no bearing on firms’ labor costs or workers’ utility. Spending in CSI includes only subsidies for currently active workers, which af-fect firms’ labor costs and workers’ utility.
32
The end of informaliTy in mexico?
θ τ− w L(1 ) (..) (..)CSIf f , while the expenditure side includes all CSI spending (which
for clarity we separate into two parts). As a result, CSI exerts a net pressure on
the fiscal balance only to the extent that it is subsidized.
We now discuss the channels through which the VAT and CSI+NCSI taxes
and subsidies impact the fiscal balance in a context of informality and evasion.
Consider expenditures first. Regardless of the formal-informal division of employ-
ment, the SI of all workers is subsidized by the government. From the spending
point of view the question is whether the per worker CSI subsidy, θτ w (..)CSIf , is
higher or lower than the per worker NCSI subsidy, τNCSI. As shown in Appendix 2,
for Mexico in 2008 we find that:18
τ θτ> w (..)NCSI CSIf (23)
Inequality (23) indicates that from the point of view of spending, the formal-
informal composition of the labor force is not irrelevant: ceteris paribus, higher
informal employment reduces the fiscal balance.
Consider now the revenue side. Note first that higher VAT rates have a con-
tradictory impact on the fiscal balance. On the one hand, they increase revenues;
on the other, they induce more evasion and informality. Firms in the intermedi-
ate goods sector will decrease their demand for salaried labor, with the effect
stronger for larger firms (as they can evade less); in parallel, the non-taxed sec-
tor B will expand. These two effects erode the tax base and lower value added
and income tax revenues. In addition, because higher VAT rates increase informal
employment, there is also a positive impact on expenditures, given (23). Thus, al-
though the expectation is that the net effect of higher VAT rates is to increase
the fiscal balance, this impact is partly offset by higher evasion and higher infor-
mal employment.
What about CSI taxes? Given βCSIand θ, an increase in τCSI lowers firms’ de-
mand for salaried labor and tilts its composition in the direction of more informal
workers as the relative price of legal to illegal salaried workers increases. Larger
firms—which comply more with VA and income taxes—will reduce employment rel-
atively more than smaller ones. As the taxable sector of the economy contracts
the same will happen to the tax base. Expenditures are also affected as informal
18 Inequality (23) follows from the observed growth in spending for NCSI programs since the mid-1990s. One would expect the difference to widen as these programs continue to expand. See Levy (2008).
33
THE MODEL
employment expands. On the other hand, an increase in the share of CSI taxes
that is subsidized by the government, θ, operates in the opposite direction: from
the point of view of firms, legal salaried workers are less costly and thus firms ex-
pand their demand for labor and tilt its composition in the direction of formality.
As the taxable sector expands, value added and income taxes increase. In parallel,
expenditures in CSI increase, of course, although this effect is partly compensat-
ed by smaller subsidies to NCSI.
Finally, the effects of augmenting τNCSI are as follows. First, informal em-
ployment expands both because sector B is more subsidized, and because firms
tilt the composition of their labor force towards more illegal employment (with
smaller firms benefiting from the higher subsidy proportionately more than larg-
er firms). Revenues fall as sector B expands and evasion increases in sectors I1
and I2. In addition, expenditures increase as informal employment expands (giv-
en (23)), so the net effect is a deterioration of the fiscal balance.
The next sections quantify these effects. We close here with three ob-
servations. First, the discussion highlights the importance of considering the
spillover effects of value added taxes on informality and, in turn, the spillover
effects of CSI and NCSI taxes and subsidies on value added and income tax rev-
enues. Second, it clarifies that the composition of spending in SI between CSI
and NCSI matters not only from the social point of view (as it determines which
workers are covered against what risks), but also from a fiscal point of view,
as it affects tax revenues and total spending in SI. It also indicates that, while
the root cause of informality is found in the CSI+NCSI configuration, in a con-
text of evasion and special tax regimes (and a sector of the economy, B, which
is basically out of the reach of the tax authorities), value added taxes can also
strengthen informality.
Third, the discussion illustrates the dilemmas faced by SI policy in the con-
text of the CSI+NCSI configuration. From the social point of view, setting τNCSI = 0
is clearly unacceptable, as it leaves nonsalaried workers and illegally hired sala-
ried workers without any protection against risks; on the contrary, from a social
point of view one would in principle like to set NCSI benefits close to the levels
of CSI benefits, as workers face similar risks regardless of their salaried or non-
salaried status. At the same time, however, expanding NCSI programs contracts
the tax base and increases the level of informality and illegality in the economy
(and lowers productivity).

e fit our model to Mexico for 2008. Appendix 2 gives details of data
sources and calibration; here we only provide a general overview.
5.1 Data
All tax and subsidy rates and penalty parameters are set at their legislated values,
except for the income tax rate.1 Per worker NCSI subsidy is calculated dividing ob-
served spending in NCSI programs by observed informal employment. Data from
the 2008 Economic Census is matched with IMSS registries to calculate the distri-
bution of salaried employment by firm size, sector (I1 and I
2) and formal-informal
composition. The same Census is used to obtain the distribution of the capital
stock in each sector and calculate ƒ(K1) and ƒ(K2); see the discussion in Appendix
2 and equation A2.1. Numbers on formal employment from IMSS registries are
complemented with the Employment Survey to calculate LB and L (excluding pub-
lic sector workers). We use official fiscal accounts for total revenues from value
added, income and CSI taxes. Workers’ valuations of CSI and NCSI, βCSI and βNCSI,
are taken from the estimates of Levy (2008). Evasion rates are set parametrically
to reproduce the same level of revenues given the tax base and statutory rates.
Other parameters are chosen from the national accounts or, when this is not pos-
sible, set to replicate the data. Finally, consistency is checked by calculating GDP
on the income and value added side, as well as testing for homogeneity of degree
one (zero) for nominal (real) variables with respect to p1, p
2 and p
B.
Data and Model Calibration
CHAPTER 5
1 The statutory rate for 2008 is 28 percent, but the income tax law has many deductions and deferrals associated with capital investments that are not captured in our model. In this case we simply fix the rate to reproduce the same level of revenues observed in 2008 (=10.5 percent).
W

36
The end of informaliTy in mexico?
5.2 Model Fitness
We evaluate the fitness of our model in four dimensions: macroeconomic and
fiscal accounts; social insurance accounts; distribution of employment; and VAT
evasion rates. Table 6 compares the macroeconomic and fiscal accounts gener-
ated by the model with those observed in 2008. The exogenous components of
expenditures and revenues, G and R are by construction set equal to those in
the data; the remaining entries are endogenously obtained in the model. For clari-
ty, we net out CSI taxes paid by firms and workers from both the revenue and the
expenditure side; see equation (22). As may be seen, these accounts are replicated
remarkably well. Note that in 2008 subsidies to NCSI were almost two and half
times subsidies to CSI (1.25 percent versus 0.52 percent of GDP).2
Social insurance accounts are presented in Table 7, where we have broken
down τCSI and τNCSI into their various components. For the case of CSI, this consists
2 Our data captures only spending in NCSI programs by the federal government, except for health, where we also include sub-national spending. However, some state governments also subsidize noncontributory pensions, day care and housing programs; we do not measure here as data are fairly incomplete. Total public spending in NCSI programs is in all likelihood high-er than 1.25 percent of GDP.
Table 6: Macroeconomic and Fiscal Accounts
Observed Calibrated
Pesos* % GDP Pesos* % GDP
GDP 12,110.5 12,146.0
Public expenditures
Subsidies to NCSI 151.5 1.25 151.0 1.24
Subsidies to CSI 63.7 0.52 62.2 0.51
Other exogenous 2,679.5 22.1 2,679.5 22.0
Public revenues
Value-added tax 457.2 3.77 457.9 3.76
Corporate income tax 393.0 3.24 392.4 3.23
Other exogenous 1,852.0 15.29 1,852.0 15.24
Fiscal balance** –192.5 –1.58 –190.4 –1.56
Source: Authors. *Thousands of million of 2008 pesos. ** The negative sign denotes a deficit.
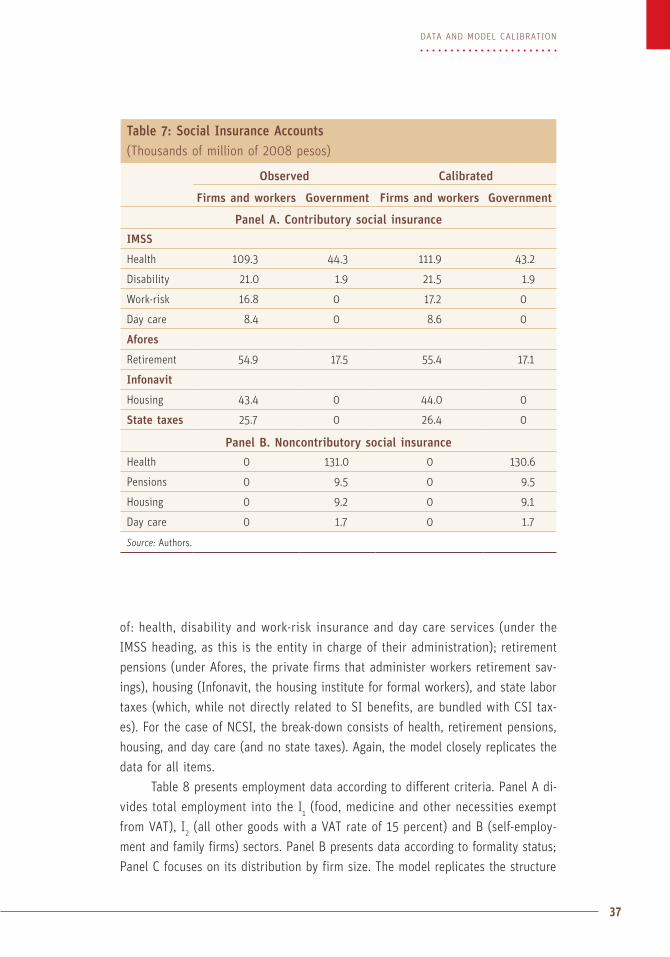
37
DATA AND MODEL CALIBRATION
of: health, disability and work-risk insurance and day care services (under the
IMSS heading, as this is the entity in charge of their administration); retirement
pensions (under Afores, the private firms that administer workers retirement sav-
ings), housing (Infonavit, the housing institute for formal workers), and state labor
taxes (which, while not directly related to SI benefits, are bundled with CSI tax-
es). For the case of NCSI, the break-down consists of health, retirement pensions,
housing, and day care (and no state taxes). Again, the model closely replicates the
data for all items.
Table 8 presents employment data according to different criteria. Panel A di-
vides total employment into the I1 (food, medicine and other necessities exempt
from VAT), I2 (all other goods with a VAT rate of 15 percent) and B (self-employ-
ment and family firms) sectors. Panel B presents data according to formality status;
Panel C focuses on its distribution by firm size. The model replicates the structure
Table 7: Social Insurance Accounts (Thousands of million of 2008 pesos)
Observed Calibrated
Firms and workers Government Firms and workers Government
Panel A. Contributory social insurance
IMSS
Health 109.3 44.3 111.9 43.2
Disability 21.0 1.9 21.5 1.9
Work-risk 16.8 0 17.2 0
Day care 8.4 0 8.6 0
Afores
Retirement 54.9 17.5 55.4 17.1
Infonavit
Housing 43.4 0 44.0 0
State taxes 25.7 0 26.4 0
Panel B. Noncontributory social insurance
Health 0 131.0 0 130.6
Pensions 0 9.5 0 9.5
Housing 0 9.2 0 9.1
Day care 0 1.7 0 1.7
Source: Authors.
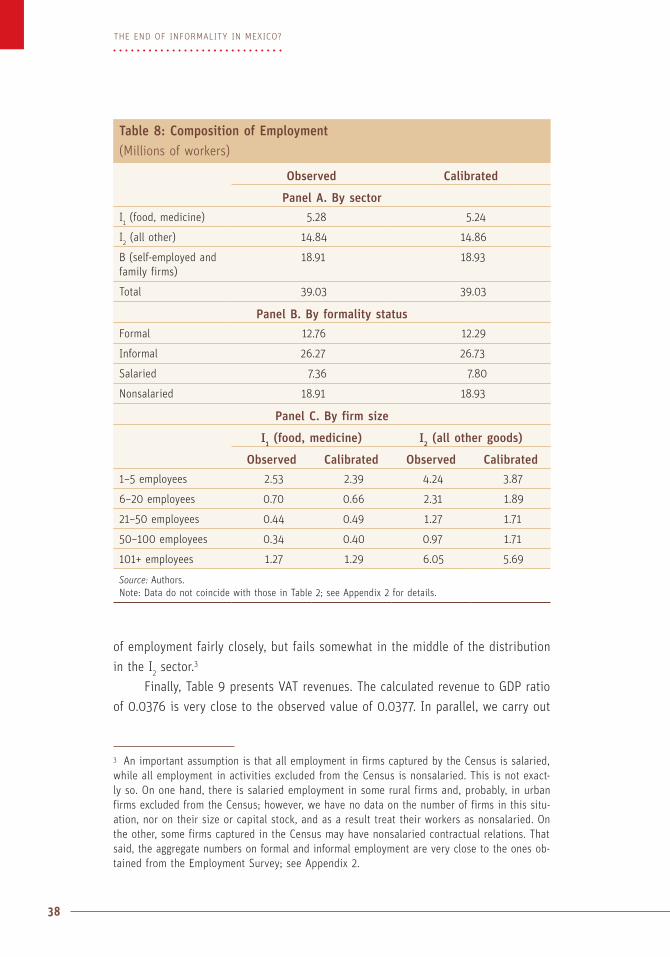
38
The end of informaliTy in mexico?
of employment fairly closely, but fails somewhat in the middle of the distribution
in the I2 sector.3
Finally, Table 9 presents VAT revenues. The calculated revenue to GDP ratio
of 0.0376 is very close to the observed value of 0.0377. In parallel, we carry out
3 An important assumption is that all employment in firms captured by the Census is salaried, while all employment in activities excluded from the Census is nonsalaried. This is not exact-ly so. On one hand, there is salaried employment in some rural firms and, probably, in urban firms excluded from the Census; however, we have no data on the number of firms in this situ-ation, nor on their size or capital stock, and as a result treat their workers as nonsalaried. On the other, some firms captured in the Census may have nonsalaried contractual relations. That said, the aggregate numbers on formal and informal employment are very close to the ones ob-tained from the Employment Survey; see Appendix 2.
Table 8: Composition of Employment (Millions of workers)
Observed Calibrated
Panel A. By sector
I1 (food, medicine) 5.28 5.24
I2 (all other) 14.84 14.86
B (self-employed and family firms)
18.91 18.93
Total 39.03 39.03
Panel B. By formality status
Formal 12.76 12.29
Informal 26.27 26.73
Salaried 7.36 7.80
Nonsalaried 18.91 18.93
Panel C. By firm size
I1 (food, medicine) I2 (all other goods)
Observed Calibrated Observed Calibrated
1–5 employees 2.53 2.39 4.24 3.87
6–20 employees 0.70 0.66 2.31 1.89
21–50 employees 0.44 0.49 1.27 1.71
50–100 employees 0.34 0.40 0.97 1.71
101+ employees 1.27 1.29 6.05 5.69
Source: Authors. Note: Data do not coincide with those in Table 2; see Appendix 2 for details.

39
DATA AND MODEL CALIBRATION
an exercise where we estimate VAT revenues under full compliance, and compare
it with the calculations made from the National Accounts by Antón and Hernández
(2010). Finally, we also carry out an exercise where we eliminate exemptions in
sector I1, so that both VAT rates are equal at 15 percent and assume full compli-
ance, and also compare it with the calculations made by Antón and Hernández
(2010). The levels of revenues are again very close, indicating that the underly-
ing evasion rates are also close to the actual ones.
All in all, the model replicates Mexican data pretty closely along these four
dimensions. In the next two sections we proceed, first, to simulate how the econo-
my responds to various parameter changes under the CSI+NCSI configuration and,
second, to simulate a fiscal reform that funds replacing this configuration with USI.
Table 9: VAT Revenues and Evasion (percent of GDP)
Observed or calculated from national accounts Calibrated
τ τ1 2
0 0 15VAT VAT= =, .
Under current enforcement 3.77* 3.76
Assuming full compliance 6.08** 6.12
τ τ1 2
0 15VAT VAT= = .
Under current enforcement n.o. 6.2
Assuming full compliance 10.7** 10.6
Source: Authors. * Observed. ** Calculated from national accounts by Antón and Hernández (2010). n.o. = not observable.


6.1 Who Pays for Social Insurance?
Table 10 decomposes the effects of CSI and NCSI taxes and subsidies on wage
rates and worker’s utility (Panel A), employment (Panel B) and spending and tax
revenues (Panel C). We take as the benchmark scenario the situation where there
is no SI (column two); next, we assume that CSI is introduced with τCSI at its cur-
rent rate of 0.38, but with no subsidies (column three); further, we introduce
subsidies to CSI at the current rate (θ = 0.16, implying a subsidy per worker of
5,062 pesos), but assume there is no NCSI (column four); finally, we introduce
NCSI at the observed subsidy of 5,650 pesos per worker so this scenario is the
2008 status quo (last column). To interpret this and the following tables, we note
that the estimated “pure” tax on formal labor is in the order of 20 percent of the
formal wage, while the estimated subsidy to informal labor is in the order of 7
percent of the informal wage (see Table 5).1
Start with unsubsidized CSI. First, very importantly, wage rates decline vis-
à-vis the no SI case; the formal wage, in particular, drops by about 21 percent. An
immediate implication is that the incidence of CSI taxes falls mostly on workers:
in fact, in this case they pay 70 per cent of CSI taxes. This indicates that CSI is
basically changing the composition of workers’ consumption (less disposable in-
come and more SI benefits), rather than re-distributing income from firms to them.
Four Preliminary Questions
CHAPTER 6
1 However, a more accurate measurement of these taxes and subsidies is obtained taking as the reference point not the formal and informal wage rates, but the undistorted wage rate that would be observed in the absence of these taxes and subsidies. This wage rate is calculated in the next section and shown in Figure 2. The important point is that the tax on salaried labor is lower and the subsidy to nonsalaried labor higher, because the reference wage rate is higher when the dis-tortions in the labor market produced by SI policy are removed. See the discussion in section 7.
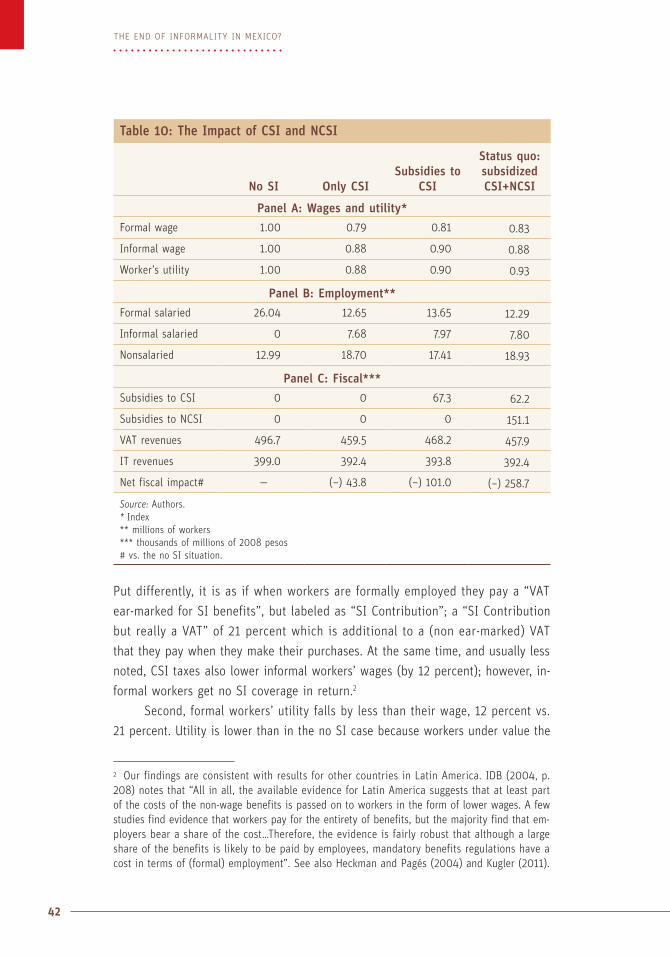
42
The end of informaliTy in mexico?
Put differently, it is as if when workers are formally employed they pay a “VAT
ear-marked for SI benefits”, but labeled as “SI Contribution”; a “SI Contribution
but really a VAT” of 21 percent which is additional to a (non ear-marked) VAT
that they pay when they make their purchases. At the same time, and usually less
noted, CSI taxes also lower informal workers’ wages (by 12 percent); however, in-
formal workers get no SI coverage in return.2
Second, formal workers’ utility falls by less than their wage, 12 percent vs.
21 percent. Utility is lower than in the no SI case because workers under value the
Table 10: The Impact of CSI and NCSI
No SI Only CSISubsidies to
CSI
Status quo:subsidized CSI+NCSI
Panel A: Wages and utility*
Formal wage 1.00 0.79 0.81 0.83
Informal wage 1.00 0.88 0.90 0.88
Worker’s utility 1.00 0.88 0.90 0.93
Panel B: Employment**
Formal salaried 26.04 12.65 13.65 12.29
Informal salaried 0 7.68 7.97 7.80
Nonsalaried 12.99 18.70 17.41 18.93
Panel C: Fiscal***
Subsidies to CSI 0 0 67.3 62.2
Subsidies to NCSI 0 0 0 151.1
VAT revenues 496.7 459.5 468.2 457.9
IT revenues 399.0 392.4 393.8 392.4
Net fiscal impact# — (–) 43.8 (–) 101.0 (–) 258.7
Source: Authors.* Index ** millions of workers *** thousands of millions of 2008 pesos # vs. the no SI situation.
2 Our findings are consistent with results for other countries in Latin America. IDB (2004, p. 208) notes that “All in all, the available evidence for Latin America suggests that at least part of the costs of the non-wage benefits is passed on to workers in the form of lower wages. A few studies find evidence that workers pay for the entirety of benefits, but the majority find that em-ployers bear a share of the cost…Therefore, the evidence is fairly robust that although a large share of the benefits is likely to be paid by employees, mandatory benefits regulations have a cost in terms of (formal) employment”. See also Heckman and Pagés (2004) and Kugler (2011).

43
FOUR PRELIMINARY QUESTIONS
benefits of CSI. This highlights the critical difference between worker’s individual
utility and the government’s welfare function. From the perspective of the govern-
ment, the CSI equilibrium is presumably better than the no SI equilibrium because
it is assured that workers consume the bundle of goods that it considers they
should consume: purchasing disability, life and health insurance, saving for retire-
ment and for a house, and so on. From workers perspective, on the other hand, the
CSI equilibrium is worse than the no SI equilibrium, as their wages are taxed with
the proceeds used to give them in return something they do not value as much.
Third, CSI taxes have large revenue-reducing effects. Total revenues from
value added and income taxes fall by 5 percent (or 0.3 percent of GDP), given in-
creased informality of workers and firms (see discussion below). Thus, while CSI
taxes generate revenue, they in parallel induce losses of other sources of reve-
nue by expanding the nontaxable sector of the economy and inducing firms to
pursue illegal behavior. Of course, the official fiscal accounts do not register the
foregone revenue, as there is no item in the budget labeled “Lost Revenue from
Informality”. But the absence of an explicit line-item in the fiscal accounts should
not mask the fact that informality is fiscally costly.
Subsidies to CSI partly offset the changes noted above. As the tax on sal-
aried labor is reduced, real wages and worker’s utility increase, and evasion of
value added and income taxes falls marginally. On the other hand, the total fiscal
cost of CSI is higher, as the (explicitly recorded) cost of subsidies to CSI is added
to the foregone (though unrecorded) revenues from value added and income taxes.
NCSI programs, for their part, have the following effects. First, the govern-
ment is closer to achieving its objective of providing all workers with coverage
against risks, as now informal workers receive some SI benefits. Second, because
informal workers now get some SI benefits that neither they, nor the firms that
may hire them, must pay for directly, they have higher utility. Third, real wages
move in opposite directions: as the supply of labor to the informal sector expands
the formal wage increases, while the informal wage falls. Thus, NCSI programs
(like subsidies to CSI) modify the incidence of CSI taxes. In this case, which is
the one that corresponds to the 2008 status quo and therefore the relevant one
for our purposes, only 64 percent of CSI taxes are shifted to workers (vs. 70 per-
cent in the absence of subsidies to CSI and NCSI programs).3 Fourth, a new item
appears and is explicitly recorded in the expenditure side of the budget under the
3 Our estimate of the net incidence of CSI taxes can be contrasted with Marrufo’s (2010), who analyses the 1997 reform to Mexico’s Social Security Law and finds that 57 percent of CSI tax-es were shifted to workers.

44
The end of informaliTy in mexico?
label of subsidies to NCSI programs (or, more precisely, under the label of health,
pension, day care programs, and so on, for informal workers); and the unrecord-
ed item in the revenue side of the budget expands as higher informality increases
foregone revenues from value added and income taxes.
We close bringing up a point at times under-emphasized in discussions of
the incidence of CSI taxes. Observed wages reflect subsidies to CSI and NCSI
worth 1.7 percent of GDP. As shown, in their absence workers would pay more for
CSI benefits. In this context, however, we cannot really establish the full incidence
of CSI taxes, because our model is silent about the incidence of the taxes neces-
sary to pay for CSI+NCSI subsidies. Put differently, a richer structure is needed to
answer the incidence question. That said, our model does indicate that, contrary
to what is often assumed in policy discussions (and more often in political dis-
course), CSI taxes are not serving to redistribute income from firms to workers.4
6.2 What are the Effects of SI on Employment?
Table 10 also serves to assess the impact of the CSI+NCSI configuration on the
composition of employment (recall that we assume constant participation rates).
Begin again with unsubsidized CSI. Because firms do pay for a share of CSI tax-
es, they reduce their total demand for salaried labor and tilt its composition in
the direction of illegal workers. Informal employment expands both because firms
now hire salaried workers illegally and because nonsalaried employment in sector
B grows.5 Relative to the no SI benchmark, salaried employment falls by 22 per-
cent and changes in composition, as 36 percent of workers are now hired illegally;
in parallel, there is a 44 percent increase in employment in sector B. These effects
are partly reversed when CSI is subsidized. In this case, relative to the no SI equi-
librium, salaried employment falls by 17 percent, while relative to the unsubsidized
CSI case it expands by 6.3 percent (while its composition changes slightly in the
direction of legality); in parallel, employment in sector B contracts by 7 percent.
4 It is useful to recall that 89 percent of all firms have at most five workers. Although we have no precise data, it is likely that many of these are family firms, where redistribution from firm owners to workers would occur within the same household. Even within firms registered with IMSS, the majority has up to five workers; see Table 1. The point here, of course, is not that there should be no redistribution from high-income to low-income households, but that CSI taxes are a very coarse redistributive tool, because the assumption that all firm owners be-long to high income households and all workers to low income ones is in all likelihood flawed.5 Although we do not quantify these effects, the change in the composition of employment also increases profits or quasi-rents in the nonsalaried sector of the economy (the value of land, street corners). Clearly this is an unintended redistributive impact of CSI.
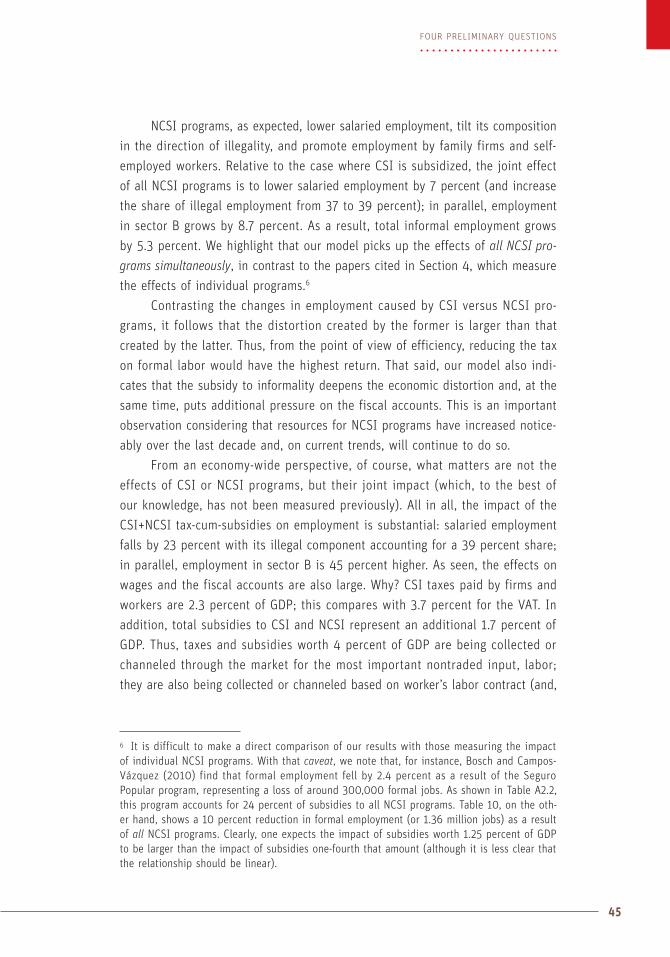
45
FOUR PRELIMINARY QUESTIONS
NCSI programs, as expected, lower salaried employment, tilt its composition
in the direction of illegality, and promote employment by family firms and self-
employed workers. Relative to the case where CSI is subsidized, the joint effect
of all NCSI programs is to lower salaried employment by 7 percent (and increase
the share of illegal employment from 37 to 39 percent); in parallel, employment
in sector B grows by 8.7 percent. As a result, total informal employment grows
by 5.3 percent. We highlight that our model picks up the effects of all NCSI pro-grams simultaneously, in contrast to the papers cited in Section 4, which measure
the effects of individual programs.6
Contrasting the changes in employment caused by CSI versus NCSI pro-
grams, it follows that the distortion created by the former is larger than that
created by the latter. Thus, from the point of view of efficiency, reducing the tax
on formal labor would have the highest return. That said, our model also indi-
cates that the subsidy to informality deepens the economic distortion and, at the
same time, puts additional pressure on the fiscal accounts. This is an important
observation considering that resources for NCSI programs have increased notice-
ably over the last decade and, on current trends, will continue to do so.
From an economy-wide perspective, of course, what matters are not the
effects of CSI or NCSI programs, but their joint impact (which, to the best of
our knowledge, has not been measured previously). All in all, the impact of the
CSI+NCSI tax-cum-subsidies on employment is substantial: salaried employment
falls by 23 percent with its illegal component accounting for a 39 percent share;
in parallel, employment in sector B is 45 percent higher. As seen, the effects on
wages and the fiscal accounts are also large. Why? CSI taxes paid by firms and
workers are 2.3 percent of GDP; this compares with 3.7 percent for the VAT. In
addition, total subsidies to CSI and NCSI represent an additional 1.7 percent of
GDP. Thus, taxes and subsidies worth 4 percent of GDP are being collected or
channeled through the market for the most important nontraded input, labor;
they are also being collected or channeled based on worker’s labor contract (and,
6 It is difficult to make a direct comparison of our results with those measuring the impact of individual NCSI programs. With that caveat, we note that, for instance, Bosch and Campos-Vázquez (2010) find that formal employment fell by 2.4 percent as a result of the Seguro Popular program, representing a loss of around 300,000 formal jobs. As shown in Table A2.2, this program accounts for 24 percent of subsidies to all NCSI programs. Table 10, on the oth-er hand, shows a 10 percent reduction in formal employment (or 1.36 million jobs) as a result of all NCSI programs. Clearly, one expects the impact of subsidies worth 1.25 percent of GDP to be larger than the impact of subsidies one-fourth that amount (although it is less clear that the relationship should be linear).

46
The end of informaliTy in mexico?
implicitly, firm’s size). It is not surprising that such a capricious mechanism to
tax and subsidize, by distorting decisions of all firms and workers, has deep eco-
nomic implications.
6.3 What are the Fiscal Costs of Subsidies to CSI and NCSI?
Table 11 presents the results of an exercise where, starting from the status quo,
government spending in SI is exogenously increased under two alternatives: first,
a higher subsidy rate to CSI; second, increasing the per worker subsidy to NCSI.
In both cases the increase is the same, arbitrarily set at 15,000 million pesos (or
0.12 percent of GDP). As expected, higher θ tilts the composition of employment
towards formality while higher τNCSI does the opposite. In parallel, real wages and
workers’ utility increase relatively more when CSI is subsidized, a result that fol-
lows from the fact that these subsidies reduce the distortion associated with the
tax on formal employment, while subsidies to NCSI augment this distortion.
But the more interesting result centers on the impact on the fiscal balance.
Because higher subsidies to CSI increase formality, the tax base expands and
revenues from value added and income taxes increase; as a result, even though
Table 11: Net Fiscal Costs of CSI and NCSI Subsidies
Calibrated
Increase in CSI subsidies of 15,000 mp
Increase in NCSI subsidies of 15,000 mp
Subsidies to CSI* 62.2 77.2 61.7
Subsidies to NCSI* 151.0 149.8 166.0
VAT revenues* 457.9 459.9 456.9
IT revenues* 392.4 392.7 392.3
Net impact on FB* — (–) 11.2 (–) 15.3
Net impact per peso — 0.76 1.03
Formal employment** 12.29 12.50 12.17
Informal employment** 26.73 26.52 26.86
Formal wage*** 1.000 1.005 1.002
Informal wage*** 1.000 1.005 0.997
Worker’s utility*** 1.000 1.005 1.003
Source: Authors. *Thousands of million of pesos **millions of workers *** index.

47
FOUR PRELIMINARY QUESTIONS
spending goes up by 15,000 million pesos, the fiscal balance deteriorates only
by 11,200 million pesos. On the other hand, higher subsidies to NCSI increase in-
formality and contract the tax base with a negative impact on tax revenues; as a
result, the fiscal balance deteriorates by more than 15,000 million pesos. The final
outcome is this: the net cost of one peso of subsidies to CSI is 0.76 pesos com-
pared to 1.03 pesos for subsidies for NCSI. This difference of 27 percent sharply
illustrates the fact that the composition of spending in SI programs has substan-
tive implications for the fiscal sustainability of SI policy.
6.4 What is the Trade-off between VAT and CSI Taxes?
Finally, we examine the impact on the real formal wage of different VA-CSI tax
combinations. The left panel of Figure 1 plots an index of the real wage as a
function of the VAT rate on food and medicine given the τCSI rate and the evasion
behavior of firms. We set this index at unity when both rates are set at their cur-
rent value, that is, τ1
VAT = 0 and τCSI = 0.38; this is point A. The right panel plots
the relationship between the real wage and the CSI rate given the same evasion
behavior; it is downward sloping since CSI taxes are partly shifted to workers. The
relationship is also drawn for τ1
VAT = 0 and τCSI = 0.38. This is point A’.
We now carry out two sequential changes. First, we increase the VAT rate on
food and medicine to 16 percent. On the left panel the real wage falls as workers
face higher consumer prices; this is point B. Importantly, this impact is mediated
by the extent of VAT compliance. Indeed, if all firms were able to evade the VAT
on food and medicine, there would be no impact on consumer prices; conversely,
Figure 1: Trade-offs between VAT and CSI Taxes
1.0 1.0A C
B
C’ A’
B’0.96
0.16 τ1VAT τCSI0.30 0.38
Source: Authors
48
The end of informaliTy in mexico?
under full compliance the impact on the real wage would be stronger. Our mod-
el indicates that with the observed compliance rates, when the VAT on food and
medicine is set at 16 percent the real wage falls by 4 percent.7 On the right pan-
el the increase in τ1
VAT shifts the curve down, since for the same CSI rate the real
wage is now lower. This is point B’. The second change consists in lowering τCSI to
return the real wage to level it had before the change in τ1
VAT. On the right panel
this is point C’, while on the left it is point C.
The result is that the same real wage is obtained by the pair (τ1VAT, τCSI) =
(0,0.38) and by the pair (τ1VAT, τCSI) = (0.16,0.30). The difference between the two
is the point at which taxation is occurring. In the first, taxes are collected “at the
door of the factory”. In the second case, taxation shifts partly to “the door of the
store”. Of course, the revenues obtained in each case are different as the bas-
es of these taxes are different (as are the possibilities of evading them). Further,
under current law the destiny of the revenues is different: taxes collected at the
door of the factory can be used only for CSI benefits, while taxes collected at the
door of the store can be freely disposed of (including paying for NCSI benefits
and subsidizing CSI benefits). But these two differences are secondary. On one
hand, the rates can be adjusted for given revenue targets; on the other, the final
disposition of the VAT can be earmarked by law.
What is critical for our purposes is the reaction of firms and workers to
these two changes. The VAT increase by itself will raise more revenues but will
increase informality; the CSI rate reduction by itself will lower revenues but in-
crease formality. The combination of the two is in principle ambiguous, and
depends on how these rates are changed. But if revenues from the VAT could be
earmarked for SI, this tax would achieve the same purpose as CSI taxes: changing
the composition of worker’s consumption by lowering their disposable earnings
and giving them SI benefits in return. There would be three substantive differ-
ences. First, formal workers would pay less VAT (labeled CSI tax) at the door of
the factory and more VAT (labeled VAT) at the door of the store. Second, infor-
mal workers would pay more VAT at the door of the store.8 Third, the base of the
7 We set the VAT at 16 percent, as the general VAT rate was raised from 15 to 16 percent in 2010. In addition, a rate of at least 16 percent is needed to finance the benefits of USI; see next section. 8 Further, if family firms and the self-employed, in a more realistic setting than in our model, purchase some intermediate inputs that are subject to VAT, there is also a tax on the informal sector through the input side (since, as noted, under Repeco or high evasion this tax cannot be credited against VAT paid on the output).

49
FOUR PRELIMINARY QUESTIONS
VAT would be wider than that of CSI taxes (as it includes profits and rents), and
would not distort firms’ and workers’ decisions regarding salaried vs. nonsalaried
or legal vs. illegal contracts.
6.5 Assessment
We began this paper observing that redistribution and administrative conve-
nience were the two main motivations behind Bismarck’s idea to fund SI out of
wage-based taxes. Our results show that in the case of Mexico, however, CSI’s re-
distributive motivation is hardly achieved: CSI taxes are largely paid by workers.
Moreover, this motivation has two undesirable results: inequitable outcomes, as
the wages of informal workers—who are not direct beneficiaries of CSI taxes—are
reduced; and unintended outcomes, as profits and quasi-rents in nonsalaried ac-
tivities increase. On the other hand, administrative convenience comes at a high
price in terms of foregone revenues from income and value added taxes, and an
equally high price in terms of economic efficiency, given the large distortions that
CSI taxes introduce in the labor market. At the same time, even under full compli-
ance, the coverage objectives of CSI are only partly met, as nonsalaried workers
are excluded. When attempts are made to remedy this situation through NCSI
programs, the redistribution and administrative motivations are lost, as these pro-
grams are funded completely from other sources of revenues, while efficiency is
further punished and fiscal costs augmented given higher evasion.
The net result is a very distorting system for financing SI and very erratic
coverage against risks, in a context of large mobility of workers between formal
and informal status. Given subsidies to CSI and the actual incidence of CSI tax-
es, when a Mexican worker is formally employed, he receives a bundled package
of SI benefits that is 16 per cent subsidized by the government (from VAT, other
taxes or oil rents), 54 percent (= 0.84*0.64) subsidized by himself and 30 per-
cent (=0.84*0.36) subsidized by the firm that hires him (since as seen, 64 percent
of CSI taxes are shifted to workers). While he holds this status, he is obligated to
contribute to the revenues of state governments given their tax on salaried labor;
to save for his retirement and for a house; to purchase health, disability and work-
risk insurance and day care services; and is protected by severance payments in
case of job loss. However, when the same worker is informally employed, he can
benefit from an unbundled package of NCSI programs that are 100 percent sub-
sidized by the government. While he holds this status, he does not have to pay
any state labor tax; he can voluntarily access a health insurance program; even-
tually receive a pension without having saved for one; maybe access a day care

50
The end of informaliTy in mexico?
center or receive a housing subsidy; but be left without any severance pay in case
of job loss. Firms, in turn, face different obligations depending on whether they
hire workers under one labor contract or another, inducing them into illegal be-
havior and socially inefficient choices. And the fisc, finally, loses revenue given a
narrowed tax base.
This state of affairs would be amply justified, of course, if there were no
other alternatives for the government to provide SI to workers, as the option of
leaving them unprotected against risks is not an option. The relevant question in
this context is thus not whether SI should be funded from value added taxes; as
shown, taxes at the door of the store (and other sources of revenue) already fund
a 100 percent of NCSI and 16 percent of CSI. Moreover, it is inevitable that this
be so because there will always be nonsalaried contractual relations in the econ-
omy and, given imperfect enforcement of the tax on salaried labor, illegal salaried
workers. Rather, in a context where the government wants formal and informal
workers to be covered by SI, the relevant question, in our view, is twofold. First,
does it make sense to continue to provide different SI benefits to the same work-
er depending on his labor contract, and to fund these benefits with a mix of labor
and other taxes? Second, is there an alternative mix of financing that produces
fewer productivity-reducing distortions, enlarges the tax base, and —critically—is
able to offer the same protection against risks that are common to all workers?
7.1 What Does USI Consist of?
This and the next section describe our proposal for USI. This section assumes that
there are a set of risks against which all workers need to be protected regardless
of labor status, namely, illness, disability, longevity and death. We separate these
risks from others that workers may face but that are specific to their salaried sta-
tus such as being fired by their boss or suffering an accident at work because
the firm fails to comply with safety standards. These latter risks are dealt with in
the next section, where we also propose complementary pension benefits for sal-
aried workers. We highlight that when these complementary pension benefits are
taken into account, our proposal implies that the health, life and disability and
work-risk insurance as well as retirement pensions that formal workers currently
receive under CSI would remain the same under USI.
For the purposes of this section, we define universal social insurance, USI,
as the provision of health, life and disability insurance and retirement pensions
of the same level of quality (health) or monetary payment (pensions) to all work-
ers or their families. We denote the per worker monetary cost of those benefits
as τUSI. More precisely, we assume that under USI all workers are entitled to:
(i) the same health benefits currently provided by CSI when they are formally
employed; this is the IMSS health program, whose coverage is broader than that
provided by NCSI health programs when they are informally employed, (ii) a con-
tribution for life, disability and retirement pensions equal to that received by a
worker earning two times the minimum wage, and (iii) a guarantee of a mini-
mum pension equivalent to one minimum wage if workers, as is currently the
case under CSI, are registered with USI for at least 25 years. (In the next section
Universal Social Insurance and the End of Informality
CHAPTER 7

52
The end of informaliTy in mexico?
we extend USI to include additional pension benefits.) We exclude housing and
day care services from USI.1
The benefits of USI are delivered in a similar fashion as those currently
provided by CSI. Retirement pensions would operate as a defined contribution
program with monthly contributions deposited in workers’ individual retirement
accounts in the Afore of their choice, and with annuities bought from private in-
surance companies at the time of retirement; in turn, for risk pooling purposes,
contributions for death and disability insurance would be deposited in the same
common reserve fund managed by IMSS as currently occurs under CSI, with pay-
outs for permanent disability or survivorship pensions also taking the form of
annuities. Thus, very importantly, the pension components of USI are fully fund-
ed, with no contingent liabilities. In parallel, health benefits would continue to be
provided by IMSS and state governments. In particular, IMSS would receive the
same payment for health per enrolled worker as under CSI, while state govern-
ments would receive a higher per worker payment vis-à-vis what they currently
get from the NCSI health programs (equal to that received by IMSS).
Appendix 3 provides details of how τUSI was calculated; suffice it to say here
that it equals 14,330 pesos per worker annually, which compares with subsidies
for CSI and NCSI of 5,062 and 5,652 pesos, respectively. Of this total, 70.6 per-
cent corresponds to health benefits, 24.3 percent to retirement pensions, and
5 percent to life and disability insurance. Very importantly, this benefit level im-
plies more than doubling public subsidies for SI, from 1.7 percent of GDP under
CSI+NCSI, to 4.4 percent under USI; clearly, a major change.2
1 Mexico is one of the few countries in the world to include housing and day care as obligato-ry components of CSI. These needs are of a different nature than the risks traditionally associat-ed with SI; see Levy (2008). Our calculations exclude the resources necessary to provide hous-ing and day care benefits to all workers. Of course, the government could continue to subsidize housing and day care programs, but these would no longer be considered part of SI. Our calcu-lations also assume that state taxes on salaried labor are eliminated, and that state governments are compensated by the federal government for the foregone revenues; see the discussion below. 2 The proposal also implies increasing total national spending in SI. Under CSI+NCSI this spending is 3.9 percent of GDP (excluding SI spending for public sector workers and the tran-sition costs of the change from the pay-as-you-go to the defined-contribution scheme resulting from the 1997 pension reform). Of this total, 1.7 percent are government subsidies (for CSI and NCSI), and 2.2 percent CSI taxes paid by firms and formal workers. Under USI public spending in SI is 4.4 percent of GDP, as noted. As discussed in the next section, however, to this sum one needs to add complementary pension benefits paid by firms and salaried workers worth 0.4 percent of GDP. Thus, all in all, spending in SI would increase from 3.9 percent to 4.8 per-cent of GDP. There would also be a change in composition as public spending in day care and housing would disappear (by the equivalent of 0.5 percent of GDP), with spending in health and pensions therefore increasing by 1.4 percent of GDP.
53
UNIVERSAL SOCIAL INSURANCE AND THE END OF INFORMALITY
7.2 The Labor Market and the Fiscal Balance under USI
There are three critical implications of USI. First, CSI and NCSI benefits are elim-
inated and replaced by USI benefits, so worker’s utility is:
β τ= +U wf fUSI USI (24)
β τ= +U wi iUSI USI (25)
where [0,1]USIβ ∈ refers to workers valuation of the bundle of USI benefits. As a
result, there are no incentives for workers to seek one form of employment ver-
sus another just on the basis of differences in SI benefits.
Second, the cost of labor is the same regardless of the nature of the labor
contract. In terms of Table 5 this implies—critically—removing all taxes on formal
employment and subsidies to informal employment. As a result, firms have no in-
centive to offer workers one type of contract versus another, to change their size
as a strategy to avoid CSI taxes, to mask a salaried contract as nonsalaried, or to
out-source activities or rotate workers just to evade SI regulations. Put different-
ly, USI implies eliminating all distortions in firms’ and workers’ behavior in the
labor market stemming from SI policy, a situation that would have an unambigu-
ously positive impact on productivity.3
The third implication is that an ear-marked consumption tax is needed to
cover the costs of USI, a tax that has the same base, method of accreditation and
enforcement technology as the VAT. Indeed, were it not for the fact that the pro-
ceeds of this tax are ear-marked for USI, it would be exactly the VAT. Because
operationally this tax is collected along with the non ear-marked VAT, we can di-
vide the VAT rate in two parts:
τ ατ α τ τ τ= + − = +(1 )VAT VAT VAT VAT USI VAT GP/ / (26)
where α is the share of the total VAT rate ear-marked for USI, τVAT/USI, with the re-
mainder being the share used for general purposes, τVAT/GP. Under our proposal, τVAT
is obtained by equalizing the VAT rate on I1 (food and medicine) and I
2 (all other
goods) and setting both at 16 percent.4 In turn, total VAT revenues, RVAT (..), are
3 An important exception is the distortions created by severance pay which so far have been excluded from the analysis; see the discussion in Section 8.3.4 Our proposal also implies raising VAT rates in the borders to 16 percent (from 11 percent), although this is not captured by our model since there is no regional dimension.

54
The end of informaliTy in mexico?
separated into revenues ear-marked for USI, RVAT/USI (..) = αRVAT (..), and non-ear-
marked revenues RVAT/GP (..) = (1–α)RVAT (..).
Very importantly, from a legal perspective τVAT/USI is labeled as “contribution
for USI”, implying that proceeds from this contribution are wholly ear-marked for
SI. In turn, RVAT/USI (..) is registered in a separate account of the federal government’s
budget, is not subject to revenue-sharing with the states, and is divided in three sep-
arate sub-accounts with no possibilities of transfers between them, so as to clearly
identify and manage resources for health, life and disability pensions, and retire-
ment pensions. Resources from the health subaccount are transferred to IMSS and
state governments to provide health services of equal quality to all workers; resourc-
es from the life and disability insurance subaccount are transferred to the common
IMSS-managed reserve fund; and resources from the retirement pension subaccount
are transferred on a per worker basis to their individual retirement accounts.
A critical condition for the fiscal sustainability of USI is that:
τ τ=R L(.., ,..)VAT USI VAT USI USI/ / (27)
Equation (27) is central: it states that the costs of USI, given by the ex-
ogenously chosen level of benefits and the size of the labor force, must be fully
financed from the share of VAT revenues legally ear-marked for USI. This implies,
as noted, that RVAT/USI cannot be used for purposes other than SI but, conversely, that
USI must be fully funded from these revenues; the government could not transfer re-
sources from other sources (including oil rents!) to fund SI. Critically, therefore, τUSI
could not be set independently of τVAT/USI, and any increases to τUSI that are deemed
socially desirable would have to be funded with additional contributions.
The government’s fiscal balance under USI is therefore written as:
= + + +FB R R R R[ (..) (..) (..)]VAT USI VAT GP IT/ / G L[ ]USIτ− + (28)
Comparing this with the fiscal balance under the CSI+NCSI configuration
given by equation (22), and considering the constraint imposed by equation (27),
it is obvious that this particular method of funding SI has two major advantages.
First, it ensures the long term fiscal sustainability of Mexico’s SI policy. Second,
it makes the effort made by society to fund SI fully transparent, tightly linking
benefits with contributions.5
5 Note that something akin to equation (27) already holds for CSI, given Mexico’s defined-con-tribution retirement system. Indeed, it is the existence of NCSI programs that breaks the link
55
UNIVERSAL SOCIAL INSURANCE AND THE END OF INFORMALITY
In sum, we propose a social-cum-fiscal reform that provides all workers with
the same SI benefits; that eliminates subsidies to nonsalaried labor and taxes on
salaried labor while shifting the burden of taxation towards consumption; that
explicitly links contributions with benefits; and that creates no contingent liabil-
ities and puts no pressure on the government’s fiscal balance. This proposal, of
course, needs to be evaluated in a context where firms’ can evade the VAT; where
there are numerous family firms and self-employed workers (sector B) which are
by-and-large beyond the reach of the tax authority (although in principle contrib-
uting under the Repeco regime); and where compensation needs to be offered to
poor households to fully offset any negative effects of the VAT increase.
7.3 Fiscal Reform under CSI and NCSI versus USI
Table 12 shows the impact a VAT reform that sets all rates at 16 percent under
three scenarios: one with the current configuration of CSI and NCSI taxes and
subsidies; one where this configuration is replaced by USI but no compensation
is offered to anyone; and one where compensations are included as part of the
fiscal costs of USI. We focus on the impact of the reform on the fiscal balance
(Panel A), wages and utility (Panel B), and employment (Panel C).
Consider first the VAT reform in the absence of any changes to SI policy. As
expected, there is an important increase in VAT revenues, of approximately 3 per-
cent of GDP (although there is a loss of revenue from income taxes as firms pay
more VAT). As also expected, the real wage falls given higher consumer prices.
But, very importantly, the reform increases the level of informality in the econo-
my, as employment in the non-taxed sector B expands and as firms producing I1
and I2 increase the share of salaried workers hired illegally. This increases spend-
ing in subsidies to NCSI (and reduces it in subsidies for CSI), with a net increase
in spending (given equation (23)). Because the VAT reform is centered in food
and medicine (I1), this sector contracts while there is a marginal increase in the
already taxed sector (I2); indeed, following expression (13), as the price of I
1 in
terms of I2 increases the composition of good A tilts toward I
2. But the biggest
between contributions and SI benefits, and has opened the door for unfunded commitments and new contingent liabilities derived from health or pension programs. Our proposal re-establish-es that link and closes the door to future unfunded commitments. The political economy impli-cations of this are large, as neither the President nor Congress could offer additional SI bene-fits to workers without in parallel assuring the source of funding. This is already the case for CSI programs, but not for NCSI programs. See Lindert (2004) for a historical discussion of the fiscal sustainability of SI policy.
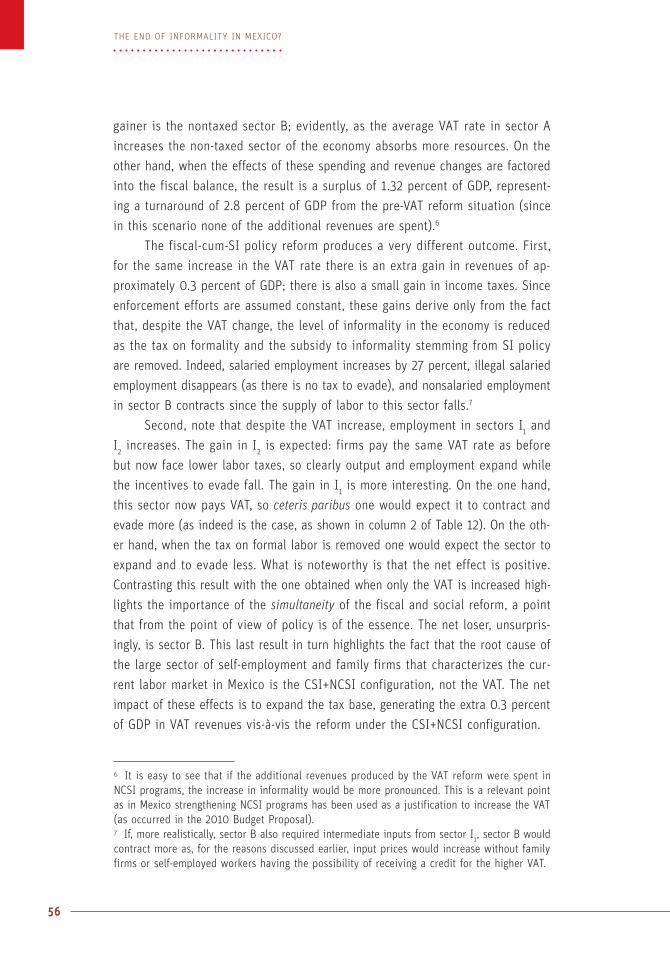
56
The end of informaliTy in mexico?
gainer is the nontaxed sector B; evidently, as the average VAT rate in sector A
increases the non-taxed sector of the economy absorbs more resources. On the
other hand, when the effects of these spending and revenue changes are factored
into the fiscal balance, the result is a surplus of 1.32 percent of GDP, represent-
ing a turnaround of 2.8 percent of GDP from the pre-VAT reform situation (since
in this scenario none of the additional revenues are spent).6
The fiscal-cum-SI policy reform produces a very different outcome. First,
for the same increase in the VAT rate there is an extra gain in revenues of ap-
proximately 0.3 percent of GDP; there is also a small gain in income taxes. Since
enforcement efforts are assumed constant, these gains derive only from the fact
that, despite the VAT change, the level of informality in the economy is reduced
as the tax on formality and the subsidy to informality stemming from SI policy
are removed. Indeed, salaried employment increases by 27 percent, illegal salaried
employment disappears (as there is no tax to evade), and nonsalaried employment
in sector B contracts since the supply of labor to this sector falls.7
Second, note that despite the VAT increase, employment in sectors I1 and
I2 increases. The gain in I
2 is expected: firms pay the same VAT rate as before
but now face lower labor taxes, so clearly output and employment expand while
the incentives to evade fall. The gain in I1 is more interesting. On the one hand,
this sector now pays VAT, so ceteris paribus one would expect it to contract and
evade more (as indeed is the case, as shown in column 2 of Table 12). On the oth-
er hand, when the tax on formal labor is removed one would expect the sector to
expand and to evade less. What is noteworthy is that the net effect is positive.
Contrasting this result with the one obtained when only the VAT is increased high-
lights the importance of the simultaneity of the fiscal and social reform, a point
that from the point of view of policy is of the essence. The net loser, unsurpris-
ingly, is sector B. This last result in turn highlights the fact that the root cause of
the large sector of self-employment and family firms that characterizes the cur-
rent labor market in Mexico is the CSI+NCSI configuration, not the VAT. The net
impact of these effects is to expand the tax base, generating the extra 0.3 percent
of GDP in VAT revenues vis-à-vis the reform under the CSI+NCSI configuration.
6 It is easy to see that if the additional revenues produced by the VAT reform were spent in NCSI programs, the increase in informality would be more pronounced. This is a relevant point as in Mexico strengthening NCSI programs has been used as a justification to increase the VAT (as occurred in the 2010 Budget Proposal).7 If, more realistically, sector B also required intermediate inputs from sector I
1, sector B would
contract more as, for the reasons discussed earlier, input prices would increase without family firms or self-employed workers having the possibility of receiving a credit for the higher VAT.
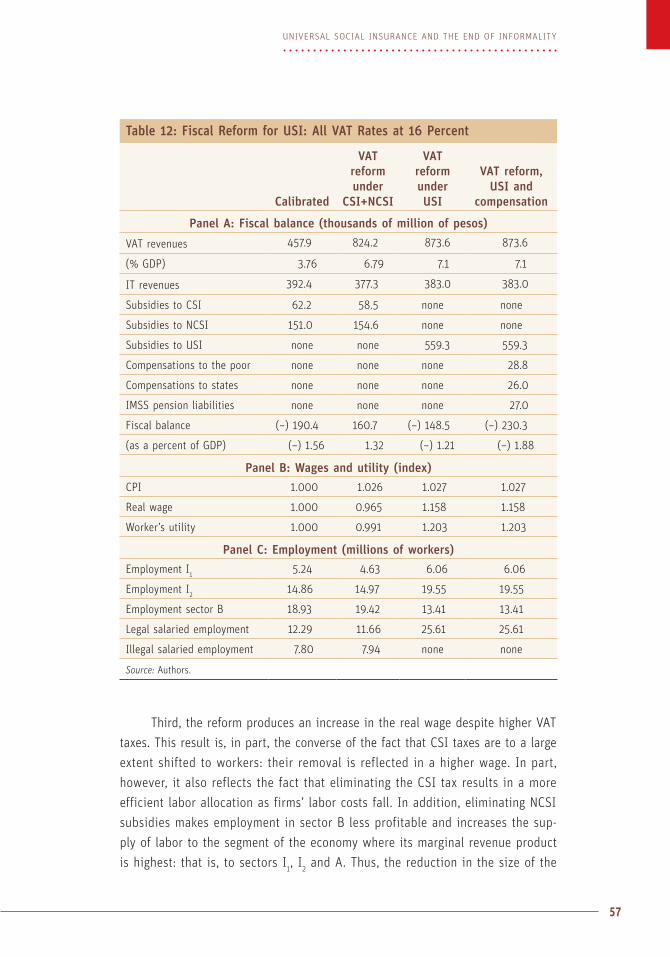
57
UNIVERSAL SOCIAL INSURANCE AND THE END OF INFORMALITY
Third, the reform produces an increase in the real wage despite higher VAT
taxes. This result is, in part, the converse of the fact that CSI taxes are to a large
extent shifted to workers: their removal is reflected in a higher wage. In part,
however, it also reflects the fact that eliminating the CSI tax results in a more
efficient labor allocation as firms’ labor costs fall. In addition, eliminating NCSI
subsidies makes employment in sector B less profitable and increases the sup-
ply of labor to the segment of the economy where its marginal revenue product
is highest: that is, to sectors I1, I
2 and A. Thus, the reduction in the size of the
Table 12: Fiscal Reform for USI: All VAT Rates at 16 Percent
Calibrated
VAT reform under
CSI+NCSI
VAT reform under USI
VAT reform, USI and
compensation
Panel A: Fiscal balance (thousands of million of pesos)
VAT revenues 457.9 824.2 873.6 873.6
(% GDP) 3.76 6.79 7.1 7.1
IT revenues 392.4 377.3 383.0 383.0
Subsidies to CSI 62.2 58.5 none none
Subsidies to NCSI 151.0 154.6 none none
Subsidies to USI none none 559.3 559.3
Compensations to the poor none none none 28.8
Compensations to states none none none 26.0
IMSS pension liabilities none none none 27.0
Fiscal balance (–) 190.4 160.7 (–) 148.5 (–) 230.3
(as a percent of GDP) (–) 1.56 1.32 (–) 1.21 (–) 1.88
Panel B: Wages and utility (index)
CPI 1.000 1.026 1.027 1.027
Real wage 1.000 0.965 1.158 1.158
Worker’s utility 1.000 0.991 1.203 1.203
Panel C: Employment (millions of workers)
Employment I1
5.24 4.63 6.06 6.06
Employment I2
14.86 14.97 19.55 19.55
Employment sector B 18.93 19.42 13.41 13.41
Legal salaried employment 12.29 11.66 25.61 25.61
Illegal salaried employment 7.80 7.94 none none
Source: Authors.
58
The end of informaliTy in mexico?
non-taxable sector B has two effects: as noted, it expands the tax base; but it also
contributes to increase the average productivity of labor.
But most important for our purposes, fourth, note that ignoring any com-
pensations, the social-cum-fiscal reform reduces the fiscal deficit by 0.35 percent
of GDP vis-à-vis the status quo, given the level at which USI benefits are set.
These benefits represent 64 percent of total VAT revenues, suggesting in turn that
τVAT/USI and τVAT/GP are on the order of 10 percent and 6 percent, respectively; see
equation (26).
The last column of Table 12, finally, includes three additional costs as
part of the fiscal costs of the proposal: (i) direct transfers to the poor to off-
set the negative income effect of the VAT increases, as discussed in Section
9; (ii) compensations to state governments for the foregone revenue from
eliminating state taxes on salaried workers;8 and (iii) servicing the pension li-
abilities of IMSS-own workers directly by the federal government (as explained
in Appendix 3). The relevant point to note is that when these costs are includ-
ed, the net fiscal impact changes from a reduction in the fiscal deficit of 0.35
percent of GDP vis-a-vis the status-quo, as noted above, to an additional defi-
cit of 0.34 percent of GDP.9
We could present results with a higher VAT rate or with lower USI bene-
fits so as to leave the fiscal balance unchanged.10 But that is not the point here.
8 Given the already high vertical imbalance and dependence of state governments on transfers from the federal government, it would be better if the revenues foregone by state government were replaced from another source like a state gasoline tax or improved incentives to collect in the Repeco regime, as opposed to being compensated by the federal government. This would reduce the costs of compensations by 0.2 percent of GDP.9 As noted, our calculations ignore the costs of maintaining subsidies for housing and day care programs, for approximately 0.5 percent of GDP (of which housing represents 0.4 per-cent). Assuming these are maintained along with all compensations, the fiscal deficit would in-crease relative to the status quo by 0.82 percent of GDP (or 0.62 percent excluding compen-sations to state governments). 10 A scenario where the general VAT rate is set at 17 percent produces about 50,000 million pesos of additional revenues, or 0.4 percent of GDP. This would reduce the fiscal deficit vis-a-vis the status quo to 0.1 percent of GDP after considering all compensations (or to 0.3 percent if compensations to state governments are excluded). Alternatively, if housing and day care pro-grams are maintained, the fiscal deficit vias-a-vis the status quo would increase by about 0.4 percent of GDP (or 0.2 percent if compensation to states is excluded). This suggests setting the VAT rate somewhere between 16 percent and 17 percent. On the other hand, our proposal would also have important implications for personal income taxes that we do not model here, and which could likely generate more revenues as salaried employment expands, or certain ex-emptions are eliminated (such as deductions for health insurance), given a context where the government provides all workers with SI benefits.
59
UNIVERSAL SOCIAL INSURANCE AND THE END OF INFORMALITY
Rather, the point is that our calculations show that a proposal for USI financed
from a consumption tax need not represent an unmanageable burden on the fis-
cal balance. Of course, whether this is so or not depends on considerations that
lie beyond the scope of our paper, having to do with societal choices for taxa-
tion and other claims on public resources. That said, it is useful to be clear about
the real policy alternatives, as the relevant comparison is in all likelihood not be-
tween USI and the 2008 status quo. The more relevant comparison is between
USI and the observed trends in SI policy. In particular, if the Mexican government
continues to respond as it has done so far to societal demands for increased so-
cial equity and improved coverage of risks for informal workers through further
growth in NCSI programs in parallel to existing CSI programs, the result will be
a narrower tax base, persistent productivity losses, increased incentives to infor-
mality, and further de-linking of benefits from contributions.
7.4 The End of Informality?
Fiscal and efficiency considerations aside, the most important effect of our pro-
posal is to provide all workers with the same coverage against risks. If, following
Kanbur (2009) and the discussion of Section 2, informality is defined with respect
to the absence of observance of a particular regulation—SI coverage—, the reform
indeed ends informality: all workers are covered by the same SI.
Completing Mexico’s truncated welfare state, that is, replacing CSI+NCSI
with USI, helps solve six critical problems present in a labor market character-
ized by frequent transitions across forms of employment. First, workers receive
the IMSS health package regardless of their labor contract, with positive impli-
cations for their own welfare (and large implications for public subsidies for
health which, as shown in Appendix 3, would increase by 52 percent, or an
additional 1.1 percent of GDP). Second, the adverse selection problem created
by the co-existence of two health insurance systems, one free and voluntary
and the other costly and obligatory, are eliminated; health risks are pooled
more effectively. Third, workers contribute to their retirement pension during
their entire working life, not only when they are formally employed; as a re-
sult, as elaborated on in the next section, retirement pensions would be more
generous. Fourth, all workers could qualify for the minimum pension guarantee
because they would accumulate for their retirement pension throughout their
working life. This feature is particularly relevant for low wage workers, the
majority of whom, as a result of frequent transitions between formal and in-
formal status, will not benefit from this guarantee (despite being the intended
60
The end of informaliTy in mexico?
beneficiaries).11 Fifth and more generally, workers would be protected against
risks regardless of the vagaries of their labor contract, increasing the effica-
cy of insurance. Finally, sixth, one would expect that because CSI taxes are
eliminated, contractual changes and worker rotations that result from firms’
strategies to evade these taxes would be likely to cease, facilitating more
durable relations between firms and workers, more on-the-job learning, and
increased investments in labor training.
But the end of informality is not the end of illegality. In our model, after
the reform firms producing I1, I
2 and A continue to evade value added and income
taxes, and a sector beyond the reach of the tax authorities (sector B) continues to
exist, although it is smaller. Our reform proposal does not solve the difficulties of
imperfect enforcement, nor does it directly affect other determinants of the size
distribution of firms, which in turn have an impact on enforcement (such as ac-
cess to credit). Further, our proposal fails to address issues associated with the
high costs of registration and compliance with sanitary, environmental and relat-
ed regulations, which would also need to be tackled as part of a larger effort to
reduce illegal behavior.
That said, there are additional potentially positive effects of our proposal not
captured by our model. On the one hand, unifying the VAT rates would significantly
simplify the administration of this tax, as the current cumbersome system of ex-
emptions by location and type of good—and associated possibilities for arbitrage
and graft—would be unneeded; in principle, this should facilitate enforcement. On
the other hand, recall that our model takes the distribution of the capital stock in
each sector—ƒ(K1)and ƒ(K2)—as given. In this context, we speculate that as the im-
plicit tax on firm size associated with the CSI+NCSI configuration is removed, the
profitability of larger vis-à-vis smaller firms would increase changing the size dis-
tribution of firms toward larger firms; this in itself would be a factor facilitating
enforcement. Exploring these issues, however, is left for further research.
7.5 Decomposition of the Increase in VAT Revenues
To shed further light into our results, Table 13 divides total VAT collections into
those originating from goods I1, I
2 and final good A, and provides the estimated
11 As noted, from 1997 to 2006, the average contribution density for low wage workers was 49 percent, implying the need to work 50 years to benefit from this guarantee (since under CSI 25 years of formality are needed to qualify). In contrast, under USI nonsalaried employment would also be considered (implying contribution densities of 100 percent).

61
UNIVERSAL SOCIAL INSURANCE AND THE END OF INFORMALITY
values of the aggregate rates of compliance for each of the VAT reform scenarios
(see equation (10) and Appendix 1).
The calibrated equilibrium in the second column shows, as expected, that
the compliance rate in I1 is zero when τ1
VAT = 0. VAT collections all come from I2,
where the VAT rate is 15 percent and the rate of compliance 0.61; and from final
good A, where the VAT rate and the rate of compliance is a weighted average of
the corresponding rates in sectors I1 and I
2. Column three measures the impact
of the VAT reform when τ1VAT = 15 percent, while column four sets the VAT rate
in both sectors I1 and I
2 at 16 percent. In these two columns we assume that the
VAT reform occurs in isolation (that is, the CSI+NCSI configuration is maintained).
Now, to identify the impact that compliance in intermediate sector I1 has
on compliance in the final sector A, in columns three and four we artificially as-
sume that, despite the fact that all firms in sector I1 now face a positive VAT rate,
none comply with the VAT (clearly not a profit maximizing point). As a result, in
both these columns the compliance rate in sector A is the same as before. Under
this assumption, a VAT reform where rates are set at 15 percent produces total
VAT revenues of 683,700 million pesos (column three); and of 726,600 million
pesos when these rates are set at 16 percent (column four). Note that in both cas-
es most of the additional revenues come from final good A since, by assumption,
sector I1 pays no additional VAT (and sector I
2 pays a VAT rate that is only one
percentage point higher in column four).
Table 13: Decomposition of the Total Increase in VAT Revenues
Calibrated
VAT = 15%,
ξ�1 0VAT
= ,CSI+NCSI
VAT = 16%,
ξ�1 0VAT
= ,CSI+NCSI
VAT = 16%,
ξ�1 0 36VAT
= . , CSI+NCSI
VAT = 16%,
ξ�1 0 36VAT
= . ,USI
VAT revenues* 457.9 683.7 726.6 824.2 873.6
I1
0 0 0 36.0 42.8
I2
211.6 211.6 222.2 224.8 267.4
A 246.3 472.1 504.4 563.4 563.4
Compliance rates
�VAT
1ξ 0.00 0.00 0.00 0.36 0.36
�VAT
2ξ 0.61 0.61 0.61 0.61 0.61
AVATξ 0.43 0.43 0.43 0.53 0.53
Source: Authors*Thousands of million of pesos.
62
The end of informaliTy in mexico?
The interesting result arises in column five where, while still maintaining
the CSI+NCSI configuration, we now allow sector’s I1 aggregate compliance rate
to be determined by equation (10) which, given the size distribution of firms in
that sector, is 0.36. Two effects follow. First, firms in that sector now pay 36,000
million pesos of VAT, compared to none before. Second, VAT paid by sector A
increases by 59,000 million pesos, with the net result that total VAT revenues in-
crease by 13 percent (from 726,600 million pesos to 824,200 million pesos or by
0.8 percent of GDP), for the same 16 percent VAT rates. These two effects, par-
ticularly the revenue increase in sector A, sharply illustrate, in accordance with
our earlier discussion and with De Paula and Scheinkman’s (2010) “chain effects”,
that higher compliance in the intermediate sector induces higher compliance in
the final sector. Indeed, sector’s A compliance rate increases from 0.43 to 0.53.12
Put differently, reduced evasion in I1 translates into reduced evasion in sector A.
The chain of accreditation and payment is strengthened. Because firms in sector I1
pay more VAT, they issue more VAT invoices, which in turn induces firms in sector
A to pay more VAT to be able to get credit for the VAT paid to firms in sector I1.
We highlight that these “chain effects” are not small: the increase in rev-
enues in sector A from having sector I1 pay some VAT translates into 59,000
million pesos of additional revenues, or approximately 0.4 percent of GDP. This
compares with the direct VAT payments of sector I1 of 36,000 million pesos (or
0.3 percent of GDP). Thus, “chain effects” matter greatly for policy: they show that
focusing only on the additional VAT that firms in sector I1 would pay by elimi-
nating the exemptions to food and medicine misses the significant fact that, by
completing the value added chain, the higher rate on I1 induces greater compli-
ance with the VAT throughout the whole economy.
Finally, the last column in Table 13 picks up the effect of the SI reform, from
CSI+NCSI to USI. As discussed, firms in sectors I1 and I
2 face lower labor costs,
expand employment and output and, for the same compliance rates, pay more
VAT. The net result is that the increase in total VAT revenues from 457,900 mp (or
3.7 percent of GDP) under the status quo to 873,600 mp (or 7.1 percent of GDP)
under our proposal, results from four factors: (i) an increase in VAT in I1 from 0
to 15 percent (as captured in column three vs. column two); (ii) an increase in
12 In parallel, note that the aggregate compliance rate in sector I1 is lower than in sector I
2,
0.61 vis-a-vis 0.31. This result follows from the fact that the size distribution of firms in sector I
1, where food and medicine are produced, is skewed to the left in comparison to that of sec-
tor I2. This can be verified by noting that a larger share of employment in sector I
1 occurs in
small firms versus sector I2 (see Table 8).
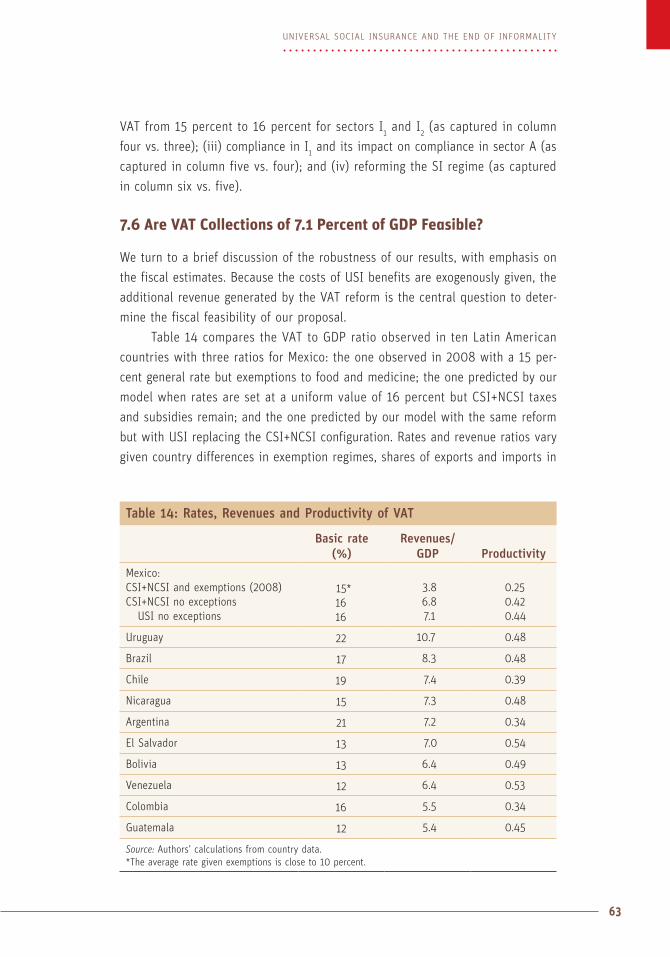
63
UNIVERSAL SOCIAL INSURANCE AND THE END OF INFORMALITY
VAT from 15 percent to 16 percent for sectors I1 and I
2 (as captured in column
four vs. three); (iii) compliance in I1 and its impact on compliance in sector A (as
captured in column five vs. four); and (iv) reforming the SI regime (as captured
in column six vs. five).
7.6 Are VAT Collections of 7.1 Percent of GDP Feasible?
We turn to a brief discussion of the robustness of our results, with emphasis on
the fiscal estimates. Because the costs of USI benefits are exogenously given, the
additional revenue generated by the VAT reform is the central question to deter-
mine the fiscal feasibility of our proposal.
Table 14 compares the VAT to GDP ratio observed in ten Latin American
countries with three ratios for Mexico: the one observed in 2008 with a 15 per-
cent general rate but exemptions to food and medicine; the one predicted by our
model when rates are set at a uniform value of 16 percent but CSI+NCSI taxes
and subsidies remain; and the one predicted by our model with the same reform
but with USI replacing the CSI+NCSI configuration. Rates and revenue ratios vary
given country differences in exemption regimes, shares of exports and imports in
Table 14: Rates, Revenues and Productivity of VAT
Basic rate (%)
Revenues/GDP Productivity
Mexico:CSI+NCSI and exemptions (2008)CSI+NCSI no exceptions
USI no exceptions
15*1616
3.86.87.1
0.250.420.44
Uruguay 22 10.7 0.48
Brazil 17 8.3 0.48
Chile 19 7.4 0.39
Nicaragua 15 7.3 0.48
Argentina 21 7.2 0.34
El Salvador 13 7.0 0.54
Bolivia 13 6.4 0.49
Venezuela 12 6.4 0.53
Colombia 16 5.5 0.34
Guatemala 12 5.4 0.45
Source: Authors’ calculations from country data.*The average rate given exemptions is close to 10 percent.
64
The end of informaliTy in mexico?
GDP, evasion and informality (as reflected in the “productivity” measure obtained
from dividing the revenue ratio over the basic rate).
We make four points: first, by Latin American standards Mexico is current-
ly an outlier in terms of its very low revenue ratio. Second, a uniform 16 percent
rate is not higher than that observed in Uruguay, Brazil, Chile, Argentina and
Colombia.13 Third, our model prediction of a revenue ratio of 7.1 is within the
range of experiences observed in Latin America, particularly taking into account
that this ratio would derive from a reduction in the size of the non-taxed sector
and of firms’ incentives to evade.
The fourth point follows from comparing the two simulated VAT to GDP ra-
tios. In our model, changes in VAT revenues result from labor reallocations as
firms and workers respond to changes in value added and SI tax and subsidy
rates. As discussed, the VAT reform that maintains CSI+NCSI taxes and subsi-
dies re-allocates labor in the direction of informality, eroding the tax base. This
suggests that if USI replaced the CSI+NCSI configuration in parallel with the VAT
reform, VAT revenues would be at least 6.8 percent of GDP. Indeed, this figure
would result from eliminating the tax on formal labor and the subsidy to informal
labor, but with firms demanding fewer legal salaried workers, while illegal sala-
ried employment, self-employment and employment in family firms would expand
in response! Put differently, even if the elasticities of the demand for labor in all
firms and sectors were not only different in value from the ones implied by our
model, but of the opposite sign, the lower bound for the VAT/GDP ratio would be
6.8 percent. Of course, we expect labor to flow in the opposite direction when
USI is introduced generating an additional 0.3 percent of GDP in VAT revenues,
according to our model. From this perspective and in the light of the compari-
son of Mexico vis-à-vis other countries in Latin America, it seems reasonable to
expect VAT revenues on the order of 7.1 percent of GDP in response to the pro-
posed fiscal-cum-SI policy reform.14
13 By contrast, VAT rates for OECD countries (of which Mexico is a member), as of 2007 were: Sweden 25, Finland 22, Italy, 20, Belgium, 21; France, 19; Greece, 18; United Kingdom, 17.5; Portugal, 17; and Spain, 16; see Bird and Gendron (2007). More recently some of these coun-tries have raised their rates. In parallel, Hernández (2009) compares Mexico’s performance with countries like Canada and South Korea, which also have important exemptions and spe-cial treatments, and finds that VAT revenues in Mexico are low. 14 Indeed, over the medium term one would expect even higher VAT revenues as the margin-al product of capital in the taxable sector of the economy increases with the reform (because salaried employment expands), thus inducing more investments in that sector; while it falls in the non-taxable sector (because the subsidy to nonsalaried employment disappears), thus re-ducing the incentives to invest there.
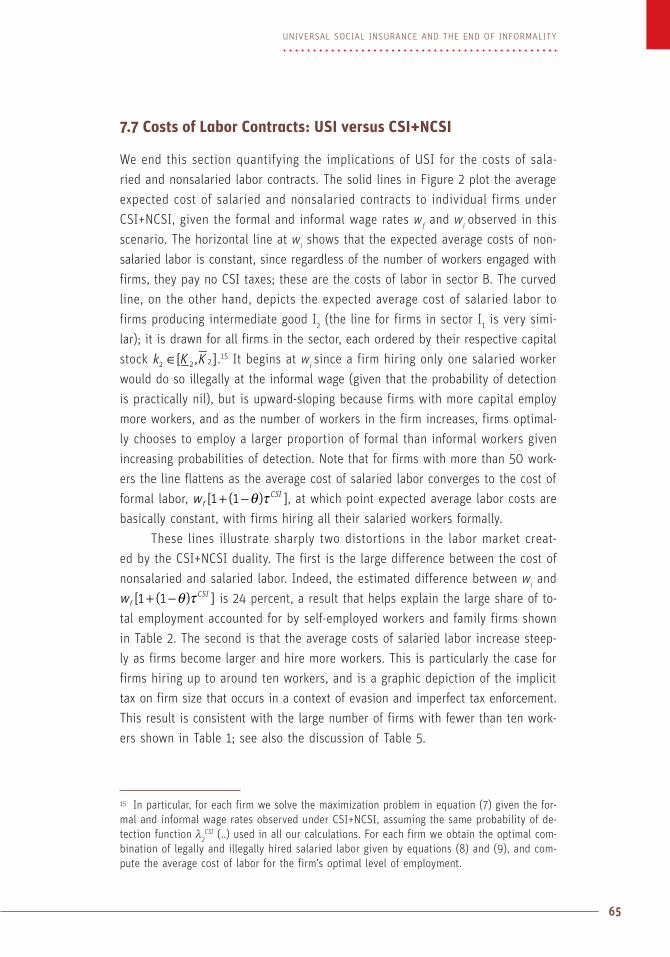
65
UNIVERSAL SOCIAL INSURANCE AND THE END OF INFORMALITY
7.7 Costs of Labor Contracts: USI versus CSI+NCSI
We end this section quantifying the implications of USI for the costs of sala-
ried and nonsalaried labor contracts. The solid lines in Figure 2 plot the average
expected cost of salaried and nonsalaried contracts to individual firms under
CSI+NCSI, given the formal and informal wage rates wf and wi observed in this
scenario. The horizontal line at wi shows that the expected average costs of non-
salaried labor is constant, since regardless of the number of workers engaged with
firms, they pay no CSI taxes; these are the costs of labor in sector B. The curved
line, on the other hand, depicts the expected average cost of salaried labor to
firms producing intermediate good I2 (the line for firms in sector I
1 is very simi-
lar); it is drawn for all firms in the sector, each ordered by their respective capital
stock ∈k K K[ , ]2 2 2 .15 It begins at wi since a firm hiring only one salaried worker
would do so illegally at the informal wage (given that the probability of detection
is practically nil), but is upward-sloping because firms with more capital employ
more workers, and as the number of workers in the firm increases, firms optimal-
ly chooses to employ a larger proportion of formal than informal workers given
increasing probabilities of detection. Note that for firms with more than 50 work-
ers the line flattens as the average cost of salaried labor converges to the cost of
formal labor, θ τ+ −w [1 (1 ) ]fCSI , at which point expected average labor costs are
basically constant, with firms hiring all their salaried workers formally.
These lines illustrate sharply two distortions in the labor market creat-
ed by the CSI+NCSI duality. The first is the large difference between the cost of
nonsalaried and salaried labor. Indeed, the estimated difference between wi and
θ τ+ −w [1 (1 ) ]fCSI is 24 percent, a result that helps explain the large share of to-
tal employment accounted for by self-employed workers and family firms shown
in Table 2. The second is that the average costs of salaried labor increase steep-
ly as firms become larger and hire more workers. This is particularly the case for
firms hiring up to around ten workers, and is a graphic depiction of the implicit
tax on firm size that occurs in a context of evasion and imperfect tax enforcement.
This result is consistent with the large number of firms with fewer than ten work-
ers shown in Table 1; see also the discussion of Table 5.
15 In particular, for each firm we solve the maximization problem in equation (7) given the for-mal and informal wage rates observed under CSI+NCSI, assuming the same probability of de-tection function λ2
CSI (..) used in all our calculations. For each firm we obtain the optimal com-bination of legally and illegally hired salaried labor given by equations (8) and (9), and com-pute the average cost of labor for the firm’s optimal level of employment.
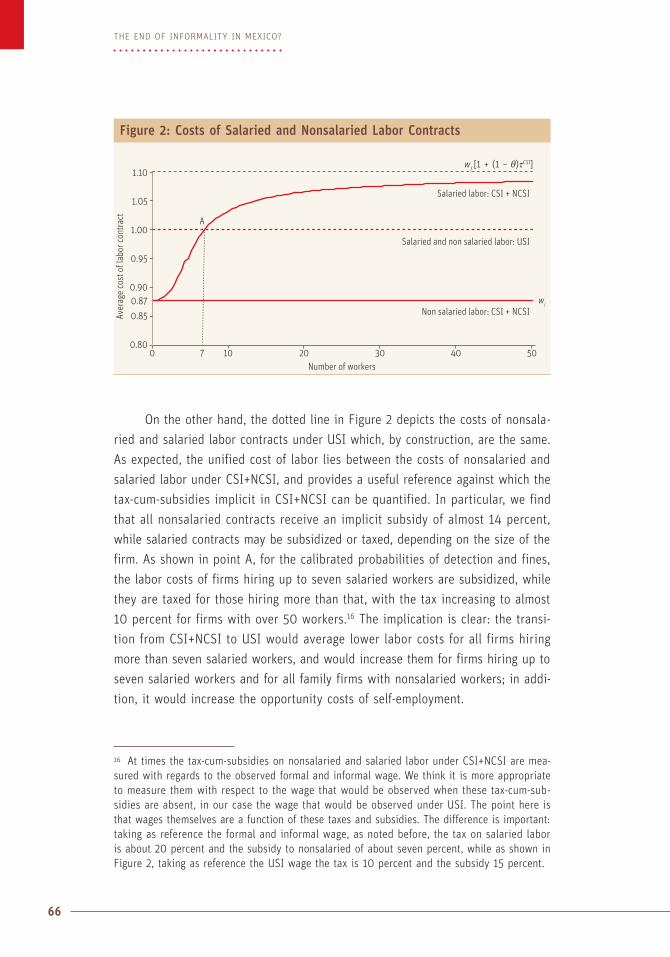
66
The end of informaliTy in mexico?
On the other hand, the dotted line in Figure 2 depicts the costs of nonsala-
ried and salaried labor contracts under USI which, by construction, are the same.
As expected, the unified cost of labor lies between the costs of nonsalaried and
salaried labor under CSI+NCSI, and provides a useful reference against which the
tax-cum-subsidies implicit in CSI+NCSI can be quantified. In particular, we find
that all nonsalaried contracts receive an implicit subsidy of almost 14 percent,
while salaried contracts may be subsidized or taxed, depending on the size of the
firm. As shown in point A, for the calibrated probabilities of detection and fines,
the labor costs of firms hiring up to seven salaried workers are subsidized, while
they are taxed for those hiring more than that, with the tax increasing to almost
10 percent for firms with over 50 workers.16 The implication is clear: the transi-
tion from CSI+NCSI to USI would average lower labor costs for all firms hiring
more than seven salaried workers, and would increase them for firms hiring up to
seven salaried workers and for all family firms with nonsalaried workers; in addi-
tion, it would increase the opportunity costs of self-employment.
16 At times the tax-cum-subsidies on nonsalaried and salaried labor under CSI+NCSI are mea-sured with regards to the observed formal and informal wage. We think it is more appropriate to measure them with respect to the wage that would be observed when these tax-cum-sub-sidies are absent, in our case the wage that would be observed under USI. The point here is that wages themselves are a function of these taxes and subsidies. The difference is important: taking as reference the formal and informal wage, as noted before, the tax on salaried labor is about 20 percent and the subsidy to nonsalaried of about seven percent, while as shown in Figure 2, taking as reference the USI wage the tax is 10 percent and the subsidy 15 percent.
Figure 2: Costs of Salaried and Nonsalaried Labor ContractsAv
erag
e co
st o
f lab
or co
ntra
ct
Number of workers
Non salaried labor: CSI + NCSI
Salaried and non salaried labor: USI
Salaried labor: CSI + NCSI
1.10
1.05
1.00
0.95
0.90
0.850.87
0.800 7 10 20 30 40 50
wi
A
wf [1 + (1 – θ)τCSI]
his section extends our proposal to cover risks that are specific to salaried
status and to allow for pensions that are proportional to workers’ wages.
8.1 A Second Pillar for Pensions
We begin with retirement pensions. In a context where there are wage differences
across workers (due to skill differences, for example), our proposal so far implies
that workers who earn less than twice the minimum wage would save a higher
share of their earnings than what workers in that earnings range save under CSI
(since under USI all workers receive a contribution to their individual retirement
account equal to that received by a worker earning twice the minimum wage);
workers earning twice the minimum wage would save the same share as under
CSI; and workers earning more than twice the minimum wage would save a lower
share. Therefore, retirement pensions would also be the same, implying declining
replacement rates as earnings increase. However, some arguments suggest that
retirement pensions should also help workers smooth consumption between their
active time and their time as retirees. To achieve constant replacement rates, con-
tributions need to be set as a share of individual worker’s earnings and not as
the same amount for all workers.
We add consumption smoothing to our proposal through a two-pillar retire-
ment pensions system. The first pillar consists of a fixed contribution to workers’
individual retirement accounts regardless of their wages as described in the pre-
vious section. The second pillar consists of a variable contribution to the same
accounts, which depends on worker’s wages. We elaborate on this proposal imme-
diately below but point out a critical limitation up-front. Savings for the second
pillar would occur only when workers are in salaried employment, because only
Complementary Social Insurance for Salaried Workers
CHAPTER 8
T

68
The end of informaliTy in mexico?
then could their wages be observed and taxed “at the door of the factory”, in the
same way CSI taxes currently operate. For the reasons discussed earlier in this
paper, self-employed workers and workers in family firms could not be taxed for
the second pillar, and the government would be unable to smooth their consump-
tion through time.1
We set the contribution rate for the second pillar as a function of salaried
workers’ wages after considering the fixed contribution corresponding to the first
pillar. In particular, we set it such that contributions from both pillars add up to
the total contribution made under CSI (including the government subsidy). The re-
sult is a variable rate, τsjCB (wsj), obtained from the difference between the amount
contributed for retirement pensions under CSI for each wage level j (j = 1, 2, .., J)
and the amount corresponding to a worker earning twice the minimum wage, ex-
pressed as a share of the wage (where the superscript CB denotes complementary
SI benefits and wsj denotes the wage of salaried workers in wage level j). By con-
struction, this complementary contribution would only be positive for workers
earning more than twice the minimum wage, and would be increasing in wage lev-
els expressed both as a share of the wage and in absolute terms (since twice the
minimum wage represents a decreasing proportion of earnings as wages increase).2
The same procedure can be repeated for life and disability pensions. In
this case, τsjCB is reinterpreted as the complementary contribution rate for both
retirement, and life and disability pensions, and is calculated as described
above. The only difference is that revenues for life and disability pensions are
deposited in the IMSS-managed common reserve fund for risk pooling purpos-
es, while revenues for retirement pensions are deposited in workers’ individual
retirement accounts.
Consider, finally, risks that are specific to salaried workers: in particular,
accidents suffered in the work-place because the firm fails to comply with safety
standards. These risks are covered through work-risk insurance, and two points
1 The government could induce nonsalaried workers to save more for their retirement with matching contributions or incentives through the income tax law. But these savings would be voluntary, in contrast to the forced savings imposed on salaried workers.2 Since the second pillar is fully funded from ear-marked wage-based taxes, there are no im-plications for the government’s fiscal balance. In equation (28) one would just add on both the revenue and the expenditure side the term
∑τ=
w w L( )sjCB
sj sj sjj
J
1
which measures the contributions made to the retirement pensions of salaried workers under the second pillar.
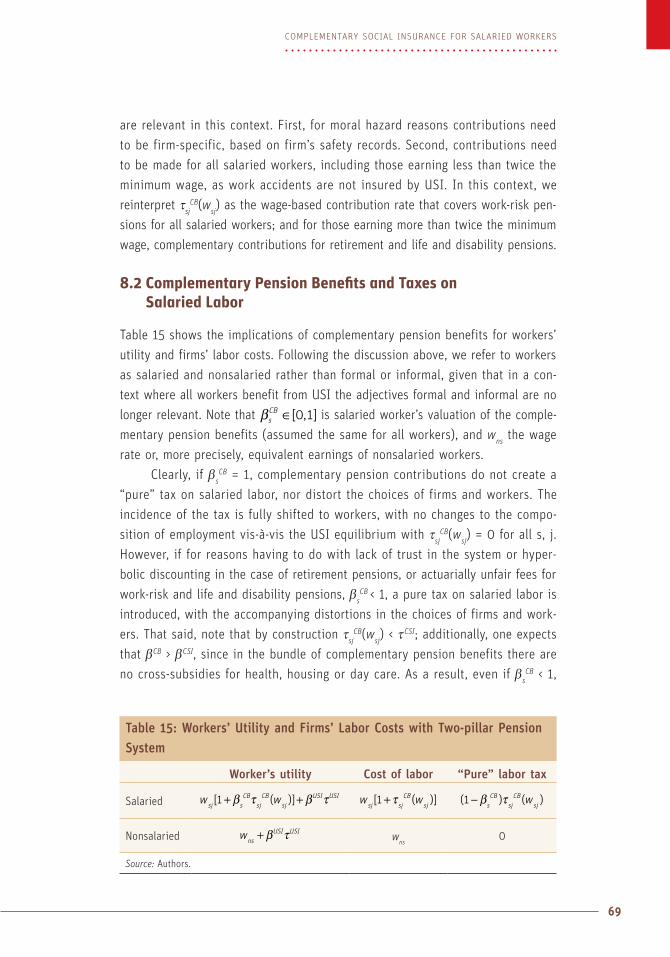
69
COMPLEMENTARY SOCIAL INSURANCE FOR SALARIED WORKERS
are relevant in this context. First, for moral hazard reasons contributions need
to be firm-specific, based on firm’s safety records. Second, contributions need
to be made for all salaried workers, including those earning less than twice the
minimum wage, as work accidents are not insured by USI. In this context, we
reinterpret τsjCB(wsj) as the wage-based contribution rate that covers work-risk pen-
sions for all salaried workers; and for those earning more than twice the minimum
wage, complementary contributions for retirement and life and disability pensions.
8.2 Complementary Pension Benefits and Taxes on Salaried Labor
Table 15 shows the implications of complementary pension benefits for workers’
utility and firms’ labor costs. Following the discussion above, we refer to workers
as salaried and nonsalaried rather than formal or informal, given that in a con-
text where all workers benefit from USI the adjectives formal and informal are no
longer relevant. Note that [0,1]sCBβ ∈ is salaried worker’s valuation of the comple-
mentary pension benefits (assumed the same for all workers), and wns the wage
rate or, more precisely, equivalent earnings of nonsalaried workers.
Clearly, if βsCB = 1, complementary pension contributions do not create a
“pure” tax on salaried labor, nor distort the choices of firms and workers. The
incidence of the tax is fully shifted to workers, with no changes to the compo-
sition of employment vis-à-vis the USI equilibrium with τsjCB(wsj) = 0 for all s, j.
However, if for reasons having to do with lack of trust in the system or hyper-
bolic discounting in the case of retirement pensions, or actuarially unfair fees for
work-risk and life and disability pensions, βsCB < 1, a pure tax on salaried labor is
introduced, with the accompanying distortions in the choices of firms and work-
ers. That said, note that by construction τsjCB(wsj) < τ
CSI; additionally, one expects
that βCB > βCSI, since in the bundle of complementary pension benefits there are
no cross-subsidies for health, housing or day care. As a result, even if βsCB < 1,
Table 15: Workers’ Utility and Firms’ Labor Costs with Two-pillar Pension System
Worker’s utility Cost of labor “Pure” labor tax
Salaried w wsj s
CBsj
CBsj
USI USI[ ( )]1 + +β τ β τ w wsj sj
CBsj
[ ( )]1 + τ ( ) ( )1 − β τsCB
sjCB
sjw
Nonsalaried wns
USI USI+ β τ wns0
Source: Authors.
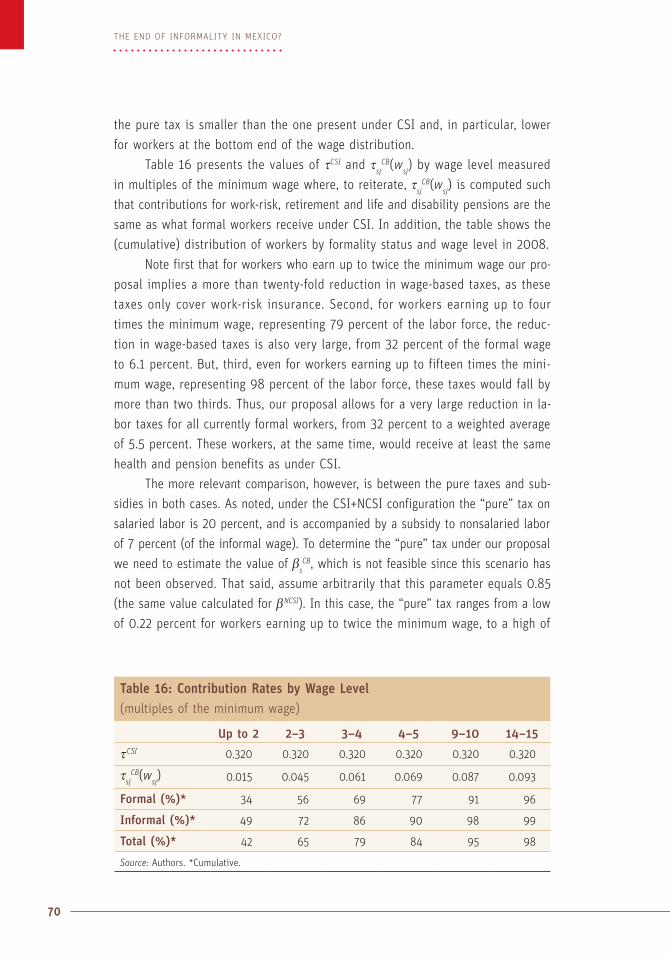
70
The end of informaliTy in mexico?
the pure tax is smaller than the one present under CSI and, in particular, lower
for workers at the bottom end of the wage distribution.
Table 16 presents the values of τCSI and τsjCB(wsj) by wage level measured
in multiples of the minimum wage where, to reiterate, τsjCB(wsj) is computed such
that contributions for work-risk, retirement and life and disability pensions are the
same as what formal workers receive under CSI. In addition, the table shows the
(cumulative) distribution of workers by formality status and wage level in 2008.
Note first that for workers who earn up to twice the minimum wage our pro-
posal implies a more than twenty-fold reduction in wage-based taxes, as these
taxes only cover work-risk insurance. Second, for workers earning up to four
times the minimum wage, representing 79 percent of the labor force, the reduc-
tion in wage-based taxes is also very large, from 32 percent of the formal wage
to 6.1 percent. But, third, even for workers earning up to fifteen times the mini-
mum wage, representing 98 percent of the labor force, these taxes would fall by
more than two thirds. Thus, our proposal allows for a very large reduction in la-
bor taxes for all currently formal workers, from 32 percent to a weighted average
of 5.5 percent. These workers, at the same time, would receive at least the same
health and pension benefits as under CSI.
The more relevant comparison, however, is between the pure taxes and sub-
sidies in both cases. As noted, under the CSI+NCSI configuration the “pure” tax on
salaried labor is 20 percent, and is accompanied by a subsidy to nonsalaried labor
of 7 percent (of the informal wage). To determine the “pure” tax under our proposal
we need to estimate the value of βsCB, which is not feasible since this scenario has
not been observed. That said, assume arbitrarily that this parameter equals 0.85
(the same value calculated for βNCSI). In this case, the “pure” tax ranges from a low
of 0.22 percent for workers earning up to twice the minimum wage, to a high of
Table 16: Contribution Rates by Wage Level(multiples of the minimum wage)
Up to 2 2–3 3–4 4–5 9–10 14–15
τCSI 0.320 0.320 0.320 0.320 0.320 0.320
τsjCB(wsj) 0.015 0.045 0.061 0.069 0.087 0.093
Formal (%)* 34 56 69 77 91 96
Informal (%)* 49 72 86 90 98 99
Total (%)* 42 65 79 84 95 98
Source: Authors. *Cumulative.
71
COMPLEMENTARY SOCIAL INSURANCE FOR SALARIED WORKERS
1.4 percent for workers earning fifteen times the minimum wage; even if βsCB = 0.5,
these taxes would range from 0.75 percent to 4.6 percent. In addition, there would
be no subsidy to nonsalaried labor. Put differently, even when complementary pen-
sion benefits for salaried workers paid through a Bismarckian wage-based tax are
incorporated into our proposal, there is still a drastic change in the tax-cum-subsi-
dies on salaried and nonsalaried labor vis-à-vis the CSI+NCSI configuration.3
Table 16 is also of considerable importance from a macroeconomic point of
view. In our model, all goods are traded and we cannot properly speak of a real ex-
change rate. That said, we can compute the ratio of an index of good prices to an
index of the costs of salaried labor (wages plus SI benefits), which could be thought
of as a proxy measure of the real exchange rate. This ratio changes from 1.00 under
the CSI+NCSI configuration, to 1.09 under USI. This would be a measure of the—so-
to-speak—real depreciation implied by our proposal, interpreted here as a reduction
in the price that firms pay for labor in terms of the exogenously given goods prices.
In parallel, note that the VAT increase has a different impact on export vs. imports,
as only the former are VAT-exempt. As a result, the relative price of exports in term
of imports would decrease, mimicking the result obtained in traditional trade mod-
els by combining a tax on imports and a subsidy to exports.4
8.3 Complementary Pension Benefits and Savings
Table 16 also has substantive implications for individual worker’s retirement pen-
sions, and for the level of aggregate savings associated with SI. On one hand,
individual workers would enjoy higher retirement pensions vis-à-vis CSI because
they would accumulate for their pensions throughout their working lives. When
employed as salaried workers, they would accumulate in their individual accounts
the same amount as under CSI (although the expectation is that average time in
3 An extension of our model to incorporate skill and wage differences and capture how τsjCB(wsj)
impacts firms’ decisions to evade these contributions and the VAT is left for further research. As noted, the weighted average of τsj
CB(wsj) is 5.5 percent. Incorporating this value into our mod-el assuming that βs
CB = 0.85 yields VAT revenues that are just 1 percent lower than in the USI equilibrium without complementary contributions, so a preliminary result is that the distortions introduced by these complementary contributions are fairly small (the average “pure” tax on salaried labor is 0.8 percent vis-a-vis 20.0 percent under CSI). 4 These results are related to the literature on “fiscal devaluations”, recently relevant in the context of attempts by some member countries of the euro currency union to regain compet-itiveness by lowering labor costs by shifting SI taxation from labor to consumption, given the impossibility of a nominal exchange rate devaluation; see Feldstein and Krugman (1990), Farhi, Gopinath and Itskhoki (2011) and IMF (2011).

72
The end of informaliTy in mexico?
salaried employment would increase). In addition, when employed in nonsalaried
positions they would still accumulate through the first pillar. Put differently, con-
tribution densities would be in principle 100 percent (vs. 45 percent under CSI),
with at least the same amount of contributions as under CSI. Replacement rates
would thus be unambiguously higher.5
On the other hand, Table 17 shows that the aggregate annual flow of sav-
ings for retirement under our proposal is higher than under CSI, for two reasons.
The first one is an increase in the number of salaried workers under USI vs. for-
mal workers under CSI (see Table 12). The second is due to the contributions made
for nonsalaried workers under USI. The result is an increase in savings for retire-
ment of 166 percent, or almost an additional 1 percent of GDP.6 Of course, forced
savings for retirement could be offset by lower voluntary savings. But unless this
offset occurs on a one-to-one basis, there would be a net increase in aggregate do-
mestic savings.7 In turn, these additional savings could strengthen investment by
firms since these savings would be long term resources deposited in the Afores.
5 Incentives to firms to underreport salaried workers wages would also be lower, as wage-based taxes fall from 32 percent of the wage to an average of 5.5 percent. This would also augment resources accumulated for pensions.6 Over the medium term the proposal would also considerably deepen the market for annuities and resources channeled to private insurance firms, as all 39 million workers would purchase an annuity upon retirement, as opposed to 12.3 million formal workers under CSI. Similar ob-servations hold for annuities derived from life, disability and work-risk pensions.7 Aguila (2011) studied the impact of Mexico’s 1997 pension reform and found that only about 32 percent of forced savings in the new defined contribution system through individual retire-ment accounts was offset by reduced individual savings.
Table 17: Aggregate Annual Flow of Savings for Retirement(thousands of million of pesos)
CSI USI
Salaried workers
From wage-based contributions 54.9 56.6*
From government contributions 17.5 89.4
Nonsalaried workers
From wage-based contributions 0 0
From government contributions 0 46.8
Total 72.4 192.8
Source: Authors.*Assuming the same wage distribution for all salaried workers under USI as the one observed under CSI.
73
COMPLEMENTARY SOCIAL INSURANCE FOR SALARIED WORKERS
8.4 Unemployment Insurance as Part of USI?
We finish this section with a remark on risks faced by salaried workers as a re-
sult of negative output shocks. Mexico has no unemployment insurance. Rather,
salaried workers are covered against this risk through severance pay and related
regulations on firing. As discussed by Heckman and Pagés (2004), these regula-
tions represent a contingent cost to formal hiring that needs to be added to the
explicit costs of CSI. Indeed, the fact that these regulations do not generate a
counterpart monetary flow recorded as revenue somewhere (like health insurance
or retirement pensions), should not detract from the more important fact that they
increase the expected costs of salaried labor, affecting firms’ hiring decisions in
much the same fashion that explicitly legislated CSI taxes do. It should also not
detract from the fact that severance pay is an integral component of Mexico’s SI
architecture.
The evidence for Mexico suggests that severance pay is an ineffective mech-
anism to protect salaried workers against the loss of employment (Kaplan and
Sadka 2008; Kaplan, Silva-Méndez and Sadka (2008); Calderon, 2010). In this
context, our proposal facilitates a reform of severance pay that would protect
workers more effectively through unemployment insurance, for three reasons.
First, under the USI architecture, contributions for unemployment insurance can
be added to τsjCB(wsj) as another complementary SI benefit for salaried workers,
and thus be paid by firms on a flow basis, perhaps through deposits in workers
individual accounts, ensuring better protection for them.8 Second, under our pro-
posal, even if workers lose their salaried job, they are still covered by health, life
and disability insurance and, at least for some period, continue to receive con-
tributions for their retirement pensions (through the first pillar). Third, salaried
employment would be higher than formal employment under the CSI+NCSI con-
figuration, implying that more workers would be protected against these risks
(see Table 12). Substituting severance pay, partly or wholly, with unemployment
insurance in the context of USI is an important area of future research, with po-
tentially large policy implications.
8 Firms in Mexico are not legally required to set aside reserves for severance payments. This creates difficulties for workers, as firms must make large lump-sum payments to workers pre-cisely when they are facing negative output shocks and may be cash- or credit-constrained. The result is an incentive for firms to either litigate severance payments in labor courts when they have to fire workers or, in the case of smaller firms, to declare bankruptcy. In any event, the implication is that workers fail to receive income support precisely when they need it most.


9.1 The VAT, Poverty and Inequality
Perhaps the central argument against a VAT reform in Mexico, particularly one fo-
cused on raising the rate on food and medicine, is associated with its regressive
effects on poor households. In our proposal this effect is in principle more than
offset by the increase in the real wage resulting from lower CSI taxes (or, put dif-
ferently, from a lower “VAT” at the door of the factory). Nevertheless, in a more
realistic context where household composition differs, or where some households
have only elderly members, the VAT increase could negatively impact the poor.
To insure this is not the case, our proposal includes compensating them with di-
rect income transfers to fully offset the effects of the VAT increase, ignoring the
benefits of a higher real wage. To do so, we calculate the additional VAT paid by
households in the first two deciles of the income distribution, which we assume
to be the population living under conditions of extreme poverty, offset these extra
taxes by direct income transfers (carried out perhaps through a targeted program
like Progresa-Oportunidades), and add the costs of these compensations to the
fiscal costs of our proposal.
Data from Mexico’s 2008 income-expenditure survey indicates that house-
holds in the first two deciles of the income distribution account for 6.9 percent of
total consumption. Our proposed VAT reform, on the other hand, extracts an addi-
tional 416.4 thousand million pesos from all households, of which 28.8 thousand
million pesos correspond to poor households (this is the amount added to the fis-
cal costs of the proposal in the last column of Table 12). Setting compensations at
this level, our proposal would have an unambiguously positive effect on the poor:
Some Implications of USI for Poverty and Inequality, and for Productivity
CHAPTER 9
76
The end of informaliTy in mexico?
they would pay no additional net taxes; receive the same SI benefits as other
households (including making effective the minimum pension guarantee); earn a
higher real wage; and benefit from the largest reduction in CSI taxes, as these tax-
es are practically eliminated at the bottom of the wage distribution (see Table 16).
There are three additional positive effects on poverty. The first is associat-
ed with the incentive structure faced by poor workers in the labor market. Levy
(2008) argues that because some NCSI programs are targeted to the poor, on one
hand, and because the poor tend to place a lower value on the benefits of CSI
programs than the non-poor, on the other, the tax on formality and the subsidy to
informality are higher for them than for non-poor workers. As a result, poor work-
ers are over-represented among informal workers: they are 24 percent of the labor
force but account for 36 percent of informal employment (Levy, 2008). Because
the marginal product of labor in informal employment is below that of formal em-
ployment, this implies that the CSI+NCSI configuration induces poor workers into
lower productivity jobs. In this context, USI would improve the conditions under
which poor workers participate in the labor market, removing impediments result-
ing from current SI policy to their finding higher productivity jobs.
Second, our proposal would align the incentives of Progresa-Oportunidades
with the incentives generated by SI policy. At present, the investments in the hu-
man capital of poor youngsters made by Progresa-Oportunidades are unlikely to
yield the expected returns because when these youngsters enter the labor market
they are, in the CSI+NCSI configuration, induced into informal jobs. Our proposal
would help increase the value of these investments, and through a better func-
tioning labor market, raise the expected returns to education. In parallel, poverty
policy could achieve a better pairing of instruments and objectives: USI would fo-
cus on protecting poor workers against risks, while Progresa-Oportunidades could
focus exclusively on investments in the human capital of the poor (eliminating the
use of this program to respond to shocks that should be covered by SI).1
The third effect has to do with vulnerability to negative shocks of non-
poor Mexican households who have incomes just slightly over the poverty line.
López-Calva and Ortiz-Juárez (2011a) show that uninsured shocks are a cause of
downward mobility and high entry rates into poverty when these households ex-
perience negative systemic events like bad weather and natural disasters, but also
idiosyncratic shocks like illness, disability and death. If these households could
1 Our proposal thus implies that Progresa-Oportunidades would continue as a targeted pover-ty alleviation program, in parallel to USI.

77
SOME IMPLICATIONS OF USI FOR POVERTY AND INEQUALITY, AND FOR PRODUCTIVITY
better insure these latter shocks—as they would under our proposal—their negative
impact would be lessened or eliminated, resulting in reduced downward mobility
and, overtime, a lower aggregate poverty rate.2
USI would also reduce inequality. Table 18 presents the results of a simple
exercise where we distribute the additional burden of the VAT under our propos-
al over all households in proportion to their share in total consumption. The table
shows also direct compensations (only to the poor), and the change in subsidies
for SI between CSI+NCSI and USI assuming benefits are distributed uniformly
across income deciles. Though oversimplified, the table serves to make two points.
First, our proposal would have a strong redistributive effect: all households up to
the first six deciles of the distribution would benefit, while most of the net bur-
den would be paid by households in the highest two deciles. The reason is simple:
in a context like Mexico’s, with high inequality in the distribution of income and
consumption, in absolute terms the VAT extracts substantially more resources from
higher-income households than from lower-income ones.3 If those resources are
evenly distributed to provide the same SI benefits to all regardless of income lev-
el, it is not surprising that the net result is reduced inequality.
2 Further, using longitudinal data for 2002–05, López-Calva and Ortiz-Juárez (2011b) calculate the probability that a non-poor unskilled urban informal worker in Mexico with primary edu-cation and access to insurance has of falling into poverty, and compare that probability to the one that would obtain if that worker lost access to insurance, or the one that would obtain if he kept access to insurance and in addition had three more years of education. Interestingly, they find that the effect of having insurance is quantitatively larger than acquiring more edu-cation to prevent workers from falling into poverty, highlighting the importance of extending the coverage of insurance to the near-poor.3 This is why regardless of considerations about social insurance, exemptions to the VAT are a very inefficient instrument to redistribute income in Mexico. See Davila and Levy (2003).
Table 18: Distribution of VAT Burden and SI Benefits by Income Deciles(thousands of million of pesos)
I–II III–IV V–VI VII–VIII IX–X
Additional VAT (–) 28.8 (–) 47.84 (–) 64.06 (–) 87.76 (–) 187.2
Compensations to the poor
(+) 28.8 0 0 0 0
Net gain in SI benefits
(+) 66.4 (+) 66.4 (+) 66.4 (+) 66.4 (+) 66.4
Net impact (+) 66.4 (+) 18.56 (+) 2.3 (–) 21.36 (–) 120.8
Source: Authors.

78
The end of informaliTy in mexico?
The second point is related to the redistributive motivation of Bismarckian
SI. Assume for a moment that all households in Mexico had the same income.
Then our proposal would just change the composition of all households’ consump-
tion equally, reducing their disposable income as a result of the higher VAT by the
same amount, and giving them in return the same bundle of SI benefits contained
in τUSI. This would achieve the government’s aim that all households be protected
against risks, but without any redistribution of income between them. In principle,
even in a society characterized by perfect equality in the distribution of income,
SI is still desirable to correct for market failures, aggregate risks, and so on. This
exercise makes clear that the income redistribution that in Mexico’s case would
be achieved under USI is a byproduct of the underlying inequality in the distri-
bution of income and consumption, rather than the express objective of SI. The
point here is that in general one cannot expect one instrument, SI, to achieve two
objectives at the same time: to change the composition of all workers’ consump-
tion and to redistribute income from high-income to low-income households. That
said, the redistribution that would occur in Mexico under USI would of course be
welcome but, more importantly, substantially more effective than the one that is
tepidly being achieved today, if at all, under Bismarckian SI.4
9.2 Labor Market Distortions, USI and Productivity
Lagging productivity is the main reason why Mexico’s growth performance has
been lackluster over the last few decades.5 Many factors account for this, and it
is difficult to disentangle the relative weights of each. However, evidence suggests
that misallocation of capital and labor resulting from distorted factor and output
prices is a significant source of total factor productivity losses (Hsieh and Klenow,
2009b; IDB, 2010). In turn, distortions in the price of labor derive from Mexico’s
dual SI architecture, as in the CSI+NCSI configuration this price varies by the type
of labor contract and firm size; see Table 5 and Figure 2. The results are large dif-
ferences in the marginal revenue product of labor across firms and sectors, which
misallocates factors and reduce productivity. Busso, Fazio and Levy (2012) classify
4 Of course, there would still be room for re-distribution through other taxes, in particular in-come taxes, and through other components of expenditure policy. 5 From 1960 to 2007 factor accumulation was faster in Mexico than the United States; if total factor productivity (TFP) had kept pace, relative income per capita would be 24 per cent high-er in 2007 than in 1960. However, the sharp fall in Mexico’s TFP relative to the United States since 1980 more than offset the gains from factor accumulation, with the result that in 2007 Mexico’s relative income per capita was 14 per cent lower. See Busso, Fazio and Levy (2012).

79
SOME IMPLICATIONS OF USI FOR POVERTY AND INEQUALITY, AND FOR PRODUCTIVITY
Mexican firms in the 2008 Economic Census by formality status, group them into
six-digit sectors, and estimate indices of total factor productivity for each firm.
They find that controlling for size and sectors, informal firms with nonsalaried
contractual relations are less productive than informal firms with illegal salaried
labor, which in turn are less productive than formal firms with legal salaried la-
bor. All in all, they find that formal firms produce about 35 percent more output
from the same amount of capital and labor than informal firms.6
Firm’s evasion strategies affect critical dimensions that impact productivi-
ty like size and legal status (with implications for firms’ access to credit from the
formal financial system, for investments in innovation or technology adoption,
and for links with suppliers of inputs); or the duration and type of labor contracts
(with implications for firm’s investments in labor training or on-the-job learning).
In general, an atmosphere of illegality and informality leads to inefficiently high
levels of self-employment and nonsalaried employment in family firms, excessive
labor turnover, a size distribution of firms skewed towards smallness, and a bias
toward sectors and activities where evasion of labor and CSI regulations can oc-
cur more easily.
Our proposal would have a positive effect on productivity by closing the
wedge between the price of salaried and nonsalaried labor; by removing the im-
plicit tax on firm size derived from SI policy; and by eliminating labor turnover
associated with firm’s evasion strategies. We speculate as well that a context of
more legality and reduced evasion could reduce uncertainty, improve firm’s ac-
cess to credit and expand their planning horizons, in turn facilitating more vertical
integration, fuller exploitation of economies of scale, and increased investments
in labor training, technology adoption and innovation. Quantifying these effects
exceeds the scope of this paper, but the suggestion is clear: USI can simultane-
ously be better social policy, better fiscal policy, and better policy for productivity
and growth.
6 Their exercise excludes self-employment and firms in non-fixed locations not captured in the Census which, as shown in Table 2, account for a large share of employment. Incorporating these activities in the measurements of the productivity losses associated with the CSI+NCSI configuration is a pending challenge.


This section discusses implementation issues, with emphasis on mecha-
nisms to identify the beneficiary population of USI and provide benefits.
Many other aspects are left out, as well as a discussion of transition is-
sues, which merit a separate paper. The discussion here is indicative and meant
to show the administrative feasibility of the proposal. We stress that there is no
unique implementation mechanism. Many factors that bear on implementation
design are neither budgetary nor technical but political (or philosophical), hav-
ing to do with the appropriate balance between the exercise of social rights and
the enforcement of obligations. Although inevitably technical and political issues
overlap, we do not dwell into that discussion and simply point out some of the
relevant trade-offs.
10.1 Registration and Reporting Requirements
We begin with a key aspect of our proposal. To receive the benefits of USI, work-
ers must be registered with Finance Ministry and have an individual retirement
account with the Afore of their choice. Under ideal circumstances there would be
a one-to-one mapping through a unique identification number between individu-
al workers, registries of workers in the Finance Ministry, registries of workers in
IMSS (including nonsalaried workers), and workers’ Afore accounts.
For the purposes of our proposal, a worker is a person who is either regis-
tered as such with the Finance Ministry by the firm that hires her or him (for the
case of salaried workers), or by herself or himself in case she or he is self-em-
ployed, works for a small family firm or is associated with a firm but receiving
payments in forms other than wages. In these latter cases, corresponding to non-
salaried contractual relations, the obligation to register would fall on the worker.
Implementation Issues
CHAPTER 10
82
The end of informaliTy in mexico?
All registered workers, in turn, must report their earnings. For salaried workers
this requirement, as at present, would be satisfied by the firms that hire them,
since firms already report their workers’ earnings to retain income taxes from
gross wages. Nonsalaried workers would have to report their income directly to
the Finance Ministry on a periodic basis, say quarterly.1
Importantly, the act of registration and reporting would be sufficient to qual-
ify for USI benefits; failure to pay income taxes would not disqualify workers. Our
proposal is not designed to solve the problems of compliance with the income tax
law. But it would help improve its enforcement as compared to the status quo it
enhances the incentives to register and report. On one hand, as discussed in sec-
tion 8, since firms hiring salaried workers would continue to pay wage taxes for
complementary SI benefits, the registries of IMSS could be used by the Finance
Ministry for enforcement of income taxes. In parallel, firms’ incentives to cheat
would be substantially reduced, as wage-based taxes fall from 32 percent of wag-
es to an average of 5.5 percent.
For nonsalaried workers, on the other hand, the situation is more complex
since the income tax law taxes income differently depending on its source. These
workers are already required to register but many decide not to. Our proposal
changes the cost-benefit of that decision in favor of registration, as tax obliga-
tions in principle do not change while there would be no or restricted access to
SI benefits, depending on the choices described below.2
The fact that more workers than at present would register and report earn-
ings to the Finance Ministry is a positive side effect of our proposal, generating
valuable information for tax enforcement (and for the design of public policies in
general). It would be a step in the direction of reducing illegality and promoting
1 Of course, workers who register could under-report earnings. But this problem is already pres-ent today and matters from the point of view of income tax collections. Under-reporting of earn-ings is not a problem from the perspective of financing USI benefits since under our propos-al this occurs through the higher VAT on workers consumption (which presumably is a better proxy for their true earnings than those reported to the Finance Ministry). In practice, workers could register and cheat but still receive USI benefits, although if that behavior was recurrent it should sooner or later trigger an audit by the Finance Ministry.2 There would be transaction costs of registering (only once) and reporting (four times a year). But through the use of information technologies, these costs could be minimized. On the oth-er hand, Paullada (2012) argues that the income tax law taxes earnings from wages unequally relative to other sources of income. This important point suggests that incentives to arbitrage between salaried and nonsalaried status and change labor contracts would be much reduced if, in parallel to our proposal, the income tax law was revised in the direction of more neutral treatment between income of salaried and nonsalaried workers. Equally important would be a consolidation of the various regimes for nonsalaried workers.
83
IMPLEMENTATION ISSUES
compliance with the law. But, equally important at least in the view of some,
complying with an obligation in order to receive a benefit would balance work-
ers’ rights with responsibilities and reduce “free-riding” behavior.3
10.2 Pension Benefits
For salaried workers, pension benefits would operate as they currently do for for-
mal workers, except that wage-based contributions for retirement pensions, and
for life and disability insurance, would be reduced, with the concomitant increase
in contributions by the government, along the lines of the discussion in section 8
(though contributions for work-risk insurance would not change). Similar proce-
dures would operate for nonsalaried workers (excluding work-risk insurance). Upon
compliance of the registration and reporting requirement, the Finance Ministry
would transfer to IMSS the contributions for retirement pensions and life and dis-
ability insurance, in much the same way as it does today for formal workers. In
turn, IMSS would use the same mechanisms already in place to transfer the con-
tribution for retirement pensions to workers’ individual retirement accounts, and
deposit the contribution for life and disability insurance in the IMSS-managed
common reserve fund.4
Nevertheless, some nonsalaried workers might prefer not to register and
thus would avoid any reporting requirements. Those workers would in principle
be excluded from the pension benefits of USI, including the minimum pension
guarantee (and perhaps health benefits; see discussion below). But, critically, this
would result from a personal choice, triggered by distrust of government, procras-
tination, or other motivation or behavior. It would be an individual decision not
to exercise the right to receive a contribution for a pension, not a systematic ex-
clusion from that right because of the design of the SI system.5
3 There is an important precedent in that context in Mexico, associated with the right to vote. Before this right can be exercised, citizens need to register with the Federal Electoral Institute, the relevant authority for these purposes. Similarly, before the right to USI benefits can be ex-ercised, workers would need to register with the Finance Ministry.4 Informal workers would need to have an individual retirement account with the Afore of their choice. As a result of large transitions between formal and informal employment, many currently informal workers already have an account, given previous episodes of formality. In 2006 there were 37.4 million Afore accounts, for a total labor force of about 40 million workers (exclud-ing public sector workers); see Levy (2008). Some of these accounts are duplicative, but this is estimated to be in the order of 10 percent. The implication is that probably over two thirds of all workers already have an account.5 One could argue that poor workers in remote rural areas might have difficulties exercising their rights given the complexities for them of the registration and reporting requirements. At
84
The end of informaliTy in mexico?
The decision of workers to register and report is not independent of their
expectations of whether, when they reach old age, they would have access to any
other type of pension, without having registered at all and thus having not accu-
mulated for a USI retirement pension. The discussion so far has implied that all
NCSI benefits would be replaced by USI benefits. But an exception needs to be
made for the existing NCSI retirement pension, at least for some time. This is be-
cause even if our proposal was implemented immediately, low wage older workers
would have relatively little time to accumulate sufficient resources in their individ-
ual retirement accounts before they reach retirement age to purchase an annuity
that is at least as good as the existing NCSI pension, even if they register and
accumulate for a USI pension. Further, many already retired workers have no pen-
sion. As a result, for a transition period it would likely be necessary to continue
with some form of a NCSI pension (perhaps means-tested) and, indeed, even to
expand its coverage.6
This issue is complex and merits more analysis.7 Should NCSI pensions be
gradually phased-out, or should a “low” old-age means-tested pension paid on
a pay-as-you-go basis permanently co-exist with pensions financed from savings
present, however, these workers already receive the benefits of Progresa-Oportunidades, which imply that mechanisms exist to continuously up-date records to make the associated bimonth-ly cash payments. Registering households in remote rural areas, and monitoring indicators on their behavior, are problems that other institutions of the Mexican State have already solved. Moreover, poor workers would have strong incentives to register and report, as compliance would imply no tax payments (since their low earnings would exempt them from income tax-es) but better health and pension benefits, including the possibility of attaining the minimum pension guarantee. 6 The main NCSI pension program at the federal level is Adults over Seventy, although many state governments run similar programs. This program targets households by location, focusing on small rural communities, and pays a monthly pension of 500 pesos, or one third the min-imum CSI pension (1,500 pesos a month). But, as noted, at present most low wage workers will not receive the minimum CSI pension since they will not accumulate the 25 years in formal employment needed to qualify as a result of their high transition between formal and informal status; for them the NCSI pension is a better alternative. The same would hold for older low- wage workers under our proposal, but not for young workers for whom the USI pension would be significantly better (at least equal to 1,500 pesos a month but probably higher). Maintaining the Adults over Seventy Program for some time would have minor budgetary implications. On one hand, Table A2.2 shows that in 2008 the cost of this program was 9.5 thousand million pesos (or 0.07 percent of GDP), which would need to be added to the costs of our proposal as quantified in Table 12. On the other, Table 12 assumes that the contribution for the USI re-tirement pension is made for all workers, including those who are close to retirement, which would be unnecessary if the Adults over Seventy program is maintained for a transition period. 7 Galiani and Gertler (2009) is a step in this direction. They show that the introduction of the NCSI pension program “Adults over Seventy” led to lower participation rates in salaried employ-ment for older workers close to retirement age (through an “anticipation effect”).
85
IMPLEMENTATION ISSUES
accumulated in workers’ individual retirement accounts, given that under USI all workers are entitled to receive a contribution for their pension? The point is that
these two types of pension should be seen as part of the incentives faced by
workers, specially in a context where two potentially conflicting objectives need to
be met: on one hand, a major effort to induce all workers, particularly young ones,
to accumulate for their pensions through their individual retirement accounts; and,
on the other, the need to provide income support to avoid old-age poverty for
retired, or soon-to-be-retired workers. Can an inter-temporally consistent mecha-
nism be designed to provide income support to already retired workers without
a pension (and to informal workers close to retirement), while at the same time
inducing younger workers to accumulate for their pension in their individual re-
tirement account, thus avoiding moral hazard behavior?
10.3 Health Benefits
At present, the health benefits of CSI cover the worker and his family, and retired
workers with a CSI pension. Since under our proposal CSI health benefits extend
to all workers, retired workers without a CSI pension as well as household mem-
bers of currently informal workers would also be covered by the health component
of USI. In fact, the per worker cost of USI included in our previous calculations,
based as it is on the per worker cost of the health component of CSI, already con-
templates this. Thus, our funding proposal, for all intents and purposes, would
cover the entire population.8
Regardless of budgetary considerations, a difficult question is whether un-
registered workers should be excluded from the health benefits of USI. At present,
informal workers benefiting from NCSI health programs are not subject to any reg-
istration or reporting requirements, as opposed to formal workers who need to be
registered with IMSS and the Finance Ministry to receive CSI health benefits. USI
health benefits could then be conceptualized as either extending the NCSI modal-
ity, and therefore open to registered and unregistered workers; or extending the
CSI modality, and therefore denying access to unregistered workers. Under the
CSI modality, the incentives to register and report are substantially strengthened,
but there is an issue as to whether the government can credibly (and fairly) deny
health benefits for workers who do not register. Under the NCSI modality access
8 Recall, however, the public sector workers are excluded from our proposal, as they are cov-ered by their own social security institute.
86
The end of informaliTy in mexico?
to health is greatly facilitated, but the incentives to register and report weak-
ened as the only benefits of doing so are a retirement pension (in the future) or
a disability or survivorship pension (at some undetermined time). Our proposal
is compatible with either modality (or intermediate situations), and the choice re-
quires further discussion and debate.
Under any modality, the provision of health services would be carried out
by IMSS and state governments, as occurs at present under the CSI+NCSI config-
uration. All that is needed is the number of salaried and nonsalaried workers in
each state. On that basis, the Finance Ministry would provide the corresponding
per worker fee to IMSS and to each state government.9 Note that if the CSI modal-
ity is adopted the incentives for state governments to cooperate with the federal
government and have workers in their state register with the Finance Ministry are
stronger, as those registries would be the basis for resources transfers.
IMSS and state government would be responsible for providing services,
with the Health Ministry responsible for regulatory issues and for monitoring qual-
ity of provision; since all state government and IMSS receive the same resources
per worker, the expectation would be that quality should converge to the same
national level, gradually reducing existing regional differences. There would be
no changes to the ownership structure of public health infrastructure, but state
governments and IMSS would be given the freedom to write service contracts
between them to mutually complement their infrastructure, and as needed to sub-
contract activities or purchase inputs from private providers to improve quality.10
9 Because CSI health services already receive a subsidy from the federal government, the mech-anism for transferring resources from the Finance Ministry on a per worker basis is already in place. On the other hand, at present the Finance Ministry transfers resources for some health programs to the Health Ministry, which in turn transfers them to state governments. These re-sources are complemented by state resources. Other NCSI health programs, however, are direct-ly run by the federal government (including, confusingly, one by IMSS). The proposal thus re-quires unifying these budgetary mechanisms in a single one. This would ensure the same level of per worker financing as that provided to IMSS and also enhance transparency.10 There are large challenges in this context. A first one is to strengthen the incentives for state governments and for IMSS to deliver quality services and to minimize long-term costs by focus-ing on preventive care and on social behaviors that affect people’s health. A second one is set-ting incentives to IMSS and state governments to choose the efficient combination of in-house and out-source provisioning. Because per worker transfers to each would be established by law, both providers could write long-term contracts between themselves and coordinate investment decisions to ensure, on one hand, the availability of appropriate infrastructure in remote rural areas and, on the other, avoid duplication of equipment and infrastructure in larger urban ar-eas (as at times currently happens). A third challenge is to strengthen accountability and access to information. More generally, it is clear that our proposal focuses on the financing aspects of health, but that issues of provision require substantially more attention.
87
IMPLEMENTATION ISSUES
To conclude, the discussion in this section is not intended to assert that
implementing USI will be trouble-free, or that there are no difficult trade-offs be-
tween competing objectives. On the contrary, it will require important adjustments
to the functioning of various ministries and institutions, to budgetary relationships
between the federal and state governments, and to many laws. It will also require
a political discussion about the appropriate balance between the exercise of so-
cial rights and the enforcement of social obligations. After all, transiting from the
current CSI+NCSI configuration to USI would be a major social and institutional
change. Moreover, as implementation occurs unforeseen obstacles will be encoun-
tered; many adjustments will certainly have to be made. Thus, if the reform was
to be implemented, it would need—as any major reform would—careful evaluation
and error-correcting mechanisms; much will be learned along the way. That said,
the discussion does mean to argue a simple but central point: implementing USI
is feasible and within the reach of the administrative and operational capabili-
ties of the Mexican state.


The ideas of economists and political philosophers, both when they are right and when they are wrong, are more powerful than is commonly understood.
Indeed the world is ruled by little else. Practical men, who believe themselves to be quite exempt from any intellectual influences, are usually the slaves of some defunct economist…I am sure the power of vested interests is vastly exaggerated compared with the gradual encroachment of ideas. Not, indeed, immediately, but after a certain interval…. But soon or late, it is ideas, not vested interests, which are dangerous for good or evil”.
When President Avila Camacho signed Mexico’s first social security law in
1943, he was probably unaware that seven years earlier Keynes had concluded
The General Theory with the words quoted above. Back then he probably thought
that Bismarck’s idea to fund SI from wage-based taxes would allow him to reach
his goal of protecting all Mexican workers from various risks, to combat social ex-
clusion, and to redistribute income from “capital” to “labor”.
Were he alive today, he would most likely be intensely disappointed realiz-
ing that almost 70 years after his law came into effect, only one third of Mexican
workers were covered by its provisions (despite important revisions in 1973 and
1997). He would also probably be distressed if he realized that today Mexico’s SI
architecture, rather than strengthening social inclusion, is the root cause of the
segmentation of workers into formal and informal categories, with social rights
and obligations determined by the form of their labor contract. Certainly, creat-
ing first and second class workers was not his intention. Moreover, he would likely
be intensely concerned that this architecture generated large economic inefficien-
cies, as he was no doubt aware that sustained prosperity could not be built on
stagnant productivity. In parallel, although undoubtedly he would agree with the
social need to provide SI benefits to informal workers, and perhaps sympathize
Concluding Thoughts
CHAPTER 11
90
The end of informaliTy in mexico?
with the political pressures, he nonetheless would probably be very preoccupied
if he realized that the continuous growth of NCSI programs obscured the relation-
ship between contributions and benefits, gradually eroding the long-term fiscal
sustainability of Mexico’s SI policy, and in parallel was undermining the rule of
law. In sum, he would in all likelihood be strongly dissatisfied with the status quo, and would be eager for a new course.
We do not argue that Bismarck’s idea was flawed in 1890. Quite the con-
trary, back then it was novel, bold and, for Germany, effective. We do not argue
either that in 1943 President Avila Camacho was wrong to import Bismarck’s idea
to Mexico; in fact, at that time it was probably the best that could be achieved
given the prevailing knowledge and administrative capabilities of the Mexican
state. But every idea has a time and a place. With the benefit of hindsight, we
do argue that Bismarck’s idea has not served Mexico well. Every Mexican presi-
dent from Avila Camacho then to Calderon today has struggled with Bismarck’s
inheritance, attempting through various means to extend SI coverage to informal
workers. The result is the CSI+NCSI configuration: costly in terms of productivity,
fiscally unsound, and socially ineffective.
The idea that social insurance should be largely funded from a wage-based
tax is deeply ingrained in Mexico. This idea has generated a large body of le-
gal thought and jurisprudence; a long-standing conviction that, somehow, social
justice is achieved by taxing salaried labor; and some of Mexico’s key social in-
stitutions. In turn, vested interests have evolved and profited from this whole
construct. But, along with Keynes, we are convinced that “the power of vested in-terests is vastly exaggerated compared with the gradual encroachment of ideas”.
Without minimizing the political obstacles that vested interest represent, at this
point we are convinced that the encroachment of Bismarck’s idea is a central ob-
stacle to a more prosperous and equitable Mexico. But Bismarck’s idea is just
that, an idea; it is not a Law of Nature. Paraphrasing Keynes’s admonition about
practical men being prisoners of the ideas of some defunct economist, we posit
that in matters of social insurance the opposite may be true: economists are the
prisoners of the idea of a long defunct politician. Mexico needs to break away
from Bismarck’s idea. This paper shows that it is fiscally and administratively fea-
sible to do so, and that there would be large gains from doing so. Transforming
Mexico’s social insurance architecture will require political leadership as bold as
that displayed by President Avila Camacho back in 1943. But before that leader-
ship can be displayed again by another Mexican president, it is first necessary to
turn Bismarck on his head.

A.1 The Intermediate Goods Sector
Two intermediate goods Iz, indexed by z = 1,2, are produced by a large number of
firms that behave in a competitive fashion. Firms sell their output to producers of
final good A at the exogenous price pz. Goods are produced with a Cobb-Douglas
technology:
I A L Kz z z z1= α α− (A1.1)
where α satisfies 0 < α < 1. Physical capital KZ is fixed, so the representative firm
makes positive profits in equilibrium. KZ is continuous and distributed exogenous-
ly among firms with a density function ƒ(KZ). Capital endowment in the economy
is given by K and satisfies the resource constraint given by equation (2) in the
paper. Labor input is the sum of formally and informally hired workers following
equation (3) in the paper. If a firm hires a worker formally the unit cost is given
by equation (4). If the firm hires the worker informally it faces an endogenous
probability L K,zCSI
iz zλ ( ) of being detected by the authority and the expected unit
cost of labor is given by equation (5). This probability is given by the function:
L K K L, ˆzCSI
iz zCSI
z iz2λ λ( ) = υ (A1.2)
where CSIλ > 0 is a parameter, and υ > 0. Note that (A1.2) implies that the prob-
ability of detection is increasing in both arguments.
Firms pay income and value-added taxes and have incentives to evade. They
may be detected by the authority with a probability K K KzVAT
z zIT
z zλ λ λ( ) ( ) ( )= =
given by:
APPENDIX 1
Model Structure

92
The end of informaliTy in mexico?
K K Kˆ / ,z z zλ λ( ) = (A1.3)
where ˆ 1λ > is a parameter. This specification implies that relatively large firms
(that is, firms with a capital K K / ˆz z λ≥ ) face a probability of detection equal to
one. The effective VAT rate for each firm is defined by equation (6) in the text.
The firm rate of compliance with income taxes, K 0,1zIT
zξ ( ) [ ]∈ , is:
KK K K
K
min ˆ , ˆ
ˆzIT
z
IT ITzIT
z zIT
z
ITz
ξσ τ λ Π τ Π
τ Π{ }( ) ( ) ( ) ( )
( )= (A1.4)
Accordingly, the effective tax rates faced for a firm of size Kz are
KzVAT
zVAT
zτ ξ ( ) and KITzIT
zτ ξ ( ) .1
The problem of a representative firm in the intermediate goods sector is to
choose formal and informal labor, {Lfz, Liz}to maximize expected profits:
K K p A L KMax 1 1zIT
zIT
z zVAT
zVAT
z z z z z1τ ξ τ ξ{( ) ( )Π = − −
α α− (A1.5)
w L w L K L1 1 ,CSI
f fz i zCSI
iz z izθ τ φλ }( )( )− + − − +
subject to Lz(Kz) = Lfz(Kz) + Liz(Kz) given prices {pz, wf, wi} and taxes
, ,CSIzVAT ITτ τ τ{ } . From first-order conditions, the expressions for total labor de-
mand Lz(Kz) and informal labor Liz(Kz) are:
1 Expressions (6) and (A1.4) imply that there is a level of capital K z+ at which the rates of
compliance are one, that is K K 1z
VATz z
ITzξ ξ( ) ( )= =+ + .
Given the specification for λ(Kz), this condition implies
KK
ˆzz
VATσ λ=+
and KK
ˆzz
ITσ λ=+ .
For firms with a relatively large capital endowment K K( )z z≥ + , their rates of compliance are equal to one so their corresponding effective tax rates are z
VATτ and τ IT. These firms fully comply with VAT and income taxes even though they have incentives to evade their payment.

93
MODEL STRUCTURE
L KK A p
wK
1
1 1z zzVAT
zVAT
z z z
CSIf
z
1(1 )τ ξ α
θ τ( )( ) ( )
( )=
−+ −
α−
, K KKz z z∈ , and (A1.6)
L Kw w
K
1 1
3 ˆ1
iz z
CSIf i
CSIz
12θ τ
φλ( ) ( )
=+ − −
υ (A1.7)
Formal labor demand is given by the difference Lfz(Kz) = Lz(Kz)–Liz(Kz).2 These
functional forms imply that the share of formal workers in total workers increas-
es with capital size.
Expression (A1.6) indicates that the demand for salaried labor depends neg-
atively on the effective tax rate KzVAT
zVAT
zτ ξ ( ) and CSI taxes τCSI. This last result
has important implications for the tax base and government revenue: an increase
in τCSI lowers labor demand and thus value-added for a firm of capital size Kz. It
also decreases profits for firms with a relatively large capital size Kz, given the
high probability of being detected by the authority evading labor taxes. These two
effects erode the tax base for both value-added and income taxes. Given that for-
mal labor is now more costly than informal labor, informality increases.
The aggregate rate of compliance for the VAT is defined in equation (10) in
the text. For income taxes, let Kˆzc
z( )Π denote gross profits for a fully compliant
firm. The aggregate rate of compliance for income taxes in sector z, ˆ 0,1zITξ [ ]∈ , is:
K K f K dK
K f K dK
ˆˆ
ˆzIT
IT
K
K
zIT
z z z z
IT
K
K
zc
z z z
z
z
z
z
∫∫
ξτ ξ
τ
( ) ( ) ( )( ) ( )
=Π
Π (A1.8)
The aggregate rates ˆzVATξ and ˆ
zITξ are used to compute the rates of com-
pliance in the final good A sector and to determine “VAT included” prices of
intermediate goods in equation (11) in the text.
2 Notice from expressions (A1.6) and (A1.7) that Liz(Kz) > Lz(Kz) for relatively small values of Kz, implying a negative labor demand for formal workers. To avoid this scenario, define K z
− as the level of capital that uniquely solves L K L Kz z iz z( ) ( )=− − .
This implies that firms with a capital level K K,z z − will hire informal workers only, accord-
ing to (A1.6). In contrast, firms with a capital level
K K,z z( −
will demand a mix of formal and informal workers whose total amount is also given by (A1.6). In such a case, informal labor is determined by (A1.7) whereas formal labor is given by Lz(Kz)–Liz(Kz).

94
The end of informaliTy in mexico?
A.2 The Final Good A Sector
This sector is composed of a large number of representative firms that behave in
a competitive fashion. Firms use intermediate goods I1 and I2 in combination with
a fixed factor Am to produce A. The production function is Cobb-Douglas:
A I I I A, m1 21m
m( )= α α− (A1.9)
where 0 1mα< < . In turn, the function I I I,1 2( ) is CES:
I I I I I, 11 2 1 2
1
γ γ( ) ( ) ( )( )= + −
µ µ µ (A1.10)
with restrictions 1µ−∞ ≤ ≤ and 0 1γ≤ ≤ . The parameter represents the weight
of intermediate good I1 in the production of I. The elasticity of substitution be-
tween intermediate goods I1 and I2 is given by 1 / 1µ( )− .
Firms pay income and value-added taxes. The VAT rate in this sector
is a weighted average of the tax rates faced by intermediate goods firms, so 1 .A
VAT VAT VAT1 2τ γτ γ τ( )≡ + − . On the other hand, the income tax rate is the same
as in the intermediate goods sector. Final good A firms also have incentives to
evade taxes. Let AVATξ and A
ITξ be the respective rates of compliance, which are
given by the weighted average of the corresponding aggregate rates of compli-
ance in the intermediate goods sector. This implies ˆ 1 ˆAVAT VAT VAT
1 2ξ γξ γ ξ( )≡ + −
and ˆ (1 )ˆAIT IT IT
1 2ξ γξ γ ξ≡ + − . Accordingly, the tax rates effectively paid by firms
in the final good A sector are AVAT
AVATτ ξ and IT
AITτ ξ . Since value added taxes are
collected by the credit method, the firm receives a tax credit for the amount p Iˆ
zVAT
zVAT
z zτ ξ .
The problem of a representative firm is to choose intermediate goods
I I,1 2{ } to maximize expected profits:
p I I I AMax 1 1 ,AIT
AIT
AVAT
AVAT
A m1 21m
mτ ξ τ ξ{( ) ( ) ( )Π = − − α α− (A1.11)
p I1 ˆ
zVAT
zVAT
z zz∑ τ ξ }( )− −
taking prices p p p, , A1 2{ } , taxes , ,VAT VAT IT1 2τ τ τ{ } , and rates of compliance
ˆ , ˆzVAT
zIT
z 1,2ξ ξ{ }
=as given. From first-order conditions, the relative demand of in-
termediate goods is:
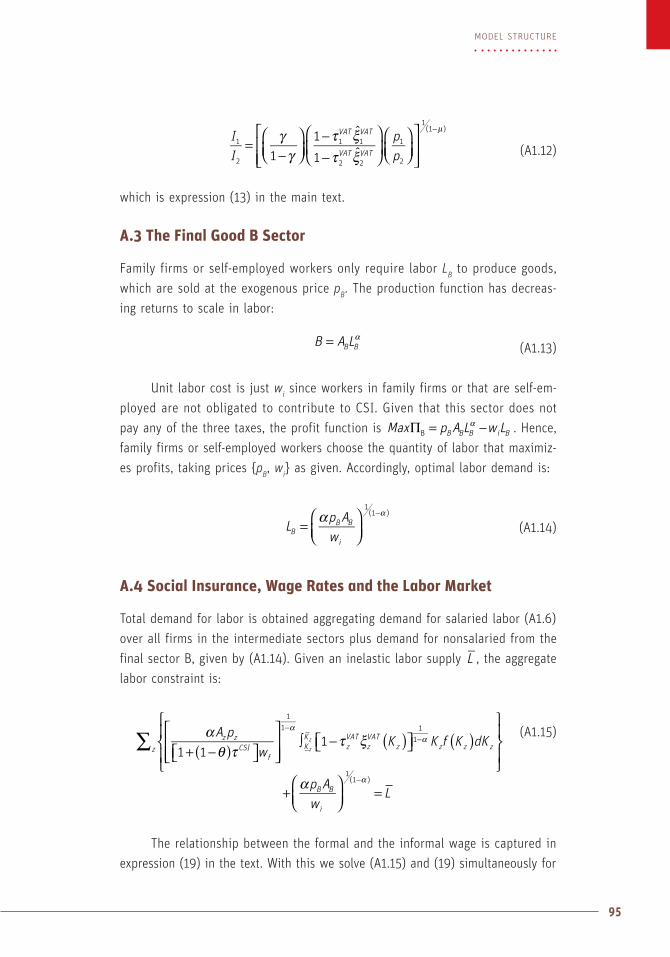
95
MODEL STRUCTURE
II
pp1
1 ˆ
1 ˆ
VAT VAT
VAT VAT
1
2
1 1
2 2
1
2
1(1 )γ
γτ ξτ ξ
=−
−−
µ−
(A1.12)
which is expression (13) in the main text.
A.3 The Final Good B Sector
Family firms or self-employed workers only require labor LB to produce goods,
which are sold at the exogenous price pB. The production function has decreas-
ing returns to scale in labor:
B A LB B= α (A1.13)
Unit labor cost is just wi since workers in family firms or that are self-em-
ployed are not obligated to contribute to CSI. Given that this sector does not
pay any of the three taxes, the profit function is Max p A L w LB B B i BBΠ = −α . Hence,
family firms or self-employed workers choose the quantity of labor that maximiz-
es profits, taking prices {pB, wi} as given. Accordingly, optimal labor demand is:
Lp AwB
B B
i
1(1 )α=
α−
(A1.14)
A.4 Social Insurance, Wage Rates and the Labor Market
Total demand for labor is obtained aggregating demand for salaried labor (A1.6)
over all firms in the intermediate sectors plus demand for nonsalaried from the
final sector B, given by (A1.14). Given an inelastic labor supply L , the aggregate
labor constraint is:
A pw
K K f K dK1 1
1z zCSI
fKK
zVAT
zVAT
z z z zz
11 1
1z
z∑ αθ τ
τ ξ ( ) ( )( )+ −
∫ −
αα
−−
(A1.15)
p Aw
LB B
i
1(1 )α+
=α−
The relationship between the formal and the informal wage is captured in
expression (19) in the text. With this we solve (A1.15) and (19) simultaneously for

96
The end of informaliTy in mexico?
equilibrium wages w w,f i* *{ }, given value-added, income, and CSI and NCSI tax-
es and subsidies.
A.5 The Government’s Budget Constraint
The government’s fiscal balance is:
FB R R R R G G GVAT IT CSI CSI NCSI( ) ( )= + + + − + + (A1.16)
Revenue from value-added taxes is collected from the intermediate and final
good A sectors, denoted respectively by RIVAT and RA
VAT , so that R R RVATIVAT
AVAT= + .
Aggregating over all firms and sectors producing intermediate goods, revenues are:
R A p K L K K f K dKIVAT
zVAT
z z KK
zVAT
z z z z z zz
1
z
z∑ τ ξ{ }( ) ( ) ( )= ∫ α α− (A1.17)
where demand for salaried labor L Kz z( ) is given by (A1.6). In the final good A
sector, VAT revenue is:
R I I I A p I, ˆAVAT
AVAT
AVAT
m AVAT
zVAT
z zz1 21m
m ∑τ ξ τ ξ( )= −α α− (A1.18)
where I(I1, I2) is defined by (A1.10). Notice that expression (A1.18) subtracts the
amount of tax credit p IˆAVAT
zVAT
z zτ ξ to each sector.
Consider now revenues from income taxes. As before, government col-
lects revenue from both intermediate and final good A sectors, denoted
respectively by RIIT and RA
IT . Hence R R RITIIT
AIT= + . Aggregating over all firms
and sectors, we get:
R K K f K dKˆIIT IT
zKK
zIT
z z z z zz
z∑τ ξ{ }( ) ( ) ( )= ∫ Π (A1.19)
In the final sector government revenue from income taxes is:
R I I I A1 1 ,AIT IT
AIT
AVAT
AVAT
m m1 21m
mτ ξ τ ξ α( )( ) ( )= − − α α− (A1.20)
CSI taxes paid by firms and formal workers are collected in the intermediate
goods sector only, as firms in the final good A sector do not require labor. Hence:
R w L K f K dK1 ,CSI CSIf K
Kfz z z zz
*
z
z∑θ τ { }( ) ( )( )= − ∫ − (A1.21)

97
MODEL STRUCTURE
where L Kfz z( ) is the demand for formal workers.
Total spending on CSI is split in two parts:
G w L K f K dK1CSI CSIf K
Kfz z z zz
*
z
z∑θ τ { }( ) ( )( )= − ∫ − (A1.22)
w L K f K dKCSIf
zKK
fz z z z*
z
z∑θτ { }( ) ( )+ ∫ −
Considering (A1.16) and (A1.21), it follows that only subsidies to CSI consti-
tute a net pressure on the fiscal balance.
Government spending on NCSI, GNCSI, is given by the subsidy τNCSI per worker
times the total number of informal workers. Aggregating over all firms and sec-
tors leads to:
G L K f K dKp Aw
NCSI NCSIKK
iz z z zNCSI B B
iz *
1(1 )
z
z∑τ τ α{ }( ) ( )= ∫ +
α−
(A1.23)
A.6 GDP and Prices
GDP is the sum of value added in each sector:
GDP p A L K K f K dKz z KK
z z z z zz
1
z
z∑ { }( ) ( )= ∫ α α− (A1.24)
p I I I A p I p I p A L,A m B B B1 21
1 1 2 2m
m{ }( )+ − − +α α α−
where the first term represents value added from intermediate sectors, and the
second and third terms represent value added in the final good A and B sectors,
respectively.
To compute the “VAT included” price of good A, consider the following cost
minimization problem for a representative consumer demanding intermediate
goods �I1 and �I2:
� �
� �p I p Imin 1 ˆ 1 ˆ
I I
VAT VAT VAT VAT
,1 1 1 1 2 2 2 2
1 2
τ ξ τ ξ( ) ( )+ + +
{ }
subject to � � �I I I11 2
1
γ γ( ) ( )( )+ −
=
µ µ µ. Recall that prices p1 and p2 are given
as the economy is small in world markets. Let �p p(1 ˆ )z zVAT
zVAT
zτ ξ≡ + denote the
“VAT included” price of intermediate good z. The demand functions arising from
the cost-minimization problem are:

98
The end of informaliTy in mexico?
��
�Ip
I11
11γκ=
µ−, and (A1.25)
��
�Ip
I(1 )
22
11γ κ= −
µ− (A1.26)
where γκ is the Lagrange multiplier. After substituting these two functions into
the expression for I, we obtain �pA in expression (20) in the text. Finally, let CA and CB denote consumption of the final goods A and B so that C C C/A A Bδ ( )≡ +
is the consumption share of the final good in total consumption. From this follows
the CPI given by expression (21) in the text.
A.7 Good B as Nontraded
Taking all goods as traded considerably facilitates the model, as demand for all
goods is simply the exogenously given world price; thus output and employment
levels are determined by the corresponding points in the respective supply curves.
The main implication of treating good B as nontraded is that its price would be
endogenously determined. To calculate it, we would need to track income levels
(from quasi-rents and wages) throughout the economy, introduce a demand sys-
tem for A and B, and then solve an additional excess demand equation for B that
would yield pB jointly with wages and employment levels. It is straightforward to
see that in this case changes in employment in the B sector resulting from chang-
es in VA or CSI+NCSI taxes and subsidies as the supply curve of B shifts would
be partly offset as pB changes in the opposite direction. However, with a down-
ward (upward) sloping demand (supply) curve for B, such price changes would
not revert the sign of the employment changes predicted by our model. The result
would be that the reductions in employment in the B sector associated with the
transit from CSI+NCSI to USI would be smaller. In turn, the expansion of the tax
base in the (I1, I
2, A) sector would be smaller as well, as would be the additional
revenues from the VAT reform. But as discussed in the text, the lower bound on
such estimates occurs when in fact the VAT rate increases while CSI+NCSI tax-
es and subsidies remain constant (since labor re-allocations flow in the direction
of higher informality in response to the higher average VAT). These lower bounds
have been presented in Tables 12 and 13. Given this, there is little gain by the
additional modeling required to make pB endogenous.

The reference year for all variables is 2008. Data on the government’s fiscal bal-
ance is taken from official fiscal accounts (Cuenta de la Hacienda Pública Federal); data on employment from the Economic Census of 2008 together with the National
Survey of Occupation and Employment (Encuesta Nacional de Ocupación y Empleo,
ENOE) and registries of IMSS. Sources for other data are specified below.
1. Employment
We use two sources of data for employment, depending on the purpose of analysis.
1.1 Table 2: Total Private Occupied Labor Force, 2008
To present a complete and consistent distribution of the total occupied labor force
by size and formality status we use the ENOE, given that the Census provides in-
formation on employment only on fixed establishments. The total occupied labor
force reported in the ENOE in the second quarter of 2008 is 43,866,696 workers.
To identify within this total the portion that is also captured in the Census, we
analyzed the characteristics of the workplace that individuals reported in ENOE
and compared them with the characteristics of the establishments captured by
the Census. For this exercise we identified activities at the three-digit level using
the ENOE and characteristics of the establishment (whether it was fixed or not).
After mapping these characteristics we obtained a very similar number of work-
ers in fixed, non-governmental urban establishments: 20,116,834 workers in the
Census, and 20, 254,726 in the ENOE. 1
APPENDIX 2
Data and Model Calibration
1 Table 2 reflects only 19,629 thousand workers because in this table the occupied population is classified by firm size, and the firm size variable in the ENOE was only defined for that pop-ulation. The remaining weighted observations have missing values.
100
The end of informaliTy in mexico?
In addition to the 20,116,834 workers, the Census also identified 4,836,346
workers in government and religious activities. We found a very similar number in
the ENOE: 4,645,104. Next, in the ENOE we identified 5,638,429 workers in rural
areas (not captured in the Census). As a result, the remaining 13,456,430 workers
captured by the ENOE worked in locations that are not fixed (selling in the streets,
working as domestic servants, and so on) and were therefore excluded from the
occupied labor force captured in the Census. Finally, we divided workers between
informal and formal depending on whether they reported access to social securi-
ty through their jobs, and classified them by firm size as captured in the ENOE.
1.2 Table 8: Composition of Employment for Model Calibration
For model calibration, we use data from the Census and IMSS registries and not from
ENOE for three reasons. First, the ENOE is a household survey; for obvious reasons
the information from a census is preferred. Second, the size distribution of firms re-
ported in ENOE is not as precise as the one provided by the Census; as discussed
below, this information is crucial to estimate the distribution of capital among firms.
Third, ENOE classifies economic activities at the three-digit level; in contrast, the
Census reports information at the five-digit level. This allows for a more accurate
classification of workers between intermediate sectors 1 and 2. In these calculations,
we exclude government employees and people engaged in religious activities for two
reasons. First, the model considers only profit maximizing firms. Second, the pro-
posal to reform social insurance is designed for workers in the private sector only
(those covered by Chapter A in Article 123 of Mexico’s Constitution). As indicated,
43.86 million workers were employed in the second quarter of 2008. Subtracting
public sector employees and people engaged in religious activities from this num-
ber—which according to the Census are 4.83 million workers—leaves 39.03 million
workers that need to be distributed among the intermediate and final good B sectors.
The distribution of workers between intermediate sectors 1 and 2 is tak-
en from the Census, which captures 20.12 million workers, once government
employees and people engaged in religious activities are excluded. Out of this
number, 5.28 million work in intermediate sector 1 and 14.84 million in inter-
mediate sector 2.2 In terms of the model, the remaining 18.91 million workers
(=39.03–20.12) are allocated to the final good B sector.
2 Intermediate sector 1 includes workers related to: animal breeding, fishing, food and pharma-ceutical industries; wholesale and retail trade of food, books, magazines and agricultural goods; passenger transportation; postal services; book and magazine publishing; educational services; and health care and social assistance services.
101
DATA AND MODEL CALIBRATION
The 20.12 million workers included in the Census are considered salaried and
classified as either formal or informal. Registries from IMSS report 14.18 million
workers affiliated during 2008. However, as the Census does not include workers in
agricultural, hunting, livestock, and forestry activities among others, employees in
such sectors must be excluded from the IMSS registries. This leaves a total of 12.76
million workers registered at IMSS, which is then the total number of formal work-
ers in the model. The remaining workers (7.36 million) are classified as informal.
2. Technology
For the case of intermediate and final good B sectors, α is set to 0.65, consis-
tent with the results of García-Verdú (2005). For final good sector A, αm is set to
0.48, which is the average share of intermediate goods in gross output once the
production of the household informal sector is taken into account, according to
data from National Statistics Office (INEGI) for the period 2003–07. Parameters
A1, A2 and AB are set at 1874.2, 1837.5 and 219.5, respectively, so that the number
of workers replicate the total of formal, informal, and self-employed and family
workers in the data. Given these values, parameter Am is chosen to scale up activ-
ity to replicate the GDP observed in 2008, and is set at 158.1. On the other hand,
the national accounts indicate that sector 1 represents approximately 30 percent
of total consumption of intermediate goods, which corresponds to parameter ϒ in
equation (A1.10). To the best of our knowledge, there are no estimates available
in the literature for the elasticity of substitution between intermediate sectors
1 and 2. Presumably, this elasticity is relatively low. We arbitrarily set µ = –4,
so that the corresponding elasticity is –0.20.
3. Price Indices
Prices p1, p2 and pB are exogenous given our small open economy assumption. We
set each to 1/3 to comply with our normalization condition. Parameter δ for the
CPI in equation (21) in the main text is fixed to 0.9. This implies that relative con-
sumption of goods from the final sector B, 1 – δ, is consistent with the share of
the household informal sector in total output, according to national accounts and
information from INEGI’s Cuentas Satélite del Subsector Informal de los Hogares.
4. Capital Stock
Next we describe how the distribution function for capital Kz in each sector is cal-
culated. This distribution is critical to derive the allocation of labor across firms
of different sizes. For these purposes, a method similar to Guner, Ventura and Xu
102
The end of informaliTy in mexico?
(2008) and Leal (2010) is followed. In particular, capital is assumed to follow a
truncated Pareto distribution of the form:
F K
KK
KK
1
1
z
z
z
s
z
z
s
,min
,min
,max
z
z( ) =
−
−
(A2.1)
where s 0z > is a shape parameter associated to the distribution in sector z, with K Kz z,min ≡ and K Kz z,max ≡ . The shape parameter is allowed to differ between sec-
tors in order for the model to better fit the data. It turns out that the truncated
Pareto distribution is able to explain most of the employment in each intermedi-
ate sector with a total mass f1 z ,max− . The remaining employment share (which
corresponds to the right tail of the distribution with mass fz ,max ) is obtained by
selecting an arbitrary value K Kz top z, > .3 Hence, the distribution of capital has two
parts: the bottom side, which accounts for most of the employment, is defined
by a truncated Pareto distribution. In contrast, the top side is captured by an ex-
treme value of physical capital. This approach helps to have a better fit for the
share of employment in the upper tail of the distribution. The results of this cal-
ibration are shown in Panel C of Table 8 in the main text. The shape parameter
values are fixed to s1 = 0.9 and s
2 = 0.75 across all simulations. In general, the
model does a good job in replicating the employment shares found in the data,
including the values at the tail of each distribution.
5. Taxation, Evasion and Government Spending
Consider now the parameters related to taxation, evasion and government reve-
nues and expenditures. In the model intermediate goods sector 1 represents the
food and medicine sector of the economy; thus 0VAT1τ = . On the other hand, in-
termediate sector 2 represents economic activity subject to the general VAT rate,
which in 2008 was 15 percent; thus VAT2τ = 0.15.4 The corporate income tax rate
3 Under the benchmark, the corresponding mass fz,max in sectors 1 and 2 is 7.8e-06 and 4.8e-05, respectively.4 The statutory tax for these goods in the border Mexican states was 10 percent in 2008. The model abstracts from this geographical dimension and simply sets VAT
2τ to 15 percent. Starting 2010, the general VAT rate was raised to 16 and 11 percent for non-border and border states, respectively.

103
DATA AND MODEL CALIBRATION
ITτ works like a lump-sum tax in the model. Its value is calibrated so that gov-
ernment revenue out of this tax replicates the data; this implies ITτ = 0.106.5
With regards to penalties, the social security law implies that the penalty imposed
on a firm caught evading social security contributions is 150 percent of unpaid
contributions; thus 1.5CSIσ = . For the case of VAT and income taxes, the penal-
ty imposed varies between 150 and 170 percent according to the Federal Fiscal
Code, but may be higher if they are paid following a delay or if there is a previ-
ous record of non-compliance with the law; on the other hand, the penalty may
decrease if it is paid promptly. Given the complexity of such scheme, penalties are
simply set to 150 percent of the amount evaded, implying 1.5VAT ITσ σ σ= = = .
Parameter λ in the probability of detection function K zλ( ) is fixed to 2.14 so
that VAT revenues match the data. Put differently, given the tax base and the tax
rate, we endogenously calculate the level of evasion that is consistent with the
revenues observed in 2008. Similarly, the values for υ = 0.1 and CSIλ = 0.012
in function L K,zCSI
iz zλ ( ) were chosen so that government revenue out of CSI tax-
es replicates the data, given the level of evasion of these taxes. The exogenous
components of revenue and expenditures from equation (22) in the main text are
calculated as the difference from total revenues and expenditures in 2008 ob-
tained from the official fiscal accounts, and the revenues from CSI, value added
and income taxes, on the one hand; and expenditures in subsidies for CSI and
NCSI, on the other. This implies that R = 1,852 and G = 2,679 thousand mil-
lion pesos.
6. Social Insurance
Parameters related to the valuation of CSI and NCSI, CSIβ and NCSIβ , are taken
from the econometric estimates of Levy (2008), equal to 0.3 and 0.85, respective-
ly. On the other hand, Table A2.1 shows that the average tax rate on formal labor, CSIτ , is 38 percent, with government subsidies representing 16 percent (allocat-
ed by law to health and life and disability insurance and retirement pensions);
accordingly, θ = 0.16. These values imply that the average per worker subsidy for
CSI, CSIθτ , was 5,062 pesos. Note that state taxes on salaried labor are includ-
ed as part of CSI taxes even though the revenues are not allocated to SI. This is
because these payments are bundled with other CSI taxes, are exclusive to sal-
aried work, and must be absorbed by firms and workers. The corresponding rate
5 As a reference, the statutory income tax rate was 0.28 in 2008. In 2010 the rate was in-creased to 30 percent.

104
The end of informaliTy in mexico?
is set at 2 percent, which corresponds to its statutory value. On the other hand,
per worker subsidies for NCSI are calculated by dividing total government sub-
sidies for NCSI programs in 2008, as identified in Table A2.2, by the estimated
number of informal workers. We list NCSI programs for 151,505 million pesos,
which divided by 26.8 million informal workers implies that NCSIτ = 5,652 pe-
sos per worker. Note that public subsidies for health services include spending by
sub-national governments, as according to the general health law they must con-
tribute along with the federal government to financing health services for workers
without CSI coverage, and are part of the benefits received by informal workers.
State spending in health comes from revenue sharing formulas that are contained
in the federal budget (under participaciones or aportaciones). In principle, we
should also have added sub-national spending for pension, housing and day care
programs (which are significant), but we were unable to put together a data set
for all states and municipal governments. We list NCSI programs by their Spanish
name to link directly to the federal budget.
Table A2.1 CSI Taxes and Subsidies*
Total rateGovernment
subsidyFirms and worker
contribution
Health insurance 17.50 4.50 13.00
Life and disability insurance
2.75 0.25 2.50
Work-risk insurance 1.75 0 1.75
Retirement pensions 8.00 1.70 6.30
Day care services 1.00 0 1.00
Housing 5.00 0 5.00
State labor taxes 2.00 0 2.50
Total τCSI = 0 38. θτCSI = 0 06. ( ) .1 0 32− =θ τCSI
Source: Authors.*Calculated as a percentage of the average formal wage as some contribution rates vary with wage levels. See IMSS (2005).
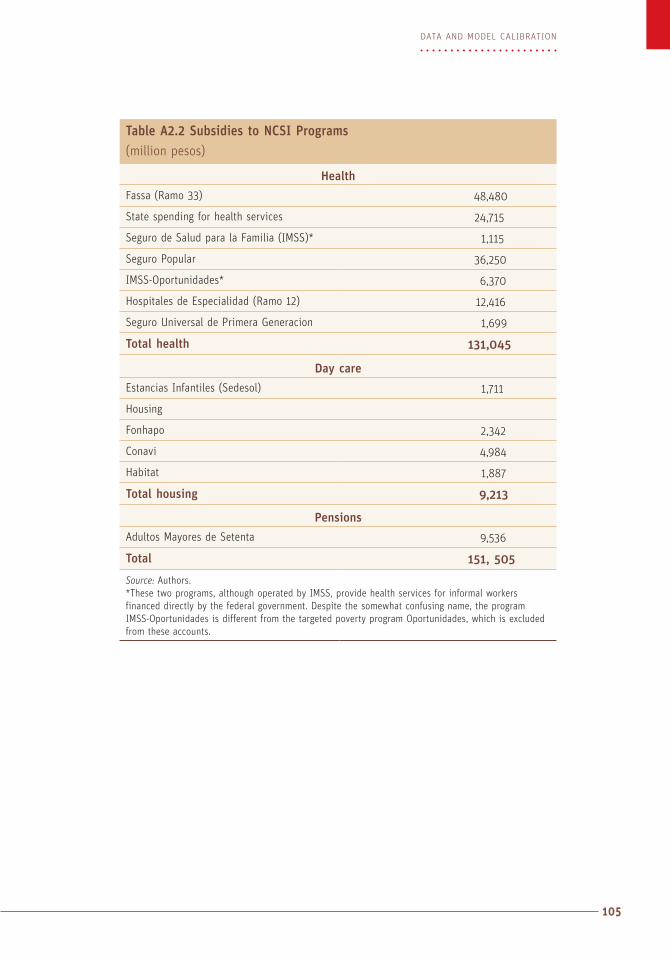
105
DATA AND MODEL CALIBRATION
Table A2.2 Subsidies to NCSI Programs(million pesos)
Health
Fassa (Ramo 33) 48,480
State spending for health services 24,715
Seguro de Salud para la Familia (IMSS)* 1,115
Seguro Popular 36,250
IMSS-Oportunidades* 6,370
Hospitales de Especialidad (Ramo 12) 12,416
Seguro Universal de Primera Generacion 1,699
Total health 131,045
Day care
Estancias Infantiles (Sedesol) 1,711
Housing
Fonhapo 2,342
Conavi 4,984
Habitat 1,887
Total housing 9,213
Pensions
Adultos Mayores de Setenta 9,536
Total 151, 505
Source: Authors.*These two programs, although operated by IMSS, provide health services for informal workers financed directly by the federal government. Despite the somewhat confusing name, the program IMSS-Oportunidades is different from the targeted poverty program Oportunidades, which is excluded from these accounts.


Per worker annual costs of USI of 14,330 pesos consist of three components:
10,118 pesos for health insurance; 3,492 pesos for retirement pensions; and 720
pesos for life and disability pensions.
1. Costs of Health Insurance
As discussed in the text, we take as reference the IMSS health package. In 2008
IMSS received 109.3 thousand million pesos in CSI taxes from firms and work-
ers, and 44.3 thousand million pesos in CSI subsidies from the government, for a
total expenditure of 153.7 thousand million pesos; see Table 7 in the text. As de-
scribed in IMSS (2005), however, IMSS uses part of its revenues to pay for the
pension liabilities of its own already retired workers (the Regimen de Jubilaciones
y Pensiones, or RJP), not to provide health services to affiliated workers. In 2008
16 cents of every peso of IMSS revenues were diverted to the RJP, implying that
actual expenditures in health services per worker were (153.7)(0.84)/12.76 =
10,118 pesos, given an estimate of 12.76 million formal workers in that year. Given
a total occupied labor force of 39.03 million workers, the total costs of health in-
surance under USI are 394.9 thousand million pesos. On the other hand, the RJP
pension liabilities would have to be paid directly by the federal government, for
a total amount of 27 thousand million pesos in 2008 (including the payments to
RJP from the other insurance items administered by IMSS), which is the amount
added to the costs of the proposal in Table 12.
Table A3.1 compares health expenditure under CSI+NCSI vs. USI.
Note that under USI spending in health for informal workers increase by 106
percent while, by construction, spending stays constant for formal workers. As a
result, resources for health insurance for workers increase from 260.1 thousand
APPENDIX 3
Costs of USI
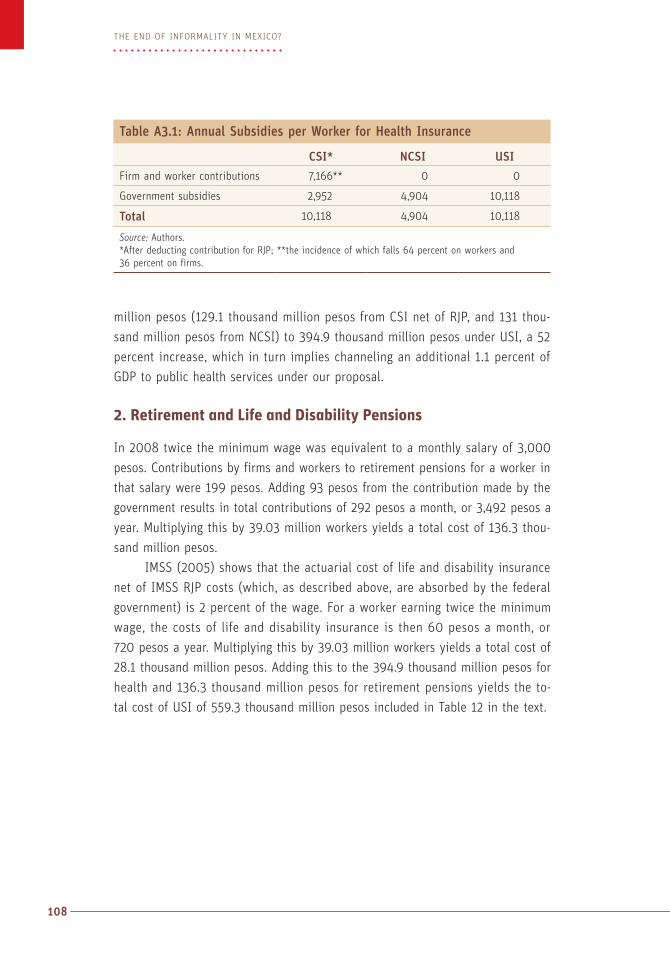
108
The end of informaliTy in mexico?
million pesos (129.1 thousand million pesos from CSI net of RJP, and 131 thou-
sand million pesos from NCSI) to 394.9 thousand million pesos under USI, a 52
percent increase, which in turn implies channeling an additional 1.1 percent of
GDP to public health services under our proposal.
2. Retirement and Life and Disability Pensions
In 2008 twice the minimum wage was equivalent to a monthly salary of 3,000
pesos. Contributions by firms and workers to retirement pensions for a worker in
that salary were 199 pesos. Adding 93 pesos from the contribution made by the
government results in total contributions of 292 pesos a month, or 3,492 pesos a
year. Multiplying this by 39.03 million workers yields a total cost of 136.3 thou-
sand million pesos.
IMSS (2005) shows that the actuarial cost of life and disability insurance
net of IMSS RJP costs (which, as described above, are absorbed by the federal
government) is 2 percent of the wage. For a worker earning twice the minimum
wage, the costs of life and disability insurance is then 60 pesos a month, or
720 pesos a year. Multiplying this by 39.03 million workers yields a total cost of
28.1 thousand million pesos. Adding this to the 394.9 thousand million pesos for
health and 136.3 thousand million pesos for retirement pensions yields the to-
tal cost of USI of 559.3 thousand million pesos included in Table 12 in the text.
Table A3.1: Annual Subsidies per Worker for Health Insurance
CSI* NCSI USI
Firm and worker contributions 7,166** 0 0
Government subsidies 2,952 4,904 10,118
Total 10,118 4,904 10,118
Source: Authors.*After deducting contribution for RJP; **the incidence of which falls 64 percent on workers and 36 percent on firms.

Aguila, E., (2011), “Personal Retirement Accounts and Savings”, American Economic Journal – Economic Policy, 3, 1–24.
Antón, A. and Hernández, F., (2010), «VAT Collection and Social Security
Contributions: Is There a Link?», IDB Working Paper Series No. 251,
Washington, D.C.
Aterido, R., Hallward-Driemeier, M., Pagés, C., (2011), “Does Expanding Health
Insurance Beyond Formal-Sector Workers Encourage Informality? Measuring
the Impact of Mexico’s Seguro Popular”, IzA Discussion Paper No. 5996,
September.
Azuara, O., and Marinescu, I., (2010), “Informality and the Expansion of Social
Protection Programs. Evidence from Mexico”, mimeo, University of Chicago,
December.
Barros, R., (2009), “Wealthier but not Much Healthier: Effects of a Health
Insurance Program for the Poor in Mexico”, Stanford Institute for Economic
Policy Research, SIERP Discussion Paper 09–002. Stanford University
Bell, L.A., (1997), “The Impact of Minimum Wages in Mexico and Colombia”,
Journal of Labor Economics, Vol. 15, pp. 103–35.
Bird, R. and Gendron, P.P., (2007), “The VAT in Developing and Transitional Economies”, Cambridge University Press.
Bosch, M. and Campos-Vázquez, R.M., (2010), “The Trade-Offs of Social Assistance
Programs in the Labor Market: The Case of the Seguro Popular Program in
Mexico”. El Colegio de México, Working Paper XII.
Bosch, M. and Cobacho, M.B., (2011), “Welfare Polices and Informalization: The
Effect of Popular Insurance on Semi-Formal Firms in Mexico”, mimeo,
University of Alicante.
References

110
The end of informaliTy in mexico?
Bosch, M, Cobacho, M.B and Pagés, C., (2012), “Taking Stock of Eight Years
of Implementation of Seguro Popular in Mexico”, mimeo, Inter-American
Development Bank, Washington, D.C.
Busso, M., Fazio, M. V. and Levy, S., (2012), “Productivity, Informality, Illegality
and Firm Size: Mexico 1998–2008” mimeo, Inter-American Development
Bank.
Calderon-Madrid, A., (2000), “Job Stability and Labor Mobility in Urban Mexico:
A Study Based on Duration Models and Transition Analysis”, Inter-American
Development Bank Research Network Working Paper # R-419, Washington,
D.C.
Calderon-Madrid, A., (2006), “Mobility of Workers between Formal and Informal
Job Status: An Empirical Assessment of Earnings Variations and Exit Hazards
in Mexico’s Urban Labor Market”, mimeo, El Colegio de México.
Calderon-Madrid, A., (2010), “Employment Protection Legislation in Mexico: Is it
Adversely Affecting Workers’ Flows in the Manufacturing Sector?”, mimeo,
El Colegio de México.
Campos-Vázquez, R.M. and Knox, M.A., (2010), “Social Protection Programs and
Employment: The Case of Mexico’s Seguro Popular Program”, Centro de
Estudios Económicos, El Colegio de México, working paper No. XIV.
Davila, E. and Levy, S., (2003), “Taxing for Equity: A Proposal to Reform Mexico´s
Value Added Tax” in Latin American Economic Reform, The Second Stage, edited by J.A. González, V. Corbo, A Krueger and A. Tornell, University of
Chicago Press, pp. 357–392.
De Paula, Á. and Sheinkman, J., (2010), “Value Added Taxes, Chain Effects and
Informality”, American Economic Journal: Macroeconomics 2 (4), 195–221.
Duval, R. and R. Smith, (2010), “Counterfactual Wages and Segmentation between
Formal and Informal Sectors in Mexico”, mimeo, Inter-American Development
Bank.
Duval, R. and Smith, R., (2011), “Informality and Seguro Popular under Segmented
Labor Markets”, mimeo, Division de Economia, Centro de Investigacion y
Docenica Economicas, Mexico.
Elizondo-Mayer, C., (2010), “Nuestro Inefectivo Pacto Tributario”, in La Flecha al Aire: Homenaje a Javier Beristain: Ensayos sobre Economía, Desarrollo e Innovación Educativa, Editorial Porrúa, México, pp. 71–122.
Emran, M. S., and Stiglits, J., (2005), “On Selective Indirect Tax Reform in
Developing Countries”, Journal of Public Economics, 89, 599–623.
Farhi, E., Gopinath, G., and Itskhoki, O., (2011), “Fiscal Devaluations”, Center for
Economic Policy Research Discussion Paper 8721, London, UK.

111
REFERENCES
Feldstein, M.S. and Krugman, P., (1990), “International Trade Effects of Value-
Added Taxation” in Taxation in the Global Economy, National Bureau of
Economic Research, pp. 263–282.
Galiani, S. and Gertler, P., (2009), “Informe Final Sobre los Cambios del Programa
70 y Más”, Secretaria de Desarrollo Social, Mexico.
Gallardo-García, J.R., (2006), “Health Insurance and Pregnancy Outcomes: An
Analysis of Fertility, Prenatal Care and Employment in Mexico”, Ph. D.
Dissertation, University of Pennsylvania.
García-Verdú, R., (2005), “Factor Shares from Household Survey Data”, Working Paper 2005–05, Banco de México, México.
Gollin, D., (2006), “Do Taxes on Large Firms Impede Growth? Evidence from
Ghana”, manuscript, Williams College.
Gong, X., Soest, A., and Villagomez, E., (2004), “Mobility in the Urban Labor
Market: A Panel Data Analysis for Mexico”, Economic Development and Cultural Change, 53(1), pp. 1–36.
Guner, N., Ventura, G. and Xu, Y., (2008), “Macroeconomic Implications of Size-
Dependent Policies”, Review of Economic Dynamics 11, 721–744.
Heckman, J. and Pagés, C., (2004) “Law and Employment: Lessons from Latin America and the Caribbean”, University of Chicago Press for the National
Bureau of Economic Research.
Hernández, F., (2009), “Los Impuestos en México”, Nostra Editores.
Hsieh, C., and Klenow, P., (2009a), “Misallocation and Manufacturing TFP in China
and India”, Quarterly Journal of Economics 124 (4), pp. 1403–1448.
Hsieh, C., and Klenow, P., (2009b), “Resource Misallocation in Mexico”, manu-script.
Instituto Mexicano del Seguro Social, IMSS, (2005), “Informe al Ejecutivo Federal
y al Congreso de la Unión sobre la Situación Financiera y los Riesgos del
IMSS 2004–2005”.
Instituto Nacional de Estadística, Geografía e Informática, INEGI, (2009),
“Metodología de los Censos Económicos 2009, Glosario de los Censos
Económicos 2009, Resumen de los Resultados de los Censos Económicos
2009.”
Inter-American Development Bank (2004), “Good Jobs Wanted: Labor Markets in Latin America”, Economic and Social Progress Report, Washington, D.C.
Inter-American Development Bank (2010), “The Age of Productivity: Transforming Economies from the Bottom Up”, Palgrave-MacMillan.
International Monetary Fund, (2011), World Economic and Financial Surveys, Fiscal
Monitor, September.
112
The end of informaliTy in mexico?
Juárez, L., (2009), “Are Informal Workers Compensated for the Lack of Fringe
Benefits? Free Health Care as an Instrument for Formality”, Centro de
Investigación Económica, Instituto Tecnologico Autonomo de Mexico, work-
ing paper 0804, Mexico.
Kanbur, R., (2009), “Conceptualizing Informality: Regulation and Enforcement”,
V.V. Giri Memorial Lecture, in Indian Journal of Labor Economics.
Kaplan, D., Silva-Méndez, J., and Sadka, J., (2008a), “Litigation and Settlement:
New Evidence from Labor Courts in Mexico”, Journal of Empirical Legal Studies, 5, no. 2, pp. 309–350.
Kaplan, D. and Sadka, J., (2008b), “Enforceability of Labor Law: Evidence from
a Labor Court in Mexico”, World Bank Policy Research working paper No.
4483.
Keen, M., (2008), “VAT, Tariffs, and Withholding: Border Taxes and Informality in
Developing Countries”, Journal of Public Economics, 92, 1892–1906.
Kugler, A., (2011), “Is There an Anti-labor Bias of Taxes: A Survey of the Evidence
from Latin America and Around the World”, Inter-American Development
Bank, Technical Note 299.
Leal, J., (2010), “Informal Sector and Economic Development”, Ph.D. Dissertation,
Arizona State University.
Levy, S., (2008), Good Intentions, Bad Outcomes: Social Policy, Informality and Economic Growth in Mexico, Brookings Institution Press.
Levy, S., (2010), Crecimiento, Productividad e Informalidad en México”, mimeo,
Banco Interamericano de Desarrollo.
Lindert, P., (2004), “Growing Public: Social Expenditures since the XVIII Century”,
Cambridge University Press.
López-Calva, L.F., and Ortíz-Juárez. E., (2011a), “A Vulnerability Approach to the
Definition of the Middle Class”, Policy Research Working Paper No. 5092,
World Bank, Latin America and Caribbean Region, Washington, D.C.
López-Calva, L.F., and Ortíz-Juárez. E., (2011b), “Informality, Shocks and Transitions
into Poverty in Mexico”, mimeo, World Bank.
Lucas, R. E., (1978), “On the Size Distribution of Business Firms”, Bell Journal of Economics 9 (2), 508–523.
Maloney, W., (1999), “Does Informality Imply Segmentation in Urban Labor
Markets? Evidence from Sectoral Transitions in Mexico”, World Bank Economic Review, 13, pp. 275–302.
Maloney, W., (2004), “Informality Revisited”, World Development, Vol. XX, pp.
1–20.

113
REFERENCES
Maloney, W. and J. Nuñez Mendez, (2004), “Measuring the Impact of Minimum
Wages: Evidence from Latin America”, in Law and Employment: Lessons from Latin America and the Caribbean, J. Heckman and C. Pages, ed., University
of Chicago Press.
Marrufo, G., (2010), “The Incidence of Social Security Taxes in Economies with
Partial Compliance: Evidence from the Social Security Reform in Mexico”,
Center for Research on Economic Development and Economic Policy Reform,
Stanford University.
Narro, J., Moctezuma, D., and Orozco, L., (2011), “Hacia un Nuevo Modelo de
Seguridad Social“, Economía Unam, Vol. 7, Número Especial, pp. 7–33.
Navarro, S., and P. Schrimpf, (2004), “The Importance of Being Formal: Testing
for Segmentation in the Mexican Labor Market”, mimeo, Department of
Economics, University of Chicago.
OECD, (2011), “Taxation and Employment”, Organization for Economic Cooperation
and Development, Tax Policy Studies No. 21.
Paullada, J.J., (2012), “El Régimen Fiscal del Impuesto sobre la Renta al Factor
Trabajo: ¿Equidad, Neutralidad, Recaudación e Informalidad?”, mimeo, Inter-
American Development Bank, Washington, D.C.
Pérez-Estrada, J., (2011), “The Employment and Wage Effects of Expanding Health
Insurance Coverage: The Case of Mexico”, mimeo, Department of Economics,
University of California at Los Angeles.
Restuccia, D., and Rogerson, R., (2008), “Policy Distortions and Aggregate
Productivity with Heterogeneous Establishments”, Review of Economic Dynamics 11 (4), 707–720.
Valero, J. and Sánchez-Vela, C., (2010), “The Effect of Firm-size Dependent Policies
on the Economy: The Case of the Small Contributors Tax Law in Mexico,
mimeo, Universidad de Nuevo Leon, Mexico.


Mexico is characterized by a dual social insurance architecture. Firms and workers in salaried
contractual relations are obligated to pay for a bundled set of health, pension and related
programs. Nonsalaried workers benefit from an unbundled set of parallel programs paid by the
government. We develop a model to study the implications of this architecture in a context
of informality and imperfect tax enforcement. We argue that this architecture: (i) provides
workers with erratic and incomplete coverage against risks, (ii) fosters evasion and narrows
the tax base, (iii) delinks contributions from benefits undermining fiscal sustainability, and
(iv) distorts the labor market lowering real wages and total factor productivity.
We propose a reform to shift taxation for social insurance from labor to consumption.
We show that by setting a uniform value added tax rate of 16 percent it is possible to provide
all workers with the same health and pension benefits and Hicks-compensate poor households
for the VAT increase at a net fiscal cost of 0.34 percent of GDP. We argue that our proposal:
(i) effectively protects all workers against risks, (ii) reduces distortions in the labor market
stemming from social insurance tax-cum-subsidies allowing for an increase in the real wage
despite the higher VAT, (iii) raises total factor productivity, (iv) helps to reduce poverty
and income inequality, (v) links contributions with benefits ensuring fiscal sustainability,
(vi) increases aggregate savings for retirement, and (vii) reduces evasion and widens the tax
base. While the focus of the paper is on Mexico, the issues discussed have broader relevance
to other countries in Latin America, which are also characterized by high informality and high
tax evasion.
Arturo Antón and Fausto Hernández are with the Centro de Investigación y Docencia
Económicas (CIDE); Santiago Levy is with the Inter-American Development Bank (IDB)