the emerging trends in the quality requirement of the ...southkraft.com/downloads/the emerging...
TRANSCRIPT

11/6/2009
1
The Emerging Trends in the Quality Requirement of the Kraft Paper
Presented by Ram Kumar Sunkara
S S Consultants, Pune
5th Nov 2009, Venue:
Hotel Casa Luxurio, Hyderabad.
New Generation
3 S. S. Consultants
The purpose of information is not knowledge. It is being able to take
the right action.
Peter Drucker
Dr. Patrick Dixon
• Dr. Patrick Dixon – Chairman – Global Change Ltd, author of “Futurewise”
• In his conference Keynote speech delivered at Global change – Paper and Packaging says few words on Indian Paper industry:
• Per capita paper consumption 4 to 5 kgs.
• 1.3 billion population
• Middle class strength of 200 million.
• Once, this middle class reaches 400 million, you will see Indian paper consumption in the levels that you see in America.
• 25 million new newspaper readers in the last 24 months alone.
Dr. Patrick Dixon Overview of Indian Paper Industry – by Dr. R. M. Mathur, CPPRI
• The industry is fragmented with capacities ranging from 2 to 800 tonnes per day.
• The Industrial Paper production is 58.1% of total production.
• The percentage of Kraft Paper in total industrial paper is 54.4%
• In other words, the Kraft paper constitutes 31.3 % of total paper production in India.
11/6/2009
2
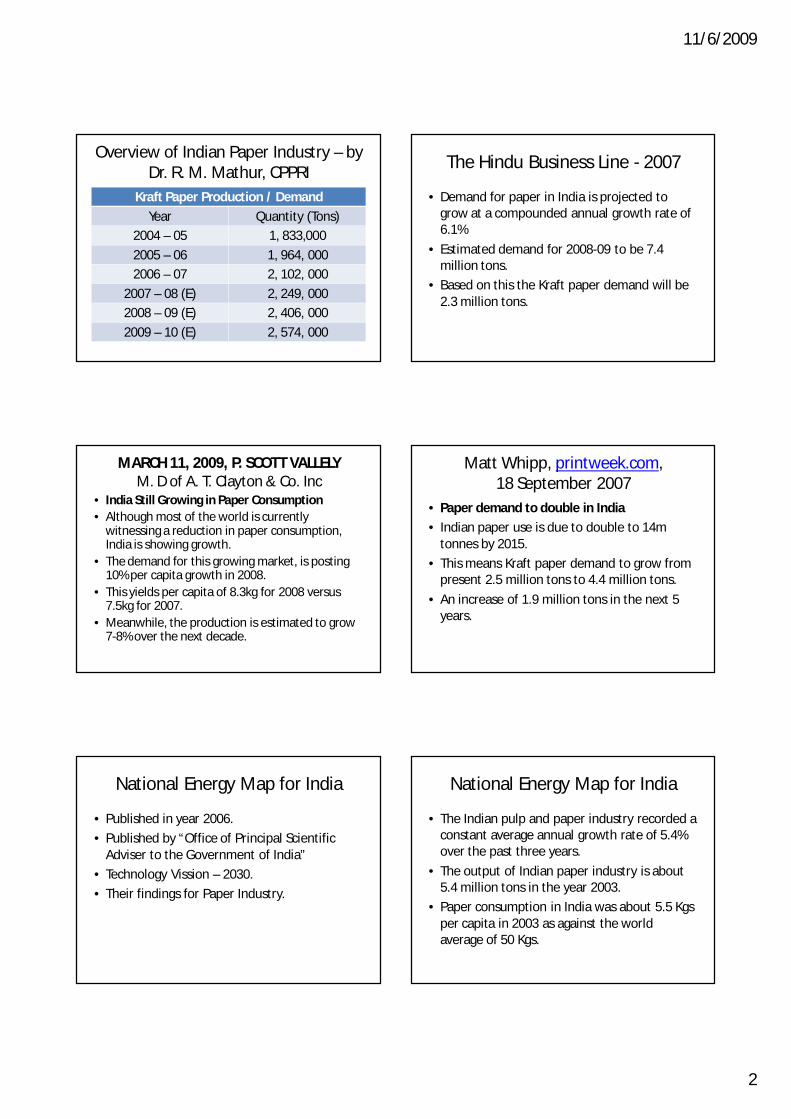
Kraft Paper Production / Demand
Year Quantity (Tons)2004 – 05 1, 833,000
2005 – 06 1, 964, 0002006 – 07 2, 102, 000
2007 – 08 (E) 2, 249, 0002008 – 09 (E) 2, 406, 000
2009 – 10 (E) 2, 574, 000
Overview of Indian Paper Industry – by Dr. R. M. Mathur, CPPRI
The Hindu Business Line - 2007
• Demand for paper in India is projected to grow at a compounded annual growth rate of 6.1%
• Estimated demand for 2008-09 to be 7.4 million tons.
• Based on this the Kraft paper demand will be 2.3 million tons.
MARCH 11, 2009, P. SCOTT VALLELYM. D of A. T. Clayton & Co. Inc
• India Still Growing in Paper Consumption • Although most of the world is currently
witnessing a reduction in paper consumption, India is showing growth.
• The demand for this growing market, is posting 10% per capita growth in 2008.
• This yields per capita of 8.3kg for 2008 versus 7.5kg for 2007.
• Meanwhile, the production is estimated to grow 7-8% over the next decade.
Matt Whipp, printweek.com, 18 September 2007
• Paper demand to double in India
• Indian paper use is due to double to 14m tonnes by 2015.
• This means Kraft paper demand to grow from present 2.5 million tons to 4.4 million tons.
• An increase of 1.9 million tons in the next 5 years.
National Energy Map for India
• Published in year 2006.
• Published by “Office of Principal Scientific Adviser to the Government of India”
• Technology Vission – 2030.
• Their findings for Paper Industry.
• The Indian pulp and paper industry recorded a constant average annual growth rate of 5.4% over the past three years.
• The output of Indian paper industry is about 5.4 million tons in the year 2003.
• Paper consumption in India was about 5.5 Kgs per capita in 2003 as against the world average of 50 Kgs.
National Energy Map for India

11/6/2009
3
• Demand for paper is directly related to economic development.
• Demand for paper has been estimated using per capita GDP – gross domestic product.
• Projected demand for the paper has been established using a linear relationship.
National Energy Map for India
• They have established the following linear relationship for demand projection:
• DP,t = 2658 + 0.638 * PGDPt (R2 = 0.98)– Where DP,t is demand for the paper in thousand
tons in year “t”– PGDPt is per capita GDP in the year “t”.
National Energy Map for India
Projected Demand for the PaperDemand in thousand tons
G D P growth rate
Year 6.7 % 8.0 % 10.0 %2001 4 950 4 950 4 950
2006 6 929 7 615 8 1982011 9 345 11 479 13 719
2016 12 823 16 949 22 2382021 17 839 24 765 35 508
16 S. S. Consultants
Paper sourcing issues
• Sourcing of paper will be major issue in the coming years.
• Quantity and cost.
• In regards to both, I would like present to you all, what JAAKKO POYRY has to say.
• They are the worlds leading consultants to paper and paper products industry…
17 S. S. Consultants 18S. S. Consultants
Delivered cost of Test liner to Mumbai

11/6/2009
4
19 S. S. Consultants
Capacity structure – Test liner
• High cost of raw materials combined with small scale production make the estimated cost level of the selected Indian mill fairly high in spite of transport cost advantage.
• The size of a modern test liner PM in India should be some 270 000 t/a
• The Indian corrugated raw material industry is based on very small machines…
20 S. S. Consultants
Capacity structure – Test liner
• With this structure and fibre pricing the industry is not competitive, not even in the Indian markets.
• Thus all the currently operating machines can be considered as shut-down candidate in the long term.
• In Indian condition a cost competitive test liner machine should be over 250 000 t/a…
21 S. S. Consultants
Paper Market in India 2000
Corrugated 806 8 0 814
22 S. S. Consultants
Corr. materials demand forecast in India
23 S. S. Consultants
• The demand for corrugating materials is expected to grow from – 0.8 million tons to 1.9 million tons by 2010, and to,
– 2.8 million tons by 2015, 3.9 million tons by 2020.
• The major demand drivers for corrugating materials in India include:– Growth of manufacturing and export-led industries in
India.
– Increasing local manufacturing by multinational companies…
Corr. materials demand forecast in India
24 S. S. Consultants
• Pharmaceuticals, consumer durables, other consumer products and garments are the key growing end uses
• Growing agro-based sector, including horticultural products, fresh and canned fruits, marine products etc.. This, together with the Government policy to replace wooden crates by containerboard boxes particularly in fresh fruit packaging, will create new demand for corrugated boxes…
Corr. materials demand forecast in India

11/6/2009
5
25 S. S. Consultants
Corr. materials demand forecast in India• The retail market is developing rapidly and
focusing at first to serve the large middle class. Along with the traditional wet markets, modern supermarket style outlets are emerging rapidly with favorable impact on containerboard packaging
• Increasing packaging will boost the demand for containerboard boxes with increasing emphasis on box quality
• New developments and innovations in corrugated board (e.g. micro flute growth)…
26 S. S. Consultants
WTO entry• Joining the WTO will mean further reduction of
import duties.• This will mean stronger competition from
foreign mills in India.• WTO entry will also mean more favorable trade
conditions, and is likely to boost overall exports from India.
• This will increase the demand for certain paper grades like corrugating materials and duplex board…
27 S. S. Consultants
• To meet the demand for better quality papers and converted products, better raw materials, machinery, control and automation as well as know how will be needed.
• Local producers need to find foreign partners to gain these advantages…
WTO entry
28 S. S. Consultants
• On the other hand foreign companies need local companies in order to get better access to distribution channels.
• The amount of joint ventures, partnerships, alliances and direct foreign investments is expected to increase after India’s entry to WTO…
WTO entry
29 S. S. Consultants
End of the Report
• I have taken only 15 pages from 367 pages report of year 2002
• You can see how the predictions have come true in the last 5 years.
• Now draw your own conclusion for the next 10 years.
• In my opinion their report is very conservative.
• Expect at least 50% more…
Conclusion
Source Year Demand for Kraft Paper
GOI - 2006 2016 4.6 MTMatt Whipp - 2007 2015 4.3 MT
Jaakko Poyry - 2002 2015 2.8 MTCurrent 2009 – 10 2.3 to 2.5 MT
11/6/2009
6
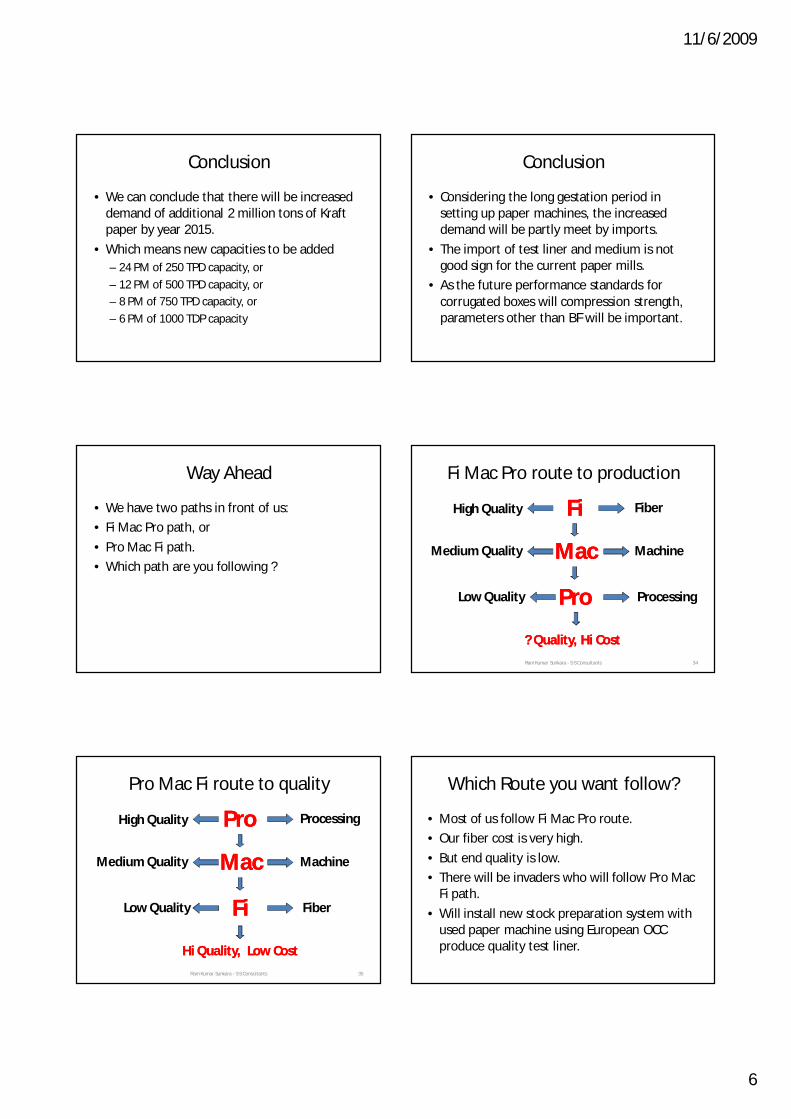
Conclusion
• We can conclude that there will be increased demand of additional 2 million tons of Kraft paper by year 2015.
• Which means new capacities to be added– 24 PM of 250 TPD capacity, or
– 12 PM of 500 TPD capacity, or– 8 PM of 750 TPD capacity, or
– 6 PM of 1000 TDP capacity
Conclusion
• Considering the long gestation period in setting up paper machines, the increased demand will be partly meet by imports.
• The import of test liner and medium is not good sign for the current paper mills.
• As the future performance standards for corrugated boxes will compression strength, parameters other than BF will be important.
Way Ahead
• We have two paths in front of us:
• Fi Mac Pro path, or
• Pro Mac Fi path.
• Which path are you following ?
Ram Kumar Sunkara - S S Consultants 34
Fi Mac Pro route to production
FiFi
MacMac
ProPro
Fiber
Machine
Processing
High Quality
Medium Quality
Low Quality
? Quality, Hi Cost? Quality, Hi Cost
Ram Kumar Sunkara - S S Consultants 35
Pro Mac Fi route to quality
ProPro
MacMac
FiFi
Processing
Machine
Fiber
High Quality
Medium Quality
Low Quality
Hi Quality, Low CostHi Quality, Low Cost
Which Route you want follow?
• Most of us follow Fi Mac Pro route.
• Our fiber cost is very high.
• But end quality is low.
• There will be invaders who will follow Pro Mac Fi path.
• Will install new stock preparation system with used paper machine using European OCC produce quality test liner.

11/6/2009
7
Ram Kumar Sunkara - S S Consultants 37
The EnvironmentThe Environment• The environment will remain a major issue for the
packaging industry.
• Issues involving recycling, reducing the amount of solid waste, source reduction will remain on the agenda of all governments.
• The driving forces are threefold - the consumer, commercial interests and government legislation.
• Getting the economics "right" is the key ingredient of a successful packaging environment policy.
Ram Kumar Sunkara - S S Consultants 38
Changing RequirementsChanging Requirements• These environmental pressures are changing
the requirements of raw materials.
• In paper –– Switching back from white top to brown top
– Source reduction in form of down gauging.– Lowering Liner and fluting GSM, yet maintain the
quality parameters.
– High ring crush liner
– High CMT medium.
Ram Kumar Sunkara - S S Consultants 39
Global requirementsGlobal requirements• Let us look at paper parameter.
• RCT value of Liner.
• CMT value of Medium.
• Mills are now concentrating on RCT, giving out spec sheet in that respect.
• However no work is being done on CMT values.
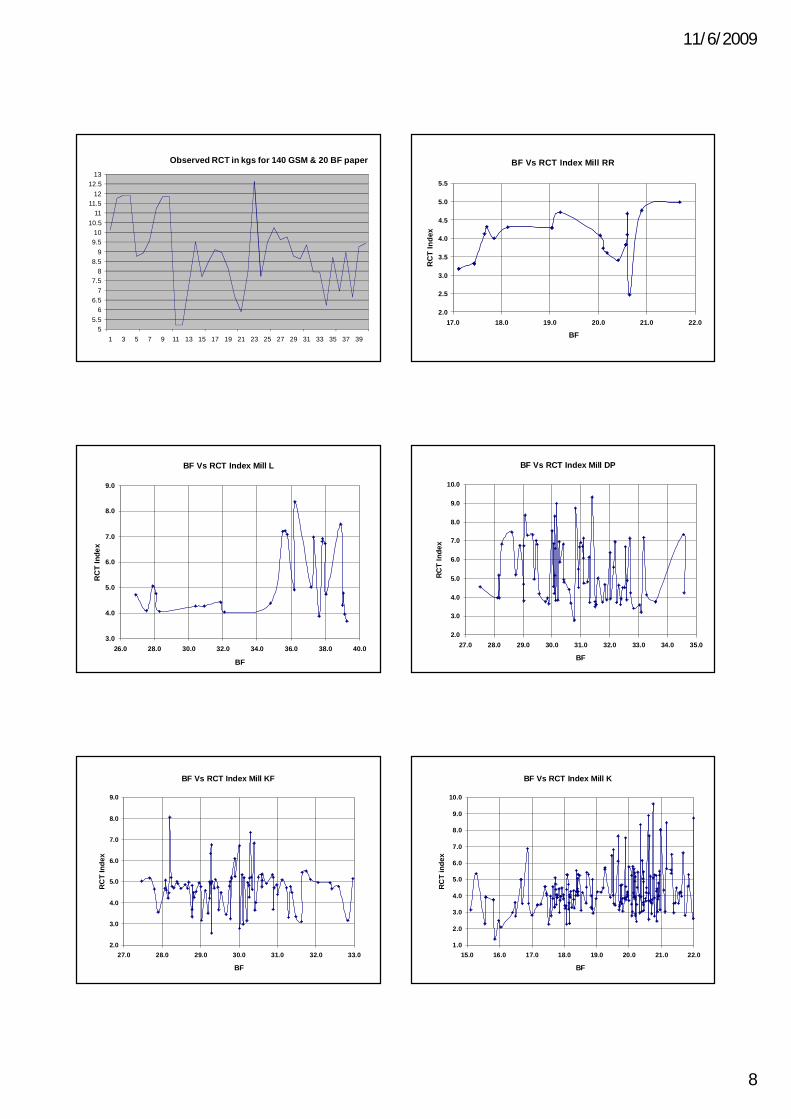
Paper RCT Issues
• At present mills are manufacturing Kraft paper to BS parameter.
• There are still experimenting on how to produce Kraft paper for CS application.
• The manufacturing process for achieving BF in paper is different from what is need for RCT.
Paper RCT Issues
• Although there is good consistency in the manufacturing paper for BF, the same is not true for RCT.
• There is narrow range in variation for BF, however the variations in RCT is beyond comprehension.
• The following charts will show what is variation in RCT for different mills.
17.5
18
18.5
19
19.5
20
20.5
21
21.5
22
22.5
1 3 5 7 9 11 13 15 17 19 21 23 25 27 29 31 33 35 37 39
Observed BF for 140 GSM & 20 BF
11/6/2009
8
55.5
66.5
77.5
88.5
99.510
10.511
11.512
12.513
1 3 5 7 9 11 13 15 17 19 21 23 25 27 29 31 33 35 37 39
Observed RCT in kgs for 140 GSM & 20 BF paper BF Vs RCT Index Mill RR
2.0
2.5
3.0
3.5
4.0
4.5
5.0
5.5
17.0 18.0 19.0 20.0 21.0 22.0
BF
RC
T In
dex
BF Vs RCT Index Mill L
3.0
4.0
5.0
6.0
7.0
8.0
9.0
26.0 28.0 30.0 32.0 34.0 36.0 38.0 40.0
BF
RC
T In
dex
BF Vs RCT Index Mill DP
2.0
3.0
4.0
5.0
6.0
7.0
8.0
9.0
10.0
27.0 28.0 29.0 30.0 31.0 32.0 33.0 34.0 35.0
BF
RCT
Inde
x
BF Vs RCT Index Mill KF
2.0
3.0
4.0
5.0
6.0
7.0
8.0
9.0
27.0 28.0 29.0 30.0 31.0 32.0 33.0
BF
RC
T In
dex
BF Vs RCT Index Mill K
1.0
2.0
3.0
4.0
5.0
6.0
7.0
8.0
9.0
10.0
15.0 16.0 17.0 18.0 19.0 20.0 21.0 22.0
BF
RC
T in
dex

11/6/2009
9
BF Vs RCT Index Mill R
2.0
3.0
4.0
5.0
6.0
7.0
8.0
9.0
12.0 14.0 16.0 18.0 20.0 22.0 24.0 26.0 28.0 30.0 32.0
BF
RC
T In
dex
Ram Kumar Sunkara - S S Consultants 50
Minimum Flat Crush valuesMinimum Flat Crush values
• Globally there are minimum standards for flat crush values of corrugated boards.
• Flat crush value of corrugated board is related to CMT value of medium.
• Let us look at some minimum global requirements.
Ram Kumar Sunkara - S S Consultants 51
BelgiumBelgium
• GSM range for medium 112 to 140
• Minimum flat crush value for 100 flutes per meter is 1.5 bar or 146 kPa.
Ram Kumar Sunkara - S S Consultants 52
FranceFrance
• For all GSM, the arithmetic mean of 5 single measurements should not be less than 145 kPa.
Ram Kumar Sunkara - S S Consultants 53
U. KU. K
• Minimum GSM of fluting medium is 112
• Minimum flat crush test values are –– For “A” flute: 140 kPa
– For “B” flute: 180 kPa
– For “C” flute: 165 kPa
Ram Kumar Sunkara - S S Consultants 54
ItalyItaly
• The minimum flat crush values –– For single wall: 117 kPa
– For double wall: 127 kPa

11/6/2009
10
Ram Kumar Sunkara - S S Consultants 55
ObservationObservation
• The GSM range for fluting medium is 112 to 140 on an average.
• Most countries specify minimum flat crush values of 140 kPa and above.
• What are the values we are getting using local papers.
Ram Kumar Sunkara - S S Consultants 56
Observation on Indian PaperObservation on Indian Paper
• “A” flute board with 150 GSM 20 BF paper in fluting: Observed FCT 79 to 88 kPa
• “A” flute board with 180 GSM 20 BF paper in fluting: Observed FCT 94 to 102 kPa
• “B” flute board with 180 GSM 24 BF paper in fluting: Observed FCT 190 to 203 kPa
Ram Kumar Sunkara - S S Consultants 57
Observation on Indian PaperObservation on Indian Paper
• These readings are not at all encouraging.
• There has to be improvement in these values.
• At least 20% reduction in GSM with a corresponding increase of 20% in FCT.
• Why FCT is important?
Ram Kumar Sunkara - S S Consultants 58
Impact of FCT on ECTImpact of FCT on ECT
• Lower FCT values will mean the board will get crushed in converting operations like printing, die cutting etc.
• Loss of caliper means loss of ECT
• Loss of ECT means, loss of compression strength.
Ram Kumar Sunkara - S S Consultants 59
Caliper Loss Vs ECTCaliper Loss Vs ECT
36
37
38
39
40
41
42
43
44
0.0 0.1 0.2 0.3 0.4 0.5 0.6 0.7 0.8 0.9 1.0 1.1 1.2 1.3 1.4
E C
T in
lbs
/ in
Caliper loss in mm
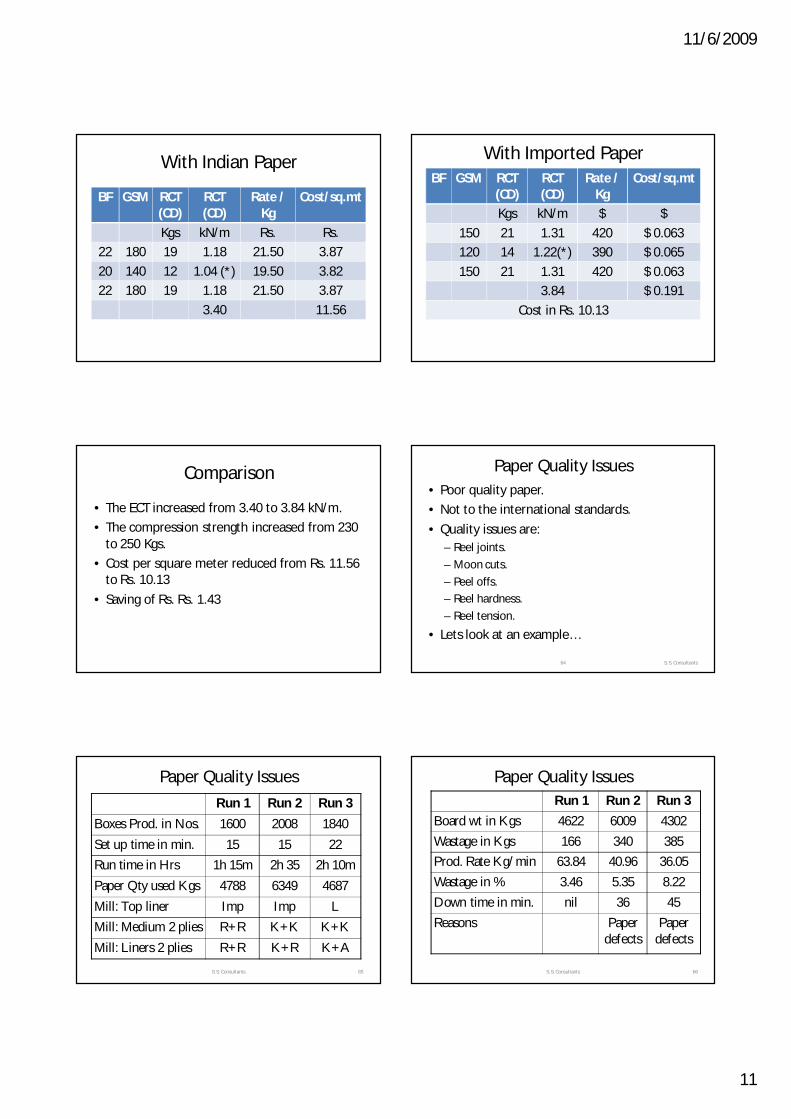
Example of RCT impact
• MNC company
• Size: 535 mm X 440 mm X 380 mm
• Ply: 3, Flute: C
• Required C.S : 230 Kgs.
11/6/2009
11
With Indian Paper
BF GSM RCT(CD)
RCT (CD)
Rate / Kg
Cost/sq.mt
Kgs kN/m Rs. Rs.22 180 19 1.18 21.50 3.87
20 140 12 1.04 (*) 19.50 3.8222 180 19 1.18 21.50 3.87
3.40 11.56
With Imported PaperBF GSM RCT
(CD)RCT (CD)
Rate / Kg
Cost/sq.mt
Kgs kN/m $ $
150 21 1.31 420 $ 0.063120 14 1.22(*) 390 $ 0.065
150 21 1.31 420 $ 0.0633.84 $ 0.191
Cost in Rs. 10.13
Comparison
• The ECT increased from 3.40 to 3.84 kN/m.
• The compression strength increased from 230 to 250 Kgs.
• Cost per square meter reduced from Rs. 11.56 to Rs. 10.13
• Saving of Rs. Rs. 1.43
64 S. S. Consultants
Paper Quality Issues• Poor quality paper.
• Not to the international standards.
• Quality issues are:– Reel joints.
– Moon cuts.
– Peel offs.– Reel hardness.
– Reel tension.
• Lets look at an example…
65S. S. Consultants
Paper Quality Issues
Run 1 Run 2 Run 3Boxes Prod. in Nos. 1600 2008 1840Set up time in min. 15 15 22Run time in Hrs 1h 15m 2h 35 2h 10mPaper Qty used Kgs 4788 6349 4687Mill: Top liner Imp Imp LMill: Medium 2 plies R+R K+K K+KMill: Liners 2 plies R+R K+R K+A
66S. S. Consultants
Paper Quality IssuesRun 1 Run 2 Run 3
Board wt in Kgs 4622 6009 4302Wastage in Kgs 166 340 385Prod. Rate Kg/min 63.84 40.96 36.05Wastage in % 3.46 5.35 8.22Down time in min. nil 36 45Reasons Paper
defectsPaper
defects

11/6/2009
12
Down time due to bad paper
Month Aug 09 Sept 09 Oct 09
Total Down time (min) 7594 7963 7738Down time due to paper defect (min.)
2269 2535 1964
No of times 488 533 446% of total time 29.33 31.83 25.46
What the corrugation Industry expects
• Provide test certificates.
• Mention linear meter on the reels.
• Standardization of GSM and BF.
• Larger roll diameters.
Loose winding Loose winding
Examples of Bad Paper
• No joints.
• Non Uniform winding.
• Wet Streaks.
• Air Piping.
Imported Liner Kraft

11/6/2009
13
Imported Medium