the embryonic evolution of museum networks: evidences from
TRANSCRIPT
The Embryonic Evolution of Museum Networks: Evidences from a Network Analysis
Fernando G. Alberti Assistant Professor, LIUC, Italy
Chiara Bernardi
Lecturer, LIUC, Italy
Davide Moro Ph.D Candidate, LIUC, Italy
Alessandro Sinatra Professor, LIUC, Italy
Fernando G. Alberti, Ph.D in Business Administration at LIUC, where he is Assistant Professor of Strategic Management and Director of CERMEC. He is also affiliated with the Jönköping International Business School. Chiara Bernardi, Ph.D in Business Administration at LIUC, where she is Researcher at CERMEC and Lecturer of Strategic Management. She is also affiliated with the Università della Svizzera Italiana. Davide Moro, Ph.D Candidate in Business Administration at LIUC, where he is Researcher of CERMEC. Alessandro Sinatra, Professor of Strategic Management and Director of the Department of Business Administration at LIUC, where he is also President of CERMEC. Abstract The formation of networks among museums is a recent and growing phenomenon which deserves further studies. Research on the Italian case show that networking among museums is still in an embryonic phase and cooperation is initiated and supported mainly by local institutions and governmental bodies, given the small size and the geographical dispersion of museums. The present paper contributes to a further understanding of the phenomenon of museum networks, offering empirical validation to theoretical hypotheses derived from the literature on museum networks in their embryonic evolution. The paper relies on data derived from roster questionnaires delivered to respondents from two Italian museum networks in different phases of their embryonic evolution. Keywords Museum, network, network analysis, evolution, Italy Introduction The interest towards museum networks – able to improve and simplify managerial matters in museums – dates back to 1977 for the Italian case, however it assumes a new centrality in the 1990s. In that period the dramatic increase of the number of Italian museums as well as their small scale and diffusion in the territory called for new organizational and managerial approaches consistent with such Italian museums’ peculiarities (Bagdadli, 2001a). The need to
1

raise financial funds and the quest for rationalizing the use of scarce resources in order to avoid waste and, where possible, to reduce redundant expenses, suggested the turn to new organisational forms (Anselmi et al., 2004). Recent regulations about cultural heritage have raised the need for new professional profiles and new managerial models applicable to Italian museums (Gavinelli, 2004). Nowadays, also in Italy, new network organisations between museums have been designed and started (Bagdadli, 1995). Hence, we have the opportunity to study in depth such a phenomenon in order to understand the ways these organisations act and coordinate, the reasons for their creation and the advantages of such a network form. The peculiarities of the Italian museum system call for organisational approaches which differ from those implemented in Countries such USA1 or France2. Hence, the constitution of museum networks seems to yield the best results and outcomes in Italy, where about 3.600 museums operate and most of them are small-sized. Further, as highlighted by Bodo (1994), more than 1.000 of those 3.600 museums lack dedicated personnel. These features prevent the exploitation economies of scale and scope. Hence, the single museum, isolated within its specificity, is not able to face problems arising from the new social environment and from technical and organizational constraints, which are typical of the contemporaneous enterprises. Moving from these constraints, it emerges the need for museums to join together under a network form, in order to share resources and competencies and to run joint projects. Furthermore, in Italy we are still facing an embryonic phase of the forming of museum networks. This phase is generally stimulated and driven by local institutions (often the Province) and supported by regional provisions that support the action of Provinces and Municipalities (Bagdadli, 2001b). According to this picture, it is necessary to study in depth those issues that can increase our understanding and knowledge of museum networks in their embryonic evolution: − first of all, as typical of social research about raising phenomena, museum networks have
been analysed and investigated through the elaboration of explorative case studies, sometimes with an anecdotal profile, sometimes developed with teaching purpose, sometimes focused on the single node without considering the network as a whole; nevertheless, these studies have not been deepened along a period of time sufficiently wide in order to understand the forming and the development of museum networks from a process perspective;
− secondly, despite the studies about museum networks have been focused on the relationships between museums themselves and between museums and other local institutions, there is a lack of studies aimed at measuring such relationships and, thus, at offering an empirical evidence about the evolution of the relational structure which characterizes museum networks.
These considerations have led us to focus our research on a phase of a museum network evolution that is considered as the most critical one and less investigated, i.e. their embryonic evolution. Hence, the aim of this paper is to contribute to the study of inter-organisational relations in the field of museum management, exploring in depth the roles, the structure and the mechanisms
2
which characterize the embryonic evolution of museum networks. In order to reach this goal we have chosen a perspective and a research technique that is not so widespread and commonly used in the field of museum management: the network analysis. The Literature on Museum Networks: a Focus on Embryonic Evolution The turn to museum networks is opening new frontiers for the managerial and organisational policies of the cultural heritage. Several local administrations have already launched museum networks, whereas others are now involved in their start-up: it is hence emerging the opportunity to analyse cases already developed in Italy and abroad. The network, preliminary defined as a set of no-competitive relationships which connect autonomous entities without any unitary control and guide (Powell and Smith-Doerr, 1994), has reached empirical importance in all sectors during the last two decades. The literature provides cases of museums networks (Bagdadli, 1997; 2003; Baroncelli and Boari, 1999; Zan, 1999), networks for the development of museum clusters and districts (Santagata, 2000; Lazzeretti, 2001; Valentino, 2003), systems of integrated tourist and cultural offering (Crisci and Moretti, 2002; Venturini, 2004) and other types of inter-organisational structures. But what is a museum network? As a network we mean in this paper a set of nodes and ties that link them together (Fombrun, 1982). More specifically often the term inter-organisational relations (IOR) is used. This indicates those relationships which arise when “one or more organisations share and exchange each other any kind of resources (money, equipments and materials, customers, suppliers, specialised services) in order to yield results that, otherwise, organisations could not separately gain” (Van de Ven, 1976). The start-up of networks seems to be the organisational answer to those challenges that museums are progressively facing. Besides, the museum networks are comprised within those objectives set by provisions at different institutional levels. Local bodies and institutions have played an active role along this process aiming at reorganising Italian museums, participating to the design and the implementation of museum networks. The debate upon these organisational frameworks is relatively recent and the present experiences are now characterised by an ongoing reshaping. Literature on museum networks has relied on the study of cases able to show the reasons for and the structure of IOR. The reasons for acting as a network in the museum field are linked to the reach of economic efficiency (Williamson, 1985), the need to gain legitimization and prestige, to meet law requirements and to follow isomorphic processes (Oliver, 1990; Di Maggio and Powell, 1991). Networks, which rise with the goal to share resources, are rare (Chung et al., 2000). Oliver (1990) suggests six different conditions for the rise of inter-organisational relations: a) need; b) asymmetry; c) reciprocity; d) efficiency; e) steadiness; f) legitimization. Bagdadli (2001b) supports these considerations in her empirical studies, highlighting three main categories of reasons for starting a network among museums: a) the call for economic efficiency; b) the isomorphic processes; c) the complementarity of resources. The economic analysis (i.e. Katz and Shapiro, 1985; Economides, 1996), suggest relevant positive externalities deriving from a network which can lead different subjects to prefer the participation instead of the isolation (Lanzi and Sacco, 2003). Studies carried out till now (e.g. Danilov, 1990; Bagdadli, 1997; 2001a), suggest that through networks it is possible to gain relevant advantages. Such advantages generally offset costs of functioning – the higher cost for
3
coordinating the network and those rising from the management of conflicts – which represent the main drawbacks (Van de Ven, 1976). Concerning the structure and the forms through which a museum network could be realised, literature shows that relations between museums could be of different nature: from informal links, that are simple exchanges of material and information, to the constitution of structured committees within which organisational plans are carried out, to the identification of an external coordinator or of an internal organisation that represents a melting pot for all the subjects belonging to the network. More precisely, it we can distinguish voluntary networks from induced networks, where an external spur is recognisable, as in the case of institutions that stimulate the birth of networks among museums. Literature identifies three macro-typologies of inter-organisational networks: social networks, bureaucratic networks and equity-based networks (Grandori and Soda, 1995). Cases of bureaucratic networks prevail among museums – at least in the Italian scene – since they originate from isomorphic processes, governmental interventions or specific laws. Studies conducted by Bagdadli (1995) through Italian case studies show that networking among museums is still in an embryonic phase and cooperation is initiated and supported mainly by local institutions and governmental bodies, given the small size and the geographical dispersion of museums. Further, literature on Italian museum networks indicate that the province is the most significant geographical scale at which networks among museums take place, and the Province government is often the initiator and coordinator of the network. In conclusion, museum networks studied in literature (e.g. Bagdadli, 2001b and Sinatra et al. 2002) have several commonalities: they are bureaucratic networks, built on protocols and formal agreements; they are composed by several museums; they are highly centralized and central roles are taken by local institutions; the density of the network is low in general. Some authors moved from the analysis of the organizational structure of museum networks to the consideration of their evolution in time, abandoning a static view and embracing a process perspective. According to Scheff and Kotler (1996) the evolution of a museum network largely depends on some critical factors which they identify in: a) definition of the mission; b) building of consensus; c) building of trust; d) communication; e) definition of leaders and involvement of single museums; f) commitment towards adequate resources. Time plays, thus, a central role in this discussion. Since time is at the base of the achievement of all the critical factors proposed by Scheff and Kotler (1996): for instance trust and consensus need time to emerge as well as knowing one each other. This discussion introduces the need for studying the phenomenon of museum networks in its evolution in time. Such an evolution may be conveniently divided in phases – i.e. in time segments – where the museum network is supposed to assume different structural characteristics. Gavinelli (2004), complying with such an approach, proposes a model of museum networks evolution divided in four phases: a) the project, which represents the starting point of a museum network; b) the experimentation, which refers to the first activities of the new museum network; c) the running, which is the normal activity of a consolidated museum network; d) the integration, which is the maturity of a museum network, recognized as a single organization. According to this model, however, the vast majority of Italian museum networks may be correctly positioned in the first phase of evolution, since almost all museum networks are still in their embryonic stage. Bernardi (2005) deals with this problem and proposes a focus on the embryonic evolution of museum networks. According to Bernardi (2005) the embryonic evolution of a museum network may be divided in four phases. A first phase is characterized by the absence of relations among
4
museums, which operate in isolation one from each other. Even occasion to meet together or organize collective events are reduced to the minimum. The second phase is characterized by the emerging of sporadic relations among local museums. These tend to occur thanks to the input and the support of local institutions, which promote collective projects and events in order to foster networking through trust and consensus. In these early phases of the embryonic evolution of museum networks the leadership of the network is exerted by the local government, typically the Province, which maintains central positions in all types of relations within the network. This central role played by local institutions is expected to be reduced in time with the concurrent appearing of museums in central positions. The next phase is, then, characterized by a multiplicity of central actors (museums) and a strengthening of the network connectivity, which is supposed to become more dense. A fourth and final phase is characterized by a further strengthening and maturation of relations among museums, which start to operate as a network, with tentative collective projects and activities. This phase indicates also the exit from the embryonic evolution of a museum network. Summing up what the literature review on museum networks suggests we can formulate the following hypotheses which will be tested empirically in the next section of this paper. Hypothesis 1. In the early phases of the embryonic evolution of museum networks the density
of the network is lower than in the later phases. Hypothesis 2. In the early phases of the embryonic evolution of museum networks ties among
nodes are centred around the local government which is the network initiator. Hypothesis 3. In the later phases of the embryonic evolution of museum networks ties among
nodes are multi-centred and central positions are taken by museums rather than the local government.
Hypothesis 4. In the later phases of the embryonic evolution of museum networks the overall
connectivity of the network is less dependent on one or a few nodes compared to what happens in the earlier phases.
Method Empirical setting Our analysis focuses on two museum networks in different phases of their embryonic evolution (according to the model of Bernardi, 2005). The choice of the two empirical settings was guided by indications from local policy makers and experts and by the following criteria: a) museum networks located in the Lombardy Region for logistic convenience and budget constraints; b) museum networks in different phases of their embryonic evolution. The joint consideration of these criteria, applied to the 12 museum networks located in the Lombardy Region3, brought to the selection of the museum network of Mantova and the one of Lodi. The museum network of Mantova. The city of Mantova and its province are areas with a marked concentration of cultural, artistic and environmental heritage. The city of Mantova, in particular, is very rich from the cultural point of view, thanks to the relevance that the city had in the Middle Age and under the rule of the Gonzaga family. In the city and in the province of Mantova there are about 40 museums. The city has 13 museums, 2 of them particularly important from the cultural and the heritage point of view, i.e. Palazzo Te and Palazzo Ducale. In the province,
5
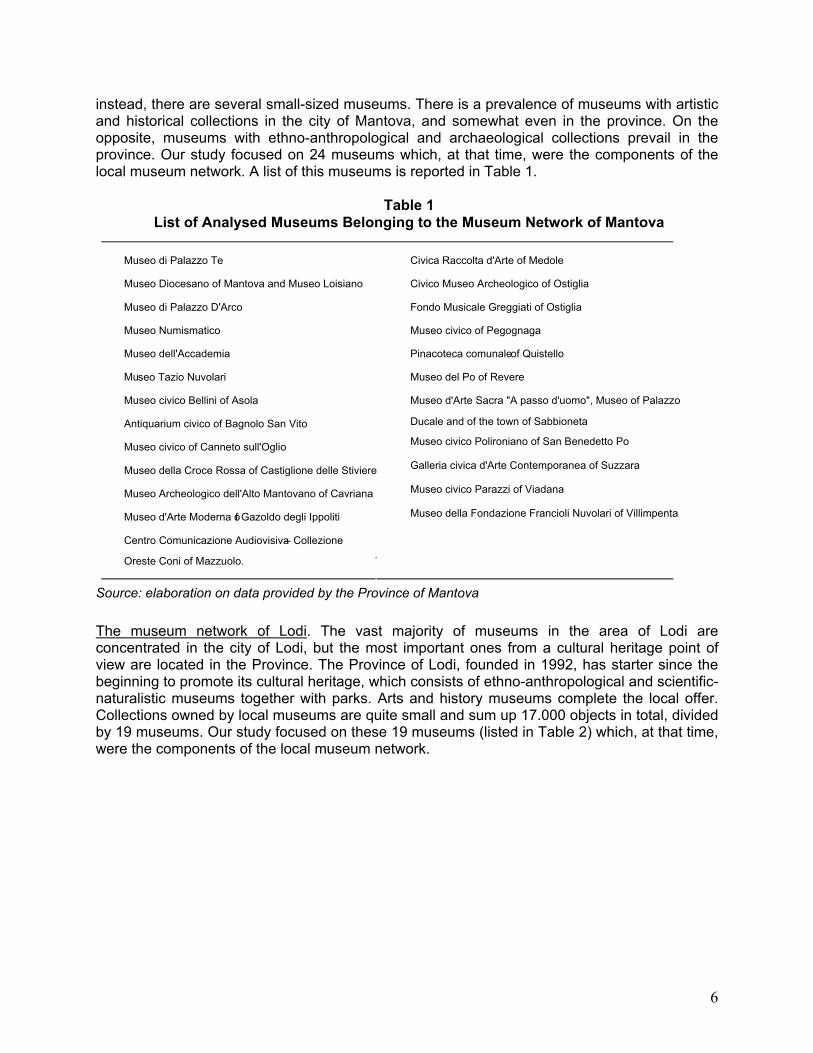
instead, there are several small-sized museums. There is a prevalence of museums with artistic and historical collections in the city of Mantova, and somewhat even in the province. On the opposite, museums with ethno-anthropological and archaeological collections prevail in the province. Our study focused on 24 museums which, at that time, were the components of the local museum network. A list of this museums is reported in Table 1.
Table 1 List of Analysed Museums Belonging to the Museum Network of Mantova
Museo di Palazzo Te Civica Raccolta d'Arte of Medole Museo Diocesano of Mantova and Museo Loisiano Civico Museo Archeologico of Ostigli a Museo di Palazzo D'Arco Fondo Musicale Greggiati of Ostigli a
The museum network of Lodi. The vast majority of museums in the area of Lodi are concentrated in the city of Lodi, but the most important ones from a cultural heritage point of view are located in the Province. The Province of Lodi, founded in 1992, has starter since the beginning to promote its cultural heritage, which consists of ethno-anthropological and scientific-naturalistic museums together with parks. Arts and history museums complete the local offer. Collections owned by local museums are quite small and sum up 17.000 objects in total, divided by 19 museums. Our study focused on these 19 museums (listed in Table 2) which, at that time, were the components of the local museum network.
Museo Numismatico Museo civico of Pegognaga Museo dell'Accademia Pinacoteca comunale of Quistello Mu seo Tazio Nuvolari Museo del Po of Revere Museo civico Bellini of Asol Museo d'Arte Sacra "A passo d'uomo", Museo of Palazzo a Antiquarium civico of Bagnolo San Vi Ducale and of the town of Sabbioneta to Museo civico of Canneto sull'Ogli Museo civico Polironiano of San Benedetto P o o Galleria civica d'Arte Contemporanea of Suzza ra Museo della Croce Rossa of Castiglione delle Stiviere Museo Archeologico dell'Alto Mantovano of Cavriana Museo civico Parazzi of Viadana
Museo d'Arte Moderna o f Gazoldo degli Ippolit Museo della Fondazione Francioli Nuvolari of Villimpenta i Centro Comunicazione Audiovisiva – Collezione
Oreste Coni of Mazzuolo.
Source: elaboration on data provided by the Province of Mantova
6
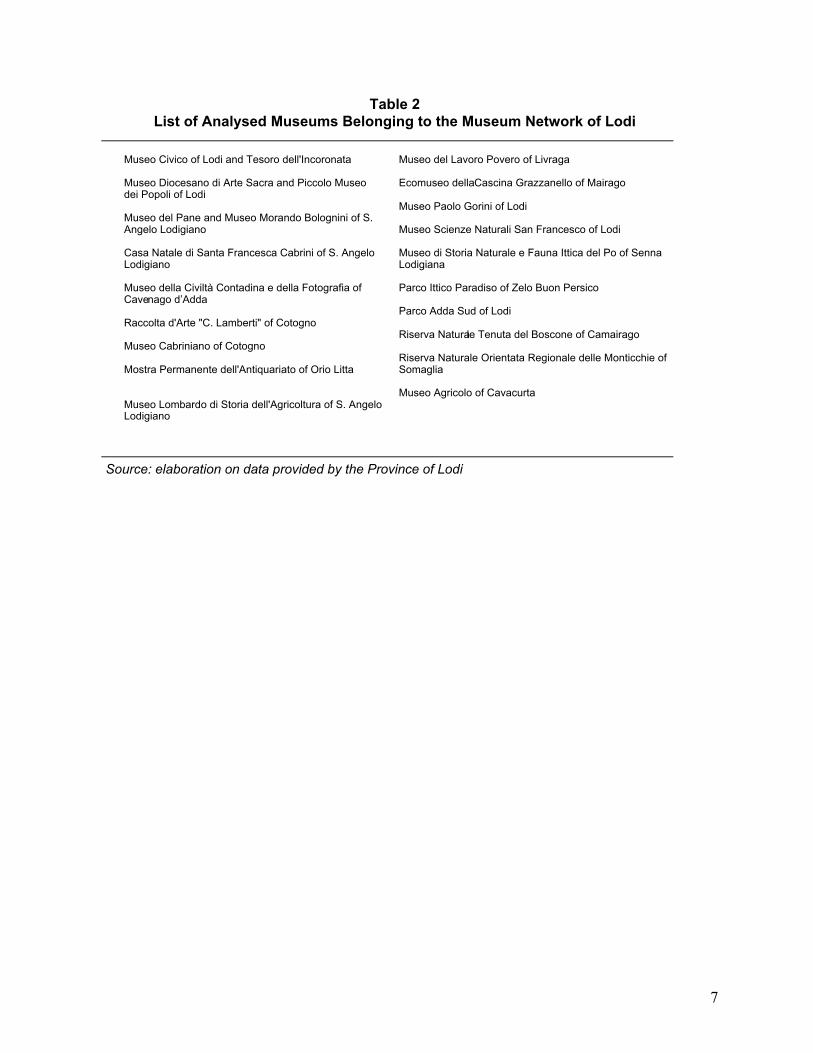
Table 2 List of Analysed Museums Belonging to the Museum Network of Lodi
Museo Civico of Lodi and Tesoro dell'Incoronata Museo del Lavoro Povero of Livraga
Museo Diocesano di Arte Sacra and Piccolo Museo dei Popoli of Lodi Museo del Pane and Museo Morando Bolognini of S. Angelo Lodigiano Casa Natale di Santa Francesca Cabrini of S. Angelo Lodigiano Museo della Civiltà Contadina e della Fotografia of Cave nago d’Adda Raccolta d'Arte "C. Lamberti" of Cotogn o Museo Cabriniano of Cotogn o Mostra Permanente dell'Antiquariato of Orio Litta Museo Lombardo di Storia dell'Agricoltura of S. Angelo Lodigiano
Ecomuseo della Cascina Grazzanello of Mairago Museo Paolo Gorini of Lodi Museo Scienze Naturali San Francesco of Lo di Museo di Storia Naturale e Fauna Ittica del Po of Senna Lodigiana Parco Ittico Paradiso of Zelo Buon Persic o Parco Adda Sud of Lodi Riserva Naturale Tenuta del Boscone of Camairago Riserva Naturale Orientata Regionale delle Monticchie of Somaglia Museo Agricolo of Cavacurta
Source: elaboration on data provided by the Province f Lodio
7
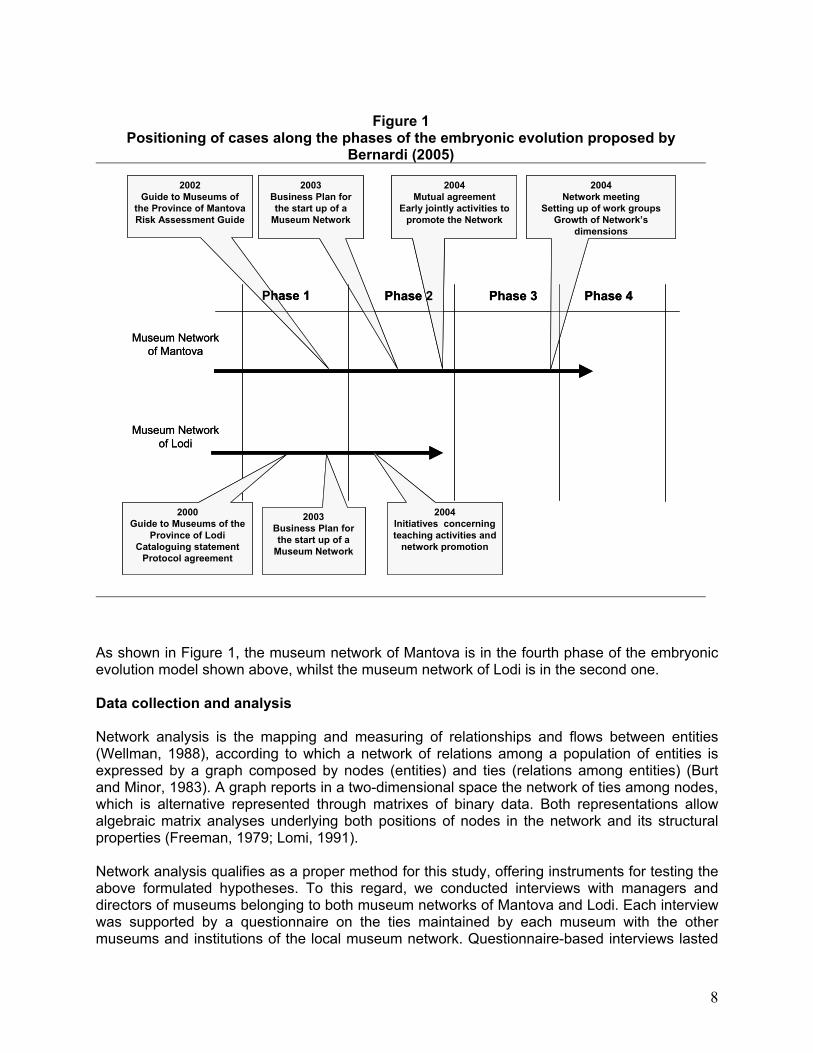
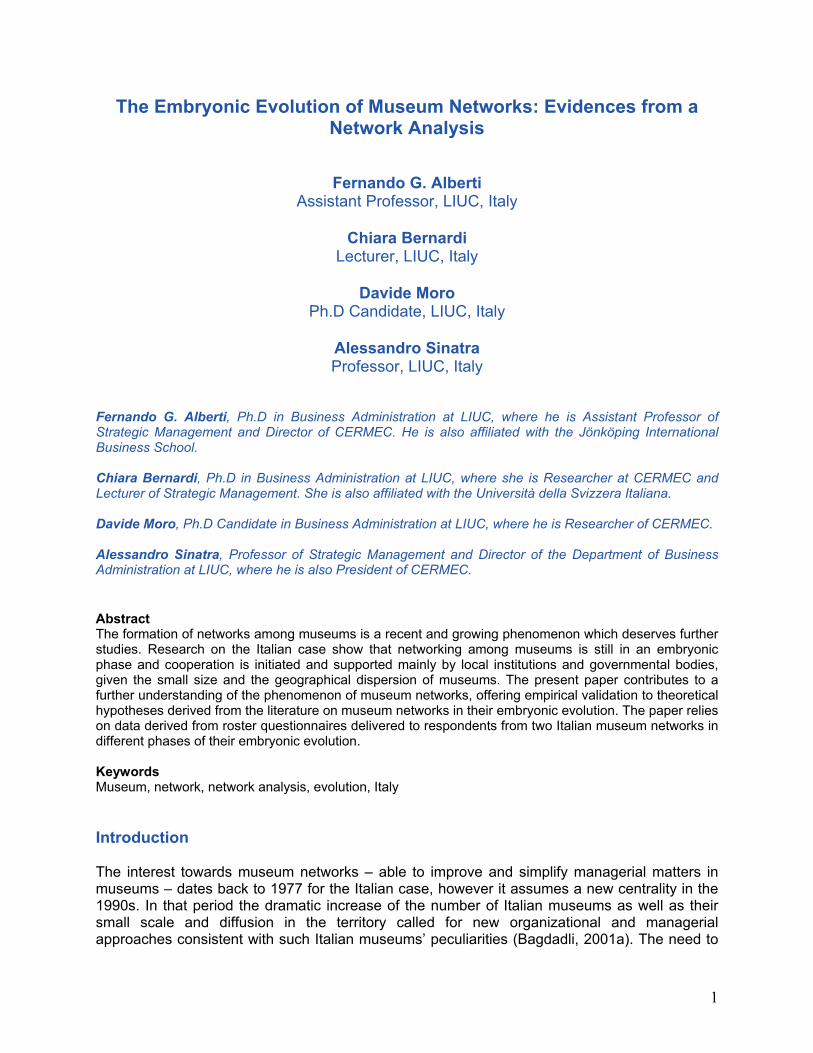
Figure 1
Positioning of cases along the phases of the embryonic evolution proposed by Bernardi (2005)
Museum Network of Mantova
Museum Network of Lodi
2002Guide to Museums of
the Province of MantovaRisk Assessment Guide
2004Mutual agreement
Early jointly activities to promote the Network
2000Guide to Museums of the
Province of Lodi Cataloguing statement
Protocol agreement
2003Business Plan for the start up of a
Museum Network
2003Business Plan for the start up of a
Museum Network
Phase 1 Phase 2 Phase 3
2004Network meeting
Setting up of work groupsGrowth of Network’s
dimensions
2004Initiatives concerning teaching activities and
network promotion
Phase 4
As shown in Figure 1, the museum network of Mantova is in the fourth phase of the embryonic evolution model shown above, whilst the museum network of Lodi is in the second one. Data collection and analysis Network analysis is the mapping and measuring of relationships and flows between entities (Wellman, 1988), according to which a network of relations among a population of entities is expressed by a graph composed by nodes (entities) and ties (relations among entities) (Burt and Minor, 1983). A graph reports in a two-dimensional space the network of ties among nodes, which is alternative represented through matrixes of binary data. Both representations allow algebraic matrix analyses underlying both positions of nodes in the network and its structural properties (Freeman, 1979; Lomi, 1991). Network analysis qualifies as a proper method for this study, offering instruments for testing the above formulated hypotheses. To this regard, we conducted interviews with managers and directors of museums belonging to both museum networks of Mantova and Lodi. Each interview was supported by a questionnaire on the ties maintained by each museum with the other museums and institutions of the local museum network. Questionnaire-based interviews lasted
8
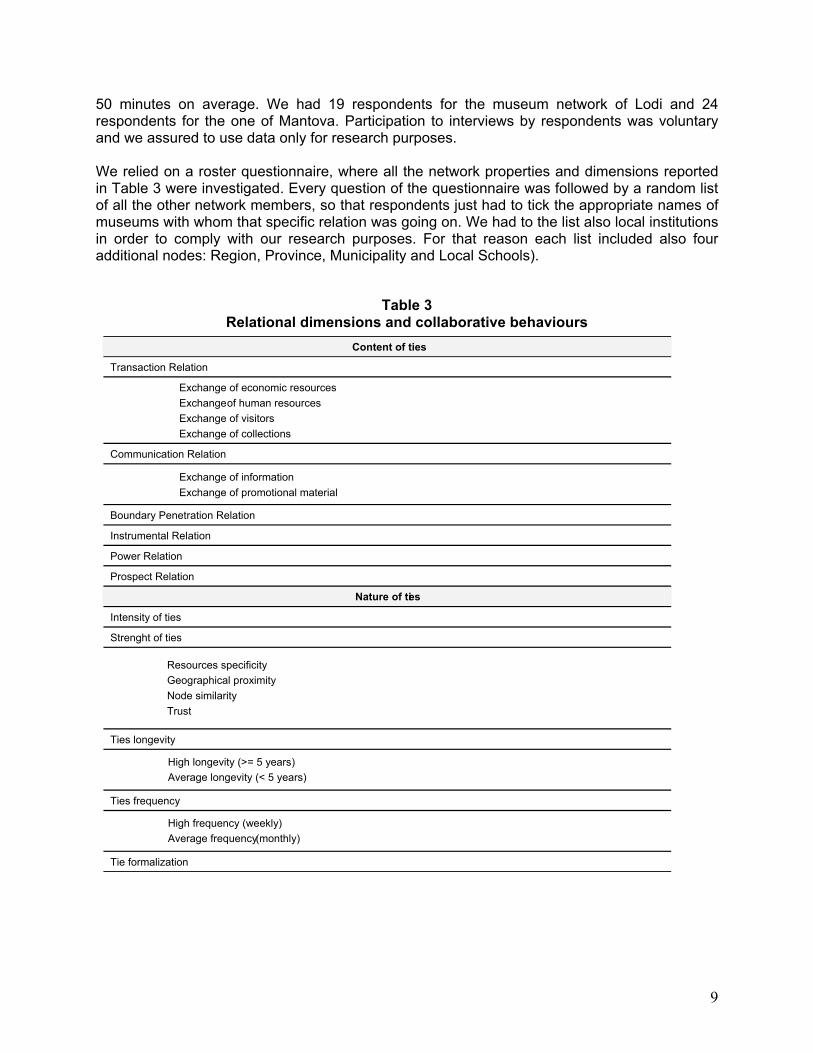
50 minutes on average. We had 19 respondents for the museum network of Lodi and 24 respondents for the one of Mantova. Participation to interviews by respondents was voluntary and we assured to use data only for research purposes. We relied on a roster questionnaire, where all the network properties and dimensions reported in Table 3 were investigated. Every question of the questionnaire was followed by a random list of all the other network members, so that respondents just had to tick the appropriate names of museums with whom that specific relation was going on. We had to the list also local institutions in order to comply with our research purposes. For that reason each list included also four additional nodes: Region, Province, Municipality and Local Schools).
Table 3
Relational dimensions and collaborative behaviours Content of ties
Transaction Relation Exchange of economic resources
Exchange of human resources Exchange of visitors Exchange of collections
Communication Relation n Exchange of informatio
Exchange of promotional material
Boundary Penetration Relation Instrumental Relation Power Relation Prospect Relation
Nature of ties Intensity of ties Strenght of ties
Resources specificity Geographical proximity
Node similarity Trust
Ties longevity High longevity (>= 5 years)
Average longevity (< 5 years) Ties frequency
High frequency (weekly) Average frequency (monthly) Tie formalization
9
Each question of the questionnaire generated a square matrix4 of data that we used for the network analysis. Square matrixes5 sized 23x23 and 28x28 respectively for the museum network of Lodi and Mantova. We reported names of respondents in the same order on both rows and columns of each matrix and indicated 1 in those cells where that particular tie occurred and 0 for opposite cases. Where necessary matrixes were dichotomized in order to have only binary data to compute. Through matrix algebraic operations we computed those variables reported in Table 3 out of all the matrixes derived from each question. Then, we computed one single variable6 which could encapsulate all possible ties occurring between each two actors of both the two museum networks. This matrix – binary, square and symmetric by the definition – was then used for all the analysis reported in the present paper. The first analysis we conducted on this matrix for both the two museum networks was the degree of connectivity, or cohesion, of each network. A measure of a network connectivity is given by the degree of relational density, equal to ratio between the number of actual ties (L) and those theoretically possible ([n(n-1)/2]):
2/)1( −=
nnLD
A second analysis we conducted regards the centrality of nodes in each of the two networks. The idea that the centrality of nodes – which expresses their degree of relational influence – may be conveniently measured by the concept of degree of a node (the number of direct connections a node has) is widely accepted in literature7, thus:
)()]([ iiD ndnC =
Already Freeman (1979: 219), in his famous paper on the concept of centrality, observed that «the simplest and perhaps the most intuitively obvious conception is that point centrality is some function of the degree of a point […] With respect to communication, a point with relatively high degree is somehow ‘in the thick of things’». Central positions are measured in both absolute and relative terms. The relative centrality [C’(ni)] of a node results from:
)1()]([
)]('[−
=n
nCnC iDiD
This measure has to be analyzed together with the degree of network centralization. As Freeman suggests «the centrality of an entire network should index the tendency of a single point to be more central than all other points in the network. Measures of a graph centrality of this type are based on differences between the centrality of the most central point and that of all others. Thus, they are indexes of the centralization of the network» (Freeman, 1979: 227). This measure offers a benchmark for evaluating individual nodes’ centrality (Wasserman and Faust, 1994: 176). Finally, we considered a measure apt to indicate the general connectivity of a network, signalling the presence of those nodes that act as bridges or connections between sub-groups. This measure is expressed by the so-called betweenness centrality of each node (Freeman, 1979):
10
]2/)2)(1[()(
)([ '
−−=
nnnCnC iB
iB
where: C ∑ <=
kj jkijkiB nnnn /)()(
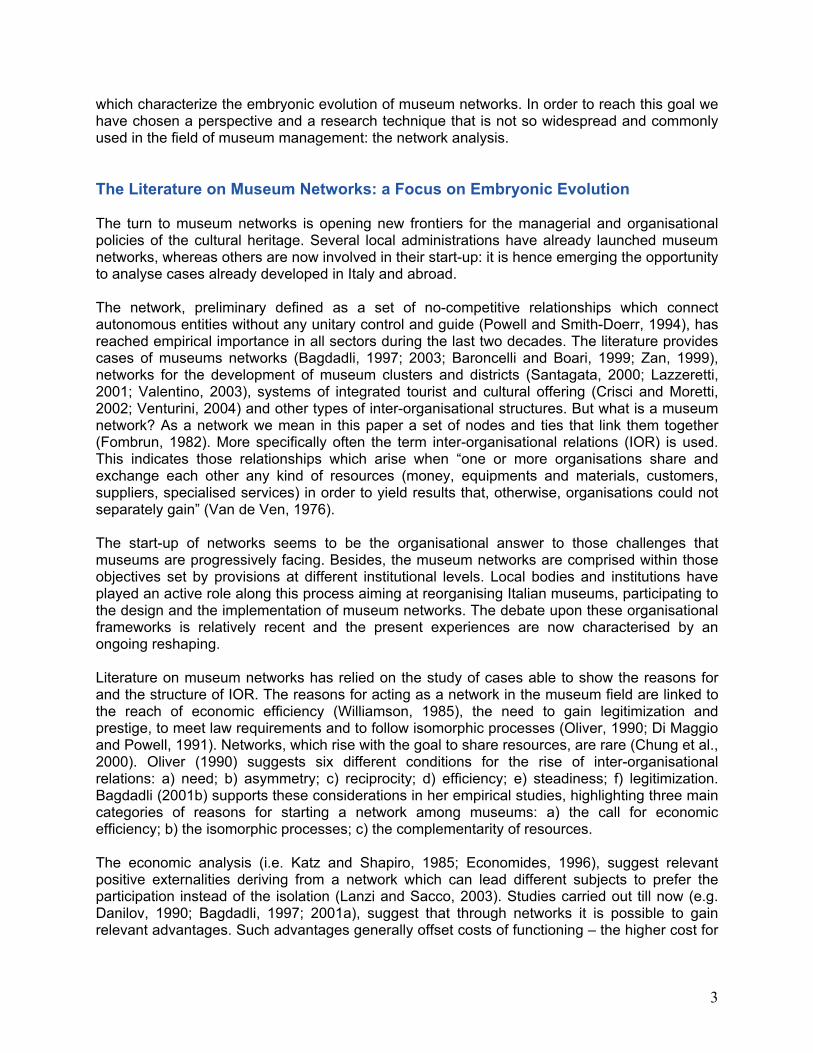
The analysis of betweenness centrality qualifies as a test of the connectivity of a network, since a node with high betweenness has great influence over what flows in the network, thus on the connectivity of the network itself. The removal of actors with very high degrees of betweenness centrality may determine the disconnection of parts or sub-groups of a network. Data collected were analyzed through a package for network analysis, i.e. UCINET 6.5™ (Borgatti, Everett and Freeman, 2002). This package allowed algebraic matrix operations and the computing of density, centrality and betweenness centrality measures for both museum networks. Network graph were elaborated through the use of another package, i.e. NETDRAW 1.0™, exporting matrixes from UCINET 6.5™ (Borgatti, 2002). Findings of the network analysis Complying with the methodological considerations above, first we computed one single variable for each museum network encompassing all possible relations among local museums and institutions. This variable, in the form of a symmetric binary matrix is reported in Table 4 for the museum network of Mantova and in Table 5 for the one of Lodi. The first analysis we conducted regards the density – i.e. the degree of connectivity of a network – of the two museum networks considered in this study. The density of the museum network of Mantova is 0.7037. This high value is consistent with the fact that the museum network of Mantova is, as shown, in a later phase of its embryonic evolution. A graph reporting all ties occurring in this network is shown in Figure 2.
11
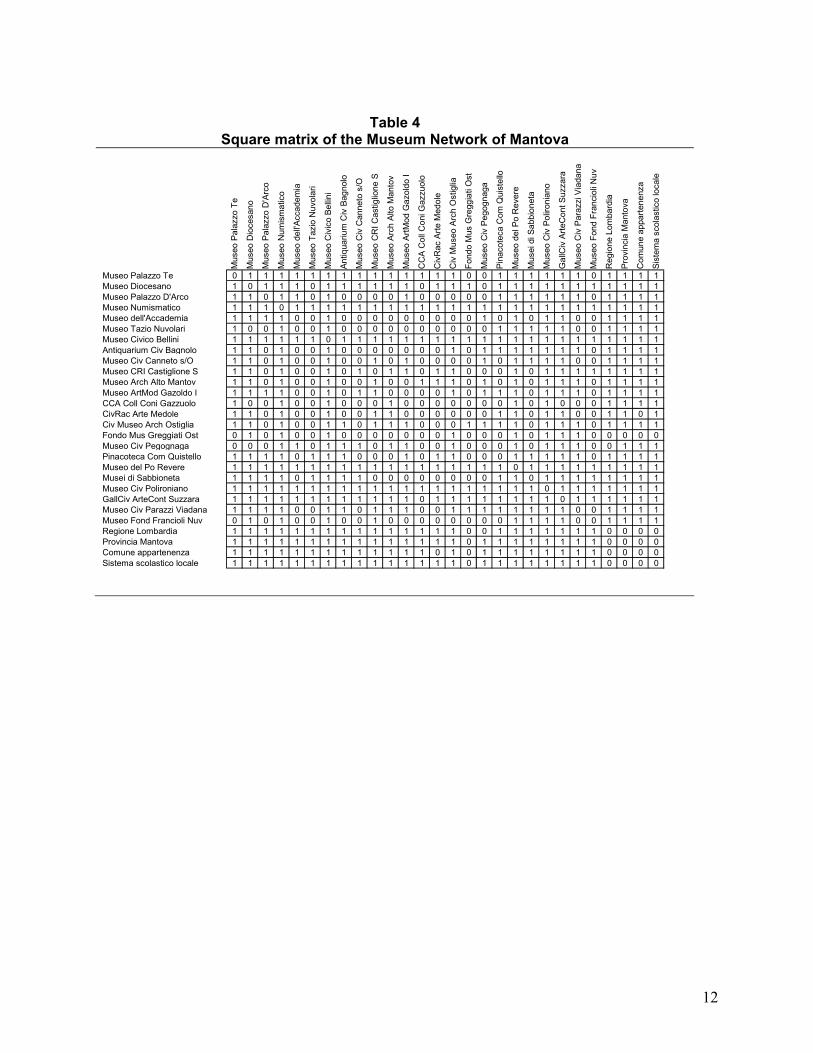
Table 4
Square matrix of the Museum Network of Mantova
Mus
eo P
alaz
zo T
e
Mus
eo D
ioce
sano
Mus
eo P
alaz
zo D
'Arc
o
Mus
eo N
umis
mat
ico
Mus
eo d
ell'A
ccad
emia
Mus
eo T
azio
Nuv
olar
i
Mus
eo C
ivic
o Be
llini
Antiq
uariu
m C
iv B
agno
lo
Mus
eo C
iv C
anne
to s
/O
Mus
eo C
RI C
astig
lione
S
Mus
eo A
rch
Alto
Man
tov
Mus
eo A
rtMod
Gaz
oldo
I
CC
A C
oll C
oni G
azzu
olo
Civ
Rac
Arte
Med
ole
Civ
Mus
eo A
rch
Ost
iglia
Fond
o M
us G
regg
iati
Ost
Mus
eo C
iv P
egog
naga
Pina
cote
ca C
om Q
uist
ello
Mus
eo d
el P
o R
ever
e
Mus
ei d
i Sab
bion
eta
Mus
eo C
iv P
oliro
nian
o
Gal
lCiv
Arte
Con
t Suz
zara
Mus
eo C
iv P
araz
zi V
iada
na
Mus
eo F
ond
Fran
ciol
i Nuv
Reg
ione
Lom
bard
ia
Prov
inci
a M
anto
va
Com
une
appa
rtene
nza
Sist
ema
scol
astic
o lo
cale
Museo Palazzo Te 0 1 1 1 1 1 1 1 1 1 1 1 1 1 1 0 0 1 1 1 1 1 1 0 1 1 1 1Museo Diocesano 1 0 1 1 1 0 1 1 1 1 1 1 0 1 1 1 0 1 1 1 1 1 1 1 1 1 1 1Museo Palazzo D'Arco 1 1 0 1 1 0 1 0 0 0 0 1 0 0 0 0 0 1 1 1 1 1 1 0 1 1 1 1Museo Numismatico 1 1 1 0 1 1 1 1 1 1 1 1 1 1 1 1 1 1 1 1 1 1 1 1 1 1 1 1Museo dell'Accademia 1 1 1 1 0 0 1 0 0 0 0 0 0 0 0 0 1 0 1 0 1 1 0 0 1 1 1 1Museo Tazio Nuvolari 1 0 0 1 0 0 1 0 0 0 0 0 0 0 0 0 0 1 1 1 1 1 0 0 1 1 1 1Museo Civico Bellini 1 1 1 1 1 1 0 1 1 1 1 1 1 1 1 1 1 1 1 1 1 1 1 1 1 1 1 1Antiquarium Civ Bagnolo 1 1 0 1 0 0 1 0 0 0 0 0 0 0 1 0 1 1 1 1 1 1 1 0 1 1 1 1Museo Civ Canneto s/O 1 1 0 1 0 0 1 0 0 1 0 1 0 0 0 0 1 0 1 1 1 1 0 0 1 1 1 1Museo CRI Castiglione S 1 1 0 1 0 0 1 0 1 0 1 1 0 1 1 0 0 0 1 0 1 1 1 1 1 1 1 1Museo Arch Alto Mantov 1 1 0 1 0 0 1 0 0 1 0 0 1 1 1 0 1 0 1 0 1 1 1 0 1 1 1 1Museo ArtMod Gazoldo I 1 1 1 1 0 0 1 0 1 1 0 0 0 0 1 0 1 1 1 0 1 1 1 0 1 1 1 1CCA Coll Coni Gazzuolo 1 0 0 1 0 0 1 0 0 0 1 0 0 0 0 0 0 0 1 0 1 0 0 0 1 1 1 1CivRac Arte Medole 1 1 0 1 0 0 1 0 0 1 1 0 0 0 0 0 0 1 1 0 1 1 0 0 1 1 0 1Civ Museo Arch Ostiglia 1 1 0 1 0 0 1 1 0 1 1 1 0 0 0 1 1 1 1 0 1 1 1 0 1 1 1 1Fondo Mus Greggiati Ost 0 1 0 1 0 0 1 0 0 0 0 0 0 0 1 0 0 0 1 0 1 1 1 0 0 0 0 0Museo Civ Pegognaga 0 0 0 1 1 0 1 1 1 0 1 1 0 0 1 0 0 0 1 0 1 1 1 0 0 1 1 1Pinacoteca Com Quistello 1 1 1 1 0 1 1 1 0 0 0 1 0 1 1 0 0 0 1 1 1 1 1 0 1 1 1 1Museo del Po Revere 1 1 1 1 1 1 1 1 1 1 1 1 1 1 1 1 1 1 0 1 1 1 1 1 1 1 1 1Musei di Sabbioneta 1 1 1 1 0 1 1 1 1 0 0 0 0 0 0 0 0 1 1 0 1 1 1 1 1 1 1 1Museo Civ Polironiano 1 1 1 1 1 1 1 1 1 1 1 1 1 1 1 1 1 1 1 1 0 1 1 1 1 1 1 1GallCiv ArteCont Suzzara 1 1 1 1 1 1 1 1 1 1 1 1 0 1 1 1 1 1 1 1 1 0 1 1 1 1 1 1Museo Civ Parazzi Viadana 1 1 1 1 0 0 1 1 0 1 1 1 0 0 1 1 1 1 1 1 1 1 0 0 1 1 1 1Museo Fond Francioli Nuv 0 1 0 1 0 0 1 0 0 1 0 0 0 0 0 0 0 0 1 1 1 1 0 0 1 1 1 1Regione Lombardia 1 1 1 1 1 1 1 1 1 1 1 1 1 1 1 0 0 1 1 1 1 1 1 1 0 0 0 0Provincia Mantova 1 1 1 1 1 1 1 1 1 1 1 1 1 1 1 0 1 1 1 1 1 1 1 1 0 0 0 0Comune appartenenza 1 1 1 1 1 1 1 1 1 1 1 1 1 0 1 0 1 1 1 1 1 1 1 1 0 0 0 0Sistema scolastico locale 1 1 1 1 1 1 1 1 1 1 1 1 1 1 1 0 1 1 1 1 1 1 1 1 0 0 0 0
12

Table 5
Square matrix of the Museum Network of Lodi
Mus
Dio
cArte
Sac
ra e
Pic
Mus
Pop
oli
Rac
colta
arte
C L
ambe
rti
Mus
eo C
ivLo
di e
Tes
oro
Inco
rona
ta
Mus
eo P
ane
e M
oran
do B
olog
nini
Mus
eo L
ombS
toria
Agr
ic S
Ang
elo
Mus
eo P
aolo
Gor
ini
Mus
eo C
abrin
iano
Cod
ogno
Mus
eo S
cNat
ural
i S F
ranc
esco
Mus
eo A
gric
olo
Cav
acur
ta
Mus
eo C
ivC
onta
dina
e F
otog
rafia
Cav
Add
a
Mus
eo L
avP
over
o Li
vrag
a
Eco
mus
eo C
asci
na G
razz
anel
lo
Mos
tra P
erm
anen
te A
ntiq
uaria
to
Cas
a N
atal
e S
Fran
cesc
aCab
rini
Mus
eo S
tNat
ural
e S
enna
Lod
igia
na
Par
co It
tico
Par
adis
o
Par
co A
dda
Sud
Ris
erva
Nat
ural
e B
osco
ne
Ris
erva
Nat
ural
e M
ontic
chie
Reg
ione
Lom
bard
ia
Pro
vinc
ia d
i Lod
i
Com
une
di a
ppar
tene
nza
Sis
tem
a S
cola
stic
o Lo
cale
Mus DiocArteSacra e PicMusPopoli 0 0 1 1 0 0 0 0 0 0 0 0 0 0 0 0 0 0 0 0 0 0 0Raccolta arte C Lamberti 0 0 1 0 0 0 1 0 1 0 0 0 0 0 0 0 0 0 0 1 1 1 1Museo CivLodi eTesoro Incoronata 1 1 0 1 1 0 0 0 0 0 0 0 0 0 0 0 0 0 0 1 1 1 1Museo Pane e Morando Bolognini 1 0 1 0 1 0 0 0 1 1 1 0 0 1 0 0 0 0 0 1 1 1 1Museo LombStoria Agric S Angelo 0 0 1 1 0 0 0 0 1 1 1 0 0 1 0 0 0 0 0 1 1 1 1Museo Paolo Gorini 0 0 0 0 0 0 0 0 0 0 0 0 0 0 0 0 0 0 0 0 0 0 0Museo Cabriniano Codogno 0 1 0 0 0 0 0 0 0 0 0 0 0 1 0 0 0 0 0 1 1 0 0Museo ScNaturali S Francesco 0 0 0 0 0 0 0 0 0 0 0 0 0 0 0 0 0 0 0 1 1 0 1Museo Agricolo Cavacurta 0 1 0 1 1 0 0 0 0 0 1 0 0 0 0 0 0 0 0 0 1 1 1Museo CivContadina e Fotografia CavAdda 0 0 0 1 1 0 0 0 0 0 1 0 0 0 0 0 0 0 0 1 1 1 1Museo LavPovero Livraga 0 0 0 1 1 0 0 0 1 1 0 1 0 1 0 0 0 0 0 1 1 1 1Ecomuseo Cascina Grazzanello 0 0 0 0 0 0 0 0 0 0 1 0 0 0 0 0 1 0 0 1 1 0 1Mostra Permanente Antiquariato 0 0 0 0 0 0 0 0 0 0 0 0 0 0 0 0 0 0 0 0 1 1 1Casa Natale SFrancescaCabrini 0 0 0 1 1 0 1 0 0 0 1 0 0 0 0 0 0 0 0 0 1 1 1Museo StNaturale Senna Lodigiana 0 0 0 0 0 0 0 0 0 0 0 0 0 0 0 0 0 0 0 0 1 0 1Parco Ittico Paradiso 0 0 0 0 0 0 0 0 0 0 0 0 0 0 0 0 1 0 1 1 1 1 1Parco Adda Sud 0 0 0 0 0 0 0 0 0 0 0 1 0 0 0 1 0 1 1 1 1 1 1Riserva Naturale Boscone 0 0 0 0 0 0 0 0 0 0 0 0 0 0 0 0 1 0 1 1 1 1 1Riserva Naturale Monticchie 0 0 0 0 0 0 0 0 0 0 0 0 0 0 0 1 1 1 0 1 1 1 1Regione Lombardia 0 1 1 1 1 0 1 1 0 1 1 1 0 0 0 1 1 1 1 0 0 0 0Provincia di Lodi 0 1 1 1 1 0 1 1 1 1 1 1 1 1 1 1 1 1 1 0 0 0 0Comune di appartenenza 0 1 1 1 1 0 0 0 1 1 1 0 1 1 0 1 1 1 1 0 0 0 0Sistema Scolastico Locale 0 1 1 1 1 0 0 1 1 1 1 1 1 1 1 1 1 1 1 0 0 0 0
13

Figure 2
Graph of the Museum Network of Mantova
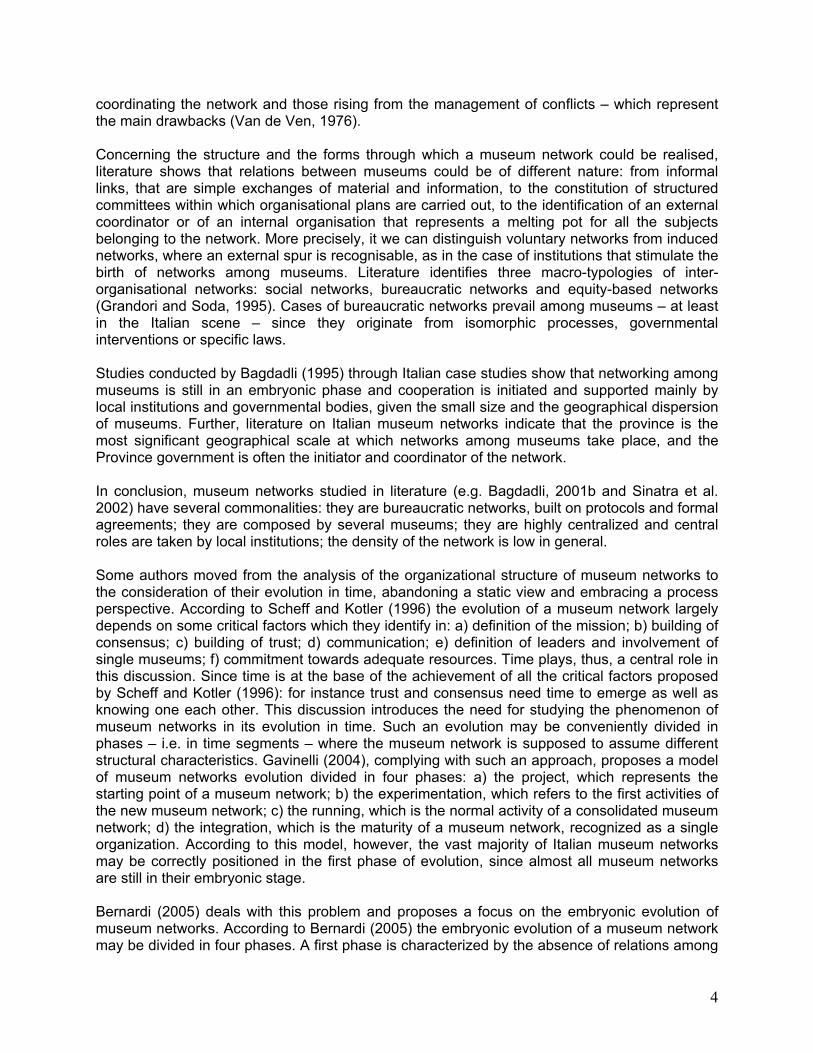
Figure 3
Graph of the Museum Network of Lodi
14
The museum network of Lodi has a density degree of 0.3399. Again, this low value is consistent with the fact that the museum network of Lodi is in an early phase of its embryonic evolution. A graph reporting all ties occurring in this network is shown in Figure 3. The considerations above confirm the validity of Hypothesis 1, stating that the density of a museum network is lower in the early phases of its embryonic evolution rather than in the later phases.
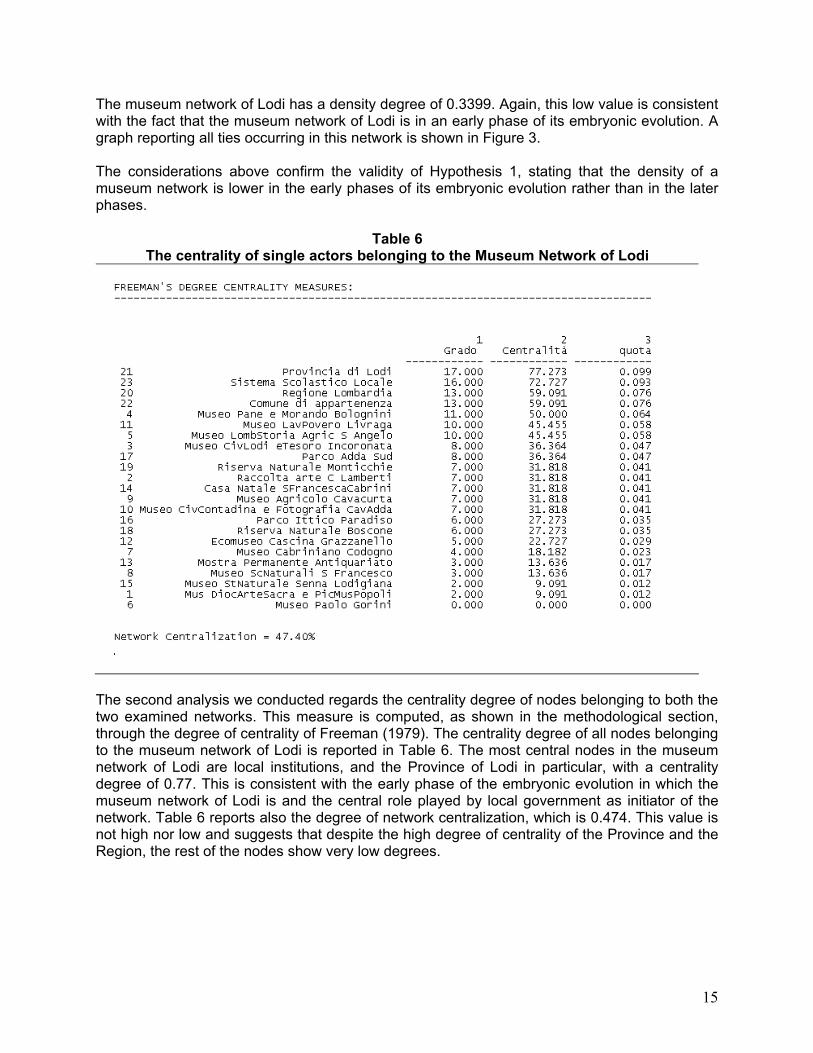
Table 6 The centrality of single actors belonging to the Museum Network of Lodi
he second analysis we conducted regards the centrality degree of nodes belonging to both the Ttwo examined networks. This measure is computed, as shown in the methodological section, through the degree of centrality of Freeman (1979). The centrality degree of all nodes belonging to the museum network of Lodi is reported in Table 6. The most central nodes in the museum network of Lodi are local institutions, and the Province of Lodi in particular, with a centrality degree of 0.77. This is consistent with the early phase of the embryonic evolution in which the museum network of Lodi is and the central role played by local government as initiator of the network. Table 6 reports also the degree of network centralization, which is 0.474. This value is not high nor low and suggests that despite the high degree of centrality of the Province and the Region, the rest of the nodes show very low degrees.
15

Table 7 The centrality of single actors belonging to the Museum Network of Lodi
we consider a reduced matrix, excluding local institutions and just considering museums
hus, this analysis confirms the validity of Hypothesis 2, according to which early phases of the
he centrality degree of all nodes belonging to the museum network of Mantova is reported in
Ifbelonging to the network, the density drops at 0.1579 – almost null – and network centralization drops at 0.2582, confirming that without the Province this network would be inexistent. As shown in Table 7 Museo del Pane and Museo Morando Bolognini – considered as one respondent in this study since they are jointly managed – are the most central nodes, with a centrality degree of 0.389. Tembryonic evolution of a museum network show the centrality of the network initiator, which is typically a local institution. TTable 8. As shown, the most central nodes in that network are Museo Numismatico, Museo del Po di Revere, Museo Civico Bellini and Museo Civico Polironiano. This finding is consistent with the later phase of the embryonic evolution in which the museum network of Mantova is. As a matter of fact, this phase is characterized with emerging of multitude of central actors which are museums and no more local institutions. Table 8 reports the centralization degree of the whole network, which is 0.32. This value is too low to define this network as centralized and suggests a more diffused distribution of central roles in the network.
16
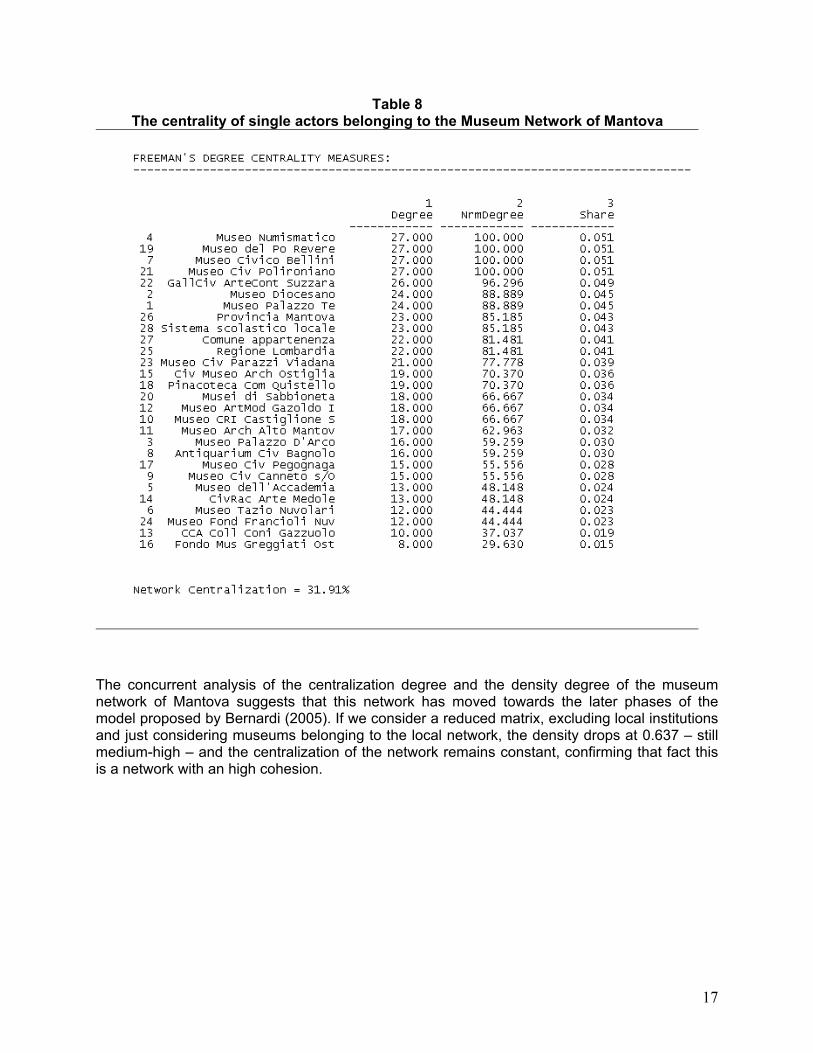
Table 8 The centrality of single actors belonging to the Museum Network of Mantova
The concurrent analysis of the centralization degree and the density degree of the museum network of Mantova suggests that this network has moved towards the later phases of the model proposed by Bernardi (2005). If we consider a reduced matrix, excluding local institutions and just considering museums belonging to the local network, the density drops at 0.637 – still medium-high – and the centralization of the network remains constant, confirming that fact this is a network with an high cohesion.
17
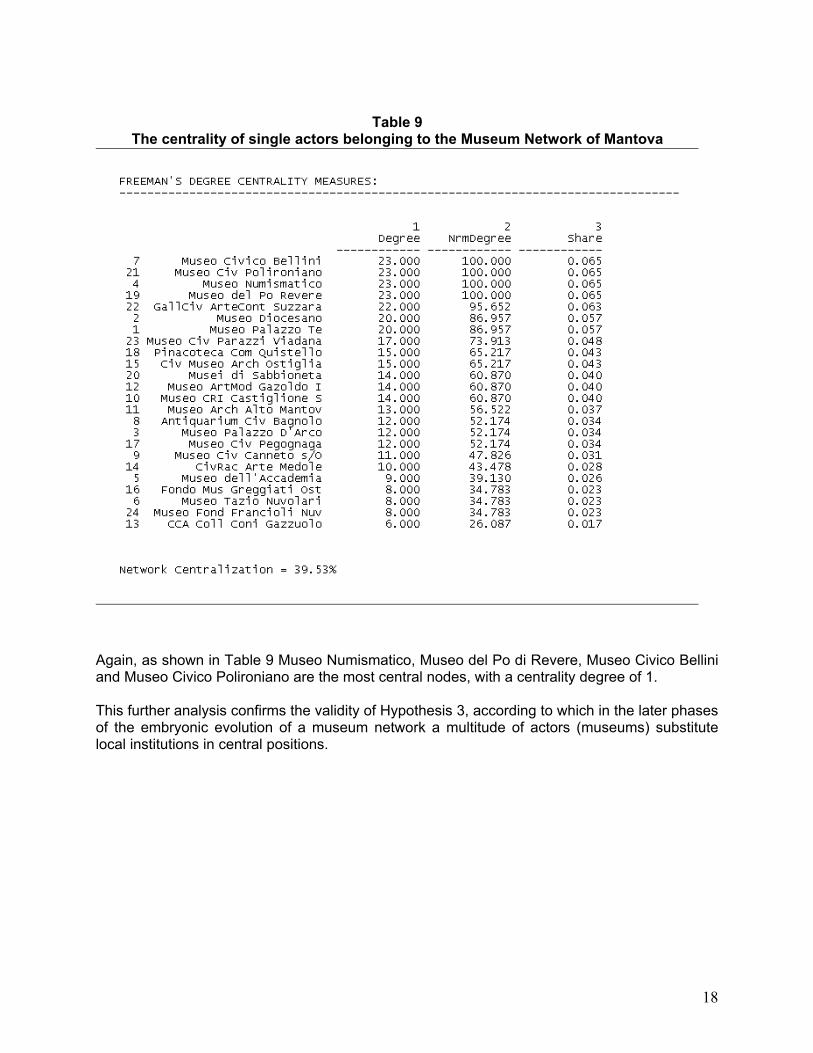
Table 9
The centrality of single actors belonging to the Museum Network of Mantova
Again, as shown in Table 9 Museo Numismatico, Museo del Po di Revere, Museo Civico Bellini and Museo Civico Polironiano are the most central nodes, with a centrality degree of 1. This further analysis confirms the validity of Hypothesis 3, according to which in the later phases of the embryonic evolution of a museum network a multitude of actors (museums) substitute local institutions in central positions.
18

Table 10
The betweenness centrality of single actors belonging to the Museum Network of Lodi
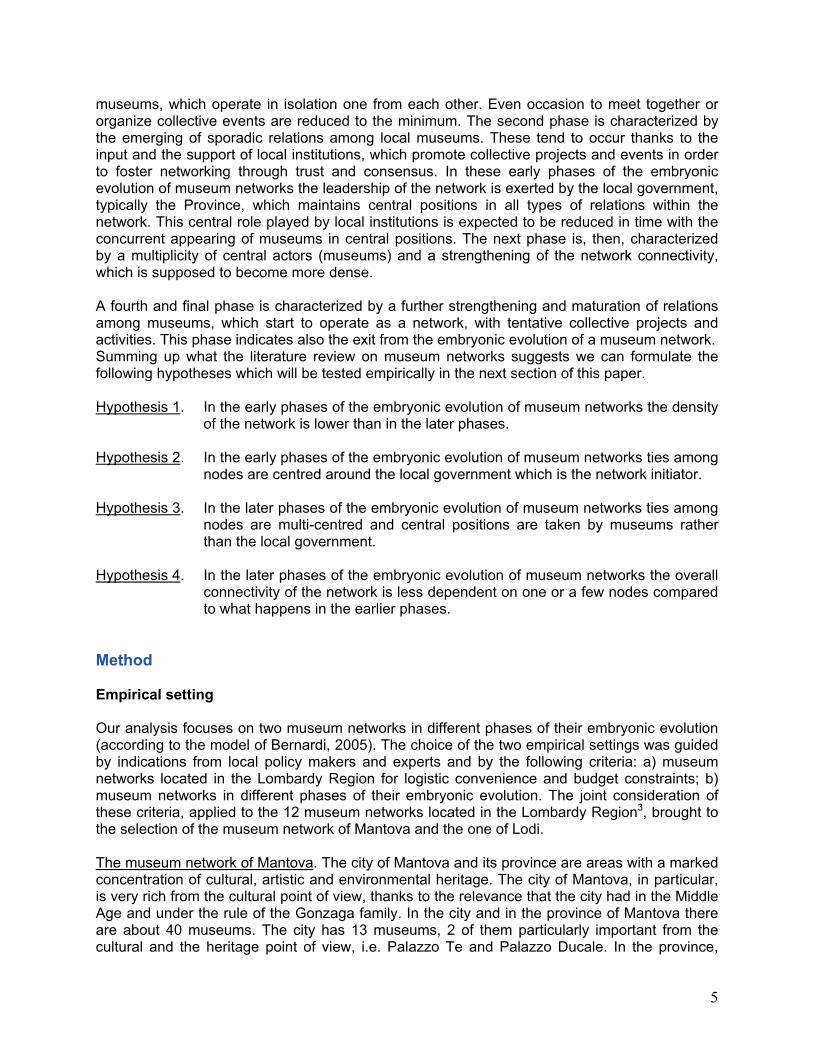
Finally, we conducted a betweenness centrality analysis for both the two museum networks, in order to measure the dependence of network connectivity from one or a few nodes bridging separate sub-groups in the network. As shown in Table 10, Museo del Lavoro Povero di Livraga, Ecomuseo della Cascina Grazzanello and Parco Adda Sud have a high betweenness centrality degree if compared to other nodes in the network (Figure 4). In particular, without the presence of Museo del Lavoro Povero di Livraga the museum network of Lodi would be disconnected in two separate sub-groups, thus confirming a very high dependence of the network connectivity just from single node8.
19
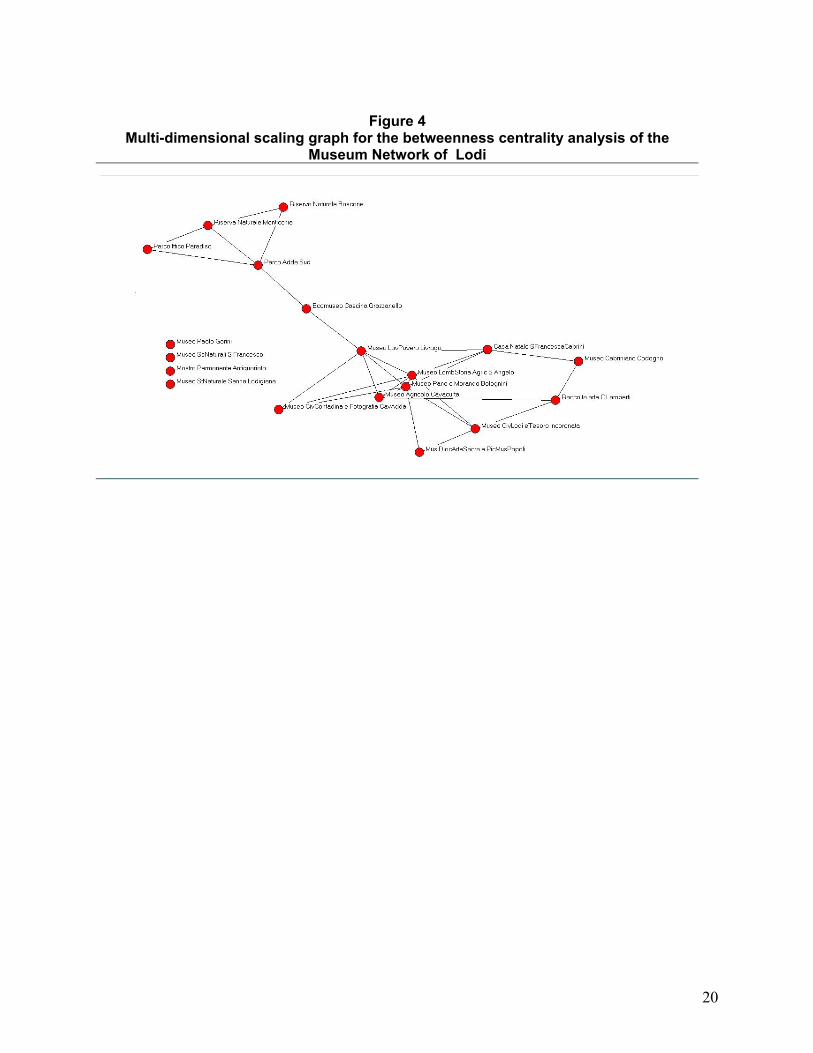
Figure 4
Multi-dimensional scaling graph for the betweenness centrality analysis of the Museum Network of Lodi
20

Table 11
Betweenness centrality of single actors belonging to the Network Museum of Mantova
21
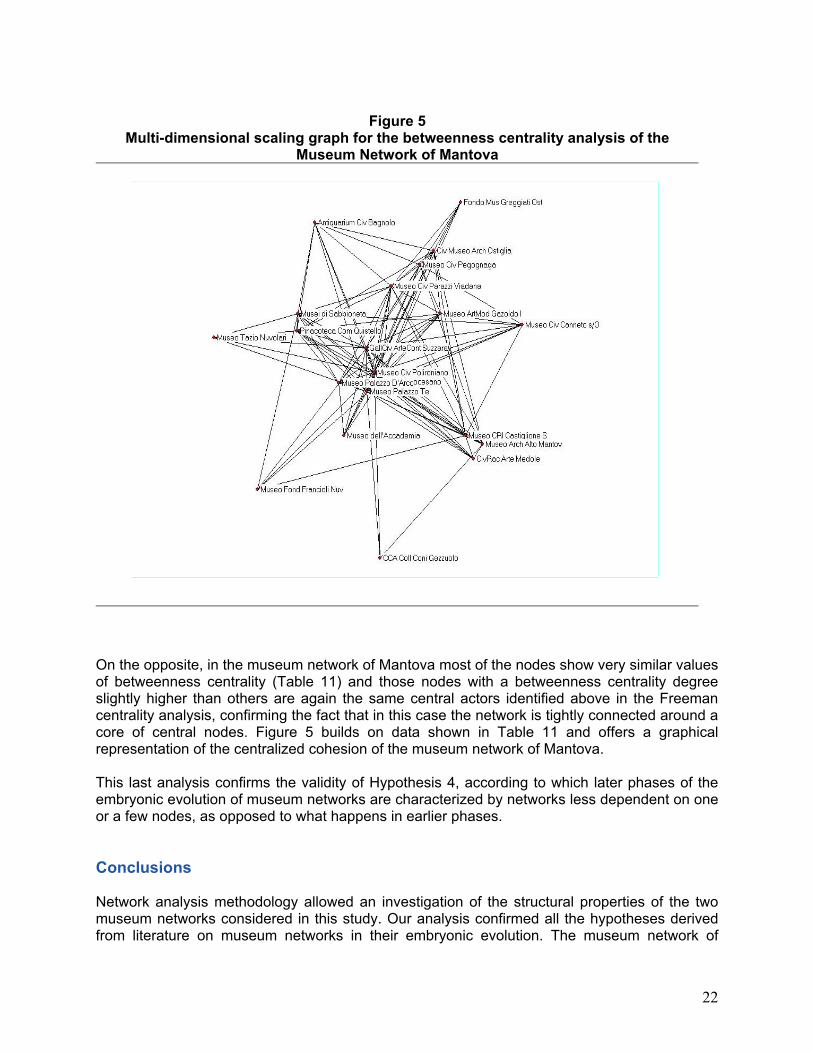
Figure 5
Multi-dimensional scaling graph for the betweenness centrality analysis of the Museum Network of Mantova
On the opposite, in the museum network of Mantova most of the nodes show very similar values of betweenness centrality (Table 11) and those nodes with a betweenness centrality degree slightly higher than others are again the same central actors identified above in the Freeman centrality analysis, confirming the fact that in this case the network is tightly connected around a core of central nodes. Figure 5 builds on data shown in Table 11 and offers a graphical representation of the centralized cohesion of the museum network of Mantova. This last analysis confirms the validity of Hypothesis 4, according to which later phases of the embryonic evolution of museum networks are characterized by networks less dependent on one or a few nodes, as opposed to what happens in earlier phases. Conclusions Network analysis methodology allowed an investigation of the structural properties of the two museum networks considered in this study. Our analysis confirmed all the hypotheses derived from literature on museum networks in their embryonic evolution. The museum network of
22
Mantova resembles even from a network analysis perspectives all the characteristics suggested by Bernardi (2005) for the fourth phase of embryonic evolution. The density of that network is very high, even excluding the Province as a node, which played a relevant role in the past, as network initiator. The fourth phase of evolution is characterized, as data confirm, by the presence of a multitude of museums in central positions. These museums are: Museo Numismatico, Museo del Po di Revere, Museo Civico Bellini and Museo Civico Polironiano di San Benedetto Po, which have also a high degree of betweenness centrality, thus re-inforcing the connectivity of the network. The museum network of Lodi, on the opposite, shows a low degree of density, signalling its positioning in the second phase of embryonic evolution, according to the model of Bernardi (2005). Data confirm also that the most central actor is the Province – the network initiator – and the other local institutions. If we exclude local institutions, the centralization degree of the network drops almost to zero, confirming the central role of institutions in the initial phases of networking among museums. Again, data confirm that in early phases of museum network evolution there is high dependence of the network connectivity on one or a few actors, which are the only bridge connecting sub-groups of nodes. In the network of Lodi these are Museo del Lavoro Povero di Livraga, Ecomuseo della Cascina Grazzanello and Parco Adda Sud. Thus, the present study contributes to a further understanding of the phenomenon of museum networks, offering empirical validation to theoretical hypotheses derived from the literature on museum networks in their embryonic evolution. Existing literature is almost exclusively conceptual or based on qualitative case studies (Bagdadli, 1997; 2003; Baroncelli and Boari, 1999; Zan, 1999, Crisci and Moretti, 2002) and focuses most on the reasons for starting museum networks or their organization forms. Very few contributions (Gavinelli, 2004; Bernardi, 2005) focus on the evolution – or better the embryonic evolution – of museum networks, however failing to offer empirical validation to their theoretical propositions. The present study derived testable hypotheses from this literature and empirically confirmed their validity, thanks to a network analysis approach. This argument introduces the second contribution of the present study, which is methodological. In fact, despite the fact that the literature we considered should focus on networks of museums, networks are seldom considered in their structural terms and network analysis methodology is rarely applied. The present study opens the way for further works applying a network analysis perspective to the study of museum networks.
23
24
Notes
1 The experience of US museum networks shows that the centralisation of several activities, i.e. planning
and development, accounting, public relations, designing of exhibitions, fund-raising, marketing, general services (sometimes even publications), have dramatically cut operating cost of single museums, which have continued to carry out their core and traditional activities such as the preservation and interpretation of collections, the development of new knowledge and public services. According to this perspective, the network between museums enables an increase in the number of visitors through the forwarding of visitors from one institution towards other ones, without any proportional increase in costs.
2 According to the French experience about the development of museum networks it is important to highlight the role played by the Réunion des Musées Nationaux (RMN), a body that has carried out a deep renewal of French museums along the last fifteen years. The RMN, created by the French State in 1985 in order to raise and manage funds necessary to acquire works of art on the behalf of public collections, in the early years comprised only four museums (Louvre, Versailles, Luxembourg, Saint-Germain-en-Laye). Nowadays, the RMN is an autonomous body that is held by the Ministry of Arts, employing 1500 persons, managing about 130 million Euro and comprising 34 national museums of various dimensions. The tasks of the RMN have progressively developed, moving from the sole acquisition of works of art on the behalf of all French state museums towards the offering of a set of value added services to the whole network: reception of visitors (ticket office, reservations, guided visits, pricing, centralised recipes, partnership with tour operators, surveys about visitors); organisation of exhibitions (administrative and logistic organisation, managing of loans, long-run planning); publication and distribution of books and merchandising (edition and co-edition of catalogues; editing of postcards, magazines, images; realisation of cd-rom and other multimedia tools; manufacturing of jewels and other merchandising; sell of books and mail order). For further details see Monsaingeon (1996).
3 For a comparative analysis of all the 12 museum networks located in the Lombardy Region see Sinatra (2005, ed.).
4 A square matrix is a “n × n matrix”, i.e. one whose size is the same in both dimensions. 5 We refer to matrixes including also local institutions (Region, Province, Municipality and Local schools).
For some analyses, as shown later on in the paper, we refer to square matrixes where only museums are included, thus 19x19 and 24x24 matrixes, respectively for Lodi and Mantova.
6 We computed a single variable encompassing: a) transaction relations; b) communication relations; c) boundary penetration relations; d) instrumental relations.
7 This is not the only measure of centrality. For a review on the variety of centrality measures see Lomi (1991).
8 A node with high betweenness centrality degree – such as the case considered in the network of Lodi – can become a single point of failure of the entire network. A network centralized around a node of this kind can fail abruptly if that node is disabled or removed..
References Anselmi, L., A. Capocchi and S. Lazzini. 2004. “Significative esperienze museali nella Toscana
occidentale: innovazioni tecnologiche e manageriali,” in Definire la missione e le strategie del museo, B.P. Sibilio, ed., Milano: Franco Angeli.
Bagdadli, S. 1995. “Cooperazione o isolamento? Verso una nuova organizzazione dei musei italiani.” Economia & Management, no 7.
Bagdadli, S. 1997. Il museo come azienda. Management e organizzazione al servizio della cultura. Milano: Etas.
Bagdadli, S. 2001a. Le reti di musei. L’organizzazione a rete per i beni culturali in Italia e all’estero. Milano: Egea.
Bagdadli, S. 2001b. “Le reti museali, primo passo verso i distretti”. Il Sole 24 Ore, nov. 26th. Bagdadli, S. 2003. “Musei in rete: alcune riflessioni sull’esperienza italiana,” in Conoscere l’arte per
conoscere, L. Pilotti, ed., Padova: CEDAM.
25
Baroncelli, A. and C. Boari. 1999. “Musei e reti interorganizzative,” in Conservazione e Innovazione.
Management e processi di cambiamento nei musei italiani, L. Zan, ed., Milano: Etas. Bernardi, C. 2005. “I sistemi museali: la costituzione e i processi di evoluzione.” in I musei fanno sistema.
Esperienze in Lombardia, A. Sinatra, ed., Milano: Guerini e Associati. Bodo, C. 1994. Rapporto sull’economia della cultura in Italia tra il 1980 e il 1990, mimeo. Borgatti, S.P. 2002. NetDraw for Windows. Harvard: Analytic Technologies Borgatti, S.P., M.G. Everett and L.C. Freeman. 2002. UCINET 6 for Windows: Software for Social
Network Analysis. Harvard: Analytic Technologies. Burt, R.S. and M.J. Minor. 1983. Applied network analysis: A methodological introduction, Thousand
Oaks: Sage. Chung, S. A. et al. 2000. “Complementarity, Status, Similarity and Social Capital as Drivers of Alliance
Formation.” Strategic Management Journal, Vol. 21, p. 1–22. Crisci, F. and A. Moretti. 2002. “La devoluzione nelle politiche culturali Italiane. Alcuni elementi di analisi
per gli operatori dell’industria museale e delle performing arts”, in Servizi pubblici e politiche territoriali, Massarutto A. and R. Grandinetti, eds., Milano: Franco Angeli.
Danilov, V. J. 1990. “Museums Systems and How They Work.” Curator, Vol. 33, no 4. Di Maggio, P.J. and W. W., Powell, eds., 1991. The New Institutionalism in Organizational Analysis.
Chicago: University of Chicago Press. Economides, N. 1996. “The Economics of Network.” International Journal of Industrial Organization, no
14. Fombrun, C. J. 1982. “Strategies for Network Research in Organizations.” Academy of Management
Review, Vol. 7, no 2. Freeman, L.C. 1979. “Centrality in Social Networks.” Social Networks, Vol.1. Gavinelli, L. 2004. “L’integrazione museale: dalla sperimentazione al consolidamento”, in Creare e
valorizzare i distretti museali, B.P. Sibilio, ed., Milano: Franco Angeli. Grandori, A. and G. Soda. 1995. “Interfirm Networks: Antecedents, Mechanisms and Forms.”
Organizational Studies, Vol.16, no 2, p. 183–214. Katz, M. L. and C. Shapiro. 1985. “Network Esternalities, Competition and Compatibility.” The American
Economic Review, no 3. Lanzi, D. and P.L. Sacco. 2003. “Reti e produzione culturale: conflitto o opportunità?” in Conoscere l’arte
per conoscere, L. Pilotti, eds., Padova: CEDAM. Lazzaretti, L. 2001. “I processi di distrettualizzazione culturale delle città d’arte: il cluster del restauro
artistico di Firenze”, Sviluppo Locale, Vol. 8, no 18. Lomi, A. 1991. Reti organizzative: teoria, tecnica e applicazioni. Bologna: Il Mulino. Monsaingeon, G. 1996. “La Réunion des Musées Nationaux: strumento del sistema museale francese,” in
L’azienda museo: problemi economici, gestionali e organizzativi, A. Roncaccioli, ed., Padova: CEDAM.
Oliver, C. 1990. “Determinants of Interorganizational Relationship: Integration and Future Directions.” Academy of Management Review, Vol. 15, no 2.
Powell, W. W. and L. Smith-Doerr. 1994. “Networks and Economics Life”, in The Handbook of Economic Sociology N. J., Smelser e R. Swedberg, eds., Princeton: University Press.
Santagata, W. 2000. “Distretti culturali, diritti di proprietà e crescita economica sostenibile”. Rassegna Economica, Vol. LXIV, no 1.
Scheff, J. and P. Kotler. 1996. “How the arts can prosper through strategic collaborations.” Harvard Business Review, January-February, p. 52–62.
Sinatra, A., ed., 2005, I musei fanno sistema. Esperienze in Lombardia. Milano: Guerini e Associati. Sinatra, A., C. Bernardi., C. Gilodi, D. Moro and L. Tomberg, eds., Modelli innovativi di gestione del
patrimonio museale in Lombardia. I Fase, research report, Milano: IReR–CERMEC (http://213.145.18.56/osservatorio/ricercaID.cfm?ID=12293)
Valentino, P. 2003. Le trame del territorio. Politiche di sviluppo dei sistemi territoriali e distretti culturali. Milano: Sperling & Kupfer.
Van de Ven, A. H. 1976. “On the Nature, Formation and Maintenance of Relations Among Organizations.” Academy of Management Review, Vol. 1, no 4, p. 24–36
Venturini, G. 2004. “La gestione del distretto culturale dal punto di vista turistico”, in Creare e valorizzare i distretti museali, B.P. Sibilio, ed., Milano: Franco Angeli.

26
Wasserman, S. and K. Faust. 1994. Social Network Analysis: Methods and Applications Cambridge
University Press. Wellman, B. 1988. “Structural analysis: from method and metaphor to theory and substance,” in Social
Structures: a Network Approach, B. Wellman and S.D. Berkowitz, eds., Cambridge University Press. Williamson, O. E. 1985. The Economics Institutions of Capitalism: firms, markets, relational contracting.
New York: The Free Press. Zan, L., ed., 1999. Conservazione e innovazione nei musei italiani. Milano: Etas.