the elusive foundations of electric vehicle supporting
TRANSCRIPT
JÉRÔME MASSIANI
Università di Venezia
The elusive foundations of Electric Vehicle supporting policy: a study of claims in the public debate in Italy
intRoDuction
The interest in Electric Vehicles (EV) that has emerged with renewed impetus at the beginning of the decade is still vivid notwithstanding disappointing commercial penetration and the evolution of some context variables, like fuel price, in sharp decrease while we write these lines. Generally, the public opinion seems to adhere to the general view that EV will expand considerably in the close future. This expectation is, as will be illustrated in this paper, substantiated by a consensus of media and policy makers on a strong market potential. Possible doubts on EV potential seem then suspect: if “everyone”, including specialised media, authoritative sources, automotive industry and prestigious consulting com-panies predicts that Electric Vehicles are on the verge on a massive development, why would anyone reject such an optimistic vison – moreover when it is anxiolytic for our fear that life style in rich coun-tries should otherwise drastically adapt to long term depletion of natural resources?
However, one may want to check the validity of such a consensus on EV diffusion prospects. After all, in the past, many claims, consensually supported in the public sphere, have proved wrong (not to mention earlier EV bubbles like in France in the 90’s). Then, it is legitimate that one seeks to better understand the reasonableness of the claims supporting this broad consensus. In this article, we inves-tigate claims made in the public debate, in order to verify whether they are open to scrutiny and to check for their scientific soundness. One would, for instance, be interested to check whether the figures that enter the public debate are based on methods with good predictive values (e.g. figures based on declared interest by potential purchasers are less reliable than other methods) and if they are even just “checkable”. We use Italy as a case study considering, in this preliminary analysis, 97 occurrences of claims made in written media and parliamentary hearings.
Our results indicate that, beyond variability in the diffusion figures, claims in the public sphere very rarely report their sources, or, in the few cases where they do, do not provide sufficient information to

78 j. massiani – the elusive foundations of electric vehicle supporting policy
perform even basic checks on the soundness of the proposed quantification. On 97 claims none appears to be sufficiently documented to be considered as a valid input for policy design. Our findings support the thesis, or are at least compatible with the idea, that an information bubble exists on EV diffusion and that high care should be taken in using EV diffusion claims for the design of policy.
This article has three sections. In a first section, we show that analysis of data present in the public sphere, although neglected by economic analysis, actually provides instruments that are useful in this field. In a second section, we present the various methods available for EV diffusion forecast and show their main merits and limitations. In a final section, we present the data collected for our analysis and show that they are substantially unavailable for scrutiny.
philoloGY of public claims, WhY WoulD it matteR foR public economics?
The analysis of representations conveyed in the public debate has attracted the attention of psycholo-gists, sociologists, linguists and, in a more applied fashion, from lobbyists with, instead, limited interest from the economists.
The field has been profoundly influenced by the work of Jurgen Habbermas on the so called “public sphere” and by the Chomskian school of thoughts. This field has soon concentrated on the role of media in shaping general public perceptions. Although remote from our topic, we posit useful to quote Haper and Philo1 research, showing that exposure to a reportage on handicapped stressing the problem of frauds to public benefits will generate strong overestimate of actual fraud rates2.
Another, more minor, stream of research relates to the accuracy of media forecast on various socio economic issues. In an original work, Tetlock and al. review 284 experts’ claims in the media and find very limited predictive validity. This field of research is relevant for economists in that these claims may however be influential in the shaping of policies.
A field of research that is closer to our, relates to the formation of claims in media. Koomey and al investigate four figures frequently used by media in the coverage of energy issues3. Their analysis shows that improper representations of well understood phenomenon (like electricity production and consump-tion) easily enter into the public representations.
Generally, these different fields of research question the factual or substantial accuracy of the media. The question is approached in sociologic or influential stakeholders terms. Some applications exist in the political field (see for instance the emblematic analysis of Chomsky of media coverage of Timor Oriental war) but they are more limited in the economics.
The invitation to consider claims present in the public debate with suspicion meets layman wisdom: it is common sense that one should not trust the newspapers (not to the mention the politicians). Even children in their young ages are educated by their parents to distrust the media. It may then appear use-less (or just good for academics) to investigate how claims on a given topic could be ill-formed. Such a comforting view should however be dismissed. People may actually profess to distrust what the me-dia tell, but actually do the contrary: everyone’s view is deeply shaped by media message. This turns
1 The Role of the Media in the Construction of Public Belief and Social Change, Catherine Happer, Greg Philo, journal of social and political psychology 2013 vol 1. Role of media in shaping public opinion beligeds and policies.
2 “When we asked the groups to consider what the percentage of people who were fraudulently claiming disability benefits was the responses varied from ‘about 10%’ right up to 70%. The official figure is closer to 0.5%”.
3 Sorry, wrong number: The Use and Misuse of Numerical Facts in Analysis and Media Reporting of Energy Issues, Annual Review of Energy and the Environment Vol. 27: 119-158 (publication date November 2002) DOI: 10.1146/annurev.ener-gy.27.122001.083458. Jonathan G. Koomey, Chris Calwell, Skip Laitner, Jane Thornton, Richard E. Brown, Joseph H. Eto, Carrie Webber, and Cathy Cullicott.
79 j. massiani – the elusive foundations of electric vehicle supporting policy
out to be specifically true for our area of investigation, where the general public adheres to the positive message conveyed in the public sphere; public opinion shares the belief of large EV diffusion potential, and that EV will deploy the short term.
It then becomes useful to investigate the validity of figures present in the public debate as they are just consistent with, and probably influential of, public opinion beliefs.
compaRinG methoDs foR eV Diffusion foRecast
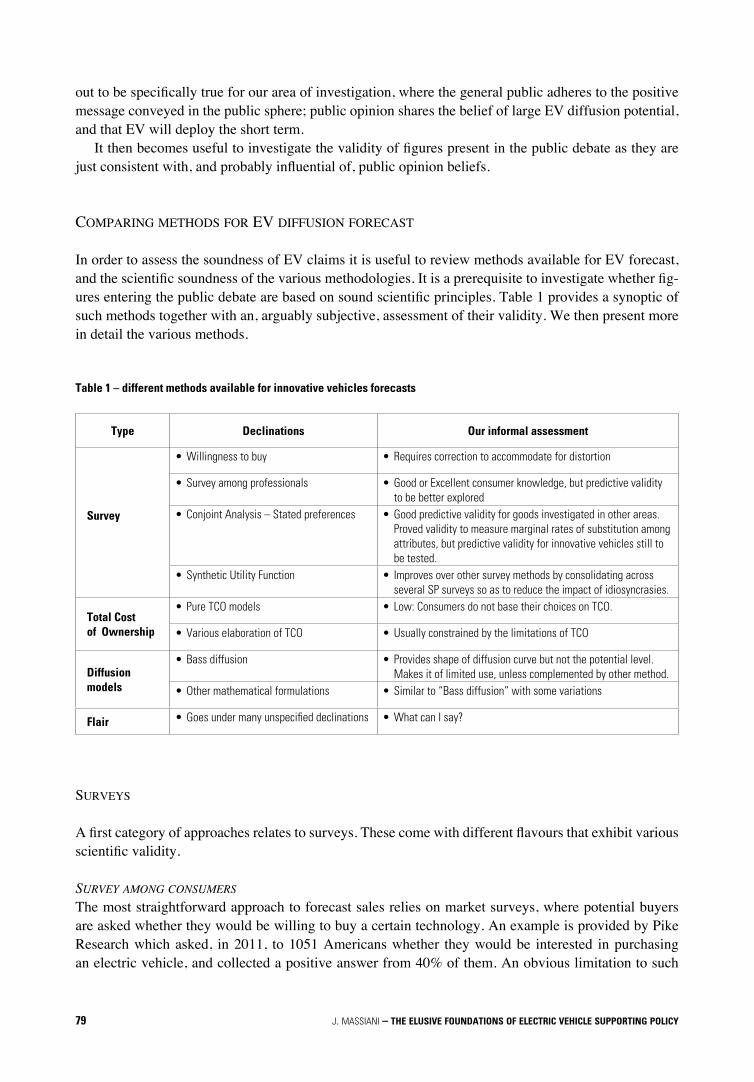
In order to assess the soundness of EV claims it is useful to review methods available for EV forecast, and the scientific soundness of the various methodologies. It is a prerequisite to investigate whether fig-ures entering the public debate are based on sound scientific principles. Table 1 provides a synoptic of such methods together with an, arguably subjective, assessment of their validity. We then present more in detail the various methods.
Table 1 – different methods available for innovative vehicles forecasts
Type Declinations Our informal assessment
Survey
• Willingness to buy • Requires correction to accommodate for distortion
• Survey among professionals • Good or Excellent consumer knowledge, but predictive validity to be better explored
• Conjoint Analysis – Stated preferences • Good predictive validity for goods investigated in other areas. Proved validity to measure marginal rates of substitution among
attributes, but predictive validity for innovative vehicles still to be tested.
• Synthetic Utility Function • Improves over other survey methods by consolidating across several SP surveys so as to reduce the impact of idiosyncrasies.
Total Cost of Ownership
• Pure TCO models • Low: Consumers do not base their choices on TCO.
• Various elaboration of TCO • Usually constrained by the limitations of TCO
Diffusion models
• Bass diffusion • Provides shape of diffusion curve but not the potential level. Makes it of limited use, unless complemented by other method.
• Other mathematical formulations • Similar to “Bass diffusion” with some variations
Flair • Goes under many unspecified declinations • What can I say?
suRVeYs
A first category of approaches relates to surveys. These come with different flavours that exhibit various scientific validity.
Survey among conSumerS The most straightforward approach to forecast sales relies on market surveys, where potential buyers are asked whether they would be willing to buy a certain technology. An example is provided by Pike Research which asked, in 2011, to 1051 Americans whether they would be interested in purchasing an electric vehicle, and collected a positive answer from 40% of them. An obvious limitation to such

80 j. massiani – the elusive foundations of electric vehicle supporting policy
surveys is that there is a gap between what people say and what people do. For this reason, marketing research has developed techniques that provide “correction factors” for willingness to buy expressed by consumers4. When uncorrected, survey results are of little use. The situation is probably better for survey results that operate corrections, but we are unaware of such results in our field of investigation.
Survey among profeSSionalS Another type of survey is directed toward professionals. This could be car industry representatives, concessionaires or any type of professional involved in automotive industry. The face value of such surveys is high as it recognizes that such professionals are knowledgeable of their business. Whether it can provide a good basis for forecasts needs careful consideration.
conjoint analySiS or Stated preferenceSA different approach is based on what is called Conjoint Analysis or Stated Preference. In these surveys, the consumer is asked to express her preferences among various alternatives (such as cars technologies) defined by a set of attributes (for example: speed, price, or range). Using the answers provided by the interviewees, an analyst can infer information about the trade-offs made by consumers among the differ-ent attributes (for instance, how much range they can forgo in order to save on the purchase price). Usu-ally, one of the attributes of the alternatives is price, allowing for the computation of willingness-to-pay for the other attributes. SP have flourished in a number of forms and under a number of labels: Conjoint Analysis, Choice-Based Conjoint, and Stated Preference (although these different names capture differences that are sometimes relevant, for the purposes of this article we will, unless explicitly specified, use these different labels as synonyms) that share a common conceptual setting: analyzing the preferences of consumers based on preferences among hypothetical attribute combinations. Important is that the survey process responds to the specific features of Electric Vehicles5.Eventually, Synthetic Utility Function, as illustrated by Massiani (2013, 2015)6 provided an innovative yet powerful way to consolidate across various studies through a meta analysis and to avoid results car-rying too much idiosyncrasies of a given survey.
Frame 1 – SP surveys, advantages and limits
SP offer a number of advantages compared with competing approaches in the area of alternative fuel vehi-cles diffusion forecasting. First, they provide information about the effect of non-monetary attributes. As long as an attribute is present in the SP survey, information can be extracted on how it impacts on consum-er choices. This appears to be of crucial importance in the case of electric cars, in that they have certain non-monetary features (such as range and refuelling time) that make them very distinctive from conven-
4 Morwitz (2007) When do purchase intentions predict sales? International Journal Of Forecasting Volume: 23 Issue: 3 (2007-01-01) ISSN: 0169-2070. Manohar U. Kalwani and Alvin J. Silk (1982) On the Reliability and Predictive Validity of Purchase Intention Measures Mar-keting Science Summer 1982 1:243-286; doi:10.1287/mksc.1.3.243.
5 Massiani (2013) Stated preference surveys for electric and alternative fuel vehicles: are we doing the right thing?. DOI:10.1179/1942787514Y.0000000022. pp.152-160. In TRANSPORTATION LETTERS - ISSN:1942-7867 vol. 6.
6 Massiani (2012). Using Stated Preferences to forecast alternative fuel vehicles market diffusion. DOI:10.3280/SCRE2012-003006. pp.93-122. In SR SCIENZE REGIONALI - ISSN:1720-3929 vol. Vol. 11.Massiani (2015). Cost-Benefit Analysis of policies for the development of electric vehicles in Germany: Methods and results. DOI:10.1016/j.tranpol.2014.10.005. pp.19-26. In TRANSPORT POLICY - ISSN:0967-070X vol. 38.

81 j. massiani – the elusive foundations of electric vehicle supporting policy
tional cars. Second, SP are intrinsically calibrated to consumer choice data. This contrasts with TCO, which is not, strictly speaking, calibrated to behavioural information, and with the Bass diffusion model, which sometimes is, but sometimes not, calibrated to ad hoc data. Third, SP survey results replicate consumer preferences in given market conditions. This can be an advantage in situations where the decision-maker is interested in consumer response in a given setting. For instance, he may be interested in purchase intentions relating to a given national or regional market, or over a given period of time, or he may be interested in the effect of certain specific attributes. One advantage of SP is that it is easy to tailor the data-collection process to the market conditions of interest. Fourthly, SP are intrinsically attribute-responsive, and consider both the alternative of interest and its competitors, which means that the forecasted choice probability of a given alternative will always be dependent on the level of the attributes under consideration.Parallel to these advantages, some potential drawbacks of SP surveys are also discussed in the literature. These relate primarily to the hypothetical distortion that may occur in the survey. In some cases, it is pos-sible to correct for possible hypothetical distortion by performing an additional calibration of the model on real-world data. This usually occurs through the calibration of an Alternative Specific Constant to actual market share. This technique is, however, of little help for alternative fuel vehicles, in that market share is close to 0. How to take into consideration the possible effect of hypothetical distortion for AFV diffusion forecasting is still on the agenda of transport economists. Besides hypothetical distortion, a slightly more challenging issue consequence relates to the framing effects that make SP results strongly dependent on the modus operandi of a survey. This issue may result in a caveat when using the outcome of a given SP survey uncritically. This is a line of argument that has partly motivated this paper, as will become apparent in the following sections. These issues should not be exaggerated, however. Generally, the scientific literature has gathered a body of evidence that SP exhibit a good level of predictive validity despite these issues (for a survey, see Massiani, 2005: 141-149).7
total cost of oWneRship
Total Cost of Ownership considers that the sum of operating and purchasing costs is the key determinant of vehicle purchase decision. In many applications of this method, it is considered that buyers will select the technology with the minor cost. TCO does not have a large echo in the literature on vehicle purchase, at least in transportation sciences. This relates to the variety of dimensions in car purchase mechanisms that do not seem to be summarized in cost considerations. Services provided by a car (think about au-tonomy, recharging time, not to mention style and others) are relevant factors while some economic aspect seem to have comparatively little effect (this applies for instance to fuel costs that are heavily discounted in real purchase situations). Whilst this approach is fairly simplistic in its assumptions, it has gained popularity in studies deriving from industry or consulting organizations, while it has received less attention in the scientific literature.
Diffusion theoRY
This approach aims at quantifying the future diffusion of a novel technology. The focus of method is to describe the path of diffusion from the current figures to an hypothesised potential. Among the various mathematical formulations, the one proposed by Bass is the most influential. It relies basically on two mechanisms that correspond to two different types of social influence: (1) adoption where individuals decide to buy the good autonomously and (2) imitation where purchase is determined by the growing popularity of a product. Mathematically:
7 Massiani (2005) La valeur du temps en transport de marchandises, Thése de doctorat, Université Paris XII Créteil.

82 j. massiani – the elusive foundations of electric vehicle supporting policy
with:nt: purchase in period t Nt: cumulative purchase up to period t M: Market potential (first time purchase for the whole life cycle of the product) p: innovation coefficientq: imitation coefficient(M-Nt): residual sales at time t (difference betweeen potential and achieved sales).
A typical diffusion pattern resulting from Bass diffusion model is illustrated in Figure 1.There are several reasons for the success of this method (Massiani, 2012, 2015)8. Part of it relies on
the good predictive value of this method as exhibited in the seminal works of Bass. However, the meth-od presents some limitations relating to, among others, the focus on diffusion mechanisms considering a given potential, while the attention dedicated to long term potential is much less analysed.
A typical diffusion pattern resulting from Bass diffusion model is illustrated in Figure 1.
Figure 1 – typical diffusion pattern in Bass diffusion model a – sales b – cumulative sales
There are several reasons for the success of this method (Massiani, 2012, 2015)8. Part of it relies on the good predictive value of this method as exhibited in the seminal works of Bass. However, the method presents some limitations relating to, among others, the focus on diffusion mechanisms considering a given potential, while the attention dedicated to long term potential is much less analysed.
Flair
Another method is based on informal aggregation of one’s information into a personal assessment, or, in our words : flair. Flair just depends on the personal ability and level of information of its proponent. In some cases, it elaborates on a very wide set of information and a large personal experience. While one can not a priori rule out such informal knowledge, it is however difficult to base a public policy on such features.
8 Massiani (2012). Using Stated Preferences to forecast alternative fuel vehicles market diffusion. DOI:10.3280/SCRE2012-
003006. pp.93-122. In SR SCIENZE REGIONALI - ISSN:1720-3929 vol. Vol. 11 Massiani (2015) The choice of Bass model coefficients to forecast diffusion for innovative products: An empirical investigation
for new automotive technologies. DOI:10.1016/j.retrec.2015.06.003. In RESEARCH IN TRANSPORTATION ECONOMICS - ISSN:0739-8859.
a – sales b – cumulative sales
Figure 1 – typical diffusion pattern in Bass diffusion model
flaiR
Another method is based on informal aggregation of one’s information into a personal assessment, or, in our words : flair. Flair just depends on the personal ability and level of information of its proponent. In some cases, it elaborates on a very wide set of information and a large personal experience. While one can not a priori rule out such informal knowledge, it is however difficult to base a public policy on such features.
8 Massiani (2012). Using Stated Preferences to forecast alternative fuel vehicles market diffusion. DOI:10.3280/SCRE2012-003006. pp.93-122. In SR SCIENZE REGIONALI - ISSN:1720-3929 vol. Vol. 11Massiani (2015) The choice of Bass model coefficients to forecast diffusion for innovative products: An empirical investigation for new automotive technologies. DOI:10.1016/j.retrec.2015.06.003. In RESEARCH IN TRANSPORTATION ECONOMICS - ISSN:0739-8859.

83 j. massiani – the elusive foundations of electric vehicle supporting policy
As we can see, various tools are available to evaluate the future diffusion of innovative technol-ogies. In some cases, elaborated models mix various approaches (for instance SP surveys can be used together with Bass diffusion models: Stated Preference provides the potential while diffusion theory indicates how this potential is reached). Each method comes with different scientific validity: some of them are inappropriate for market diffusion forecast, others are more (Bass) or less (Synthetic Utility Function) problematic. It then becomes relevant to investigate how figures present in the public dis-cussion were obtained, if there is some tropism in favour of a given method, and if the most frequent methods are the ones with the best predictive capability.
eV Diffusion: the numbeRs on the table
To provide a corpus for analysis, we have systematically gathered written public claims made by a va-riety of agents about the future development of EV’s. Our analysis provides a wide coverage of various segments of the public debate. For practical purpose, we restrict to written media and exclude audio and video messages. In our analysis, we refer to “quoting document” as the text in which a claim on EV diffusion is made. “Quoted source” refers, conversely, to the source from which the data derives (if specified). Table 2 presents the various quoting documents used in our analysis.
Table 2 – quoting document used as corpus (Oct. 2010- June 2012)
Category Considered documents
Specialized press
• Al Volante• Auto• Gente Motori• Quattro Ruote• Autoage.it• Interautonews
Generalist press
• Lettera43• Corriere della Sera• La Repubblica • Il Sole 24 Ore• Il Giornale
Professional Associations• ACEA (Associazione Europea Costruttori Automobili)• FIA (Federazione Internazionale Automobili)• Unione Petrolifera (Association of Italian oil Industry)
Parliament • Hearing of specialized parliamentary commissions
Specialized Web sites
• GreenValue.it (blog on sustainable mobility) • ConsulenteEnergia.com (web site on energy issues) • GreenMe.it, (web site on green issues) • SicurAuto.it, (web site for italian car users) • RuotePerAria.com, (web site on sustainable mobility) • VirgilioGreen.it, (web site on green issues)• GreenStart.it, (web site on sustainable mobility)• ItaliaNoleggioNews.it, (web site on car rental)
Other
• ANSA, agenzia nazionale stampa associata• RaiTelevideo.it (Italian public national broadcast)• LaVoce.it, (online economic journal)• SoldiBlog.it (online financial blog)

84 j. massiani – the elusive foundations of electric vehicle supporting policy
Each source of information was investigated for:• Prevision (relative or absolute numbers, subsequently translated in %)• Indication of whether the prevision relates to Fleet share or Sales share• Year for prevision• Type of vehicles (EV, Hybrid or both)• Date of issue• Quoting document• Quoted source of data• Quoted method used for prevision• Prevision presented as a policy objective or as a factual forecastWhenever possible, we also investigated whether the quoted sources was supported by documents avail-able for scrutiny.
can one belieVe, oR at least check, these numbeRs?
The initial purpose of our analysis was to check whether the figures present in the public debate corre-spond to methods with high or with low scientific validity. Our analysis actually unveiled a much more worrying situation, where it is substantially impossible to access any documentation on these claims. In this section, we first present the quantifications present in the public debate and successively investigate how much credit can be placed on them.
diverging claimSWe first review the claims present in the public debate. As a first step, we discard claims relating to “objectives” rather than to forecasts. After all, saying you want 1 million vehicles on German roads in 2020 is different than stating it will probably be so. Even restricting to forecasts, our analysis shows large deviations in market share prevision. Obviously, the comparison has to consider carefully the cat-egories of vehicles accounted for, basically: Battery Electric Vehicle, Plug In Hybrid, Hybrid. It appears that the claims usually relate to two categories, a first one relating to Electric Vehicles (whether BEV whether Plug in Hybrids9), and another to (unplugged) Hybrid Vehicles. Figure 2 shows the various shares forecasted for these two categories of vehicles.
Figure 2 - EV diffusion forecast present in the public debate in Italy Fleet share (EV and Hybrid) Market share (EV and Hybrid)
The tune is usually optimistic with only a couple of texts claiming that the market may be not so high as expected. Many statements refer to authority of their authors: “scrupulous” analysis by Milan Polytechnic, “prestigious” institution, “gurus” of consulting companies. Interestingly (or worryingly) we find many quantifications are ambiguous. It is often guessed, rather than made explicit, whether the figure relates to market shares o to fleet share (that accumulates sales on the life duration of the vehicles, and is, by construction, much higher than the former one for an emerging technology). In one case, a figure larger than 20 % of Electric Vehicles (both categories together) for Italian vehicles in 2017 is explicitly referred to as “fleet share” as we suspect it may refer to market share.
In this context, we explore now to which method, if available, these claims refer.
Figures do not explicit their sources, or these sources are not publicly available, or they do not minimally document their claims
First, it appears that 35 % of the claims do not refer to any source of information. This seems to be more a substantial than a formal issue. The multiplication of undocumented claims can be seen as a symptom of ill configured public debate. In the remaining cases, when source of data is quoted, 38 % of the total number of claims refer only to the author (person or organization) that formulated the claim, with no reference to a proper document. In some cases, one can retrieve the study based on the author and some contextual information, but this is an uncertain reconstruction as appears from Table 3. This table materializes the quest from the original document that a cautious analyst would need to go through in order
0
5
10
15
20
25
30
2010 2015 2020 2025 2030
%
E.V. Europa E.V. Global E.V. Italy
El+H.V. Global E.V. + H.V.. Italy
0
10
20
30
2010 2015 2020 2025 2030
%
E.V. Europa E.V. Global E.V. Italy
El+H.V. Global E.V. + H.V.. Italy
Fleet share (EV and Hybrid) Market share (EV and Hybrid)
Figure 2 – EV diffusion forecast present in the public debate in Italy
9 There is however usually no explicit consideration of how Plug in Hybrids are considered, but its affinity to BEV is strong, so it is reasonnable that claims on Electric Vehicles would also include Plug in Hybrids.

85 j. massiani – the elusive foundations of electric vehicle supporting policy
The tune is usually optimistic with only a couple of texts claiming that the market may be not so high as expected. Many statements refer to authority of their authors: “scrupulous” analysis by Milan Polytech-nic, “prestigious” institution, “gurus” of consulting companies. Interestingly (or worryingly) we find many quantifications are ambiguous. It is often guessed, rather than made explicit, whether the figure relates to market shares or to fleet share (that accumulates sales on the life duration of the vehicles, and is, by construction, much lower than the former one for an emerging technology). In one case, a figure larger than 20 % of Electric Vehicles (both categories together) for Italian vehicles in 2017 is explicitly referred to as “fleet share” as we suspect it may refer to market share.
In this context, we explore now to which method, if available, these claims refer.
fiGuRes Do not eXplicit theiR souRces, oR these souRces aRe not publiclY aVailable, oR theY Do not minimallY Document theiR claims
First, it appears that 35 % of the claims do not refer to any source of information. This seems to be more a substantial than a formal issue. The multiplication of undocumented claims can be seen as a symptom of ill configured public debate. In the remaining cases, when source of data is quoted, 38 % of the total number of claims refer only to the author (person or organization) that formulated the claim, with no reference to a proper document. In some cases, one can retrieve the study based on the author and some contextual information, but this is an uncertain reconstruction as appears from Table 3.
This table materializes the quest from the original document that a cautious analyst would need to go through in order to identify proper sources of data. It indicates that most of the data sources identified by author information, cannot be identified with sufficient reliability or are available upon payment.
The alternative case, where a reference to an identified document is provided, represents 7 % of the claims. But, in most of these cases, the referred document does not appear publicly available. In some cases again, the document can be obtained only upon payment (this applies for instance to Pike Research results). This materializes a “trust us or pay us” attitude in which the provider of the informa-tion seems to be winning in all cases – although the quality of public debate, and public policy resulting from it, may ultimately be harmed.
Considering these different factors, we observe that only one claim among 97 is open to scrutiny (a survey among concessionaires), but it has a rather limited scientific status and does not really express a quantified forecast (it states that half of the concessionaires estimate the market share of EV to be smaller than 1% in the near future). Two others claims (Deloitte report and a Unione Petroliere) provide publicly available reports, however they offer a low (Deloitte report) or inexistent (Unione Petroliere) level of detail on the calculations.
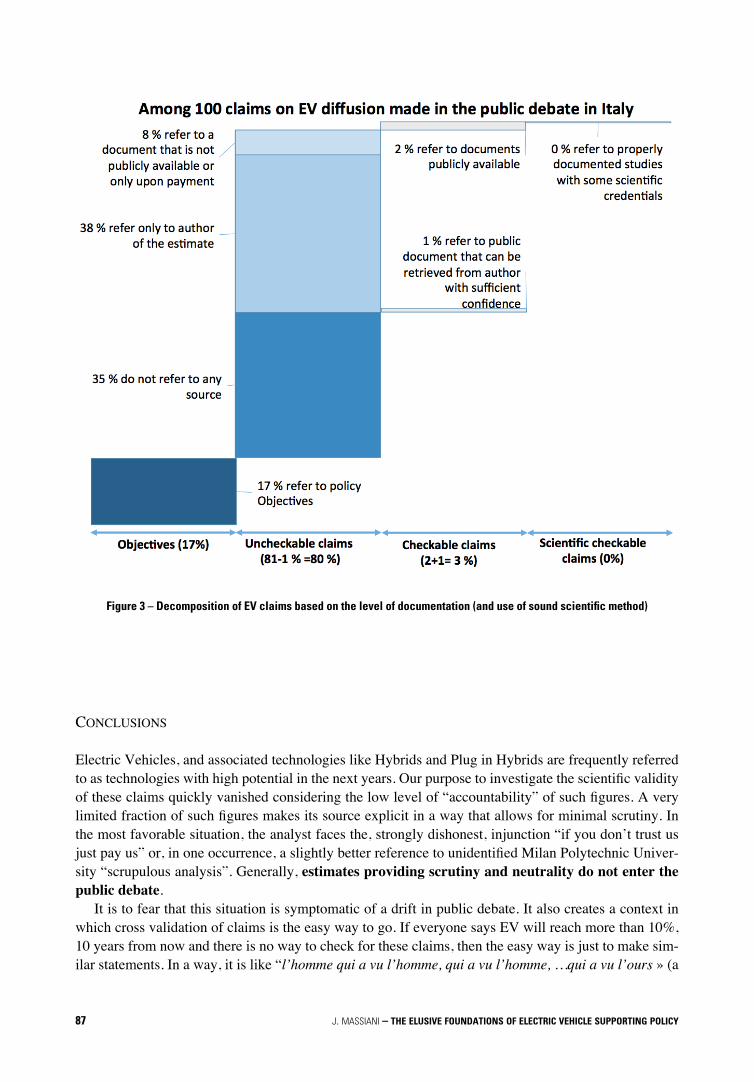
The picture that emerges from our analysis can be summarized in Figure 3: a tiny fraction of the claims are documented, and more worrying, none of documented claims is based on a method with scientific credentials.
Another relevant aspect relates to the method that is associated with these claims. As far as method are concerned, 94 % of quoting documents do not explicit methodology (or correspond to “flair”), and the remaining 6 % refer to Expert survey, or in one case, to “market survey”. When the original methodology used in the source paper is investigated, only limited information can be found. No evi-dence can be found of a penetration in the public debate of results based on TCO, Bass and other diffu-sion models, SP surveys or, better, Synthetic Utility Function.
Another striking feature is that independent (typically academic) research, and especially peer re-viewed contributions, are substantially absent from the public debate. One claim refers to Milan Poly-technic study, but there is no unambiguous way to identify the corresponding document in which this claim was made. Publications made by scientific journals have no echo in the public discussion.

86 j. massiani – the elusive foundations of electric vehicle supporting policy
This situation is not positive as academic studies would normally exhibit a better level of scrutiny, if not of competence. This could signal a situation of capture of the debate by industrial stakeholders, which can prosper due to low interest of academics in promoting their results in the public sphere, or to good communication skills of other stakeholders, typically industrial and consultants.
This situation challenges our initial purpose to assess the tropism of claims based on the validity of the underlying methodology. The quality of these claims is not checkable which implies that it should be considered very low confidence.
Table 3 – The quest for the original data: most claims cannot be scrutinized in publicly available documents
Certainty of the source
Document title or description Author Availability
Weak2013 report containing information on electric vehicles in Europe
Pike research Pike research reports usually available upon payment
Weak2011 report containing information on electric vehicles worldwide
Pike research Idem
Weak 2012 report containing information on Electric vehicle sales worldwide in 2020
Alix Partners Document could not be identified with sufficient certainty
Weak2009 report containing information on Electric Vehicle sales in Europe in 2015
Frost and Sullivan Idem
Weak2012 report on global penetration of Electric vehicles*
Exxon Mobile Idem
Weak2010 and 2011 reports containing information on worldwide diffusion of electric vehicle
JD Power Idem
Weak2011 reports Global Insight, Deloitte,
Deutsche BankDocument could not be identified with sufficient certainty
Limited“The-electric-and-range-extended-electric-light-vehicle-report” (2012)
HIS automotive HIS report made available upon payment
AcceptablePre 2012 Deloitte report containing information on US EV penetration (3,1% in 2020).
Deloitte A report with similar figures is: Gaining Traction: A customer view of electric vehicle mass adoption in the U.S. automotive market, Deloitte, 2010**
ReasonablePrevisioni di domanda energetica e petrolifera italiana 2010-2025
Unione Petroliere Only report of year 2011 appears available. Table 13 indicates 100 000 electric vehicles in 2025. No methodological report is present.
High“Plug-in electric vehicles (2012)” ***,**** Pike research 13 p. Free excerpt
Full version upon payment
AcceptablePre 2012 Deloitte report containing information on US EV penetration (3,1% in 2020).
Deloitte A report with similar figures is: Gaining Traction: A customer view of electric vehicle mass adoption in the U.S. automotive market, Deloitte, 20105
Reasonable“Previsioni di domanda energetica e petrolifera italiana 2010 - 2025”
Unione Petroliere Only report of year 2011 appears available. Table 13 indicates 100 000 electric vehicles in 2025. No methodological report is present.
High“Plug-in electric vehicles (2012)” 6,7 Pike research 13 p. Free excerpt
Full version upon payment
* Full title of free excerpt: Plug-in electric vehicles (2012) Battery Electric and Plug-in Hybrid Electric Vehicles: OEM Strategies, Demand Drivers, Technology Issues, Key Industry Players, and Global Market Forecasts.
** The method is based on interviews: ”The key component of Pike Research’s analysis is primary research gained from phone and in-person interviews with industry leaders including executives, engineers, and marketing professionals”.
*** Not the energy outlook 2012, as it contains figures on 2040 worldwide diffusion while the quoting documents refers to 2030.**** “Primary research includes interviews with executives from auto companies, start-ups, dealers, energy companies and survey of 2,000 current vehicle
owners. Quantified an “early majority segment” of the U.S. by matching criteria against U.S. census data as 1.3 million, or 3.1% of US auto sales in 2020”.
Note: year quoted in column “document title” is the year of the quoting document. Actual source of data may be anterior.
87 j. massiani – the elusive foundations of electric vehicle supporting policy
Figure 3 – Decomposition of EV claims based on the level of documentation (and use of sound scientific method)
conclusions
Electric Vehicles, and associated technologies like Hybrids and Plug in Hybrids are frequently referred to as technologies with high potential in the next years. Our purpose to investigate the scientific validity of these claims quickly vanished considering the low level of “accountability” of such figures. A very limited fraction of such figures makes its source explicit in a way that allows for minimal scrutiny. In the most favorable situation, the analyst faces the, strongly dishonest, injunction “if you don’t trust us just pay us” or, in one occurrence, a slightly better reference to unidentified Milan Polytechnic Univer-sity “scrupulous analysis”. Generally, estimates providing scrutiny and neutrality do not enter the public debate.
It is to fear that this situation is symptomatic of a drift in public debate. It also creates a context in which cross validation of claims is the easy way to go. If everyone says EV will reach more than 10%, 10 years from now and there is no way to check for these claims, then the easy way is just to make sim-ilar statements. In a way, it is like “l’homme qui a vu l’homme, qui a vu l’homme, …qui a vu l’ours » (a

88 j. massiani – the elusive foundations of electric vehicle supporting policy
French saying referring to a situation where people beliefs elaborate on other peoples beliefs with low correspondence to the original phenomenon). This generates as well hypermediality (people referring to media contents is a way of reinforcing beliefs) in the professional community of car industry analysts.
This situation could result in two possible attitudes. The first, probably naïve, one relies heavily, and arguably excessively, on the professional capacity of car industry analysts: “these guys probably know what they are doing”. This is nice, but should one believe that car industry analysts did their jobs, if journalists and other public debate participants did not, by not exerting minimal checks or at least pro-viding material for such checks from the recipient of the message. The other possible reaction, a more skeptical, if not nihilist one, is to reject claims, consistent with layman’s conviction that one should not believe what the media convey. This comfortable position allows to adhere to personal beliefs without considering third part information. It however seems that this claimed skepticism is ineffective in pre-venting against abuses in the way the public debate portraits the future of Electric Vehicles.
89 j. massiani – the elusive foundations of electric vehicle supporting policy
happeR, catheRine and GReG philo. “The Role of the Media in the Construction of Public Belief and Social Change”, Journal of social and political psychology 2013 vol 1. Role of media in shaping public opinion beliefs and policies.
kalWani, manohaR U. and alVin J. silk (1982), On the Reliability and Predictive Validity of Pur-chase Intention Measures Marketing Science Summer 1982 1:243-286; doi:10.1287/mksc.1.3.243
koomeY, Jonathan G., chRis calWell, skip laitneR, Jane thoRnton, RichaRD e. bRoWn, Jo-seph h. eto, caRRie WebbeR, and cathY cullicott. “Sorry, wrong number: The Use and Misuse of Numerical Facts in Analysis and Media Reporting of Energy Issues”, Annual Review of Energy and the Environment Vol. 27: 119-158 (publication date November 2002) DOI: 10.1146/annurev.energy.27.122001.083458.
massiani JéRôme (2012). “Using Stated Preferences to forecast alternative fuel vehicles market diffu-sion”. DOI:10.3280/SCRE2012-003006. pp.93-122. In SR SCIENZE REGIONALI - ISSN:1720-3929 vol. Vol. 11
massiani JéRôme (2015). “Cost-Benefit Analysis of policies for the development of electric vehicles in Germany: Methods and results”. DOI:10.1016/j.tranpol.2014.10.005. pp.19-26. In TRANSPORT POLICY - ISSN:0967-070X vol. 38
massiani JéRôme (2013) “Stated preference surveys for electric and alternative fuel vehicles: are we doing the right thing?”. DOI:10.1179/1942787514Y.0000000022. pp.152-160. In TRANSPOR-TATION LETTERS - ISSN:1942-7867 vol. 6
massiani JéRôme (2005). La valeur du temps en transport de marchandises, Thèse de doctorat, Uni-versité Paris XII Créteil.
massiani JéRôme (2012). “Using Stated Preferences to forecast alternative fuel vehicles market diffu-sion”. DOI:10.3280/SCRE2012-003006. pp.93-122. In SR SCIENZE REGIONALI - ISSN:1720-3929 vol. Vol. 11
massiani JéRôme (2015). “The choice of Bass model coefficients to forecast diffusion for innova-tive products: An empirical investigation for new automotive technologies”. DOI:10.1016/j.re-trec.2015.06.003. In RESEARCH IN TRANSPORTATION ECONOMICS - ISSN:0739-8859.
moRWitz, VickY G. (2007) “When do purchase intentions predict sales?”, International Journal of Forecasting Volume: 23 Issue: 3 (2007-01-01) ISSN: 0169-2070.
Riferimenti bibliografici