the electricity industry reform in korea: lessons for...
TRANSCRIPT

The Electricity Industry Reform in Korea: Lessons for
Further Liberalization
Junki Kim, Kyuhyun Kim
Graduate School of Public Administration, Seoul National University
Abstract
In April 2001, the generation unit of Korea Electric Power Corporation (KEPCO) was split into six subsidiary
companies with further plans for privatization. But, the process of privatization has ceased due to changes in
political environment. This study analyzes the performance of the restructuring of generation units using
financial and physical indices. The results from the analysis also show that the restructuring has had positive
effect on their performance. The financial indices of the generation companies also show that the prices of fuels,
intervention of government, and capability of management affect the performance of the companies. Although
the results do not show that restructuring favorably affected the prices of electricity, the indices of liability and
profitability show some promising signs arising from the electricity sector reform. To maintain these changes,
further liberalization needs to be followed, although there are some issues that need to be dealt with prior to
restructuring and privatization plans. The problems of proper reserve margin, the negative effect of regional
electricity company, and the conflict between cost saving and preserving environment are some of those need to
be dealt with. Those problems can be solved by institutional reform and further liberalization.
1. Introduction
In the past decade, the reforms in the electricity sector have speeded up and numerous reforms have proceeded.
As of June 2006, 14 countries have completed electricity sector reform programs while 60 countries are
undergoing electricity sector reform programs. These countries often remodeled earlier reform models to suit
their own needs and circumstance, and the electricity reform in Korea also proceeded in its own way. In April
2001, the generation portion of Korea Electric Power Corporation (KEPCO) was split into six subsidiary
companies: Korea South-East Power (KOSEP), Korea Midland Power (KOMIPO), Korea Western Power (WP),
Korea East-West Power (EWP), Korea Hydro & Nuclear Power (KHNP), and Korea Southern Power Co
(KOSPO). This essentially meant that original KEPCO has turned into a transmission and distribution monopoly
in Korea.
From 1961 until April 2001, South Korea's sole electric power utility was KEPCO. Set up as a government
corporation, 21% of its shares were sold to the public in 1989. After the currency crisis in 1997, the Korean
1

government started to make plans to privatize the electricity sector and the first step was spinning off KEPCO’s
generation unit into six separate subsidiary companies. It was the first step of restructuring of electricity sector.
The original plan was structured in three phases. The first step was spinning off and privatizing the generation
sector to create a competitive electricity market (CBP: Cost Based Pool). The second phase was restructuring
and privatizing the distribution sector to induce a two way bidding pool market. The third phase was opening the
electricity market for free competition. But plans to privatize generating companies and the following
restructuring and privatization of distribution(sales) sectors were ceased when President Roh came into power in
2003. As a result, the electricity sector reform remains as incomplete reform. Although the privatization plan is
likely to continue with the current administration, the current market structure poses numerous problems: first is
that there exists imperfect competition among the generation companies, second, the system leaves
opportunistic intervention by the state, and third, there exists a conflict between cost saving and preserving
environment.
This study seeks to analyze the performance of the current electricity system because this would provide useful
information as to the future course of policy reform ideas. And this study also seek to identify problems with the
market structure and find likely solutions in terms of market structure in all levels of electricity industry.
2. Background
Energy Policy in Korea
Throughout the years, the goal of Korea's energy policy has shifted from ensuring a stable supply of energy to
achieving sustainable development, largely due to rapidly changing internal and external conditions. In order to
maintain high economic growth in the 1970s, energy policies centered on oil, which was relatively easy and
cheap to buy. However, the two rounds of oil crisis significantly impacted the national economy, and new
policies have been pursued since the 1980s to establish a stable supply and demand system, including the
diversification of energy supply sources and expanding the energy supply infrastructure. The diversification
policy was to have nuclear power as a major element of electricity production and rationalization was pursued in
the coal industry.
From the late 1990s, restructuring of the energy sector was pursued in full-scale with the introduction of the
principle of free competition to such utility industries as electricity and gas which had been considered natural
monopolies. Furthermore, initiatives forwarded by the United Nations Framework Convention on Climate
Change have strengthened environmental regulations. As a result, sustainable development has emerged as the
focal point of Korea's recent shift in energy policy.
Electricity Market Operation System1
1 Recomposition of the information from www.kpx.co.kr
2

Prior to the restructuring of the electricity industry, KEPCO used to enjoy a monopoly over power generation,
transmission/distribution, and sales until the spinoff of its generation unit. Also, the government lifted entry
barriers that virtually made it impossible for IPPs (Independent Power Producer) to operate in the market. The
generation market structure as mandated by the electricity industry restructuring started in April 2001.
Nonetheless, KEPCO remains as the sole purchaser (power sales business) of electricity. Therefore, whereas
competition is allowed in the supply side in the current CBP market, monopoly is maintained on the demand
side. Given its current structure, the CBP market is competitive to the extent that generators compete with each
other. Moreover, since the Korean power system is maintained on a single national grid, there is no regional
trading market; only a single power trading market is required to coordinate and manage energy supply and
demand across the whole country.
The current Korean electricity system is based on the Cost-Based Pool (CBP) concept since the market price
reflects the actual generation cost. Under the pool system, all generators are obliged to submit the details of their
production costs which are independently checked and approved by the Generation Cost Assessment Committee
(GCAC). Using this information, Korea Power Exchange (KPX) prepares a Price Setting Schedule and
calculates the marginal price (SMP) based on the principle of minimizing the system variable cost. The market
price is composed of the system marginal price (SMP) and capacity payment (CP). Capacity payment is the
price paid to a generating unit that has declared its availability during the day. Price cap is imposed on the
energy price of base load generating units such as coal and nuclear energy. Marginal Price (SMP) is determined
as the most expensive generation available for the trading period in the Price Setting Schedule. After real-time
dispatching, settlement for the energy produced takes place based on the market price (SMP, Capacity Payment).
Settlement = Output×SMP + Capacity×CP + Other Payment
3. Literature Review
There are several studies on the performance of electricity sector reform. Pollitt (1997) categorizes empirical
studies on electricity sector reform into four groups: i) ones that use financial and physical indicators; ii) ones
that look at labor productivity measures or total factor productivity (TFP); iii) ones that use frontier
methodologies; and iv) approaches based on social cost benefit analysis of electricity privatization.
The first method is the simplest approach. Yarrow (1992) develops a counterfactual scenario which assumes
British electricity sector had not been privatized and compares the actual results. Branston (2000) further
improves the model and conducts counterfactual price analysis on the British electricity privatization. The result
is that the reform had minimal impact on prices. Duncan and Bollard (1992) analyze the impact of the reform of
the government control of Electricity Corporation of New Zealand. Rocha et al. (2007) analyze the return on
capital of Brazilian electricity distributors, and he concludes that the return on equity in Brazil was
systematically negative until 2003.
Bishop and Thompson (1992) analyze changes in the labor or total factor productivity growth rates as a result
3
of the 1983 Energy Act which sought to introduce limited competition into the electricity generation industry.
Haskel and Syzmanski (1992) examine the impact the implementation of divisional management structure in the
UK ESI in 1983. Plane (1999) estimates the total factor productivity of Côte d'Ivoire Electricity Company (CIE)
and he finds that productive efficiency improved due to privatization.
Hawdon (1996), using cross-sectional data for developing countries, finds that privatized firms in their sample
had higher productivity efficiency. Berg and Jeong (1991) analyze the effects of the introduction of incentive
regulation in the US and suggest that relative inefficiency is not reduced by narrow incentive regulation focused
on plant utilization and thermal efficiency. Cullmann and Hirshhausen (2008) provides a cross-country
efficiency analysis of electricity distribution companies in the East European transition countries of Poland , the
Czech Republic, Slovakia, and Hungary. The results suggest that privatization has had a positive effect on
technical efficiency in the four countries.
The fourth method measures the impact of privatization on the society as a whole. Jones et al. (1990) outline
the methodology, and Galal et al. (1994) apply it to 12 privatizations. Newbery and Pollitt (1997) applied the
methodology to the privatization case of Britain’s CEGB. Oliveira et al. (2004) measure the gains and loses of
shareholders, board members, fuel suppliers, consultants, equipment suppliers, service-providers, consumers,
government, and regulators created by the British ESI regulatory system. They conclude that the reform is
overall benefitial, although not for stakeholders. Toba (2007) measure the welfare impacts of the electricity
generation sector reform in the Philippines. The results show that consumers and investors are net gainers, while
the government lost due to loss of revenue while and environment lost due to increased pollution.
4. Theoretical Framework
This study uses various financial statements of KEPCO and the price of electricity to analyze the impact of the
restructuring program. A social cost benefit analysis tends to better evaluate the overall aspects of the
performance; however, it is hard to apply to partial electricity industry reform cases. And the analysis of labor
productivity is not adequate in this case because labor productivity is often affected by the total number of labor
(the labors in KEPCO are transferred to the generation companies). Therefore, it is more suitable to use financial
and physical indicators in this case.
First, this study analyzes the financial statement of electricity companies to look the performances of each
company. Then, this study examines the effect of electricity restructuring in Korea on the electricity companies’
financial indicators and electricity price.
Analysis of Financial Statements2
Financial statements are the starting point of analysis as they report data about income, cash flows, and assets
and liabilities that users can tailor to their specific needs. Financial reports often contain supplementary data
2 Recomposition of White et al. (2003)
4

that, although not included in the statements themselves, enable users to interpret the financial status of the
organization in question or to make adjustment of corporate performance (such as financial ratios) to make them
more comparable, consistent over time, and more representative of economic reality. The common aspects that
assess a company’s financial status are liability, profitability, and growth.
Analysis of Liability. A firm’s liabilities is crucial to the analysis of its long-run viability and growth. A firm
can incur obligations in various ways; some are a result of the firm’s operating activities, whereas others results
from its financing decisions. The former are characterized by exchanges of goods and services for the later
payment of cash (or vice versa), whereas debts arising from financing decisions generally involves current
receipts of cash in exchange for later payments of cash. Both forms of debts are generally reported on the
balance sheet.
Liability can be estimated by the current ratio3 and the debt ratio4. Lenders and creditors assess the ability of a
firm to meet its current obligations. That ability depends on the cash resources available as of the balance sheet
date and the cash to be generated through the operating cycle of firm. Current ratio compares levels of cash
resources with current liabilities as the measure of cash obligation. Long-term debt and solvency analysis
evaluates the level of risk borne by a firm, changes over time, and risk relative to comparable investments. A
higher proportion of debt relative to equity increases the riskiness of the firm.
Analysis of Profitability. Equity investors are concerned with the firm’s ability to generate, sustain, and
increase profits. Profitability can be measured in several different ways. First, the return on investment (ROI)
measures profits to the investment required to generate them. Return on investment (ROI) measures the
relationship between profits and investment required to generate them. The ratio on profits to sale residual
returns to the firm per sales dollar.
The return on assets (ROA)5 compares income with total assets. It can be interpreted in two ways. First, it
measures management’s ability and efficiency in using the firm’s assets to generate profits. Second, it reports
the total return accruing to all providers of capital, independent of the source of capital. The return on total
stockholders’ equity (ROE)6 excludes debt in the denominator and uses either pretax income (after interest costs)
or net income. Both ROA and ROE reflect the firm’s capital structure. Creditors and shareholders provide the
capital needed by the firm to acquire the assets used in the business. In return, they receive their share of the
firm’s profits. ROA measure returns to all providers of capital. ROE measures returns to the firm’s shareholder
and is calculated after deducting the returns paid to creditors (interest). The equity shareholder can earn higher
returns by “leveraging” the investment provided by the debt holders as long as the returns earned by the
company’s assets (ROA) are greater than the cost of debt. Operating margin7 is the relationship between the
firm’s costs and its sales. The ability to control costs in relation to revenues enhances earnings power.
3 Current Ratio = Current Assets/Current Liabilities4 Debt Ratio = Total Debt/Total Equity5 ROA = Net Income/Average Total Assets6 ROE = Net Income/Average Stockholders’ Equity7 Operating Margin = Operating Profit/Sales
5

Analysis of Growth. Analysis of growth premises a long-term management plan. The analysis offers
information about future income, sales, costs, and profit for a long-term management plan. Growth ratio shows
that the company’s ability to take the chance of growing, and it represents the company’s competiveness are
maintained well. In other words, the ratio is used to decide whether the status of the company is sustainable or
not. The indices are consist of growth rate of sales8, growth rate of operating profit9, growth rate of net income10,
and growth rate of assets11.
Analysis of the Effect of Electricity Reform
We also conduct regression analysis with dummy variables. The dependent variables included are price and
financial indicators and a dummy variable which is 1 periods after the reform of electricity sector. Independent
variables are also taken from earlier studies.
Yarrow (1992) conducted a price analysis to examine the performance of the British electricity privatization.
And, Branston (2000) renewed the methodology and executed a counterfactual price analysis of British
electricity privatization. Branston’s approach is similar to that of Yarrow where the cost of electricity has been
split into the three components shown in Equation (1):
(1)
where is the relevant price (per kWh) of electricity in year t; the ‘fossil fuel costs’ per unit (kWh) of
electricity sold in year t; and comprises ‘non-fossil fuel costs’ (per kWh) in year t; and the ‘profits’ (per
kWh) in year t. This model is also suitable for the examination of the Korean electricity reform since the
proportion of nuclear generation is high in Korea. And there is an implicit profit regulation in KEPCO. As a
result, there are three independent variables which are , , and .
Equation (1) uses the weighted unit cost of coal, gas, and oil generated electricity to calculate an estimate of
cost of fossil fuels per unit of fossil fuel generated electricity. However, Equation (1) does not take into account
the electricity generated from other, non-fossil fuel sources such as nuclear or hydro. But, Equation (2) takes
into account of this.
8 Growth Rate of Sales = (Current Sales–Last year’s Sales)/Last year’s Sales9 Growth Rate of Operating Profit = (Current Operating Profit-Last year’s Operating Profit)/Last year’s Operating Profit10 Growth Rate of Net Income = (Current Net Income-Last year’s Net Income)/Last year’s Net Income11 Growth Rate of Assets = (Current Assets-Last year’s Assets)/Last year’s Assets
6

(2)
where is the fossil fuel costs per unit (kWh) of electricity sold in year t which was generated using fossil
fuels; the proportion of electricity sold in year t, generated using coal; the unit (per kWh) fuel cost of coal
generated electricity in year t; the proportion of electricity sold in year t, generated using gas; the unit (per
kWh) fuel cost of gas generated electricity in year t; the proportion of electricity sold in year t, generated
using oil; and is the unit (per kWh) fuel cost of electricity generated using oil in year t.
To calculate the unit fuel cost of electricity generated from the different fossil fuels, the formula Yarrow and
Branston used can be applied to each of the fuels:
(3)
where is the unit fuel cost of electricity generated using fossil fuel i in year t; the unit price of fuel i in
year t; the quantity of the fuel i used in year t; and is the quantity of electricity generated using fuel i in
year t. Equation (4) is then used to calculated the costs of the fossil fuels per unit all the electricity sold and not
just the costs of the fossils fuels per unit of electricity generated by those fossil fuels, as was carried out in
Equation (2):
(4)
where is the fossil costs per unit (kWh) of electricity sold in year t; the fossil costs per unit (kWh) of
electricity sold in year t which was generated using fossil fuels; the number of units of electricity (kWh)
sold in year t which was generated using fossil fuels; and is the number of units of electricity (kWh) sold
in year t.
Although this study doesn’t conduct counterfactual analysis, these equations are useful for converting data.
Without these converting procedures, fuel cost’s effect can be overestimated to dependant variables.
5. Analysis of Financial Statements
7

The financial statements provide information about the performance of each generation company. We conduct
both the analysis of liability, profitability, and growth of each company as well as the generating units as a
whole.
Analysis of Liability
Current Ratio. The ideal current ratio is said to be above 200%. If KHNP is excluded (KHNP has different
scale from the other generation companies), the current ratios range from 31% to 112% (See Fig. 1 and Table 4).
Although the ratios are low to the industry standard, it does not mean that the companies are at a risk since they
receive a stable cash revenue from KEPCO in the current system.
Debt Ratio. The ideal debt ratio is said to be under 100%. The debt ratios range from 32% to 139% (See Fig. 2
and Table 5). They have a stable debt although the ratios are on the rise due to new constructions of power
plants.
Figure 1. Current Ratios of the generation
companies (Unit: %)
Figure 2. Debt Ratios of the Generation
Companies (Unit: %)
The liabilities of the generation companies are well managed under the current system. But the current ratios
are likely to improve with the future structural reform as they need to pay more attention to their financial
structure in the competitive markets.
Analysis of Profitability
ROA. We found that ROAs are usually lower than those of other industries. The average ROA of the generation
companies ranges between 3% to 7%, and the average for the last 3 years near 4% (See Fig. 3 and Table 6). It is
extraordinary to find their ROAs under 5%. It is expected their ROAs will improve due to increased
depreciation in the future.
8

ROE. ROE is an important summary measure of a firm’s profitability and the return on investment. It captures
many facets of a firm’s operating, investment, and financing characteristics. Given its importance, it is
worthwhile asking whether current ROE can be used to forecast future ROE levels. A related question is
whether abnormally high levels of profitability can be expected to continue into the future. Penman (1991)
provides some insight into these questions: (i) in the short term, approximating five years (except for extreme
portfolios), current levels of ROE persist into the future; (ii) over the long term, ROEs tend to revert toward an
average “economicwide” ROE.; (iii) although there is a trend toward the mean, the portfolio rankings persist.
That is, the portfolios with higher (lower) ROE tend to have higher (lower) ROEs in the future, however, the
differences between the portfolios narrow.
Figure 3. ROAs of the Generation Companies
(Unit: %)
Figure 4. ROEs of the Generation Companies
(Unit: %)
The ROEs of the generation companies move in similar patterns as shown in the above (See Fig. 4 and Table 7).
ROEs varied much during five years, and it shows a steady up swing movement recently. But the ROEs of EWP
and KOSEP are even lower than the base rates. These firms need to improve their efficiency for future course of
action.
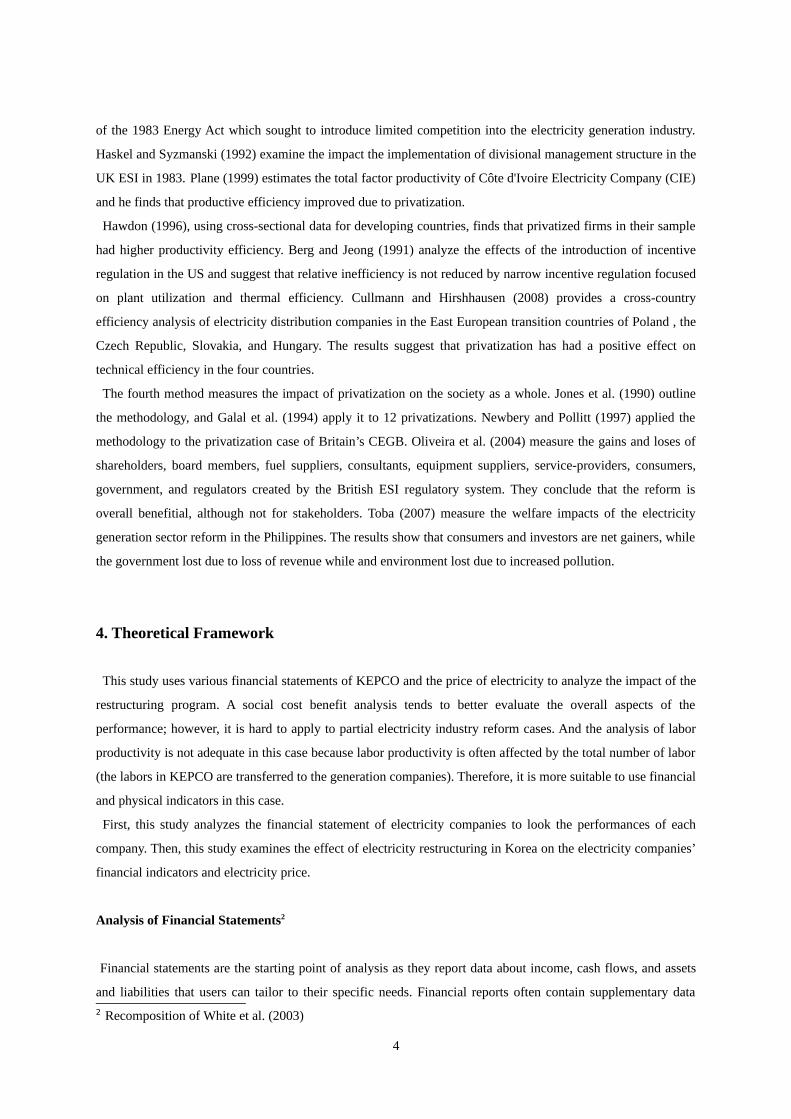
Figure 5. Operating Margins of the Generation
Companies
(Unit: %)
9
Operating Margin. Operating margin is an index that
shows the profitability of operating capital. The
operating margins of 5 companies using fossil fuels
sharply decreased in 2004 due to the electricity price
decrease (see Fig. 5 and Table 8). The reason for the
price decrease is that the operating profit of the
electricity company was high in 2003. The price of
electricity is decided by government which takes into
account the operating profit of electricity companies,
interest rate, and capital cost.
In terms of overall trend, the operating margins are
decreasing continuously with the increasing price of
fuels after 2004. On the contrary, the operation
margin of KHNP has remained high, because the
price of uranium were kept low.
Analysis of Growth
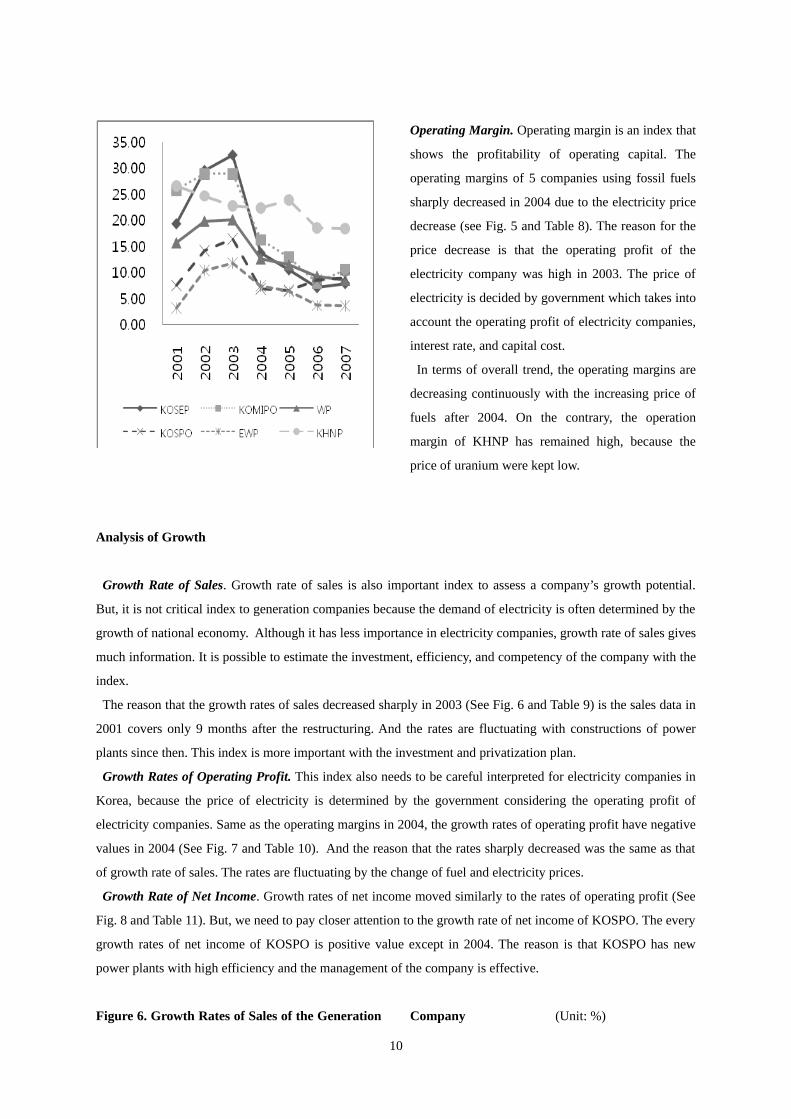
Growth Rate of Sales. Growth rate of sales is also important index to assess a company’s growth potential.
But, it is not critical index to generation companies because the demand of electricity is often determined by the
growth of national economy. Although it has less importance in electricity companies, growth rate of sales gives
much information. It is possible to estimate the investment, efficiency, and competency of the company with the
index.
The reason that the growth rates of sales decreased sharply in 2003 (See Fig. 6 and Table 9) is the sales data in
2001 covers only 9 months after the restructuring. And the rates are fluctuating with constructions of power
plants since then. This index is more important with the investment and privatization plan.
Growth Rates of Operating Profit. This index also needs to be careful interpreted for electricity companies in
Korea, because the price of electricity is determined by the government considering the operating profit of
electricity companies. Same as the operating margins in 2004, the growth rates of operating profit have negative
values in 2004 (See Fig. 7 and Table 10). And the reason that the rates sharply decreased was the same as that
of growth rate of sales. The rates are fluctuating by the change of fuel and electricity prices.
Growth Rate of Net Income. Growth rates of net income moved similarly to the rates of operating profit (See
Fig. 8 and Table 11). But, we need to pay closer attention to the growth rate of net income of KOSPO. The every
growth rates of net income of KOSPO is positive value except in 2004. The reason is that KOSPO has new
power plants with high efficiency and the management of the company is effective.
Figure 6. Growth Rates of Sales of the Generation Company (Unit: %)
10

Figure 7. Growth Rates of Operating Profit of the
Generation Company (Unit: %)
Growth Rate of Total Assets. Growth rate of total assets shows the growth of the investment. The growth rates
of total assets of the generation companies are also fluctuating by the changes of the fuel prices (See Fig. 9 and
Table 12). But the growth rate of total assets of KOSEP is increasing sharply since the construction of new
power plants. The total growth rate of total assets should be maintained continuously, because it is needed to
catch the increasing electricity demand. To escape a power shortage, the plan should be made and invested five
years ahead.
Figure 8. Growth Rates of Net Income of the
Generation Company (Unit: %)
Figure 9. Growth Rates of Total Assets of the
Generation Company (Unit: %)
11

In summary, the price of fuels and the price of electricity have big impact on the generation companies. The
increase of fuel price burdens the operating of the companies, and government influences the generation
companies’ profit by setting the price of electricity. But, the effects are varied by companies’ operating
efficiency and the equipments they have.
7. Analysis of the Impact of the Electricity Reform
Method
To analyze the impact of the electricity restructuring on the efficiency of electricity industry, several indices are
used in this analysis. In the model I, the price of electricity is used as the dependent variable, and the
independent variables include the price of fossil fuel, the price of non-fossil fuel, the profit of KEPCO, and the
electricity reform. The last independent variable is set as a dummy variable that reveals the impact of electricity
restructuring. All units of the data are US cent/kWh, and the prices of fuels are transformed by the equations in
the section of theoretical framework, and the period of analysis is from 1997 to 2006.
In the model II, the financial indices are used as the dependent variable, and the independent variables include
the price of fossil fuel, price of non-fossil fuel, and electricity restructuring. The financial indices are calculated
from consolidated financial statements of KEPCO which contains financial information about generation
companies. We analyze the data for a period from 1997 to 2006.
In the model III, the price of electricity is added to the independent variables of Model II, and the dependent
variables are the same. The price of electricity affect the financial indices since it influences the profits of these
companies. The price of electricity needs to be controlled, because it is determined by the government. This
model detects the impact of the restructuring excluding the effect from the electricity price changes.
Analysis of Results
The result of model I shows that the impact of the electricity reform is not significant in terms of the price of
electricity. This can be interpreted in two ways. One is the price setting of government blocked the impact of
electricity reform. The other is that the price could be already at a optimal level.
Table 1. Results of Model I Dependent
variableβ t value p-value R2 Adj-R2 F Value Pr > F
Price of electricity
-0.44389 -0.41 0.6955 0.7298 0.5947 5.4 0.0385
Notes: The independent variables are price of fossil fuel, price of non-fossil fuel, profit, and electricity restructuring. β is the
estimated coefficient of the dummy variable, electricity restructuring. The independent variables are standardized.
12

The results of model II are slight different. The current ratio has had positive impacts from the restructuring. It
shows that current ratio has increased since the restructuring. And debt ratio has had a positive impact too. The
debt ratio has decreased since the electricity reform. The index of liability has improved. It seems that KEPCO
tried to enhance its liability preparing for the further liberalization.
The indices of profitability also have positive value. ROA and operating profit have significant results while
ROE remain insignificant. The ROA and operating profit increased sharply after the restructuring (See Fig. 12
and Table 13), but the ratios decreased due to the price increase of fuel since 2004. If the effect of price increase
is eliminated, the impact of electricity reform is positive in terms of profitability. This implies that the
restructuring brought about some positive impacts on the efficiency of the companies’ operation.
The growth rate of sales and growth rate of total asset are the significant indices among growth indices.
Growth rate of sales of electricity is affected by the economic growth, so the result does not have substantial
meaning in this study. Also, growth rate of total asset has a negative impact of the restructuring. That means the
reform of electricity industry gave negative impact on the investment.
Table 2. Results of Model II
Dependent variable
β t value p-value R2 Adj-R2 F Value Pr > F
CRa*** 17.4158 5.1 0.0014 0.9754 0.9684 138.73 <.0001DRb* -44.4345 -2.27 0.0576 0.5907 0.4738 5.05 0.0439ROA** 1.36965 2.69 0.031 0.5396 0.408 4.1 0.0662ROE 1.96893 1.84 0.1085 0.3296 0.1381 1.72 0.2467OMc*** 5.99062 5.08 0.0014 0.8516 0.8092 20.09 0.0013GRSd** -6.52656 -2.64 0.0333 0.5572 0.4307 4.4 0.0578GROPe -7.3385 -0.86 0.4186 0.6811 0.59 7.48 0.0183GRNIf 1.22026 0.04 0.9709 0.1913 -0.0398 0.83 0.4756GRTAg* -14.5186 -1.93 0.0951 0.3955 0.2228 2.29 0.1717
Notes: The independent variables are price of fossil fuel, price of non-fossil fuel, and electricity restructuring. β is the
estimated coefficient of the dummy variable, electricity restructuring. The independent variables are standardized.
Significance Levels: * p<0.1, ** p<0.05, *** p<0.01
a. Current Ratio. b. Debt Ratio. c. Operating Margin. d. Growth Rate of Sales. e. Growth Rate of Operating Profit. f. Growth
Rate of Net Income. g. Growth Rate of Total Asset.
The results of model III also have some significant outcomes. Although the debt ratio is no more significant, the
liability of the company is still improved. That means the reform still affected positively on the liability of the
company when the effect from the price changes of electricity is excluded.
The ROA is still significant at the 90% significance level, and the operating margin is significant at 99%
significance level. The ROA’s significance level is decreaed, because the increases of electricity price can
13
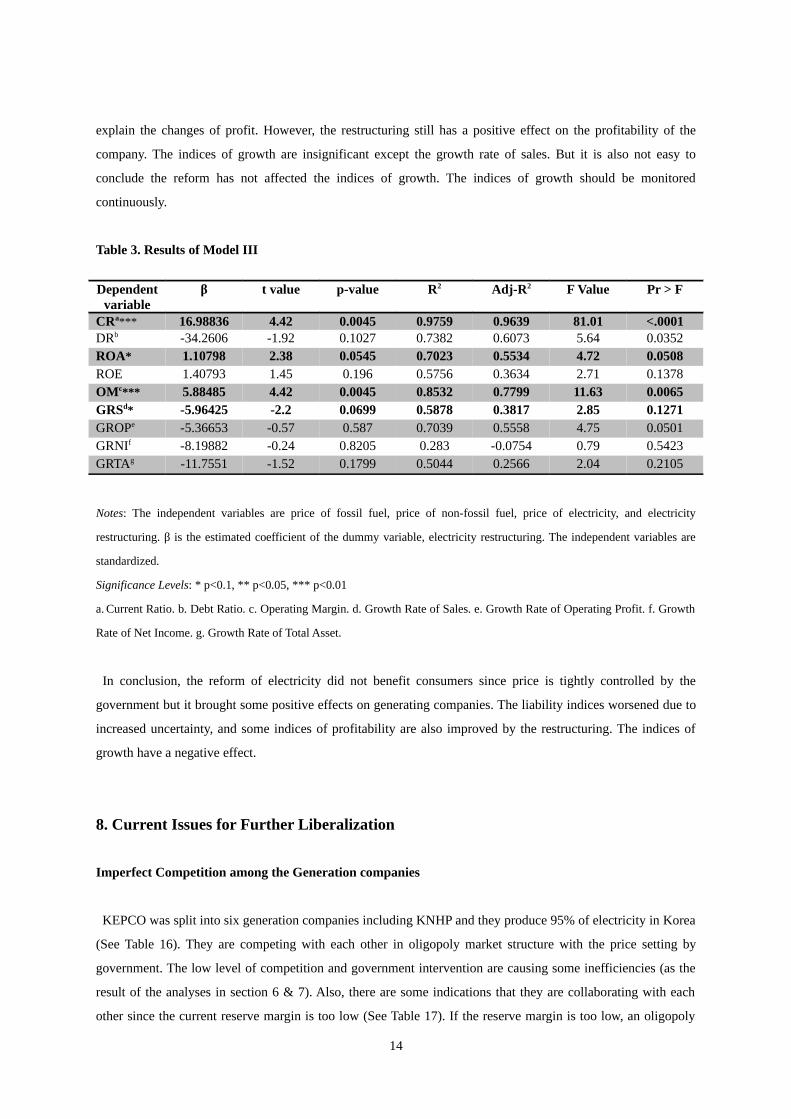
explain the changes of profit. However, the restructuring still has a positive effect on the profitability of the
company. The indices of growth are insignificant except the growth rate of sales. But it is also not easy to
conclude the reform has not affected the indices of growth. The indices of growth should be monitored
continuously.
Table 3. Results of Model III
Dependent variable
β t value p-value R2 Adj-R2 F Value Pr > F
CRa*** 16.98836 4.42 0.0045 0.9759 0.9639 81.01 <.0001DRb -34.2606 -1.92 0.1027 0.7382 0.6073 5.64 0.0352ROA* 1.10798 2.38 0.0545 0.7023 0.5534 4.72 0.0508ROE 1.40793 1.45 0.196 0.5756 0.3634 2.71 0.1378OMc*** 5.88485 4.42 0.0045 0.8532 0.7799 11.63 0.0065GRSd* -5.96425 -2.2 0.0699 0.5878 0.3817 2.85 0.1271GROPe -5.36653 -0.57 0.587 0.7039 0.5558 4.75 0.0501GRNIf -8.19882 -0.24 0.8205 0.283 -0.0754 0.79 0.5423GRTAg -11.7551 -1.52 0.1799 0.5044 0.2566 2.04 0.2105
Notes: The independent variables are price of fossil fuel, price of non-fossil fuel, price of electricity, and electricity
restructuring. β is the estimated coefficient of the dummy variable, electricity restructuring. The independent variables are
standardized.
Significance Levels: * p<0.1, ** p<0.05, *** p<0.01
a. Current Ratio. b. Debt Ratio. c. Operating Margin. d. Growth Rate of Sales. e. Growth Rate of Operating Profit. f. Growth
Rate of Net Income. g. Growth Rate of Total Asset.
In conclusion, the reform of electricity did not benefit consumers since price is tightly controlled by the
government but it brought some positive effects on generating companies. The liability indices worsened due to
increased uncertainty, and some indices of profitability are also improved by the restructuring. The indices of
growth have a negative effect.
8. Current Issues for Further Liberalization
Imperfect Competition among the Generation companies
KEPCO was split into six generation companies including KNHP and they produce 95% of electricity in Korea
(See Table 16). They are competing with each other in oligopoly market structure with the price setting by
government. The low level of competition and government intervention are causing some inefficiencies (as the
result of the analyses in section 6 & 7). Also, there are some indications that they are collaborating with each
other since the current reserve margin is too low (See Table 17). If the reserve margin is too low, an oligopoly
14

company can use oligopoly power more easily. Almost all countries that went through successful electricity
reform had a reserve margins above 20% (Toda (2005)), but current reserve margin of electricity in Korea is
only 7.2%.
However, it is also hard to compare the current margin to those of before, because the scale of electricity
capacity is different. Maintaining 20% of reserve margin will cause excessive waste in the current electricity
market. So, it is needed to study adequate reserve margin that doesn’t cause over usage of oligopoly power and
excessive waste.
Regional Electricity Company’s Problems in Distorted price system
Regional electricity company is the company that has the privilege of general electricity company within the
specific region where the company can supply more than 70% of the regional electricity demand. In this case,
the company can escape the compulsory pool and uniform price. This aspect can reduce electricity price, save
transmission cost, and improve the plant efficiency when the plant is combined cycle. But there are more
negative effects of regional electricity company in Korea. The pricing structure of electricity in Korea is
cumulative that the maximum rate is 11 times higher than the minimum rate, and that causes severe cross
subsidization. In this case, if a regional electricity company buys electricity at low price and sells the electricity
at high price, then other regions consumers have disadvantage (See Fig. 10).
Figure 10. Cross Subsidization under a Regional Electricity Company
Note: Regional electricity companies usually supply the electricity only to general and apartment
And, there are the problem of duplicated equipment and the problem of meeting the demand. The former
transmission/distribution equipment is useless when a new regional electricity company constructs new
equipment, and a regional electricity company is hard to meet the demand due to lack of risk absorbing ability.
15

To prevent these problems, the standard of supply capacity should be reinforced. A regional electricity company
should generate near 100% of the regional electricity demand, and it need to grant a permission with expiration.
Also, government should provide some incentive to share transmission/distribution equipment.
.
Conflict between Cost saving and Preserving environment
To save fuel costs and ultimately reduce the price of electricity in the long term, the regulators need to expand
the base load generators. Base load generation includes units such as coal and nuclear energy. The cost of base
load tends to ne much lower than the cost of other generating units, and the price of current pricing system
reflects critically which generator has generated the last unit of electricity. So, the proportion of base load is the
key factor of electricity reform. But the scale of the investment is much bigger than that of other generating
units. It means that the regulatory need to confer more structured incentive to increase the investment of base
load.
However, this needs to be balanced by the environmental factors as base load units tend to serious harm the
environment. Also, the Kyoto protocol urges nations to reduce emission of greenhouse gases from 2008. This
implies that cost saving issues and environmental considerations should be taken into account when making
short- and long-term investment plans: perhaps we can maintain the current proportion of base load in the short-
term while investing more on alternative energy sources in the long-term. The cost of alternative energy is high
at this point, but it will likely decrease as the technologies evolve.
9. Summary and Limitations
This study analyzed the overall impact of the electricity reform in Korea, and reviewed the current issues on the
electricity sector in Korea. The analysis of financial statements showed that the price of fuels and the price of
electricity affected the performance of generation companies. It is hard to expect the operation of companies
will improve much without privatization, because the intervention of government prevents the electricity market
from full market competition.
We found that the restructuring program has had different impact on generating companies. Depending on the
competency of the management, companies have responded differently to the reform program. In making this
type of statement, we need to carefully take into account the different investment and management
characteristics of each generating units.
The analysis of the impact of the electricity reform generally showed a positive. Although the price of
electricity has not fallen significantly, the liability and profitability indices showed positive changes. It appears
that the intervention of government reduced the effect of restructuring on the price of electricity. The indices of
profitability (especially ROA and operating margin) have shown a positive effect from the electricity reform. In
sum, ROA (increased 1.1% at model III) and operating margin (increased 5.9% at model III) improved after the
restructuring. We have found that generating companies were successful in reducing their operating cost.
16

In addition, the growth potential of these companies declined, although it is hard to interpret that the effect is
substantial since the data has an outlier. Also, the decrease in the growth rate of assets means the decrease of
investment. If the investment shrinks, then the depreciation cost is reduced and the profit is increased. That
caused the improvement of indexes of profitability. Decrease of investment is also a factor of electricity price
increase in future, and the trend of the indices of profitability is returning to the previous level. These all mean
that the impact of restructuring can be negative in the long-term. Therefore it is needed to improve current
system continuously.
For further liberalization, there are several problems in the electricity market in Korea. Current electricity
market in Korea is oligopoly. There are many possibilities that the structure could cause critical problems in
future. The generation companies can use their oligopoly power because the electricity reserve margin is
currently quite low. It is quite hard to decide which reserve margin is optimal for the future, but it should be
studied further.
The regional electricity company is causing numerous problems under the distorted pricing system. The
cumulative pricing system enable policy makers to cross subsidize each other causing severe misallocation of
resources. These problems can only be solved by the institutional level changes.
In addition, we need more discussion on the optimal level of based loads and the future course of action sicne
there are trade-offs involved in terms of cost saving and environmental costs. We need to be smart about
designing incentive for future investment in generating units as it has future implications on not only costs but
also environmental issues.
The impact of the electricity reform is hard to estimate because it affects several entities in a number of
different areas. This study is based financial and physical analysis of six generating units that were spinned off
from the state monopoly unit of KEPCO and there are many areas this study did not take into account.
Although the best way to compare the states of before and after is to count direct costs and benefits, we had
virtually little data to work with. Therefore, it is hard to decide only with the result of this analysis, but it gives
some reference for further studies.
17

Table 4. Current Ratios of the Generation Companies
(Unit: %)2001 2002 2003 2004 2005 2006 2007
KOSEP 62.15 30.96 57.37 64.27 75.15 88.64 68.31
KOMIPO 63.60 56.53 91.13 80.15 98.43 83.12 83.85
WP 72.72 129.08 132.22 114.01 126.76 101.96 111.81
KOSPO 52.85 37.76 48.40 69.20 89.44 101.50 74.77
EWP 65.62 79.01 57.81 60.84 124.43 103.36 101.16
KHNP 54.18 83.85 122.65 160.60 274.33 438.35 370.32
Table 5. Debt Ratios of the Generation Companies
(Unit: %)2001 2002 2003 2004 2005 2006 2007
KOSEP 98.49 78.71 68.30 79.96 78.75 96.21 138.93
KOMIPO 98.92 66.14 31.64 40.88 40.84 46.93 66.37
WP 105.42 79.36 52.80 44.46 48.42 61.09 60.13
KOSPO 110.22 86.40 84.57 67.91 61.21 52.93 61.57
EWP 107.95 82.56 66.53 64.62 73.52 75.76 83.13
KHNP 105.36 88.63 83.07 71.37 69.98 66.95 72.01
Table 6. ROAs of the Generation Companies
(Unit: %)2001 2002 2003 2004 2005 2006 2007
KOSEP 6.10 10.80 11.02 4.41 2.98 2.06 1.86
KOMIPO 5.41 11.10 12.34 7.09 6.84 4.93 4.79
WP 4.12 7.25 8.13 5.35 5.79 4.58 4.60
KOSPO 0.42 3.95 4.96 2.63 3.00 5.74 5.82
EWP -0.58 1.62 2.17 2.32 2.40 1.02 0.73
KHNP 2.80 4.11 3.35 3.90 4.69 3.51 3.44
Table 7. ROEs of the Generation Companies
(Unit: %)2001 2002 2003 2004 2005 2006 2007
KOSEP 12.10 20.26 19.07 7.68 5.34 3.87 4.05 KOMIPO 10.76 20.10 18.17 9.67 9.63 7.09 7.51
WP 8.45 13.89 13.44 7.95 8.48 7.09 7.39
KOSPO 0.87 7.81 9.20 4.64 4.94 9.01 9.15
EWP -1.20 3.15 3.79 3.84 4.06 1.78 1.31
KHNP 5.76 8.07 6.23 6.90 8.00 5.90 5.83
18

Table 8. Operating Margins of the Generation Companies
(Unit: %)2001 2002 2003 2004 2005 2006 2007
KOSEP 19.37 29.57 32.52 13.77 10.56 7.16 7.93 KOMIPO 25.85 28.96 28.92 16.33 13.00 8.04 10.61 WP 15.70 19.81 20.09 12.67 11.48 9.34 8.61 KOSPO 7.46 14.13 16.43 6.85 6.53 8.56 8.95 EWP 3.18 10.35 11.81 7.41 6.37 3.70 3.64 KHNP 26.62 24.70 22.85 22.39 23.90 18.64 18.43
Table 9. Growth Rates of Sales of the Generation Companies
(Unit: %)2002 2003 2004 2005 2006 2007
KOSEP 30.40 1.86 10.95 24.55 -1.22 7.75 KOMIPO 56.27 11.62 6.27 16.63 11.76 12.68 WP 36.95 6.05 -3.59 8.23 8.85 26.61 KOSPO 37.49 12.53 34.62 4.72 16.20 12.66 EWP 35.03 1.95 8.07 4.94 18.41 12.29 KHNP 42.01 9.28 0.08 10.86 -1.21 -0.94
Table 10. Growth Rates of Operating Profit of the Generation Companies
(Unit: %)2002 2003 2004 2005 2006 2007
KOSEP 99.10 12.04 -53.04 -4.45 -33.03 19.30 KOMIPO 75.06 11.48 -40.00 -7.17 -30.88 48.78 WP 72.84 7.55 -39.20 -1.92 -11.47 16.71 KOSPO 160.26 30.89 -43.86 -0.23 52.29 17.87 EWP 339.35 16.27 -32.13 -9.91 -31.20 10.51 KHNP 31.76 1.11 -1.91 18.31 -22.95 -2.04
Table 11. Growth Rates of Net Income of the Generation Companies
(Unit: %)2002 2003 2004 2005 2006 2007
KOSEP 84.06 13.40 -56.04 -30.62 -26.47 7.20 KOMIPO 104.37 8.04 -40.71 5.42 -22.22 11.14 WP 76.39 9.61 -36.35 12.18 -11.63 9.54 KOSPO 829.20 26.76 -47.45 9.50 93.80 9.02 EWP 23.61 3.51 8.71 -55.34 -26.03 KHNP 46.16 -18.01 19.65 25.36 -23.36 1.39
Table 12. Growth Rates of Total Assets of the Generation Companies
(Unit: %)2002 2003 2004 2005 2006 2007
KOSEP 7.91 13.99 6.18 -0.37 12.51 25.14 KOMIPO -0.74 -4.91 11.54 7.35 8.54 19.88
19

WP 0.13 -4.54 -2.05 9.64 13.65 4.78 KOSPO -4.15 6.22 -7.95 0.42 2.23 12.98 EWP -9.23 -6.61 0.59 9.58 1.17 4.93 KHNP -0.42 1.26 4.25 4.55 0.47 6.10
Figure 11. Liability Indices of KEPCO
(Unit: %)
Table 13. Liability Indices of KEPCO
(Unit: %)1997 1998 1999 2000 2001 2002 2003 2004 2005 2006 2007
Current Ratio
39.4 40.7 31.6 34.9 57.9 51.2 60.0 72.3 98.2 102.0 100.0
Debt Ratio 173.9 171.8 113.6 105.7 112.7 95.5 89.8 81.4 76.5 83.3 87.3
Figure 12. Profitability Indices of KEPCO
(Unit: %)
20

Table 14. Profitability Indices of KEPCO
(Unit: %)1997 1998 1999 2000 2001 2002 2003 2004 2005 2006 2007
ROA 1.4 2.3 2.6 2.3 2.4 4.3 3.3 4.0 3.2 2.9 1.8ROE 3.4 6.4 6.0 4.8 5.0 8.9 6.3 7.4 5.8 5.2 3.3
Operating Margin
14.9 16.4 16.3 18.5 19.7 23.6 22.9 18.6 15.4 12.4 9.7
Figure 13. Growth Indices of KEPCO
(Unit: %)
Table 15. Growth Indices of KEPCO
(Unit: %)1997 1998 1999 2000 2001 2002 2003 2004 2005 2006 2007
21
Growth Rate of Sales
13.7 7.7 10.7 18.8 8.1 5.6 6.6 5.2 6.2 7.7 6.3
Growth Rate of Operating
Profit
19.0 18.3 10.3 34.9 15.0 26.5 3.5 -14.5 -12.2 -13.4 -16.9
Growth Rate of Net
Income
-3.3 96.1 27.6 0.4 10.4 87.2 -24.2 24.1 -16.5 -7.6 -35.9
Growth Rate of Total Assets
31.0 6.4 27.3 1.8 7.0 -0.1 1.7 2.7 1.5 6.0 4.7
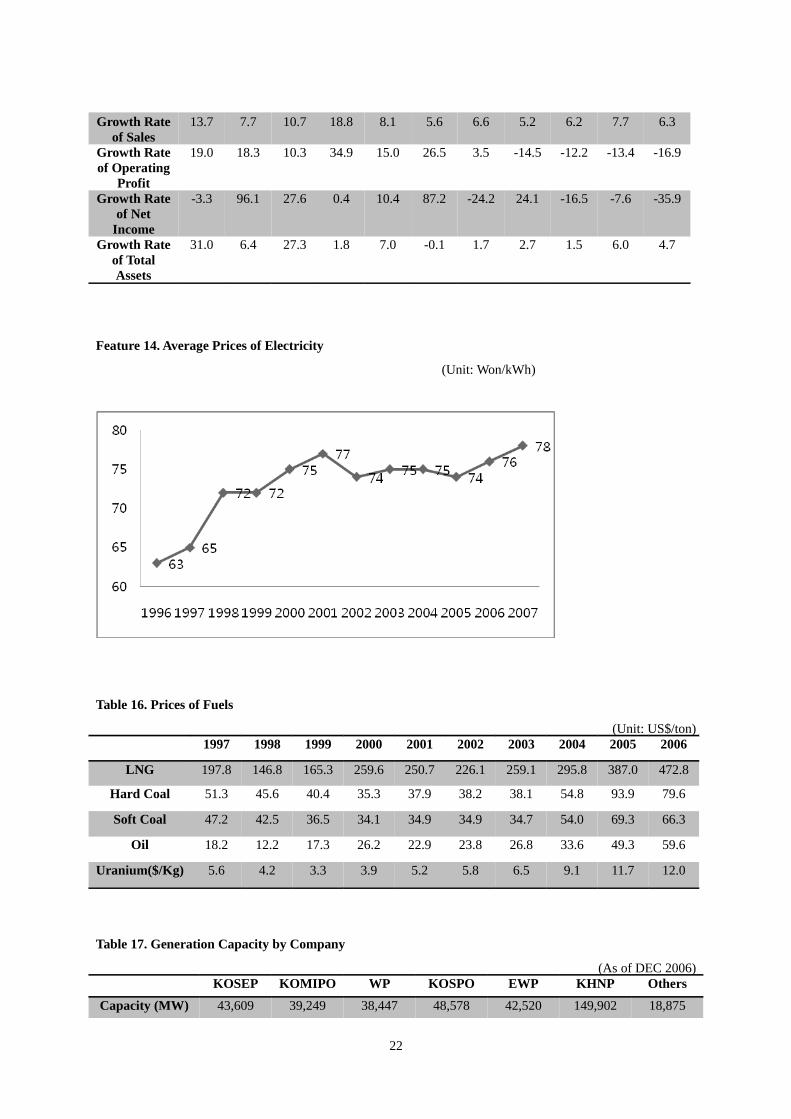
Feature 14. Average Prices of Electricity
(Unit: Won/kWh)
Table 16. Prices of Fuels
(Unit: US$/ton)1997 1998 1999 2000 2001 2002 2003 2004 2005 2006
LNG 197.8 146.8 165.3 259.6 250.7 226.1 259.1 295.8 387.0 472.8
Hard Coal 51.3 45.6 40.4 35.3 37.9 38.2 38.1 54.8 93.9 79.6
Soft Coal 47.2 42.5 36.5 34.1 34.9 34.9 34.7 54.0 69.3 66.3
Oil 18.2 12.2 17.3 26.2 22.9 23.8 26.8 33.6 49.3 59.6
Uranium($/Kg) 5.6 4.2 3.3 3.9 5.2 5.8 6.5 9.1 11.7 12.0
Table 17. Generation Capacity by Company
(As of DEC 2006)KOSEP KOMIPO WP KOSPO EWP KHNP Others
Capacity (MW) 43,609 39,249 38,447 48,578 42,520 149,902 18,875
22

The Component ratio (%)
11.44 10.30 10.09 12.74 11.15 39.33 4.95
Table 18. Supply of Electricity in Korea
(Unit : 10MW)
23
1996 1997 1998 1999 2000 2001 2002 2003 2004 2005 2006 2007
Peak Demand 3,228 3,585 3,300 3,729 4,101 4,313 4,577 4,739 5,126 5,463 5,899 6,229
Growth Rate (%)
8 11.1 -8 13 10 5.2 6.1 3.5 8.2 6.6 8 5.6
Installed Capacity
3,572 4,053 4,326 4,443 4,788 4,963 5,280 5,608 5,913 6,174 6,478 6,720
Available Capability
3,430 3,845 3,793 4,342 4,608 4,870 5,211 5,549 5,753 6,082 6,518 6,678
Reserve 201 260 493 613 507 557 634 810 626 619 619 449
Reserve Margin (%)
6.2 7.3 14.9 16.4 12.4 12.9 13.9 17.1 12.2 11.3 10.5 7.2
Reference
Bacon, R.W., Besant-Jones, J., 2001, Global Electric Power Reform, Privatization, and Liberalization of the
Electronic Power Industry in Developing Countries, Annu. Rev, Energy Environ. 26 pp.331-59.
Berg, S. and Jeong, J., 1991, An Evaluation Of Incentive Regulation For Electric Utilities, Journal of Regulatory
Economics, Vol.3, No.1, pp. 45-55.
Bishop, M. and Thompson, D., 1992, ‘Regulatory Reform And Productivity Growth In The UK’s Public
Utilities’, Applied Economics, Vol.24, No.11, pp. 1181-1190.
Branston, J.R., 1999. The price of independents: an analysis of the independent power sector in England and
Wales, Mimeo. L’institute, The University of Birmingham.
Branston, J.R., 2000, A couterfactual price analysis of British electricity privatisation, Utilities Policy 9
pp.31-46.
Bunn, D. and Vlahos, K., 1989, ‘Evaluation of the Long-term Effects on Electricity Prices following
Privatisation’, Fiscal Studies, Vol.10, No.4, pp.104-116.
Bunn, D.W., 1993, Evaluating the Effects if Privatizing Electricity, Journal of the Operational Research Society
vol. 45, No4, pp.367-375.
Burns, P. and Weyman-Jones, T., 1994, Productive efficiency and the regulatory review of regional electricity
companies in the UK, Regulatory Policy Research Centre, Discussion Paper No.1.
Comnes, G.A., Kahn, E.P. and Belden, T.N., 1996, ‘The Performance of The US Market For Independent
Electricity Generation’, The Energy Journal, Vol.17, No.3, pp.23-39.
Cullmann A., Hirshhausen C., 2008, Efficiency analysis of East European electricity distribution in transition:
legacy of the past?, J Prod Anal (2008) 29, pp.155–167.
Duncan, I. and Bollard, A., 1992, Corporatisation and Privatisation: Lessons from New Zealand, Auckland:
Oxford University Press.
Galal, A., Jones, L., Tandon, P. and Vogelsang, I., 1994, Welfare Consequences of Selling Public Enterprises -
An Empirical Analysis, Oxford: Oxford University Press.
Haskel, J. and Sanchis, A., 1995, ‘Privatisation and X-inefficiency: A bargaining approach’, Journal of Industrial
Economics, Vol.43, No.3, pp.301-321.
Haskel, J. and Szymanski, S., 1992, The Effects of Privatisation, Restructuring and Competition on Productivity
Growth in the UK Public Corporations, Queen Mary and Westfield Department of Economics Working
Paper No.286.
Hawdon, D., 1996, Performance of power sectors in developing countries - a study of efficiency and World
Bank policy using data envelopment analysis, Surrey Energy Economics Centre Discussion Paper,
No.88.
Hewlett, J.G., 1996, ‘Economic And Regulatory Factors Affecting The Maintenance Of Nuclear Power Plants’,
The Energy Journal, Vol.17, No.4, pp.1-31.
Hope, E., Rud, L. and Singh, B., 1993, Market for Electricity: Economic Reform of the Norwegian Electricity
Industry, SNF, Oslo, Working Paper No.12.
24

Hunt, L., 2003, Energy in a Competitive Market, Edward Elgar.
Murray, B., 1998, Electricity Markets, John Wiley & Sons
Newbery, D.M.G. and Pollitt, M.G., 1997, ‘The Restructuring and Privatisation of Britain’s CEGB -Was it
worth it?’, Journal of Industrial Economics, Vol.45, No.3, pp.269-303.
Jones, L.P., 1994, ‘Appropriate Regulatory Technology: The Interplay of Economic and Institutional
Conditions’, Proceedings of the World Bank Annual Conference on Development Economics, 1993:
Supplement to The World Bank Economic Review and The World Bank Research Observer..
Washington, D.C.: World Bank, 1994, pp.181-204.
Jones, L.P., Tandon, P. and Vogelsang, I. (1990), Selling Public Enterprise. A Cost-Benefit Methodology,
Cambridge, Mass.: MIT Press.
Kirshen, D.S., Strbac, G., 2004, Fundamentals of Power System Economics, Wiley.
Plane, P., 1999, Privatization, Technical Efficiency and Welfare Consequences: The Case of the Côte d'Ivoire
Electricity Company(CIE), World Development vol. 27, No.2, pp.343-360.
Pollitt, M.G., 1995, Ownership and Performance in Electric Utilities, Oxford: Oxford Institute for Energy
Studies/ Oxford University Press.
Pollitt, M.G., 1997, The Impact of Liberalisation on the Performance of the Electricity Supply Industry: an
International Survey, The Journal of Energy Literature III (2).
Prandini, A., 2007, Good, BETTA, best? The role of industry structure in electricity reform in Scotland, Energy
Policy 35, pp.1628-1642.
Rocha, K., Camacho, F., Bragaҫa, G., 2007, Return on capital of Brazilian electricity distributors: A comparative
analysis, Energy Policy 35 pp.2526-2537.
Rothwell, G., Gomez, T., 2003, Electricity Economics-Regulation and Deregulation, Wiley-Interscience.
Sioshansi, F.R., Pfaffenberger, W.,2006, Electricity Market Reform-An International Perspective, Elsevier.
Stickney, C.P., Brown, P.R., Wahlen, J.M., 2004, Financial Reporting and Statement Analysis-A Strategic
Perspective, Thomson.
Toda, N., 2005, "Development of Japanese Model in the Liberalization of Electricity Market", presented in
International Conference of KDI for Electricity Restructuring, June 20~21.
Toda, N., 2007, Welfare impacts of electricity generation sector reform in the Philippines, Energy Policy 35
pp.6145-6162.
Thomas, S., 1996a. The privatization of the electricity supply industry. In: Surrey, J. (Ed.), The British
Electricity Experiment. Privatization: The Record, The Issues, The Lessons. Earthscan, London, pp. 40–
66.
Thomas, S., 1996b. The development of competition. In: Surrey, J. (Ed.), The British Electricity Experiment.
Privatization: The Record, The Issues, The Lessons. Earthscan, London, pp. 67–94.
Warkentin, D., 1998, Electric Power Industry-In Nontechnical Language, PennWell.
White, G.I., Sondhi, A.C., Fried, D., 2003, The Analysis and use of Financial Statements, Wiley.
Yarrow, G.K., 1989, Privatisation and Economic Performance, Carnegie-Rochester Conference Series on Public
Policy, Vol.31, pp.303-344.
25

Yarrow, G.K., 1992, British electricity prices since privatisation, Oxford: Regulatory Policy Institute.
26