the eight steps to a high performance organisation · 1 created by stacey barr ... you can read...
TRANSCRIPT

Profit by DesignTM Workshop In-house Program Details
The Eight Steps
to a High Performance
Organisation

The Eight Steps to a High
Performance Organisation
W W W . M AR K HO CKN E LL . COM 0438 451 405 M AR K@ M AR K HOC KN EL L .C OM Page 1 of 19
Contents
The Eight Steps to a High Performance Organisation ............................................................ 2
Phase one: Engage your people and design your measurement system. ........................... 4
Step One - State Your Purpose .............................................................................................. 4
Step Two - Measurable Strategy in Results .......................................................................... 5
Step Three - Designing Meaningful Performance Measures ............................................. 7
Step Four - Fine-tune and Create Buy-in with the Measure Gallery.................................. 9
Phase Two: Build and use your measurement system. ...................................................... 11
Step Five - Defining Measures ............................................................................................. 11
Step Six - Consistent Interpretation and Target Setting ......................................................... 12
Step Seven - Manage Performance ....................................................................................... 15
Step Eight - Encourage a Learning Culture ............................................................................ 17
Summary - your call to action..! ............................................................................................... 18
About the Author ...................................................................................................................... 19

The Eight Steps to a High
Performance Organisation
W W W . M AR K HO CKN E LL . COM 0438 451 405 M AR K@ M AR K HOC KN EL L .C OM Page 2 of 19
The Eight Steps to a High Performance Organisation
High performance organisations have three key characteristics.
1. They have leaders that know how to set the direction in a way that allows the people of
the organisation to contribute on how we get there. These leaders will also seek
evidence to monitor how the journey is progressing and coach the teams on how to
improve.
2. They have teams that have selected to buy-in, and are engaged in learning how to
improve performance.
3. They have a performance measurement system in place that provides quantitative
feedback on, not only what performance is doing, but also on the impact their initiatives
are having.
A high performing organisation (HPO) is built upon the behaviours of the leaders. The
leaders of HPOs also use an evidence-based approach and a solid methodology. The
following eight steps are based on and inspired by, how to implement the PuMP®1
performance measurement methodology. But first let's hear what Dean Spitzer has to
say about one of the most important and yet neglected systems within an organisation.
Spitzer says:
“Effective management is based on a foundation of effective measurement, and almost
everything else is based on that… Organizations are conglomerations of many systems.
Measurement is actually the most fundamental system of all. When the “measurement
system” works well, management tends to manage (and reward) the right things – and the
desired results will occur. The measurement system – for good or ill – triggers virtually
everything that happens in an organization, both strategic and tactical. This is because all
the other organizational systems are ultimately based on what the measurement system is
telling the other systems to do.”
Dean Spitzer, Transforming Performance Measurement, (2007,pages 13-14).
From here we will use the term "measurement system" in the way Dean Spitzer meant
it. It is the set of results, measures, data collection and representations, targets and
such. It is the business system for choosing what we measure and how we use the
measures.
1 Created by Stacey Barr (http://www.staceybarr.com). You can read more in Stacey's books: Practical
Performance Measurement (2014), and: Prove it! (2017)

The Eight Steps to a High
Performance Organisation
W W W . M AR K HO CKN E LL . COM 0438 451 405 M AR K@ M AR K HOC KN EL L .C OM Page 3 of 19
From the diagram above we can see how the Performance Measurement Framework
(or system) underpins the implementation and adaption of strategy. Following the
design and planning of strategy we move into implementation and delivery. Our
measurement system will inform elements of this process to ensure the planning and
implementation stays on track with the initial intent. Likewise when the implementation
is done, feedback from the measurement system will drive reflection. Reflection
informs insights to improve. The measurement system informs all other systems and
decision-making.
If your measurement system is providing good feedback about your performance and
progress, then realised strategy will be far more deliberate and on purpose, rather than
by happenstance. A high performing organisation.

The Eight Steps to a High
Performance Organisation
W W W . M AR K HO CKN E LL . COM 0438 451 405 M AR K@ M AR K HOC KN EL L .C OM Page 4 of 19
Phase one: Engage your people and design your measurement system.
This first phase is about the design of your measurement system and also about the
method you chose to ensure you engage your people and teams. A high performing
organisation has a measurement system that is a useful tool for people to use.
Step One - State Your Purpose
Your purpose for measuring performance has a huge influence on the workplace
culture you create. If your purpose for collecting data and monitoring KPIs is about
compliance, then you cannot expect your people to focus on improving performance.
Likewise, if your purpose for measuring performance is to always achieve the targets
you have set. Then (most likely) you are demonstrating it is okay to manipulate the
measure and or the business system to get the target. The translated purpose for
measurement then becomes, "we measure to get our targets". The unintended
consequences in your workplace culture will be significant.
Ensure your WHY for measuring performance is about 'learning how to improve'.
Organisations that set their purpose for measuring performance as learning, create a
culture that uses measurement to understand: (a) what performance is doing, (b) why it
is doing that, and then (c) people become curious how to improve. Setting your
purpose or why you do performance measurement demonstrates to the people in your
organisation what performance measures or KPIs are all about here. As leaders,
matching your behaviours to your why then inspires people in the organisation to learn
how to improve performance.
PuMP is a team-based approach. All the techniques and tools within this
comprehensive methodology are best used by and with teams. Sure you can use them
yourself, but if you are also wanting to engage other people, and give them the
opportunity to buy-in, then getting the team together and using a process can really
help.
The PuMP Diagnostic has with 26 criteria across five key areas that allows the team to
share their own views on where they feel the business is currently at, in the context of
organisational performance measurement, reporting, clarity of strategy etc.
Once the ratings are in, people discuss their views. We can get the team onto the same
page fairly quickly as well as understanding people's various perspectives.

The Eight Steps to a High
Performance Organisation
W W W . M AR K HO CKN E LL . COM 0438 451 405 M AR K@ M AR K HOC KN EL L .C OM Page 5 of 19
The purpose of Step One is to recognise that we are embarking on a journey of
continuous improvement. We also need to ensure that, as people as possible in our
organisation are on this journey with us. And we will have selected robust methodology
that we will use to design and build our measurement system.
We will start to talk about performance measures in Step Three. But first, we need to
know what it is that we want to measure.
Step Two - Measurable Strategy in Results
This second step is all about figuring out what it is we are trying to achieve, so that we
can measure it. Too much of strategy is written in language that is vague, or uses
weasel words, which makes it impossible to measure.
Similarly, we have a propensity towards action, that often means our strategy is
described in the actions we are going to take, and therefore we tend then to measure
that the action(s) was done, or completed. Rather than understanding the causal
relationship between the action and the impact or result we expected.
The PuMP methodology uses the term, Results to describe what it is we plan to achieve.
The outcome or the impact we want to have is described in our results. When we focus
on results, we can then design measures that will tell us about the impact those actions
are having on our progress towards the result.
There are two techniques within this step of PuMP process. The first is the
Measurability Test. This technique helps us move from actions or vague strategy into
measurable result statements. It is a simple process of asking why we are doing the
action, what is the result we expect..? Likewise with the vague language or weasel
words, what is it we actually mean, what is the impact or outcome we expect.
The second technique is Results Mapping. Taking your Results and mapping the
relationships, into...
...a causal map that allows you to build a framework of results
that will tell the story of your strategy.

The Eight Steps to a High
Performance Organisation
W W W . M AR K HO CKN E LL . COM 0438 451 405 M AR K@ M AR K HOC KN EL L .C OM Page 6 of 19
All results will flow in a cause-and-effect manner towards the centre of the Results Map
where we have articulated our vision, mission or purpose in Results.
As per the example below.
This part of the PuMP method aligns with the evidence-based leadership habit of
Direction2. Leaders set the direction in clear language, understandable to all. And then
allow the people of the organisation to work out how to get there, with the leader
providing the coaching and support.
Armed with a Results Map that provides a framework for what we intend to achieve, we
can now focus on how we design the needed performance measures for the Results.
2 Stacey Barr (2017) Prove it!, John Wiley and Sons, Australia

The Eight Steps to a High
Performance Organisation
W W W . M AR K HO CKN E LL . COM 0438 451 405 M AR K@ M AR K HOC KN EL L .C OM Page 7 of 19
Step Three - Designing Meaningful Performance Measures
The job of a performance measure is to give us feedback on the result we are wanting
to make progress towards. Are our efforts moving us towards our result, or not..? The
signals will be in the measures we select for our Result.
Typically (and I have done this in my pre-PuMP years), we use brainstorming to select
our measures and KPIs. Seems like a great idea to get a bunch of clever people
together, brainstorm what would be good KPIs, collect them on a whiteboard, then
select the best ones. However what we end up with is lists of measures, the things that
are easy to measure, or just the things that we already have data for. Additionally, we
may look to the "industry" for what the best KPIs might be. The problem is that we will
often end up with too many measures and measures don't really tell us if we are
progressing towards our Result.
PuMP provides a five step process to ensure we design and select meaningful measures
for our Result. Starting with the Result we brainstorm (yes, in this step only) what the
result would look like when we achieve it, when it is real. This brainstorm collects all the
sensory descriptors of what our world is like when we achieve the result. Whatever is
observable, is measurable. So let's make it observable first. Then from this sensory list
we can derive ideas for measures. The PuMP Measure Design technique then gets us to
assess each of these potential measures, firstly in terms its strength in providing
feedback for the Result. Then in terms of the feasibility of getting the data to produce
the performance measure.
The purpose of this process is that we do not want lots of measures.
We do not need more KPIs.
What we need is fewer measures/KPIs that are more meaningful.
Measures that specifically provide feedback on the Result we are
trying to achieve.

The Eight Steps to a High
Performance Organisation
W W W . M AR K HO CKN E LL . COM 0438 451 405 M AR K@ M AR K HOC KN EL L .C OM Page 8 of 19
The output from Step Three is that we have a small number (2-4) of measures for each
Result. These measures are given a name (each measure needs to be identified with its
own name), and a description. The description of the measure will read like a formula
for the calculation.
Like this:
Measure name Measure description
Overall Customer
Satisfaction
A quarterly average satisfaction rating provided by active customers
about their overall experience with us
Delivery Cycle
Time
The average time in days from customer order to customer receipt of
goods, calculated monthly for completed deliveries
Student
Participation Rate
The percentage of students who participated in learning activities, by
week
This part of the PuMP method aligns with the leadership habit of Evidence3. Ensuring
we have quantifiable performance measures for each of the Results we want to make
progress towards and/or improvement on.
No targets at this stage, just the measures aligned to the Results.
What we need now, in our design phase is to 'road test' our Results and Measures with
others.
3 Stacey Barr (2017) Prove it!, John Wiley and Sons, Australia

The Eight Steps to a High
Performance Organisation
W W W . M AR K HO CKN E LL . COM 0438 451 405 M AR K@ M AR K HOC KN EL L .C OM Page 9 of 19
Step Four - Fine-tune and Create Buy-in with the Measure Gallery
Step Four then has two purposes. First, (as part of the design phase), we want to reality-
check the results and measures we have developed so far. Second, we want
demonstrate to everyone that our purpose and why for performance measurement in
Step One is real. that is, we are committed to using measurement for learning. We also
would like to give people in our organisation the opportunity to buy-in to what we are
doing with measurement, this time round.
Using the principles of Open
Space Technology Stacey Barr
developed the Measure Gallery.
We display our results and
measures like a gallery. We
invite people to an open gallery
- no appointments, come when
you can.
At the gallery we provide a few minutes to
welcome the visitors and let them know what
we are working on and ask them to provide
feedback on the results and measures we have
developed.

The Eight Steps to a High
Performance Organisation
W W W . M AR K HO CKN E LL . COM 0438 451 405 M AR K@ M AR K HOC KN EL L .C OM Page 10 of 19
There are two outputs from this engagement approach.
1. We have created an environment where people can buy-in to the process, to the
method, and to the Results and Measures. People buy-in when they are consulted
and engaged in the process.
2. We use the feedback to fine-
tune our Results and
Measures before taking them
into the next steps. We want
less KPIs and more measures
that are meaningful.
With people engaged and consulted - we have road tested our Results
and Measures.
Now, with confidence of the validity of our Results and Measures we
can start to bring our measurement system to life.
The Eight Steps to a High
Performance Organisation
W W W . M AR K HO CKN E LL . COM 0438 451 405 M AR K@ M AR K HOC KN EL L .C OM Page 11 of 19
Phase Two: Build and use your measurement system. This second phase is about how we bring our measurement system to life. The tools
we use to ensure the measurement system is not only meaningful for the organisation,
but also useful for the people working within it.
Step Five - Defining Measures
Have you ever been in a management meeting to review performance and on
considering your measures and KPIs you find the conversation turns more to the
measures, rather than performance. You might hear comments like: "how are they
calculating this data..., this is not what I expected this measure to be... where are they
sourcing the data from... what's the time period for these data items..?" You went to the
meeting to discuss performance, but end up talking about the measures.
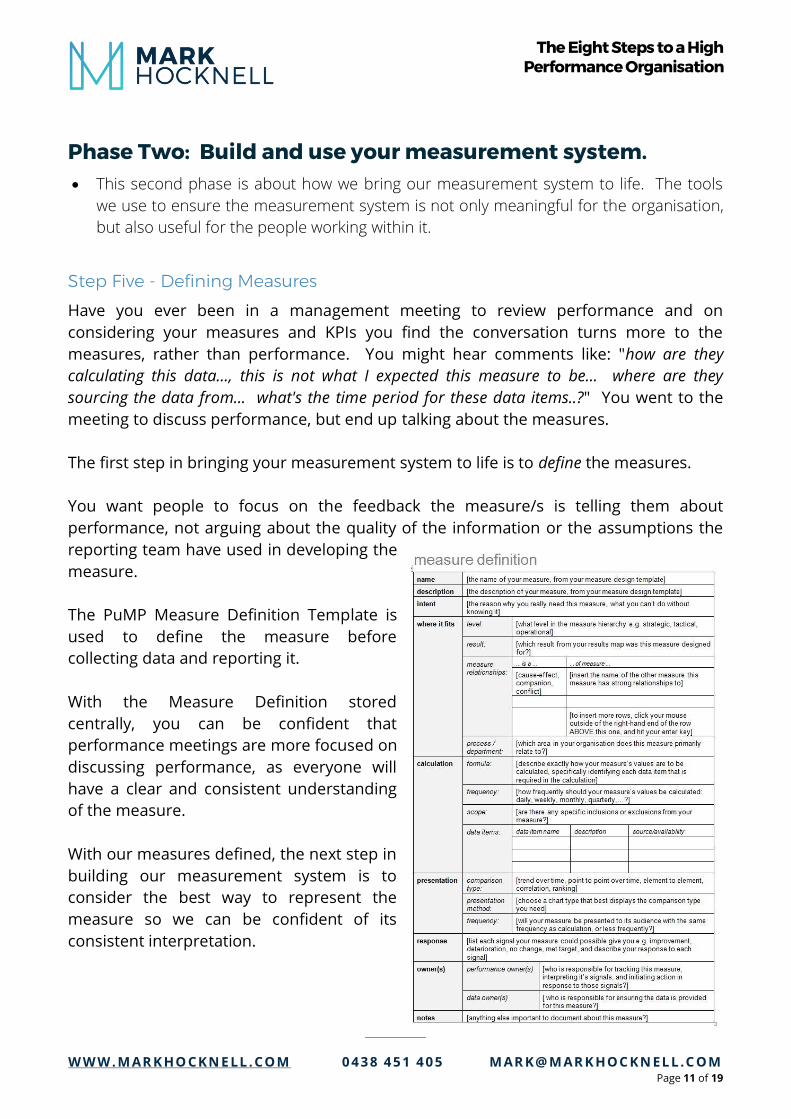
The first step in bringing your measurement system to life is to define the measures.
You want people to focus on the feedback the measure/s is telling them about
performance, not arguing about the quality of the information or the assumptions the
reporting team have used in developing the
measure.
The PuMP Measure Definition Template is
used to define the measure before
collecting data and reporting it.
With the Measure Definition stored
centrally, you can be confident that
performance meetings are more focused on
discussing performance, as everyone will
have a clear and consistent understanding
of the measure.
With our measures defined, the next step in
building our measurement system is to
consider the best way to represent the
measure so we can be confident of its
consistent interpretation.

The Eight Steps to a High
Performance Organisation
W W W . M AR K HO CKN E LL . COM 0438 451 405 M AR K@ M AR K HOC KN EL L .C OM Page 12 of 19
Step Six - Consistent Interpretation and Target Setting
With Step Five we overcame one of the key problems we have with the way we use our
measurement system. By defining the measure we can be confident that everyone
understands the measure, how it is calculated and where the data comes from. The
next set of challenges we need to overcome lie in the interpretation of the way the
measure is displayed.
There is a proliferation of dials and gauges in management
reports. Sure they might look nice and colourful but at best, all a
dial or gauge will tell you is about a particular data item at a
particular point in time. This doesn't help with understanding how
performance is tracking. In fact this approach is prone to having
leaders make point to point comparisons and therefore jumping
to action too soon. As someone said to me recently, "leaders are
great at spotting trends that aren't there..!" Perhaps driven by the
way we present information..?
Now let's travel back to a time when statisticians overcame these challenges with the
application of some simple, but powerful tools. Dr. Walter Shewhart was a twentieth
century statistician, who is generally regarded as father of statistical quality control4. He
developed 'control charts' to determine if business processes were in a state of control
or not. His work and research showed that every process displays variation that is
natural to the process being measured. Leaders and managers need to recognise that
all business processes will have a natural level of variation, our display of measures
needs to show what is natural to the process and what is a change.
Shewhart's work was picked up and used by W. Edwards Deming (known as the father of
quality management) and used extensively in Japan during the economic recovery in the
1950's and 60's, and in subsequent decades made its way back to the USA. This was
known as the Total Quality Management (TQM) movement. From TQM came such
methods/ideas as Six Sigma, LEAN, the Toyota Production System and, the XmR Chart.
The development and usage of the XmR chart for understanding business performance
is simply propounded by Dr. Donald Wheeler in Understanding Variation5, at 150 pages
an essential handbook for all leaders and managers.
4 Wikipedia can provide you with more background if required: Shewhart; Deming; XmR Chart 5 Second Edition, 2000, SPC Press, Tennessee

The Eight Steps to a High
Performance Organisation
W W W . M AR K HO CKN E LL . COM 0438 451 405 M AR K@ M AR K HOC KN EL L .C OM Page 13 of 19
I was first introduced to the XmR chart by Stacey Barr some ten years ago. The impact
was profound. After 15 years in corporate leadership roles I had used all sort of charts
and reporting tools. On completing an MBA (Masters in Business Administration) I
thought I had learned all I needed to about statistics and reporting business
performance. But I was wrong. The XmR chart opened new insights that drive
completely different perspectives on the performance of business processes and
systems.
Let me introduce you to the XmR chart.
Above is the XmR for Average Customer Delivery Time. X is the time series chart of
the measure values. mR is the chart below, measuring the level of variation in the
measure chart by tracking the difference between each subsequent measure
value (difference between Jan 17 measure value and Feb 17 measure value is 10).
The solid line in the mR chart is an average moving range, the mean (average) of the
first five values of moving range.

The Eight Steps to a High
Performance Organisation
W W W . M AR K HO CKN E LL . COM 0438 451 405 M AR K@ M AR K HOC KN EL L .C OM Page 14 of 19
On the measure chart we can see there is a central line, the mean (average) of the
first five values on the time series of measure values. The central line acts as a
reference point for our eyes - we can see performance has been consistent until
Feb 18, where it changed. The blue band on the measure chart is the upper and
lower natural process limits.
Based on the work of our esteemed statisticians, we can be confident knowing
that everything that falls within the natural process limits is normal, no change.
Measure values that are within the upper and lower process limits are natural
to the process, and what we should expect as normal performance. The natural
process limits are calculated from the average moving range, therefore the greater
the moving range values the broader the natural process limits. There are targets
on this measure chart, in fact two targets. Firstly, we want to get the central line
down to 10, by Dec 18. Meaning we want the average Customer Delivery Time to
be 10 days. Secondly, we want to reduce the natural process limits of this
business process to between 5 and 15.
In the measure chart above we can instantly see that:
Performance has been consistent during 2017
We have set a target for Dec 18 that is lower, and less variable than performance
during 2017
A new pattern of performance has formed since Feb 18, for seven months,
We can also see a reduction in natural variation, signalled in the pattern in the X
chart, as well as the pattern in the mR chart.
Do you think we will make the target set for Dec 18..? Most would say "no,
performance has improved but not enough to make the target, without another
change in performance towards target." A consistent interpretation of performance
and a prediction of future expectations.
The XmR Chart is a powerful tool to not only understand how the process is
performing, and see the natural process variation, but also a technique for
setting targets that are far more thoughtful, rather than taking an aspirational
stab in the dark.
We can use the XmR to set targets. Firstly, on the central line - performance has
only truly changed when the mean performance has changed. Secondly, we can
set targets on the upper and lower process limits. In other words, a
reduction in the level of natural process variation is an improvement in
performance worthy of pursuit.
The Eight Steps to a High
Performance Organisation
W W W . M AR K HO CKN E LL . COM 0438 451 405 M AR K@ M AR K HOC KN EL L .C OM Page 15 of 19
When we XmR charts for setting targets and interpreting performance, we have
conversations with leaders that are far more orientated towards understanding
what is happening and (if we have set targets), how are we progressing towards
the targets. No more, "have we hit target, why not..?", or "why is this different to
last month, and this month last year..?"
Use XmR charts for all performance measures and target setting.
Step Seven - Manage Performance
Let's consider how most organisations address the idea of managing
performance. If we look back to the Performance Management Framework
(page 3) we'll see that organisations determine their planned strategy, which is
a description of where they want to be in the future. Then, through some
process or another they develop a plan of action, the change, the projects and
initiatives that will be undertaken by the organisation with the intention of
moving them closer to the planned strategy. Through the process of time,
investment and many decisions, the realised strategy is where they arrive. Without
a good measurement framework/system to inform the journey from planned to
realised strategy (where you end up) is often not much different from where you
started. Yes the projects are implemented, but what impact did they have..?
Operationally we typically see leaders and managers getting together and looking
at all sorts of reports and discuss what's happening. With a poor measurement
system the management team run the organisation on 'gut-feel'. The reports
they are looking at are often financial reports with the links into specific
operational performance tenuous at best. The reports are also often project
reports, 'how is that transformation program tracking against budget and task
completion..?' This is not managing performance. We need to know what
performance is doing and then understand why it is doing that. If we want to
see a change then, we can implement some initiatives and use of
measurement system to monitor the impact the initiative has on our
measures, and therefore the result.
In trying to address these challenges a lot of businesses have turned to
dashboard systems that resemble the cockpit of a jet aircraft. It seems like the
management team feel they need to react to data presented as if they were
travelling at supersonic speed and their lives depended on it.
The Eight Steps to a High
Performance Organisation
W W W . M AR K HO CKN E LL . COM 0438 451 405 M AR K@ M AR K HOC KN EL L .C OM Page 16 of 19
There are two things we must get in place in this step of becoming a high
performance organisation. Firstly we need to ensure that we have regular
scheduled meetings that are for discussing performance. And that is, knowing
what performance is doing and why it is doing that. These meetings are not
hunting exercises to expose who has not met their targets, because our purpose
for measurement is to learn so that we can improve.
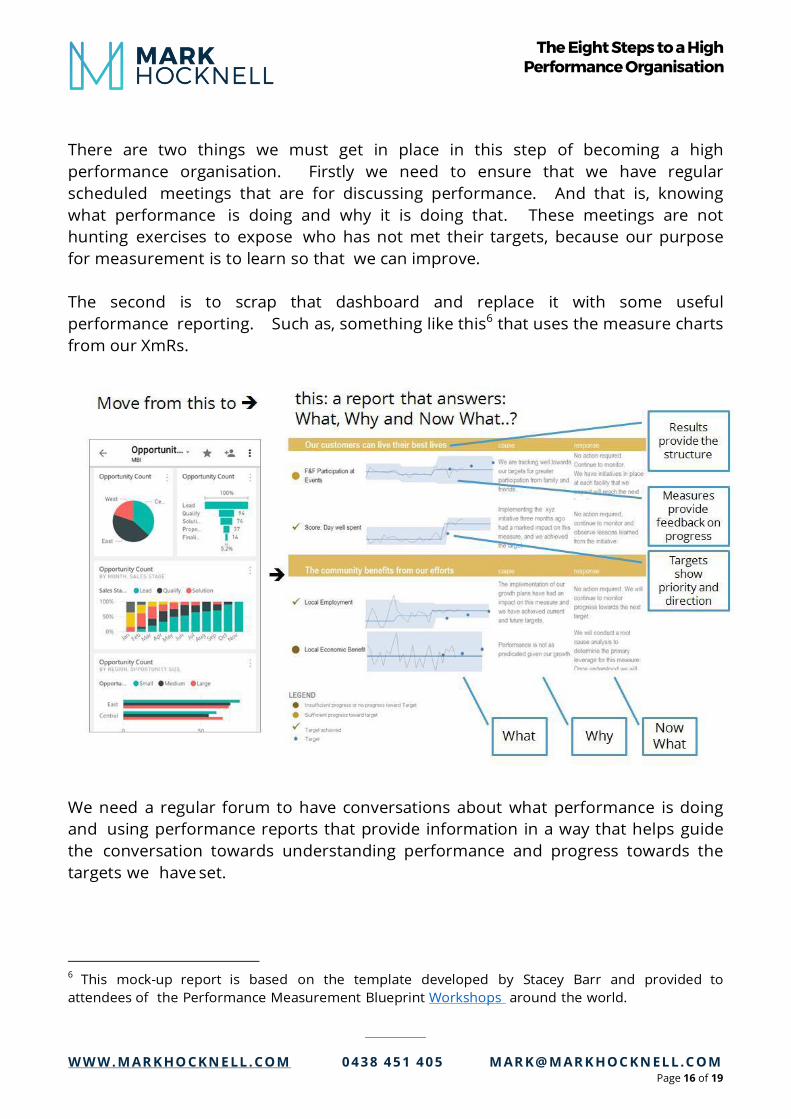
The second is to scrap that dashboard and replace it with some useful
performance reporting. Such as, something like this6 that uses the measure charts
from our XmRs.
We need a regular forum to have conversations about what performance is doing
and using performance reports that provide information in a way that helps guide
the conversation towards understanding performance and progress towards the
targets we have set.
6 This mock-up report is based on the template developed by Stacey Barr and provided to
attendees of the Performance Measurement Blueprint Workshops around the world.
The Eight Steps to a High
Performance Organisation
W W W . M AR K HO CKN E LL . COM 0438 451 405 M AR K@ M AR K HOC KN EL L .C OM Page 17 of 19
Step Eight - Encourage a Learning Culture
We set our purpose (or why) for measuring performance in Step One. It was
about building an organisation full of people who want to learn how to
improve performance. It is one of the key characteristics of a high performing
organisation that teams are engaged and keen to understand what drives
better performance. Everything leaders and managers say and do must continue
to reinforce that purpose.
As Stacey Barr points out in Prove it!, it is the habits of the leaders that establish the
behavioural habits of the organisation.
The more leaders tell people what to do, the less the people take ownership. When
leaders set the direction (through results) it allows people to take some ownership
of how to get there. They will be keen to make decisions and work on the business.
When leaders are looking for evidence of the progress being made towards the
results, then people will focus on the actions that will have the biggest impact.
Seeking to discover root causes rather than treating symptoms.
When leaders use measurement to promote competition and judgement within the
organisation, people will disengage from improving performance and learn how to
give the leaders the numbers they want. When leaders focus on learning, people
will collaborate across functions and as interdependent teams. They will run
experiments to learn and check assumptions more often.
Likewise when leaders use the measurement system to centre their efforts on the
best leverage, and using process thinking to improve business processes - then the
people will also develop the skills and habit of learning about what performance is
doing and why.
Creating a culture within your organisation that learns and flourishes has always
been a key to business success. Management guru, Peter Drucker is often
quoted as saying, "Culture eats strategy for breakfast". In 1982, research from
two McKinsey consultants produced In Search of Excellence7, which demonstrated
the difference between high performing organisations and the rest was culture.
Peter Senge published The Fifth Discipline in 1990 and with it came the principles
of systems thinking and a learning organisation.
Therefore, leaders and managers: stop deploying all those behaviours and habits
that inhibit the culture of your organisation. Empower people with genuine
engagement and learning opportunities, demonstrate progress. And use your
measurement system as a feedback mechanism for insight, learning and growth.
7 Witten by, Thomas J. Peters and Robert H. Waterman

The Eight Steps to a High
Performance Organisation
W W W . M AR K HO CKN E LL . COM 0438 451 405 M AR K@ M AR K HOC KN EL L .C OM Page 18 of 19
Summary - your call to action..!
Start work today on redesigning your measurement system.
Four straightforward steps will get your started on the design. Stop using measurement
only for compliance and assessing people. Make your purpose for measuring to learn
what is causing your current levels of performance and how to improve. Set you
direction in a set of causal results, then design measures for those results. This will
then form the basis of your measurement system, but before you jump into bringing it
to life, seek some feedback from the rest of the organisation. Demonstrate your
purpose for measurement and allow people to buy-in.
In bringing the first version of your measurement system to life ensure you define each
performance measure. Then start collecting the data and presenting the story of this
measure in a XmR chart. If you want to see a change in performance, consider
assigning some targets for focus and priority (not every measure needs a target). Then
establish a setting to discuss the performance of the organisation, focusing on learning
works and doesn't, the patterns of information and the journey towards improvement.
Lastly, consider your behaviours, habits, words and deeds. Are each of these
demonstrating to your team and organisation that you are committed to continuous
improvement, to empowering the team towards learning and experimentation..?
The time to act is now.

The Eight Steps to a High
Performance Organisation
W W W . M AR K HO CKN E LL . COM 0438 451 405 M AR K@ M AR K HOC KN EL L .C OM Page 19 of 19
About the Author Mark Hocknell Mark is a management professional with 25+ years experience
spanning corporate leadership roles, academia and consulting.
More than twelve years of management consulting delivering
more than 200 client engagements and a further 15 years in
senior management, mainly at Suncorp. In addition to this,
Mark has eight years (part-time) experience as a sessional
academic with QUT in the Graduate School of Business. In 2013
Mark was asked to join the Industry Advisory Board (Marketing)
for the Griffith University School of Business and in 2015 he
was appointed as an Adjunct Lecturer.
Mark has a MBA, holds qualifications in change management, and certifications in Net
Promoter Score. Today Mark is a pragmatic consultant, author and speaker who applies
a natural business talent together with a broad set of methodologies and deep
experience to bring about results and demonstrable change within the organisations he
works with.
He is the PuMP® Partner for Australasia.
If you want to learn more about PuMP, Evidence-based Leadership or the Performance
Measure Blueprint Workshops, you can:
Visit this page on his website
Visit Stacey Barr's website for Evidence-based Leadership programs, and the
Performance Measure Blueprint Workshops (public, or in-house)
Copyright
Feel free to print or email this whitepaper to share with anyone you wish. Please do not make
changes whatsoever to the content or layout.
Disclaimer
This whitepaper is provided for educational purposes only and does not constitute specific
advice. Take care and be responsible, seek specialist advice before implementing the ideas in
this whitepaper.