the egyptian journal of hypertension and cardiovascular risk · the egyptian journal of...
TRANSCRIPT

1
Egyptian Hypertension Society
The Egyptian Journal of Hypertension
and Cardiovascular Risk
Editor: Hussein H. Rizk, MD
Prof. of Cardiology - Cairo University
Senior Editorial Consultant: M. Mohsen Ibrahim, MD, FACC
Prof. of Cardiology - Cairo University
Senior Associate Editors: Wafaa El-Aroussy, MD Prof. of Cardiology Cairo University
Zeinab Ashour, MD Prof. of Cardiology Cairo University
Editorial Office:
Ibtihag A. Hamdy, MD Omar S. Awaad, MD Iglal Ghobashy, MD Omar Y. El-Khashaab, MD M. Khairy Abdel Dayem, MD Omneya Nayel, MD M. Mokhtar Gomaa, MD Sherif El-Tobgy, MD Mohamed Hamed, MD Soliman Gharieb, MD
Assistant Editors: Mona Nour, MD
Contact Information: Contact person: Attn. Mrs. Rehab Mohamed. Mobile: 0122761557 Address: 1 El-Diwan Street, Garden City, 11519, Cairo-Egypt Tel.: (202) 794-8877, Fax: (202) 794-8879, e-mail: [email protected] Web site: www.ehs-egypt.net

2
Editorial Board
Abdel Moneim Ibrahim, MD Mahmoud Hassanein, MD Adel A. El-Sayed, MD Mohamed Amin Fikry, MD Adel Abdel Aziz El-Sayed, MD Mohamed Bayoume Sammoor, MD Adel Zaki, MD Mohamed El-Ganzoury, MD Ahmed Abdel Moneim, MD Mohamed Fahmy Abdel Azziz, MD Ahmed Amin Fahmy, MD Mohamed Ghoneim, MD Ahmed El-Hawary, MD Mohamed Hassan, MD Ahmed Rashed, MD Mohamed Helmy Abu Zeid, MD Aly Massoud, MD Mohamed Shataa, MD Aly Ramzy, MD Mohamed Sobhy, MD Amal Ayyoub, MD Mohgah Hammad, MD Dawlat Salem, MD Mohsen Abdel Hamid Gadallah, MD Detlev Ganten, MD Nabil Alluba, MD Essam Soliman Khedr, MD Nadia Selim, MD Ezz El-Din El-Sawy, MD Omar El-Khashaab, MD Fathy Maklady, MD Paul Whelton, MD Fawzia El-Demerdash, MD Qaies Abdel Dayem, MD Fouad El-Nawawi, MD Sabry Gohar, MD Hassan Abdel Rahman, MD Salah Naga, MD Heba Mansour, MD Salwa Roushdi, Md Helmy Abu Zeid, MD Samir Abu Zeid, MD Helmy Siragy, MD Samir Helmy Asaad, MD Ikram Sadek, MD Taghreed Gaefar, MD Khaled Sorour, MD Tarek El-Badawy, MD Lawrence Appel, MD Thomas Pickering, MD Maher Fouad, MD Wafeia Eteiba, MD Mahmoud Allam, MD Wagdy Ayad, MD Mahmoud El-Khayaal, MD Yehya Keshk, MD
3
Table of Contents
1. Editor's page: The Need For Guidelines Suited For The Poor Hussien Hassan Rizk, MD
4
2. Mild Or Moderate Creatine Kinase-Mb Elevation After Coronary Intervention Is Not Associated With Adverse Short Term Clinical Outcome Magdy Abdel Hamid, M.D, Yasser Yazeed M.Sc., Iman Mandour, M.D., Hossam Kandil,M.D, & Sherif El Tobgi, M.D.
5
3. Detection of Tumor Necrosis Factor Alpha as a Prognostic Factor in Congestive Heart Failure Wagdy, A. Galal; Wadeaa, B.; Maryse, S. Ayoub; Gamal. A. and Elhammady, W.
13
4. Relationship of Glycosylated Hemoglobin and Arterial Compliance as a Predictor of Vascular Damage in Normotensive Diabetic Patients Rehame M. Darwish, Zeinab A. Ashour, Hesham Yehia A. Salam, Wael M. S. Naggar
21
5. Evaluation of the Sex Difference in Vascular Reactivity of the Aortic Rings in Rats M. Hani Ayobe; Afaf. A. Mahmoud; Faten, M. A. Diab; Magda. H. M. Youssef and Mona, A. Ahmed.
33
6. Insulin Resistance and Transforming growth factor-beta Gene Expression in Male Albino Rats
Mary A. Youssef *, Abdel-Moneim I. Ahmed*,Sanaa S. Abdel-Shaffy** & Nashwa El-Tablawy* .
44
7. Editorial: HDL-Cholesterol, the risk factor and the future therapeutic target: A statement from the Egyptian Hypertension Society M. Mohsen Ibarhim, MD
55

4
Editor's Page: HOLDING A SNAKE BY THE TAIL: CAN WE AFFORD THE COST OF IGNORANCE?
Hussien Hassan Rizk, MD
With an area of about 1,000,000 Km2, approximately 10% of which is significantly inhabited by a
population of 77,500,000. Egypt is among the most overpopulated countries. The life expectancy at birth has increased to 71 years (2005). The median age of Egyptians is 23.7 years, and the continuously dropping infant mortality rate has reached 32.6 deaths / 1,000 live births. The Gross Domestic Product per Capita (purchasing power parity) is $4,200 (2004) and the literacy rate (defined as inability to read and write by age 15) is 57.7% (male: 68.3% female: 46.9%). Also 16.8% of Egyptians live below poverty line1 . Thus, Egypt has a profile of a receding pandemics region, with increasing life expectancy and low infant mortality, coupled with low income.
Over the last decade of the twentieth century, several survey-type programs in Egypt (either nationally representative or restricted to certain cohorts) revealed a high prevalence of hypertension, diabetes, cigarette smoking, obesity, and dyslipidemia. The recently published INTERHEART study showed the Middle East region to have the lowest median age at first myocardial infarction (MI) and the highest percentage of young (below 40 years) patients at first MI.
The cost of a cardiovascular event; both direct – in hospital and post-hospital services – and indirect – lost income and lost productivity – is very high. The table shows the direct one-year cost of a first MI compared to the annual income of three social classes of Egyptians2:
Category Low Middle High
Care facility National insurance hospital
Semi-private University hospital
Private Hospital
1Y cost of 1st. MI LE. 24,624 LE. 42,358 LE 72,450 Annual income < LE 10,000 10,000 – 100,000 > 100,000
The cost of modern health care is simply unaffordable to many Egyptians, and the state
sponsored insurance system is overwhelmed by increasing premature cardiovascular disease. With budget constraints, prevention of cardiovascular disease is pushed out of focus.
The medical education system in Egypt is archaic and poorly prepared. Institutions are obliged to yield to social and political pressures by accepting huge number of students beyond their capability of training. They subsequently have to set low passing standards for examinations, as an excess of failing students can neither be expelled nor accommodated in addition to the new comers. Additionally, the vast majority of staff actually offer a very limited number of working hours, virtual part-timers.
There are frequent signals in the media that the community is quite unsatisfied with the functioning of the medical profession. The erosion of trust in doctors is an everyday reality. But doctors' actual or perceived errors are more a system failure than an individual failure. Can we afford to continue like this? An angry community and a crippled profession is a dangerous cocktail, the serious consequences of which include withdrawal of good doctors from high risk specialties, decay of medical care of poor patients, and opening the field for global competition.
If a health care crisis in the near future is to be avoided, we need a firm belief that all palliative quick fixes turned to be complete failures, and that we entered into an insoluble conundrum of politics-incompetence-denial-scapegoat logic that will take us straight to disaster. The whole medical education system will have to be radically restructured, and prevention of chronic disease has to be at the focus of attention.
Holding a snake by the tail is unwise, unsafe, and unstable. • I am grateful to Dr. Hussien Heshmat for assistance in data collection.
1 http://education.yahoo.com/reference/factbook/eg/econom.html;_ylt=AvDQxtTimqQ_dZnt6021UTu4ecYF accessed on 9/1/06 2 Adapted from price lists of New Kasr El Eini Teaching Hospital, National Insurance Hospital and a major private hospital. Unpublished data.

MILD OR MODERATE CREATINE KINASE-MB ELEVATION AFTER CORONARY INTERVENTION IS NOT ASSOCIATED WITH ADVERSE SHORT
TERM CLINICAL OUTCOME Magdy Abdel Hamid, M.D, Yasser Yazeed M.Sc., Iman Mandour, M.D*., Hossam Kandil, M.D, &
Sherif El Tobgi, M.D.
The Department of Cardiology, Cairo University * Clinical Pathology Department, Cairo University Background: Elevation of CK-MB is not uncommon after percutaneous coronary interventions (PCI). Whether this elevation is associated with adverse outcome is still unsettled. We tried to study predictors of CK-MB elevation after PCI and whether this elevation has an adverse effect on follow- up or not. Methods: We studied 220 consecutive patients who underwent PCI with or without stenting for 314 lesions to determine predictors of CK-MB elevation after PCI and to assess the relation between CK-MB after PCI and adverse events at follow- up . Patients were divided into 3 groups according to CK-MB elevation. Group I: had no CK-MB elevation (127 patients: 178 lesions), Group II: CK-MB elevation < 3 times upper laboratory normal (82 patients: 117 lesions), Group III: CK-MB elevation 3-5 times normal (11 patients: 18 lesions). Patients were followed-up by telephone for adverse clinical events for a mean period of 6.1± 3.3 months Results: CK-MB elevation post coronary interventions was not associated with adverse events at follow-up. By multivariate stepwise regression, the occurrence of chest pain post cath (p=0.001) and slow flow at the end of the procedure (p=0.0026) were independent predictors for CK-MB elevation. Conclusion: Mild to moderate CK-MB elevation (<3 times) after PCI is not associated with short-term adverse outcome. Key words: Creatine kinase MB, percutaneous coronary interventions Introduction One of the most controversial issues in interventional cardiology is whether small myocardial infarction, diagnosed by enzymatic abnormalities during percutaneous coronary interventions, are clinically relevant or not (1,2).Whereas the prognostic importance of relatively small increases in CK above the normal levels in unstable angina is well recognized (3), the importance of increases in cardiac enzymes after PCI is both under studied and under appreciated. Another related controversial issue is the threshold at which post procedure cardiac-enzyme elevations should be considered abnormal . Elevated serum CK-MB fraction occurs in 5-30% of patients undergoing coronary interventions (4). Several studies have been
conducted over the past 10 years to assess the incidence and predictors of serum cardiac enzymes elevation post PCI, however many of of these studies have been conducted prior to the wide spread of new platelet inhibitors as GP IIb/IIIa inhibitors, ticlopidine and clopidogrel. Whether or not this enzyme elevation represent merely laboratory error, enzyme release due to repetitive or prolonged vessel occlusion, or both, without necrosis (5), or increased enzyme washout or early detection of a minor degree of myocardial necrosis, is ultimately unanswered. The aim of this study was to identify predictors of CK-MB elevation after coronary interventions, assess the relation between CK-MB elevation and adverse clinical events at follow up, and to identify predictors of adverse clinical events at follow- up after coronary interventions.
5

METHODS
Patient Population: Our study included 517 patients
who underwent PCI at Cardiology department, Cairo University hospitals during the period from October 2001 till October 2002 .237 patients were excluded due to elevated CK-MB level precath (>24 U/L), 60 patients were excluded due to failure to obtain serial CK-MB measurements or refusal of the patients to participate in the study .220 consecutive patients were identified with normal CK-MB level precath who underwent single or multi-vessel PTCA with or without stenting, whether native or graft vessels for 314 lesions who constituted the study group. PCI Procedure: Heparin was administrated intravenously 100 units/kg or 70 units/kg if GP IIb/IIIa receptor inhibitor agents were used. Maintenance of an activated clotting time (ACT) of greater than 300 sec was recommended unless GP IIb/IIIa receptor inhibitors were used, then 200-250 sec was satisfactory. The choices of device, technique and adjunctive pharmacologic management were at the discretion of the operator. Patients were monitored for chest pain and arrhythmias and other complications post cath. Electrocardiograms were obtained before & immediately after the procedure. Patients with stents were maintained on clopidogrel for 4 weeks after PCI and aspirin indefinitely. CK-MB Determination:
For all patients 3 sets of cardiac enzyme (CK-MB) were obtained: Preprocedure, 6 hours, and 24 hours after the procedure. CK-MB isoenzyme in serum was determined by immunoinhibition technique. Patients were divided into 3 groups according to CK-MB elevation: Group I: had no CK-MB elevation (≤24 U/L), Group II: CK-MB elevation < 3 times upper laboratory limit of normal (25-72 U/L), Group III: CK-MB elevation > 3 times normal (> 72 U/L).
Data collection: Clinical and procedural data were obtained for each patient. Angiographic analysis:
QCA was carried out on-line using a computer assisted automated edge detection algorithm (Philips Integris ‘H 30000 system). Standard qualitative and quantitative definitions and measurements were used (6).Angiographic success was defined as a residual stenosis < 30% by QCA and TIMI flow grade III (7)
Clinical Follow-up and End Points: Patients were contacted by telephone calls at the end of the study. Follow-up was possible in 97.3% of patients at a mean of 6.1± 3.3 months. The end points of the follow-up were :death due to a cardiac cause, recent ischemia defined as one or more of the following end points (rest angina, MI, hospitalization for acute coronary events), revascularization procedure whether PCI or CABG. Patients with any of the end points were interviewed and their medical reports were reviewed. Statistical analysis: All statistical analyses were performed using Statistical Package for Social Sciences (SPSS, version 11.0). Continuous variables are presented as mean ± SD and categorical variables are presented as percentages. Comparison of categorical variables across subgroups was tested using Chi square test, while continuous variables were tested using student t test. A two sided p value < 0.05 is considered to indicate statistical significance. Clinical predictors of CK-MB elevation post cath were determined using a patient-based analysis while lesional and procedural predictors were determined using lesion-based analysis. Significant predictors of CK-MB elevation post cath (with a p value <0.05) were entered into the multivariate model. Analysis of covariance (ANCOVA) was used to adjust for continuous variables. Multivariate stepwise regression analysis was performed to identify the most independent predictors of CK-MB elevation post cath.
6

RESULTS Baseline characteristics: Of the 220 patients studied, 93(42.3%) had post procedural CK-MB elevation. According to peak level of CK-MB post cath, patients were divided among 3 groups: Group I: patients with no elevation of CK-MB post procedure (≤ 24 IU/L) and included 127 (57.7%), Group II: elevation 1-
3 times upper limit of normal (> 25-72 IU/L) and included 82(37.3%), Group III: elevation > 3 times (> 72 IU/L) and included 11 (5%). All patients in this group had Peak CK-MB level between 3-5 times (72-120 IU/L), except for 1 patient who had CK-MB elevation >5 folds.
Baseline clinical characteristics: are displayed in table (1). Table (1) Baseline patient characteristics
Characteristics Group I
n=127(100%)
Group II
n=82(100%)
Group III
n=11(100%)
P value
Age (Y) 53.1 ± 8.4 51.3± 10.4 56.4± 10.9 0.17 Male 107(84.3) 74(90.2) 11(100) 0.192 Diabetes 58(45.7) 33(40.7) 3(27.3) 0.439 Hypertension 59(46.5) 43(52.4) 6(54.5) 0.653 Hypercholestrolemia 49(69) 37(68.5) 5(71.4) 0.988 Family history 33(26) 20(24.4) 3(27.3) 0.957 Current Smoking 73(57.5) 45(54.9) 5(45.5) 0.703 History of stroke 4(3.1) 3(3.7) 0(0) 0.810 Peripheral vascular disease 8(6.3) 1(1.2) 2(18.2) 0.031* Congestive heart failure 6(4.7) 1(1.2) 1(9.1) 0.255 Creatinine (mg/dl) 1.0 ± 0.4 1.1 ± 0.6 1.2 ± 0.3 0.31 Previous revascularization Percutaneous interventions 13(10.2) 14(17.1) 3(27.3) 0.149 CABG 8(6.3) 4(4.9) 2(18.2) 0.237
Data presented as n (%) or mean ± SD
Among clinical baseline parameters, group 3 patients were more likely to have peripheral vascular disease. There was no difference between the 3 groups as regard age, gender, diabetes,
hypertension, hypercholesterolemia, positive family history, current smoking, history of stroke or congestive heart failure, or prior revascularization procedure.
Diagnostic work-up at presentation: is summarized in table (2).
Table (2) Diagnostic work-up at presentation
Variables Group I n=127
Group II n=82
Group III n=11 P value
Stable angina 8(6.3) 2(2.4) 0(0.0) 0.323 Unstable angina 75(59.5) 43(52.4) 9(81.8) 0.155 Post MI angina 18(14.2) 9(11.0) 0(0.0) 0.351 STEMI 38(30.2) 31(37.8) 0(0.0) 0.036* NSTEMI 3(2.4) 4(4.9) 1(9.1) 0.390 Precath ECG Q waves 55(45.1) 42(52.5) 3(30.0) 0.315 ST and/or Tw changes 79(64.8) 53(66.3) 5(50.0) 0.598 +VE Stress ECG 16(12.6) 6(7.3) 1(9.1) 0.471 +VE Stress imaging 16(12.6) 9(11.0) 2(18.2) 0.780
STEMI: ST elevation myocardial infarction, LVEDD: left ventricular end diastolic dimension, LVESD: LV end systolic dimension, FS: fractional shortening, EF: ejection fraction, RWMA: regional wall motion abnormalities.
7

Lesional and Procedural variables: are summarized in table (3). Table (3) Lesional and Procedural variables
Variables Group I n=178
Group II n=117
Group III n=18 p value
Vessel
LAD 84(47.2) 59(50.0) 5(27.8) 0.213
LCX 22(12.4) 13(11.0) 5(27.8) 0.135
RCA 40(22.5) 25(21.2) 7(38.9) 0.244
Diagonal 7(3.9) 1(0.9) 1(5.6) 0.232
Obtuse marginal 19(10.7) 16(13.6) 0(0.0) 0.224
ACC/AHA type
A 24(70.6) 9(26.5) 1(2.9) 0.223
B1 44(55) 30(37.5) 6(7.5) 0.727
B2 93(54.71) 68(40) 9(5.3) 0.570
C 17(58.6) 10(34.5) 2(6.9) 0.922
Lesion length (mm) 10.8 ± 5.5 11.4 ± 5.9 10.3 ± 5.3 0.447
Thrombus 9(50) 7(38.9) 2(11.1) 0.570
Calcification 4(40) 6(60) 0(0) 0.283
Total occlusion 20(55.6) 15(41.7) 1(2.8) 0.655
Ostial 6(66.7) 3(33.3) 0(0) 0.697
Restenotic 6(60) 4(40) 0(0) 0.728
Premedication with clopidogrel 97(76.4) 67(81.7) 8(72.7) 0.597
In-lab GP IIb/IIIa inhibitor 40(31.5) 19(23.2) 7(63.6) 0.019*
Data presented as n (%) or mean ± SD Interventional data: are summarized in table (4).
Table (4) Interventional data
Variables Group I n=178
Group II n=117
Group III n=18 P value
PTCA only 33(18.5) 28(23.7) 1(5.6) 0.162 Direct stenting only 51(28.7) 39(33.1) 7(38.9) 0.545 PTCA and stenting 94(52.81) 51(43.22) 9(50.0) 0.270 Single vessel intervention 102(79.7) 59(68.6) 4(36.6) Multivessel intervention 26(20.3) 27(31.4) 7(63.6)
0.0035*
-Balloon diameter (mm) 2.6 ± 0.5 2.5 ± 0.5 2.5 ± 0.6 0.314 -Balloon Inflation pressure (atm) 7.1 ± 2.8 6.7 ± 2.0 3.3 ± 1.2 0.212
-Inflation time (min) 0.9 ± 0.5 1.0 ± 0.6 1.2 ± 0.6 0.223 -Stent diameter (mm) 3.3 ± 0.4 3.2 ± 0.3 3.1 ± 0.3 0.467 -Stent length (mm) 15.6 ± 5.1 16.2 ± 5.9 18.4 ± 4.2 0.124 -Deployment pressure (atm.) 14.1 ± 3.1 14.2 ± 4.1 15.3 ± 2.1 0.382 Pre-MLD (mm) 1.0 ± 0.6 0.9 ± 0.5 1.1 ± 0.7 0.365 Pre-RD (mm) 2.9 ± 0.7 2.9 ± 0.6 3.1 ± 0.9 0.434 Pre-DS % 63.8 ± 18.9 67.1 ± 18.5 67 ± 18.1 0.300 Post-MLD (mm) 2.4 ± 0.6 2.3 ± 0.8 2.4 ± 0.7 0.181 Post-DS % 18.0 ± 12.0 20.9 ± 17.0 17.7± 16.8 0.208 Procedure duration (h) 1.9 ± 0.4 1.5 ± 0.9 2.1 ± 0.7 0.810
Data presented as n(%) or mean ± SD, MLD: minimal lumen diameter, DS: diameter stenosis, atm: atmospheres
8
Patients in group 3 were more likely to have multivessel intervention. No difference between the 3 groups as regard type of intervention, balloon and stent diameters or inflation
pressures, stent length, pre and post procedure minimal lumen diameter, diameter stenosis(%), reference diameter, or procedure duration .
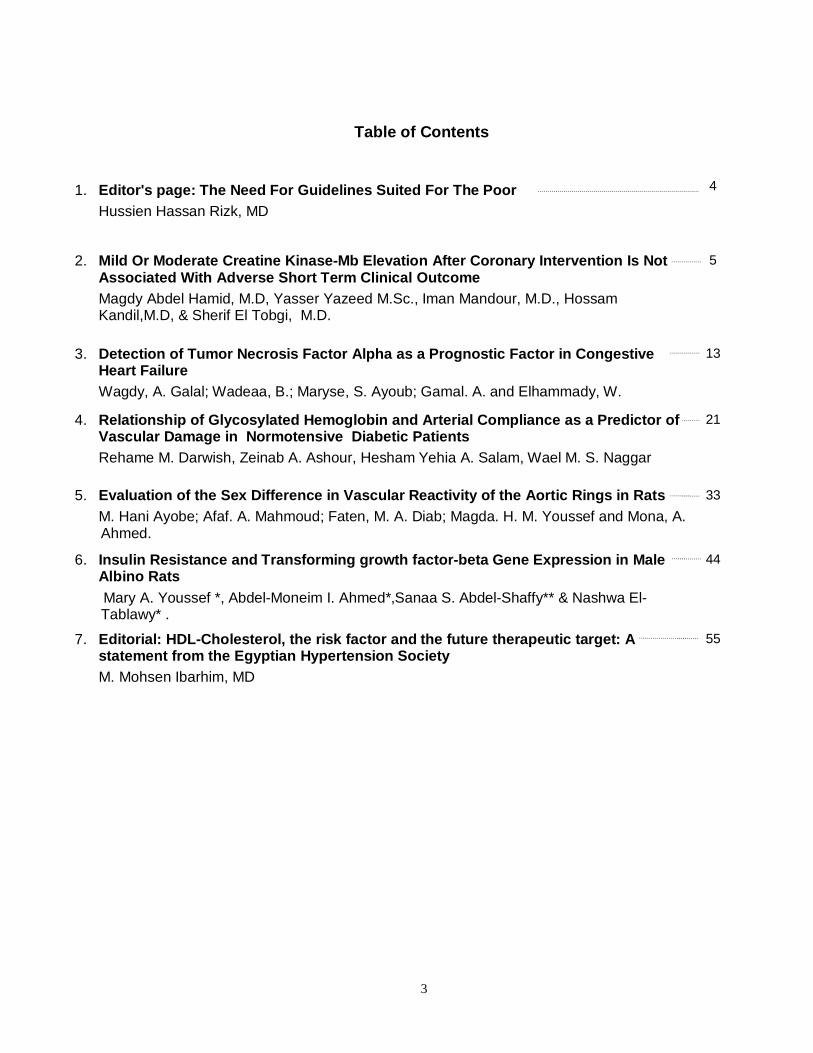
Procedural outcome: is summarized in table (5).
Table (5) Procedural outcome
Variables Group I n=178
Group II n=117
Group III n=18 P value
Angiographic success 158(89.3) 93(78.8) 14(77.8) 0.036*
Dissection 4(2.3) 6(5.1) 2(12.5) 0.086*
Slow flow 2(1.1) 7(5.9) 4(22.2) 0.00005**
Side-branch occlusion 7(4.0) 6(5.1) 4(22.2) 0.005*
Spasm 2(1.1) 3(2.5) 0(0.0) 0.546
Abrupt closure 0(0.0) 2(1.7) 1(5.6) 0.040*
Perforation 2(1.1) 3(2.5) 0(0.0) 0.546
TIMI 0 0(0) 1(0.9) 0(0)
TIMI I 0(0) 0(0) 1(6.25)
TIMI II 3(1.8) 8(7.1) 4(25)
TIMI III 166(98.2) 105(92.2) 11(68.8)
<0.00001**
Data presented as n (%) *statistically significant**highly significant Patients in group 3 were more likely to have coronary dissection, slow flow, side branch occlusion, and abrupt closure, while patients in group 1 were more likely to have angiographic
success and TIMI flow grade III at the end of the procedure. There was no difference between the 3 groups as regard the occurrence of coronary spasm or perforation.
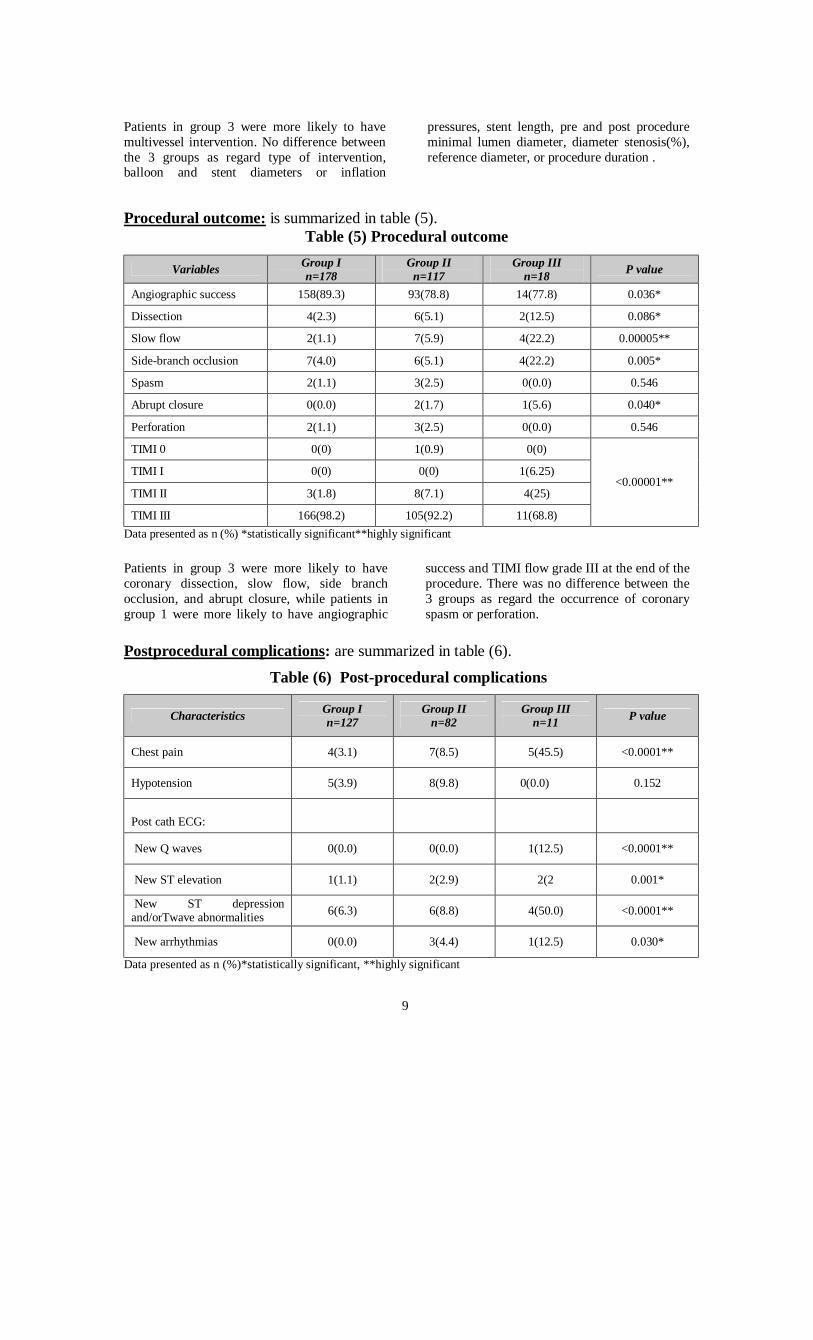
Postprocedural complications: are summarized in table (6).
Table (6) Post-procedural complications
Characteristics Group I n=127
Group II n=82
Group III n=11 P value
Chest pain 4(3.1) 7(8.5) 5(45.5) <0.0001**
Hypotension 5(3.9) 8(9.8) 0(0.0) 0.152
Post cath ECG:
New Q waves 0(0.0) 0(0.0) 1(12.5) <0.0001**
New ST elevation 1(1.1) 2(2.9) 2(2 0.001*
New ST depression and/orTwave abnormalities 6(6.3) 6(8.8) 4(50.0) <0.0001**
New arrhythmias 0(0.0) 3(4.4) 1(12.5) 0.030*
Data presented as n (%)*statistically significant, **highly significant
9

Patients in group 3 were more likely to have chest pain post intervention, new post procedure
ischemic electrocardigraphic abnormalities..
By multivariate stepwise regression table (7).
Table (7) Multivariate predictors of CK-MB elevation
Multivariate analysis Variables Coeff
Beta St. Err of
Coeff R- square
change F value p value
1-Chest pain Post cath 0.166 0.061 0.034 10.951 0.001
2-Slow flow 0.158 0.056 0.028 9.252 0.0026
only the occurrence of chest pain post cath (p=0.001) and slow flow at the end of the procedure were independent
predictors for CK-MB elevation. Low baseline ejection fraction trended to be a predictor.
Discussion : Elevation of CK- MB after PCI has attracted the attention of many researches in the past few years, particularly when several studies (8-14) have addressed that CK- MB elevation after PCI was associated with adverse-clinical outcome. Also being not uncommon & occurs in 10 – 30 % after visually successful coronary intervene-tions (15). In our experience with 220 consecutive patients, CK-MB was elevated in 42.3 % of cases post intervention, a figure probably higher than other studies, but a comparable degree of CK-MB elevation was observed by Brener et al (16), when CK- MB was elevated in 38 % of patients post cath. Moreover, most studies evaluated CK-MB elevation after successful coronary interventions, but in our study we included both successful and unsuccessful interventions. Predictors of postprocedural CK-MB elevation: the occurrence of in-lab complications (side branch occlusion, coronary dissection, slow flow, abrupt vessel closure). These observations are consistent with the hypothesis that enzyme elevation may be associated with sustained decrease in perfusion to small myocardial territories (17). Also the occurrence of chest pain or ischemic electrocardiographic changes post cath
which may reflect myocardial injury. Multivessel intervention was also associated with postprocedure CK-MB elevation. A similar finding has been reported by Gaul et al (18), who found that cardiac enzyme elevation after PTCA was significantly higher after multivessel compared with single vessel procedures which may be due to higher incidence of side branch occlusion, coronary dissection, and distal embolization during dilating multiple lesions than dilating single lesion. Low baseline ejection fraction was also associated with enzyme release post intervention. Saucedo et al (14), found that low left ventricular ejection fraction was more common in patients with CK- MB elevation > 5 times post coronary interventions (p=0.02). In this study peripheral vascular disease was also associated with postprocedure CK-MB elevation, This was supported by kini et al (19) who found that systemic atherosclerosis correlated independently with CK – MB release post cath & this may suggest that CK- MB elevation post cath may be a marker for diffuse atherosclerosis. The use of Glycoprotein IIb/IIIa inhibitors during interventions were predictors of CK-MB elevation >3 times post intervention. An explanation is that Glycoprotein receptor blockers were used in our study in high
10

risk procedures in which more complications were expected to occur. Prognostic significance of postprocedural CK-MB elevation: In the current study we observed that there was no significant correlation between mild to moderate elevation of CK-MB post coronary interventions (< 5 folds) & the occurrence of adverse clinical events at a mean follow-up duration of 6.1±3.3 months. This observation is consistent with many studies which also found that mild to moderate with CK-MB elevation (<5 times) post cath was not associated with adverse clinical events at follow-up. Kugelmass et al (17), evaluated 565 patients treated with directional atherectomy and stenting and found that elevation of CK-MB < 5 times of normal occurred in 11.5% of patients and was not associated with adverse outcome in 2-year follow-up period. Saucedo et al (14), reported on 900 consecutive patients who underwent successful native vessel stenting. The risk of late death for patients with post stent peak CK-MB less than 5 times was not increased . Limitations of the study:. Only 2 sets of CK-MB were routinely measured post procedure and it is possible that peak CK-MB has occurred after 24 hours or patients with normal CK-MB after 24 hours may have elevated levels later. Troponin a more sensitive marker for myocardial necrosis was not measured in the present study . Another important limitation of the present study is the short duration of follow up (6.1 ± 3.3 months) and its possible that more adverse clinical events may occur after a longer follow-up period particularly when we find that most studies that were able to demonstrate correlation between CK-MB elevation and mortality had longer follow-up periods. Another limitation in this study is that we were not able to assess the relation between higher levels of CK-MB (>5times) post intervention and adverse clinical events at follow-up because our study population did not
experience high levels of CK-MB post intervention (> 5 times) except for 1 patient. Conclusion: Mild to moderate CK-MB elevation after coronary interventions is not associated with adverse clinical outcome at follow-up. Whether high levels of CK-MB after coronary interventions is associated with adverse clinical outcome or not, still needs to be assessed by large-scale studies. Multiple predictors have been identified which heighten the risk for CK-MB elevation after coronary interventions. References 1)- Ravkilde J, Nissen H, Mickey H, et al. Cardiac troponin T and CK-MB mass release after visually successful PTCA in stable angina pectoris. Am Heart J 1994; 127:13-20 2)- Pauletto P, Piccolo D, Scannapieco G, et al. Changes in myoglobin CK and CK MB after PTCA for stable angina Pectoris. Am J cardiol 1987; 59 999-1000 3)- Hamm CW, Ravkilde J, Gerhard Tw, et al. The prognostic value of serum troponin T in unstable angina. N Eng J med. 1992; 327:146-150. 4)- Roxana M, George D, Gary SM, Alexandra J. Lansky ML. Atherosclerotic plaque burden and CK-MB enzyme elevation after coronary interventions. Circulation. 2000;101: 604-610. 5)- Jaffe AS, Serota H et al. Diagnostic changes in plasma creatine kinase isoforms early after the onset of acute myocardial infarction. Circulation 1986:74:105-9. 6)- Popma JJ, Bashore TM. Qualitative and quantitative angiography. In Topol EJ. Textbook of interventional cardiology.Philadelphia: W.B. Saunders Company, 1994:1060 7)- Antoniucci D, Santoro GM, Valenti R, et al. A clinical trial comparing primary stenting of the infarct-related artery with optimal primary angioplasty for AMI. Results from FRESCO trial. J Am Coll Cardiol 1998;31:1234-39
11

8)- Abdelmeguid AE, Ellis SG, Sapp SK, et al. Defining the appropriate threshold of creatine kinase elevation after percutaneous coronary interventions. Am Heart J 1996; 131:1697-105. 9)- Tauke JT, Kong TQ, Meyers SN, et al. Prognostic value of creatine kinase elevation following elective coronary interventions. J Am coll cardiol.1995:special issue:269 A. Abstract. 10)- Redwood SR, POMPA JJ, Kent KM, et al: Minor CK-MB elevations are associated with increased late mortality following ablative new device angioplasty in native coronary arteries. Circulation1995;92(supplI):I-544.Abstract. 11)- Tardiff BE, Granger CB, Woodlief L, et al. Prognostic significance of postintervention isoenzyme elevations. Circulation 1995; 92 (suppl I):I-544. Abstract. 12)- Kong TQ, Meyers SN, parker MA, et al: Predictors and late sequences of distal embolization in patients with creatine kinase elevation following elective PTCA J Am coll cordiol 1996; 27 suppl A: 360 A 13)- Simoons ML, Van der Brand M, Lincoff M, et al. Minimal myocardial damage during coronary intervention is associated with impaired outcome.
Eur Heart J 1999; 20:1112-1119 14)- Saucedo JF, Mehran R, Dangas G, et al. Long term clinical events following CK-MB elevation after successful coronary stenting. J Am coll cardiol 2000;35:1134-41 15)- Kelly D, Aorora D, Prognostic significance of myocardial enzyme releases after coronary intervention. Cathet cardiovasc interventions 1999; 46:292 16)-Brener SJ, Lytle BW, Topol EJ, et al. Association between CK-MB elevation after percutaneous or surgical revascularization and 3 year mortality. J Am Coll Cardioll 2002;40:1961-1967 17)- Leon M, Baim D, Pompa J, et al: A clinical trial comparing three antithrombotic- drug regimens after coronary-artery stenting. N Engl J Med 1998; 339:1665-1671 18)- Gaul G, Hollman J, Simpfendorfer C. Acute occlusion in multiple lesion coronary angioplasty: frequency and management. J Am coll Cardiol 1982; 3:283-88 19) -Kini A, Marmur JD, Kini S, et al. Creatine Kinase – MB elevation after coronary interventions correlates with diffuse atheroscleroris, and low to medium level of elevation has a benign clinical course. J Am coll cardiol 1999; 34:663-71.
12

8
Detection of Tumor Necrosis Factor Alpha as a Prognostic Factor in Congestive Heart Failure
By Wagdy, A. Galal; Wadeaa, B.; Maryse*, S. Ayoub; Gamal. A. and Elhammady, W.
Department of Cardiology, and *Internal medicine Faculty of Medicine, Ain Shams University.
Abstract: Background: Recently cytokines, especially TNF α raised the attention as a prognostic marker well correlating with morbidity and mortality of congestive heart failure. Objective: To study the correlation between heart failure severity represented by clinical evaluation and NYHA stratification with TNF α level. Methods: The study enrolled 90 subjects divided into three groups as 30 control subjects, 30 patients with heart failure not receiving treatment and 30 patients with heart failure receiving standard treatment. All subjects undergone clinical examination, patients were assessed by MLWHF questionnaire, exercise capacity by six minute walk distance and full echocardiographic assassment. TNF α assay was done for all subjects using ELISA technique. Results: TNF α was higher in patients with heart failure than control subjects. TNF α correlated significantly with NYHA class, MLWHF score, exercise capacity assessed by six minute walk distance (p<0.05).Resting heart rate and serum sodium level which represent neurohormonal activation correlated with TNF α level.TNF α did not correlate with ECHO parameters except fractional shortening. α-blockers were the only modality of treatment which affected TNF α level with a border line significance (p=0.049). Conclusion: serum level of TNF α is a simple, rapid measure for heart failure prognosis which can influence the modality of treatment. Introduction: The prevalence and incidence of congestive heart failure are increasing, despite the introduction of various therapeutic modalities. Many prognostic parameters such as NYHA functional class, left ventricular ejection fraction and peak oxygen uptake, influence the modality of treatment.( Kell;et al 2002 ) During the last decade cytokines have gained increasing attention in cardiovascular disease. There are countless reports in which elevated proinflammatory cytokines and / or their receptors have been observed in patients with heart failure such as tumor necrosis factor alpha ( TNFα ) interleukin 1,6,10,12 and soluble form of leucocytes surface marker CD 14,along with TNF α receptors (Deswel et al.,2001)This led to elucidating the importance of biomarkers of
heart failure ( Jortani et al.,2004 ). TNF alpha was originally described as a factor responsible for lipopolysacchride (LPS) induced hemorrhagic necrosis of tumors in animals. (Carswell et al., 1975) It is secreted mainly from activated mononuclear phagocytes, other sources are, lymphocytes, endothelial cells, keratinocytes and myocardial cells (Krakauer et al., 1999) The major function of TNF α is being a cornerstone regulator of inflammatory host responses to infections, toxins, and neoplasia. It also plays a role in autoimmunity, and apoptosis. TNFα plays a significant role in cardiovascular system, the cytokine has a negative inotropic effect on the myocardium possibly by inhibiting nitric oxide (Anderson et al.,2004) TNF α exerts a proapoptotic action on myocardium, perpetuating the loss
13

8
of myocardial cells ,(Panas et al.,1998). It also has a role in enhancing atherosclerosis including restenosis and increases peripheral vasomotor tone. These observations have prompted the idea that overproduction of TNF may contribute to disease progression in heart failure by virtue of the direct toxic effect that this molecule exerts upon the heart and blood vessels. This led to the emerging "cytokine hypothesis" for heart failure.(Jortani etal.,2004)
The aim of this study is to elaborate the correlation between TNF α and the severity of heart failure, and the different modalities of treatment Subjects and methods:
90 subjects were enrolled in this study, selected from Ain Shams university hospital cardiology and internal medicine inpatient wards and outpatient clinics. The subjects were grouped as follows: Group I : 30 healthy age and sex matched control subjects Group II: 30 patients with congestive heart failure due to ischemic or dilated cardiomyopathy not receiving treatment Group III: 30 patients with congestive heart failure due to ischemic or dilated cardiomyopathy receiving standard treatment. Inclusion criteria of patients include: Age from 18-75 years Clinical manifestations of congestive heart failure Echocardiography revealing ejection fraction < 40% measured by M-mode and 2D methods Exclusion criteria of patients include: Heart failure due to valvular or congenital heart disease Isolated diastolic heart failure Known or suspected collagen or autoimmune diseases Renal impairment (creatinine>2mg/dl), malignancy, chronic inflammatory conditions Cardiogenic shock All subjects were assessed by full history taking and physical examination, with special consideration to measurements of resting
heart rate and blood pressure recording according to JNC VII guidelines. Record of medications used by the patients was taken.. Patients were classified according to NYHA functional class: Class I no limitations of physical activity Class II ordinary physical activity causes symptoms Class III symptoms occur with less than ordinary activity Class IV symptoms present at rest All patients underwent the following :- 1.Minnesota live with heart failure questionnaire: It is a comprehensive evaluation of patients with congestive heart failure to assess quality of life by scoring system. It is a self assessment of the patients perception of the effects of heart failure on their lives. This is a 21 item questionnaire that covers physical, socioeconomic, and psychogenic impairments that patients often relate to their heart failure. A score based on how each person ranks each item on a common scale is used to quantitate the extent of impairment. ( Deswal et al,.2001). 2.Six minute walk distance: In which patients walked as far as they tolerated across a straight horizontal level track in 6 minutes. The walk test provides an objective measure of the patient functional status. 3.Echocardiographic assessment: Both qualitative and quantitative assessment by two dimensional and M-mode ECHO were performed for estimation of left ventricular systolic functions, ejection fraction, fraction shortening, left ventricular end systolic and diastolic dimensions. Resting SWMA was evaluated for differentiation of cause of left ventricular systolic functions, also to exclude valvular and congenital heart diseases. 4. Tumor necrosis factor alpha assay: Enzyme Linked Immunosorbent Assay (ELISA) technique was used to quantify TNF-α.Test specification: sensitivity of test: 0.195 ng/ml range till 200 ng/ml Statistical analysis of data : All the data were collected, verified, revised
14
8
and then edited on personal computer. The data were subjected to statistical analysis using SPSS package version (11).Mean (X) and standard deviations (SD) were calculated for each quantitative variable. Within group analysis was done using chi square test. ANOVA multianalysis of variance and Pearson correlation coefficient (r) was calculated to investigate possible correlation between variables. Results: The results are presented in (Tables 1&2) and (Figures 1 to 5)
The study included 49 male subjects and 41 female subjects with mean age 51 ± 10.9 years. As regard to the cause of systolic left ventricular dysfunction; 25 patients had DCM while 35 patients had ICM.
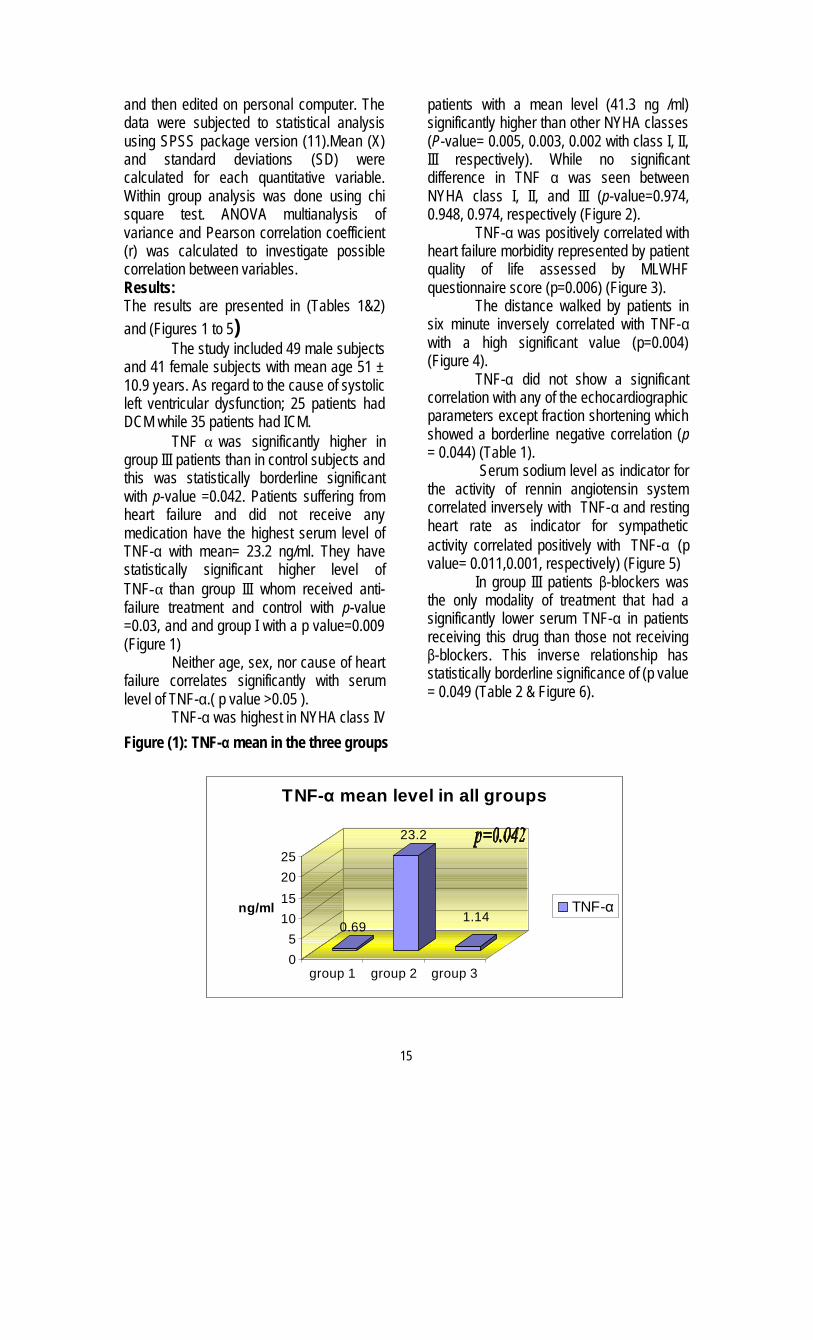
TNF α was significantly higher in group III patients than in control subjects and this was statistically borderline significant with p-value =0.042. Patients suffering from heart failure and did not receive any medication have the highest serum level of TNF-α with mean= 23.2 ng/ml. They have statistically significant higher level of TNF-α than group III whom received anti-failure treatment and control with p-value =0.03, and and group I with a p value=0.009 (Figure 1)
Neither age, sex, nor cause of heart failure correlates significantly with serum level of TNF-α.( p value >0.05 ).
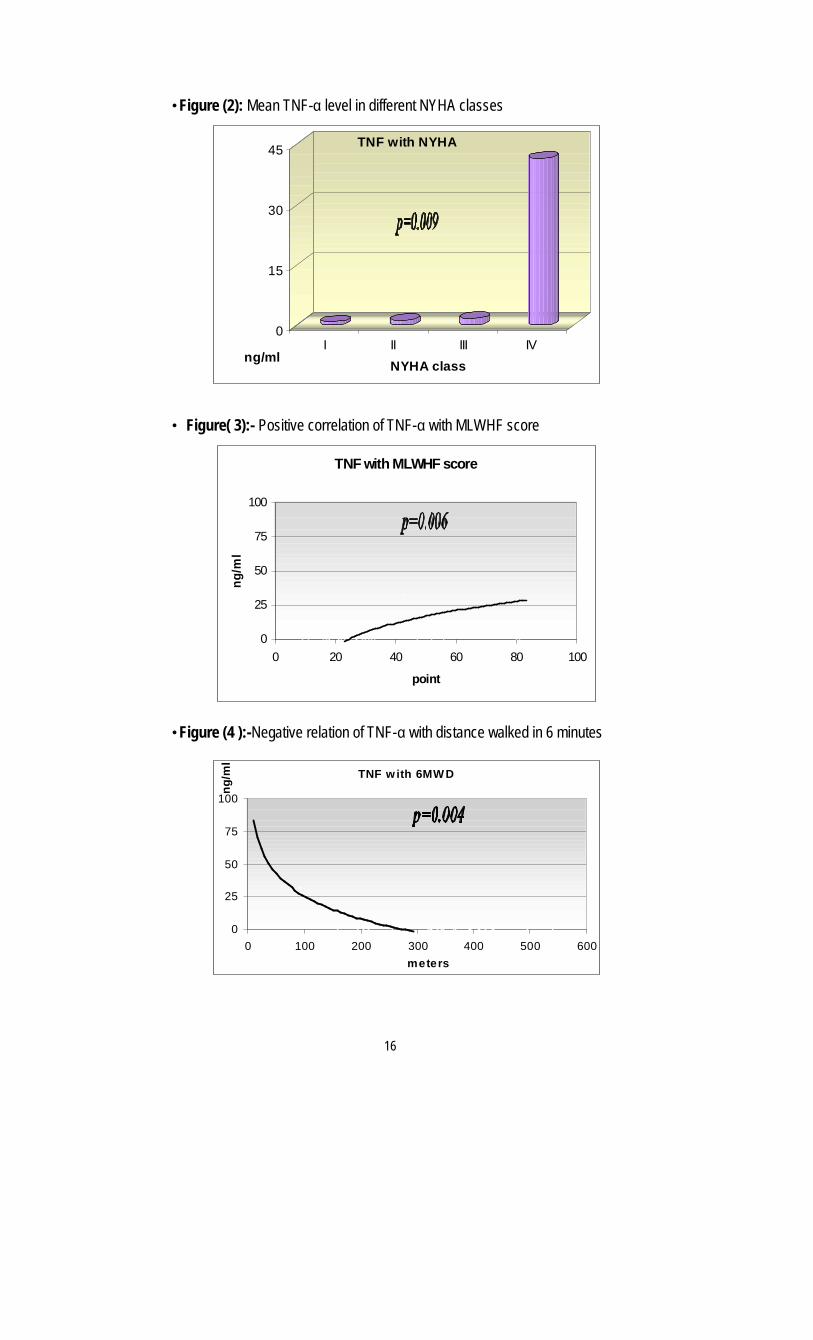
TNF-α was highest in NYHA class IV
patients with a mean level (41.3 ng /ml) significantly higher than other NYHA classes (P-value= 0.005, 0.003, 0.002 with class I, II, III respectively). While no significant difference in TNF α was seen between NYHA class I, II, and III (p-value=0.974, 0.948, 0.974, respectively (Figure 2).
TNF-α was positively correlated with heart failure morbidity represented by patient quality of life assessed by MLWHF questionnaire score (p=0.006) (Figure 3).
The distance walked by patients in six minute inversely correlated with TNF-α with a high significant value (p=0.004) (Figure 4).
TNF-α did not show a significant correlation with any of the echocardiographic parameters except fraction shortening which showed a borderline negative correlation (p = 0.044) (Table 1).
Serum sodium level as indicator for the activity of rennin angiotensin system correlated inversely with TNF-α and resting heart rate as indicator for sympathetic activity correlated positively with TNF-α (p value= 0.011,0.001, respectively) (Figure 5)
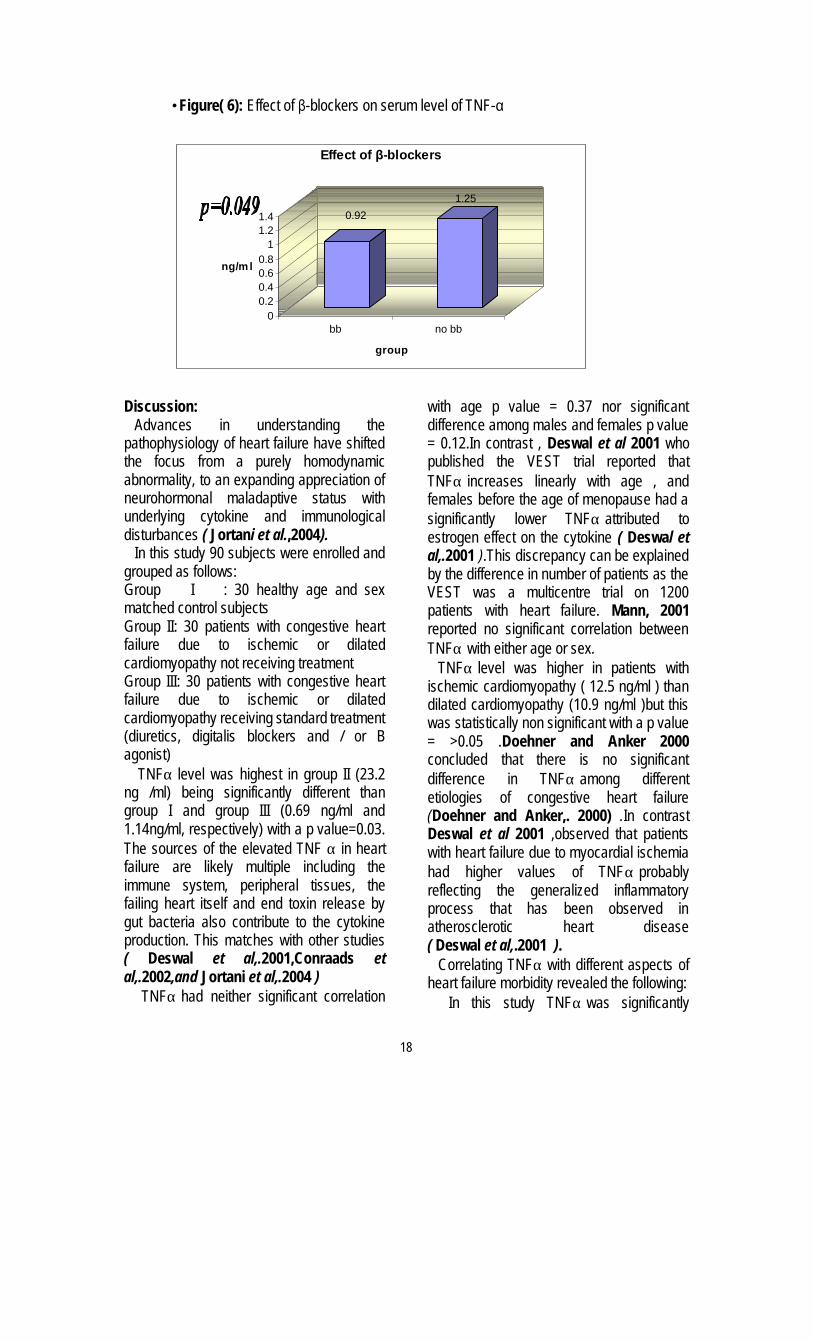
In group III patients β-blockers was the only modality of treatment that had a significantly lower serum TNF-α in patients receiving this drug than those not receiving β-blockers. This inverse relationship has statistically borderline significance of (p value = 0.049 (Table 2 & Figure 6).
Figure (1): TNF-α mean in the three groups
0.69
23.2
1.14
05
10152025
ng/ml
group 1 group 2 group 3
TNF-α mean level in all groups
TNF-α
15
8
•Figure (2): Mean TNF-α level in different NYHA classes
0
15
30
45
ng/mlI II III IV
NYHA class
TNF with NYHA
• Figure( 3):- Positive correlation of TNF-α with MLWHF score
TNF with MLWHF score
0
25
50
75
100
0 20 40 60 80 100
point
ng/m
l
•Figure (4 ):-Negative relation of TNF-α with distance walked in 6 minutes
TNF w ith 6MW D
0
25
50
75
100
0 100 200 300 400 500 600meters
ng/m
l
16

8
• Table(1):-Correlation of TNF-α with echocardiographic data of studied subjects
Variable r P Significance
EF -0.207 0.086 NS
EDD 0.051 0.674 NS
ESD 0.149 0.219 NS
FS -0.262 0.044 Borderline Significance
Figure (5): Correlation of TNF-α with serum sodium level (Na) and resting heart rate (RHR)
neurohormonal activation
0
20
40
50 70 90 110 130 150
TNF in ng/ml
•Table(2): Correlation between TNF-α and therapy in group III patients
treatment P Significance
Digitalis 0.094 NS
Diuretic 0.056 NS
ACE 0.057 NS
β-blockers 0.049 Borderline Significance
Dobutrex 0.062 NS
17
8
•Figure( 6): Effect of β-blockers on serum level of TNF-α
0.921.25
00.20.40.60.8
11.21.4
ng/m l
bb no bb
group
Effect of β-blockers
Discussion:
Advances in understanding the pathophysiology of heart failure have shifted the focus from a purely homodynamic abnormality, to an expanding appreciation of neurohormonal maladaptive status with underlying cytokine and immunological disturbances ( Jortani et al.,2004). In this study 90 subjects were enrolled and grouped as follows: Group I : 30 healthy age and sex matched control subjects Group II: 30 patients with congestive heart failure due to ischemic or dilated cardiomyopathy not receiving treatment Group III: 30 patients with congestive heart failure due to ischemic or dilated cardiomyopathy receiving standard treatment (diuretics, digitalis blockers and / or B agonist) TNFα level was highest in group II (23.2 ng /ml) being significantly different than group I and group III (0.69 ng/ml and 1.14ng/ml, respectively) with a p value=0.03. The sources of the elevated TNF α in heart failure are likely multiple including the immune system, peripheral tissues, the failing heart itself and end toxin release by gut bacteria also contribute to the cytokine production. This matches with other studies ( Deswal et al,.2001,Conraads et al,.2002,and Jortani et al,.2004 ) TNFα had neither significant correlation
with age p value = 0.37 nor significant difference among males and females p value = 0.12.In contrast , Deswal et al 2001 who published the VEST trial reported that
TNFα increases linearly with age , and females before the age of menopause had a significantly lower TNFα attributed to estrogen effect on the cytokine ( Deswal et al,.2001 ).This discrepancy can be explained by the difference in number of patients as the VEST was a multicentre trial on 1200 patients with heart failure. Mann, 2001 reported no significant correlation between TNFα with either age or sex. TNFα level was higher in patients with ischemic cardiomyopathy ( 12.5 ng/ml ) than dilated cardiomyopathy (10.9 ng/ml )but this was statistically non significant with a p value = >0.05 .Doehner and Anker 2000 concluded that there is no significant difference in TNFα among different etiologies of congestive heart failure (Doehner and Anker,. 2000) .In contrast Deswal et al 2001 ,observed that patients with heart failure due to myocardial ischemia had higher values of TNFα probably reflecting the generalized inflammatory process that has been observed in atherosclerotic heart disease ( Deswal et al,.2001 ). Correlating TNFα with different aspects of heart failure morbidity revealed the following: In this study TNFα was significantly
18
8
higher in patients with NYHA class IV patients (41.6 ng/ml ) compared to NYHA class I,II and III (0.8,1.26,1.65 ng/ml respectively) p value =0.005.Quality of life assessed by Milwlkee heart failure score significantly correlated with TNFα p value = 0.006 and furthermore there was significant negative correlation between exercise tolerance represented by 6 minute walk distance and TNFα level p value =0.004.These findings are in concordance with other reports ,that heart failure patients with high TNFα concentrations have been associated with poor functional status and exercise intolerance ( Conoraads et al,. 2002). In contrasts Deswal et al 2001 concluded that there is no significant difference in TNFα cocentration in different NYHA classes. This can be explained by the fact that the VEST study enrolled patients with sever heart failure ( NYHA class III and IV).But , as regards MLWHF score and the six minute walk distance Deswal et al 2001 reported a significant relation. Also the VEST study reported increased morbidity defined as recurrent Deswal et al 2001 hospitalization,requirment for IV cardiac support ,and upto cardiac transplantation in heart failure patients with higher levels of TNFα ( Deswal et al,.2001). As regards correlation of TNFα with indicators of neurohormonal activation, the following was noted. .Activation of renin-angiotensin system was detected by low serum sodium level, there was a significant inverse correlation between TNFα and serum sodium level p value = 0.01, this is in concordance with previous studies ( Cicoira et al,.2001). .As regards sympathetic system over activity clinically detected by resting heart rate ,it was significantly higher in group II than group I and III (92,70 and 81 beats/minute respectively)with a p value= <0.05. There was a highly significant correlation between TNFα and resting heart rate p value =0.001. This elucidated the substantial crosstalk between the B adrenergic system, which is chronically activated in heart failure, and
inflammatory cytokine production. This hypothesis is further supported by the finding that among group III patients, carvedilol (the B blocker used in this study) was the only therapeutic agent that influenced TNF α .Patients receiving carvedilol had significantly lower TNF α than those not receiving the drug p value =0.04 .This stresses the importance of using B blockers in trial to reverse sympathetic over activity which augments cytokine over production (Ohtsuka et al,.2002and Jortani et al,.2004) TNFα did not correlate with ECHO parameters except for fractional shortening with which it correlated inversely p value =0.04 which supports the fact that TNFα depresses myocardial functions ( Jortani et al,.2004 ) In conclusion, TNFα may be a clinically useful prognostic marker for patients with heart failure and can influence the modality of treatment. References: .Anderson, H. D. I.; Rahmutula, D.and Gardner, D. G. Tumor Necrosis Factor-{alpha} Inhibits Endothelial Nitric-oxide SynthetaseGene Promoter Activity in Bovine Aortic Endothelial Cells. J. Boi.l Chem.(2004).9: 963-969 .Anker, S.D and Von Haehling, S. Inflammatory mediators in chronic heart failure lure: an overview. Heart (2004). 90:464-470 .Carswell, E. A.; Old, L. J.; Kassel, R. L.; Green, S.; Fiore, N. and Williamson, B. An endotoxin-induced serum factor that causes necrosis of tumors. Proc. Natl. Acad. Sci.,USA, 1975; 72: 3666-3670 .Cicoira, M.; Bolger, A. P.; Doehner, W.; Rauchhaus, M.; Davos, C. and Sharma, R.. High tumor necrosis factor-in patients with heart failure. Am. J. Cardiol., 2001; 88:805-808 .Conraads, V. M.; Beckers, P.; Bosmans, J.; De Clerck, L.S.; Stevens, W.J.; Vrints, C.J.and Brutsaert, D.L. Combined
19
8
endurance/resistance training reduces plasma TNF-{alpha} receptor levels in patients with chronic heart failure and coronary artery disease. EurHeart Journal, (2002). 23: 1854-1860 .Conraads, V.M.; Bosmans, J.M and Vrints, C.J. Chronic heart failure: an example of a systemic chronic inflammatory disease resulting in cachexia. Int. J. Cardiol., 2002; 85: 33-49 •Deswal, A.; Petersen, N. J. and Feldman, A. M.. Cytokines and cytokine receptors in advanced heart failure: an analysis of the cytokine database from the Vesnarinone trial (VEST). Circulation 2001; 103: 2055-2059. .Doehner, W.and Anker, S.D. TNF-{alpha} system in CHF. EurHeart Journal (2000). 21: 782-782 .Jortani, A.; Sumanth, D. Prabhu and Roland Valdes. Strategies for Developing Biomarkers of Heart Failure . Clinical Chemistry. 2004;50: 265-278.) .Kell, R.; Haunstetter, A.; Dengler, T.J.; Zugck, C.; Kubler, W. and Haas M. Do cytokines enable risk stratification to be
improved in NYHA functional class III patients? Comparison with other potential predictors of prognosis. European Heart Journal 2002; 23: 70-78 .Krakauer, T.; Vilcek, J.L. and Oppenheim, J.J. Prointiammatory Cytokines: TNF and IL-i families, chemokines, TGF-~, and others. In: Paul WE, ed., Fundamental Immunology. New York: Lippincott-Raven; 1999: 775-811 .Mann, D.L. Mechanisms and models in heart failure: a combinatorial approach. Circulation 1999; 100:999-1008. •Ohtsuka, T.; Hamada, M.and Saeki, H.. Comparison of effects of carvedilol versus metoprolol on cytokine levels in patients with idiopathic dilated cardiomyopathy. Am. J. Cardiol., 2002; 89: 996-999. •Panas, D.; Khadour, F.; Szabo, C. and Sehuiz, R. Proinflammatory cytokines depress cardiac efficiency by a nitric oxide-dependent mechanism. Am. J. Physiol., 1998; 375:H1016- H1023.
20
13
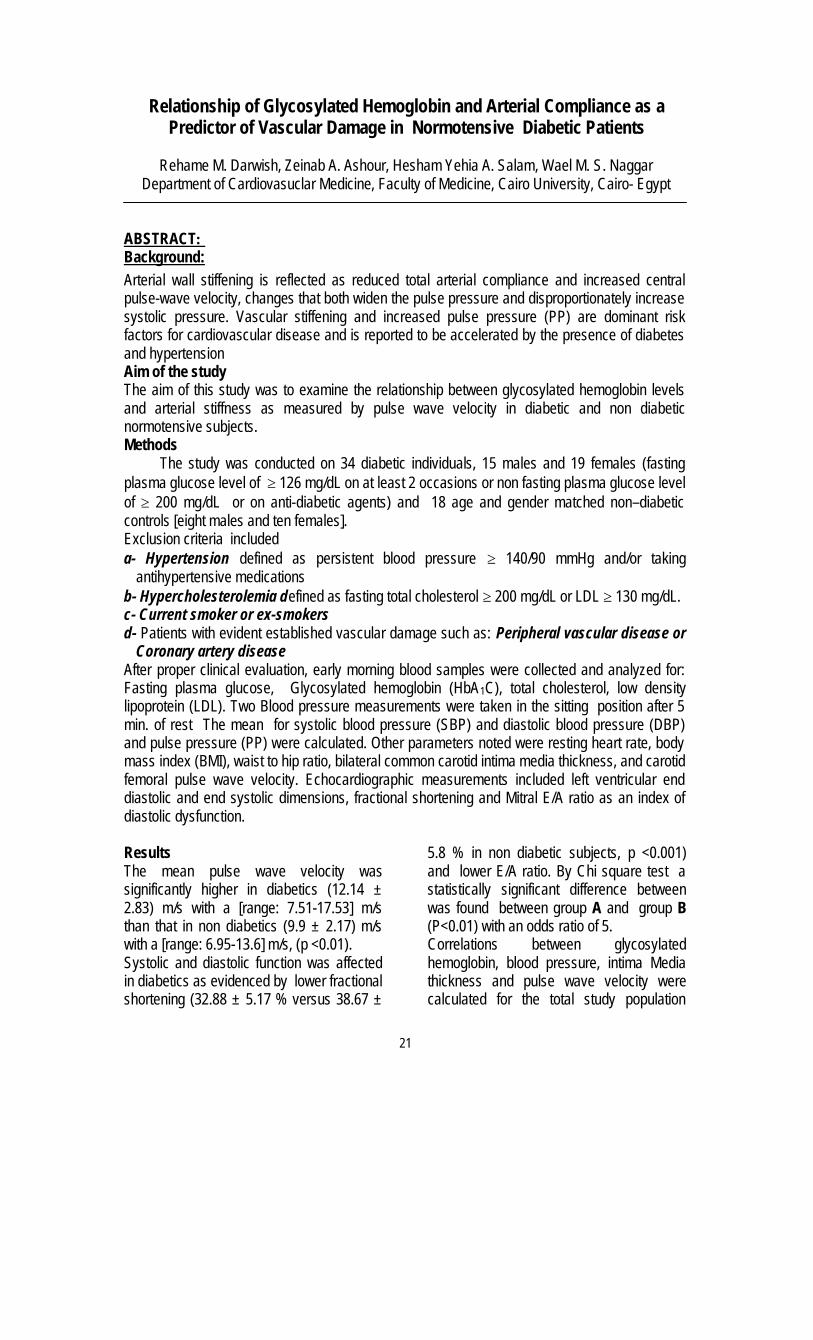
Relationship of Glycosylated Hemoglobin and Arterial Compliance as a Predictor of Vascular Damage in Normotensive Diabetic Patients
Rehame M. Darwish, Zeinab A. Ashour, Hesham Yehia A. Salam, Wael M. S. Naggar
Department of Cardiovasuclar Medicine, Faculty of Medicine, Cairo University, Cairo- Egypt ABSTRACT: Background:
Arterial wall stiffening is reflected as reduced total arterial compliance and increased central pulse-wave velocity, changes that both widen the pulse pressure and disproportionately increase systolic pressure. Vascular stiffening and increased pulse pressure (PP) are dominant risk factors for cardiovascular disease and is reported to be accelerated by the presence of diabetes and hypertension Aim of the study The aim of this study was to examine the relationship between glycosylated hemoglobin levels and arterial stiffness as measured by pulse wave velocity in diabetic and non diabetic normotensive subjects. Methods
The study was conducted on 34 diabetic individuals, 15 males and 19 females (fasting plasma glucose level of ≥ 126 mg/dL on at least 2 occasions or non fasting plasma glucose level of ≥ 200 mg/dL or on anti-diabetic agents) and 18 age and gender matched non–diabetic controls [eight males and ten females]. Exclusion criteria included a- Hypertension defined as persistent blood pressure ≥ 140/90 mmHg and/or taking
antihypertensive medications b- Hypercholesterolemia defined as fasting total cholesterol ≥ 200 mg/dL or LDL ≥ 130 mg/dL. c- Current smoker or ex-smokers d- Patients with evident established vascular damage such as: Peripheral vascular disease or
Coronary artery disease After proper clinical evaluation, early morning blood samples were collected and analyzed for: Fasting plasma glucose, Glycosylated hemoglobin (HbA1C), total cholesterol, low density lipoprotein (LDL). Two Blood pressure measurements were taken in the sitting position after 5 min. of rest The mean for systolic blood pressure (SBP) and diastolic blood pressure (DBP) and pulse pressure (PP) were calculated. Other parameters noted were resting heart rate, body mass index (BMI), waist to hip ratio, bilateral common carotid intima media thickness, and carotid femoral pulse wave velocity. Echocardiographic measurements included left ventricular end diastolic and end systolic dimensions, fractional shortening and Mitral E/A ratio as an index of diastolic dysfunction. Results The mean pulse wave velocity was significantly higher in diabetics (12.14 ± 2.83) m/s with a [range: 7.51-17.53] m/s than that in non diabetics (9.9 ± 2.17) m/s with a [range: 6.95-13.6] m/s, (p <0.01). Systolic and diastolic function was affected in diabetics as evidenced by lower fractional shortening (32.88 ± 5.17 % versus 38.67 ±
5.8 % in non diabetic subjects, p <0.001) and lower E/A ratio. By Chi square test a statistically significant difference between was found between group A and group B (P<0.01) with an odds ratio of 5. Correlations between glycosylated hemoglobin, blood pressure, intima Media thickness and pulse wave velocity were calculated for the total study population
21

14
taking all parameters as continuous variables . The results are shown in the
table below. A significant correlation was found for all parameters.
SBP DBP PP Mean BP Mean Carotid IMT PWV R value 0.45 0.33 0.3 r=0.41 0.37 0.4 P value < 0.001 < 0.02 < 0.03 p<0.003 < 0.01 <0.004
Conclusion:
Diabetic normotensive patients have increased arterial stiffness, higher blood pressure and poorer systolic and diastolic left ventricular function, even though all the above mentioned parameters were still within normal range. A strong relationship was found between glycosylated hemoglobin and pulse wave velocity as an index for arterial stiffness, and may explain the results of this study INTRODUCTION Atherosclerosis accounts for virtually 80% of all deaths and 75% of all hospitalizations and is the major cause of premature death in patients with either insulin-dependent or non–insulin-dependent diabetes. The specific effects of hyperglycaemia are mediated through the irreversible glycosylation of proteins and lipoproteins, enhancing the potential for oxidative damage. (1) Glucose, reacts nonenzymatically with amino groups of free amino acids, peptides and proteins to form glycated residues called Amadori products, which by dehydration and fragmentation reactions are transformed to stable covalent adducts called advanced glycosylation end products (AGE). (16) AGE accumulate slowly on long lived proteins such as collagen and elastin to stiffen both arteries and the heart, cause cross-linking of collagen molecules to each other leading to the loss of collagen elasticity, and subsequently a reduction in arterial and myocardial compliance. (18-21) Arterial wall stiffening is reflected as reduced total arterial compliance and increased central pulse-wave velocity, changes that both widen the pulse pressure and disproportionately increase systolic
pressure. Vascular stiffening and increased pulse pressure (PP) are dominant risk factors for cardiovascular disease. (25-29)
AIM OF THE WORK Determining the relationship
between arterial compliance and diabetic status in normotensive diabetic and nondiabetic individuals by comparing the relationship between the HbA1C as it is the best available clinical representative of AGE and:
1- Arterial wall stiffening 2- Pulse pressure (PP). 3- Carotid intima-media thickness
(CIMT). Patient population:
The present study included fifty-two individuals presenting to the out-patient clinics and the internal departments of Cairo university hospital from October2003-October 2004.Thirty-four subjects were diabetics [fifteen males and nineteen females] and Eighteen were age and gender matched normotensive non–diabetic individuals chosen as a control group [eight males and ten females]. To be enrolled in the study the diabetic patients had to have a documented diagnosis and an elevation of fasting plasma glucose level of ≥ 126 mg/dL on at least 2 occasions or non fasting plasma glucose level of ≥ 200 mg/dL or had to be receiving anti-diabetic agents. (280) .Patients suffering from other evident causes for reduced arterial compliance were excluded. The exclusion criteria were a- Hypertension defined as persistent
blood pressure ≥ 140/90 mmHg and/or taking antihypertensive medications. (281)
b- Hypercholesterolemia defined as fasting total cholesterol ≥ 200 mg/dL or
22

15
low density lipoprotein (LDL) ≥ 130 mg/dL. (282)
c- Current smoker or ex-smokers were excluded
d- Patients with evident established vascular damage such as : Peripheral vascular diseaseor Coronary artery disease as evidenced by either: a history of typical claudication or anginal chest pain, positive non-invasive assessment for myocardial ischaemia e.g. stress ECG or Thallium study, ECG changes consistent with myocardial ischaemia or previous myocardial infarction, peripheralor coraonary arterial disease documented by angiography.
II. Study design:
After proper clinical evaluation early morning blood samples were collected and analyzed for: Fasting plasma glucose, Glycosylated hemoglobin (HbA1C), total cholesterol, low density lipoprotein (LDL).
Blood pressure was measured in the sitting position after 5 min. of rest using a mercury sphygmomanometer. The mean of two values was used for systolic blood pressure (SBP) and diastolic blood pressure (DBP) measurements and pulse pressure (PP) was calculated.
The resting heart rate was calculated by counting radial pulse in 30 seconds and multiplying it by 2.
Body mass index (BMI) in Kg/m2 was calculated through the following equation: BMI = weight / (height)2
The waist to hip ratio was calculated from measurements of the circumference located between the lower rib and the widest area of the hip respectively.
Measurement of carotid intima media thickness: Bilateral CCAs (common carotid arteries) were examined by high-resolution B-mode ultrasonography with 7.5 MHZ linear phased
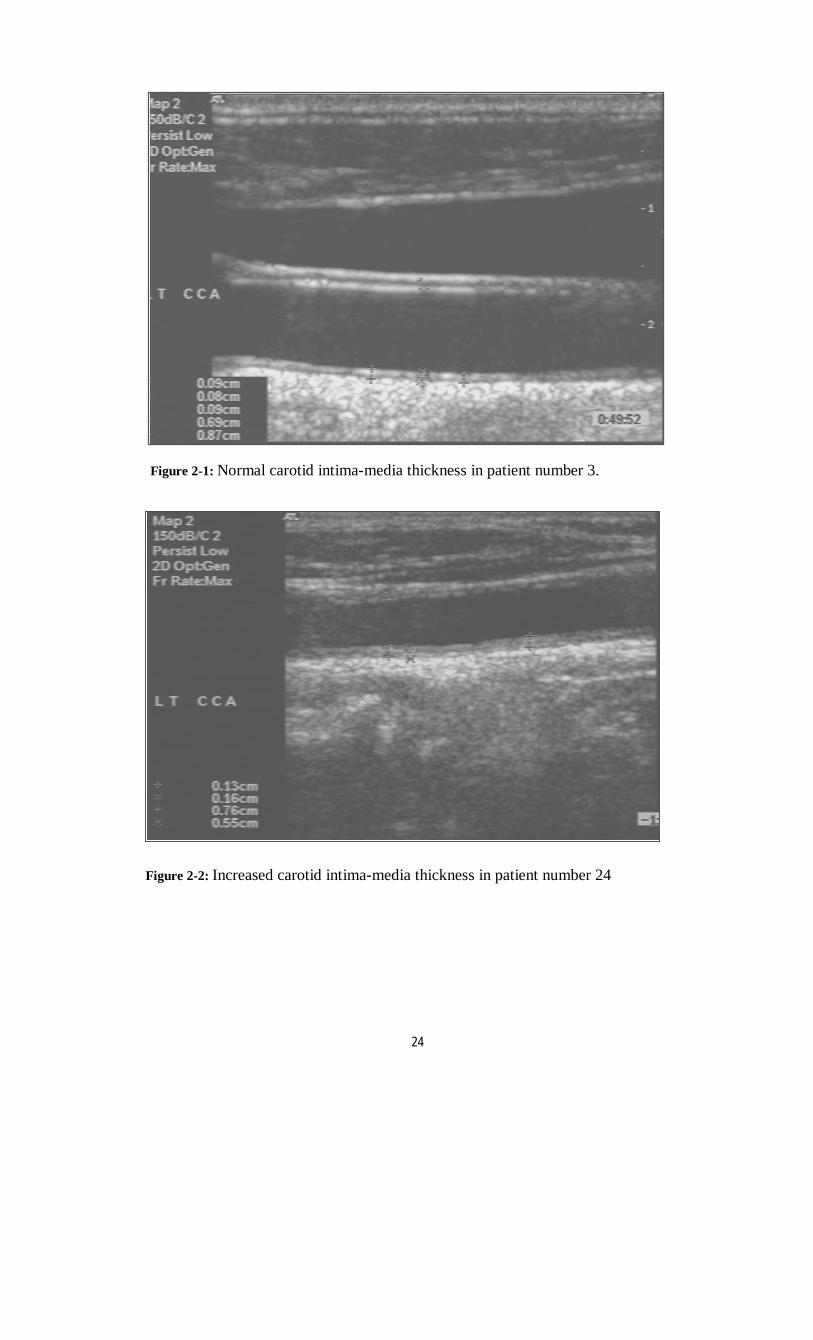
array trapezoid transducer attached to HEWLETT PACKARD Sonos 2000 machine, model 2406. The ultrasound unit has a cineloop image review system that allows for storage of sequential images into the system memory. The examination was conducted with the subject in the supine position, the head slightly tilted to the contralateral side in a dark and quiet room, and the diameter measurement was started after at least 5 to 10 min of bed rest. The transducer was manipulated so that the near and far walls of the artery were parallel to the transducer foot print and the lumen was maximized in the longitudinal plane. No pressure was applied on the skin from the transducer, and acoustic coupling was achieved with gel. The common carotid artery was imaged longitudinally at a region approximately 1.5 cm proximal to the bulge of the carotid bifurcation, and the B-mode image was maintained for several seconds. Scans were performed on both the right and left common carotid arteries (figure 2-1). Measurements of intimal–medial thick-ness and plaque thickness were taken directly from B-mode ultrasound images, using the thickest section for each carotid segment and by using electronic calibers available in the equipment. The intimal-medial thickness was defined as the lumen–intimal interface to the medial-adventitial border, figure (2-1) and (2-2), a plaque as a local irregular structure that protrudes into the lumen more than 1.5 mm; figure (2-3). The thickest wall area was obtained by using the anterior view, medial to the sternocleidomastoid muscle (SCM), the anterolateral view, and the posterolateral view, behind the SCM. A mean value was obtained from three measurements at the far and near walls in both the anterolateral and posterolateral views and averaged for systolic and diastolic diameters.
23
16
Figure 2-2: Increased carotid intima-media thickness in patient number 24
Figure 2-1: Normal carotid intima-media thickness in patient number 3.
24

17
c – Echocardiography: Transthoracic two dimensional M-mode
and Doppler echocardiography techniques were applied. Imaging was performed with commercially available HEWLETT PACKARD Sonos 2000 machine, equipped with 2.5 and 3.5 MHz phased pulsed array transducers. Standard two-dimensional and M-mode echocardiography with the patient in the left lateral decubitus were recorded. The transducer was placed in the third and fourth space to obtain the parasternal window for both long and short views and apically to obtain the four chamber view. M-mode was done to obtain the chambers dimensions and measurements according to the recommendations of American Society of Echocardiography. Assessment of LV diastolic function by the following Doppler parameters and measurements,:E-wave velocity, A-wave velocity, E/A ratio, deceleration time of the E-wave.
Pulse wave velocity (PWV): Arterial compliance of great vessels can be studied through Doppler evaluation of PWV along the arterial tree. The measurement of PWV as an arterial distensibility index is widely used and is calculated from measurement of pulse transit time and the distance traveled by the pulse between two recording sites. Recording are usually made from the right side of the body with patient lying at ease in supine position. The carotid and femoral pulse wave were recorded simultaneously .Pulse wave velocity was calculated automatically by the aid of the Complior system
Statistical analysis All data were tabulated and statistically analyzed using the SPSS package. Continuous data were presented as mean ± SD; categorical data were presented as percentage. Continuous data were analyzed using paired student t-test, while categorical data were analyzed using Chi-square test. A (p value) of < 0.05 was considered statistically significant.
Figure 2-3: Atherosclerotic plaque in the right sided internal carotid artery of patient number 26
25

18
Results: The patient population consisted of two groups:
Group A: included 34 diabetic individuals (65%), {15 males (29%) and 19 females (36%)}. Group B: who were non diabetics age and gender matched 18 individuals (35%), {8
males (15.5%) and 10 females (19.5%)}.The patient to control ratio was 2:1.
1. Demographic characteristics: There were no differences in age, the distribution of sex (as previously mentioned) or in body mass index (BMI) between diabetic patients in group A and group B subjects. See table (1)
Figure 2-5: Pulse wave velocity measured in patient number 49
Figure 2-6: Increased Pulse wave velocity measured in patient number 19
26

19
Table 1: Demographic characteristics Variable Group A Group B P-Value
AGE (years) 50.08 ± 9.19 49.94 ± 10.26 0.36 BMI (Kg /m2 ) 30.17 ± 4.79 29.86 ± 5.26 0.83
2. Blood pressure: The whole study population showed a mean systolic blood pressure of 123.52 ± 14.18 mmHg with a range of (90-140) mmHg, a mean
diastolic blood pressure of 77.58 ± 8.21 mmHg with a range of (60-90) mmHg and a mean pulse pressure of 45.98 ±11.05 mmHg with a range of 48 mmHg.
. Table 2: Difference in blood pressure measurements between the two groups
Variable Group A Group B P-Value SBP (mmHg) 126.94 ±13.08 117.06 ±14.27 0.02 DBP (mmHg) 77.82 ± 9.02 77.11± 6.62 0.77 PP (mmHg) 49.47± 9.63 39.39 ±10.77 0.00
3. Laboratory data: Table 3 shows the difference of laboratory data in both groups
Variable Group A Group B P-Value FBS (mg/dl) 198.15 ± 91.13 94.89 ± 15.3 0.00 HBA1C (%) 8.07 ± 2.18 5.35 ± 0.43 0.00 LDL (mg/dl) 78.59 ± 16.37 78.22 ± 11.36 0.93 Cholesterol (mg/dl) 172.59 ± 32.07 162.61 ± 22.57 0.25
4. Arterial parameters: Carotid duplex parameter: The mean intima media thickness (IMT) in the diabetic patients of group A was (0.074 ±
0.015) cm with a [range: 0.05-0.17cm] and that of group B was (0.066 ±0.015) cm with a [range: 0.05-0.14 cm], (p value = 0.09) which did not reach statistical significance.
Pulse wave velocity: The mean pulse wave velocity was significantly higher in group A (12.14 ± 2.83) m/s with a [range: 7.51-17.53] m/s than that in group B (9.9 ± 2.17) m/s with a [range: 6.95-13.6] m/s, (p <0.01). ( see Fig. 1)
Figure 1: the difference of PWV in both groups
Difference in PWV between both groups
p<0.01
0
2
4
6
8
10
12
14
group A group B
m/s PWV
27

20
5. Echocardiographic data: There was a statistically significant difference between diabetic patients of group A and that of non diabetic controls in group B in the fractional shortening being
higher in group B subjects. The mean FS in patients of group A was (32.88 ± 5.17 %) versus (38.67 ± 5.8 %) in group B subjects, (p <0.001).
Table 4: M–mode data of echocardiography:
Variable Whole population Group A Group B P-Value AO (cm) 3.02 3.04 2.99 0.58 LA (cm) 3.52 3.48 3.6 0.26 SWT (cm) 0.9 0.92 0.87 0.17 PWT (cm) 0.94 0.95 0.92 0.34 LVED (cm) 5.02 5.01 5.04 0.75 LVES (cm) 3.28 3.36 3.12 0.07 FS % 34.88 32.88 38.67 0.001
AO: Aortic root diameter, LA: Left atrial dimension, SWT: End diastolic septal wall thickness, PWT: End diastolic posterior wall thickness, LVED: left ventricular end diastolic dimension, LVES: left ventricular end systolic dimension, FS: fractional shortening
6. Diastolic dysfunction: E/A ratio was lower in group A when compared with group B, and by Chi square test a statistically significant difference between was found between group A and group B (P<0.01) with an odds ratio of 5.
Table 5: illustrating diastolic parameters indices measured by echocardiography:
Variable Whole population Group A Group B P-Value E (cm/s) 0.6 0.59 0.64 0.27 A (cm/s) 0.61 0.64 0.56 0.08 Slope (mm/s) 352.88 351.62 355.28 0.93 DT (second) 0.14 0.13 0.14 0.48 DFT(second) 0.46 0.48 0.44 0.43 E/A ratio 1.06 0.99 1.2 0.07 E: (E velocity) peak early ventricular filling, A: (A velocity) peak late ventricular filling, Slope: the slope of E wave deceleration, DT: deceleration time, DFT: diastolic filling time.
Table 6: Difference in diastolic function between the two groups of the study (Chi square test)
Variable Group Diastolic dysfunction OR P-Value
No Yes Total N % N % N %
Diabetic (group A) 14 41.2 20 58.8 34 100
Diabetes Non -diabetic (group B) 14 77.8 4 22.2 18 100
5
0.01*
Total 28 53.8 24 46.2 52 100
28

21
II. Relationship between glycosylated hemoglobin and other parameters: Correlations between glycosylated hemoglobin, blood pressure, intima Media thickness and pulse wave velocity were
calculated for the total study population taking all parameters as continuous variables . The results are shown in table (7 ) A significant correlation was found for all parameters.
SBP DBP PP Mean BP Mean Carotid IMT PWV R value 0.45 0.33 0.3 r=0.41 0.37 0.4 P value < 0.001 < 0.02 < 0.03 p<0.003 < 0.01 <0.004
Discussion Despite arterial heterogeneity, structural and functional abnormalities are usually observed at an early stage of cardiovascular diseases in both large and small arteries. These alterations modify arterial wall physiological and mechanical properties; they facilitate establishment and progression of atherosclerosis and arteriosclerosis. Since arteries constitute the target and the common denominator of cardiovascular complications, several non-invasive techniques may be useful to assess their haemodynamics. These include casual and ambulatory blood pressure measurements which can evaluate pulse pressure, Doppler signal to assess the arterial flow, video-echo signal to analyze the arterial structure such as intima-media thickness; a sensitive indicator of "risk",(8,9) or echo-tracking systems for direct measurements of arterial wall distension and thickness; pulse wave velocity (PWV) is widely used as index of arterial distensibility.. Accelerated arterial stiffness has been linked to diabetes, hyperglycaemia, hyperinsulinaemia, and impaired glucose tol-erance. (3,9,,,17,20) These findings have been confirmed in older adults, (18,19,21) and suggest that insulin resistance or its products, i.e. hyperglycaemia and hyperinsulinaemia, may promote arterial stiffening independent of age. Even in individuals with asymptomatic diabetes who do not have a history of coronary heart disease have a similar risk of myocardial infarction as those without diabetes who have an established history of coronary heart
disease and for this reason, diabetes is now considered by many as a coronary heart disease equivalent. (24 ) This study was conducted to determine the relationship between arterial compliance and diabetic status in normotensive diabetic patients (group A) and non diabetic age and gender matched controls (group B). Despite the fact that all our patients were normotensives, group (A) showed higher values for systolic blood pressure and pulse pressure (126.94 ±13.08 mmHg and 49.47±9.63mmHg respectively), than that observed in group (B) (117.06 ±14.27 mmHg and 39.39 ±10.77 mmHg respectively), with p < 0.02 and p < 0.001 respectively. These results were concordant with Ohnishi et al (25) and Taniwaki et al (26) taking into consideration that in both previous studies they did not select normotensive subjects as we did in our present study. These findings are also consistent with reports suggesting that diabetic arteries stiffen earlier along with increasing cardiovascular risk. (27) Contrary to the latter study, there was no difference in the mean IMT between both groups. This may be explained by the fact that contrary to the group investigated by Taniwaki et al, smokers, hypertensive and dyslipidaemic patients were excluded in our study. As previously reported in other studies ( 28), the pulse wave velocity was significantly higher in group (A) individuals (12.14± 2.83 m/s) than their age matched controls in group (B) (9.9 ±2.17 m/s), (p <0.01) . Athough all M-mode echocardiographic measurements and derived parameters were still within normal in both groups, we found that significantly higher fractional shortening
29

22
values in group (B) than that of group (A) (38.67±5.8 versus 32.88±5.17%) respectively, (p <0.001) . A higher incidence of diastolic dysfunction was also observed in diabetics where 58.8% (n=20) of group (A) versus 22.2% (n=4) of group (B) had diastolic dysfunction, (p <0.01) with a likelihood ratio of 5 for diabetics to develop diastolic dysfunction. Similar results were observed by Poirier et al (27) , who reported a prevalence of left ventricular dysfunction of >50% in subjects with well-controlled type 2 diabetes without clinically detectable heart disease. While cardiac autonomic neuropathy known to contribute to both systolic and diastolic dysfunction; on a cellular level, both hyperglycemia and insulin resistance have direct negative effects on myocardial metabolism through inhibiting glycolysis and glucose entry into the myocytes. These results indicate that both the systolic and diastolic function as well as arterial compliance are affected in diabetic patients even before overt hypertension or clinically manifest cardiovascular disease develops.
A significantly positive correlation was found between HbA1C and PWV among the whole study population (r=0.4, p <0.004) and that was comparable to the findings of Ohnishi et al (25) , yet our study is the first to show this correlation among normotensive subjects. The importance of this finding is underscored by the results observed in a study by Cruickshank et al (28) .This study group examined the relationship between aortic pulse wave velocity and mortality in diabetes and glucose intolerance among 397 patients, with overall follow up duration of 10 years. The mortality risk was found to be doubled in subjects with diabetes and in those with glucose intolerance than in controls. These results suggest that PWV is a powerful independent predictor of later mortality across the entire spectrum of glucose tolerance, with or without overt type 2 diabetes. They can be explained by glycosylated protein end-products likely promoting arterial stiffness well before an
individual meets the current criteria of overt diabetes. The relationship between glycosylated hemoglobin and PWV was reflected on blood pressure, as HbA1C was also associated with a significant positive correlation with systolic blood pressure (r=0.45, p <0.001), diastolic blood pressure (r=0.33, p <0.02), pulse pressure (r=0.30, p <0.03) and mean blood pressure (r=0.41, p <0.003) among the whole study population. Comparable results were reported by James et al (29) who specifically investigated the relationship between arterial mechanical properties and aging in predominantly elastic compared with predominantly muscular arteries comparing diabetic and non diabetic subjects. In the latter study , diabetic subjects had a higher systolic blood pressure and their mean values of PWV were higher in all segments than in non diabetic subjects, suggesting that in the diabetic group age changes had occurred at an accelerated rate at an earlier age and perhaps had reached a functional plateau where the diabetic group (mean chronological age 61 years) was estimated to have an "arterial" age approximating 75 years in those without diabetes. Likewise Wright et al (20) and Cruickshank et al (28) found that for any given age and blood pressure, PWV increased with abnormal glucose tolerance suggesting that diabetes per se accelerates both the atherotic and sclerotic changes of the arterial wall. From our and other studies it may be concluded that aortic PWV may represent a useful integrated index of vascular status and hence cardiovascular risk. Limitations of the study: The major limitation of this study was the small number of the patients, which may explain the discrepancy between our results and those of other investigators Recommendations for future research: Further studies need to be performed to evaluate whether strict control of blood glucose level (i.e. strict glycaemic control) in diabetic patients or those with impaired fasting glucose level will result in prevention of rapid progressive atherotic and sclerotic
30
23
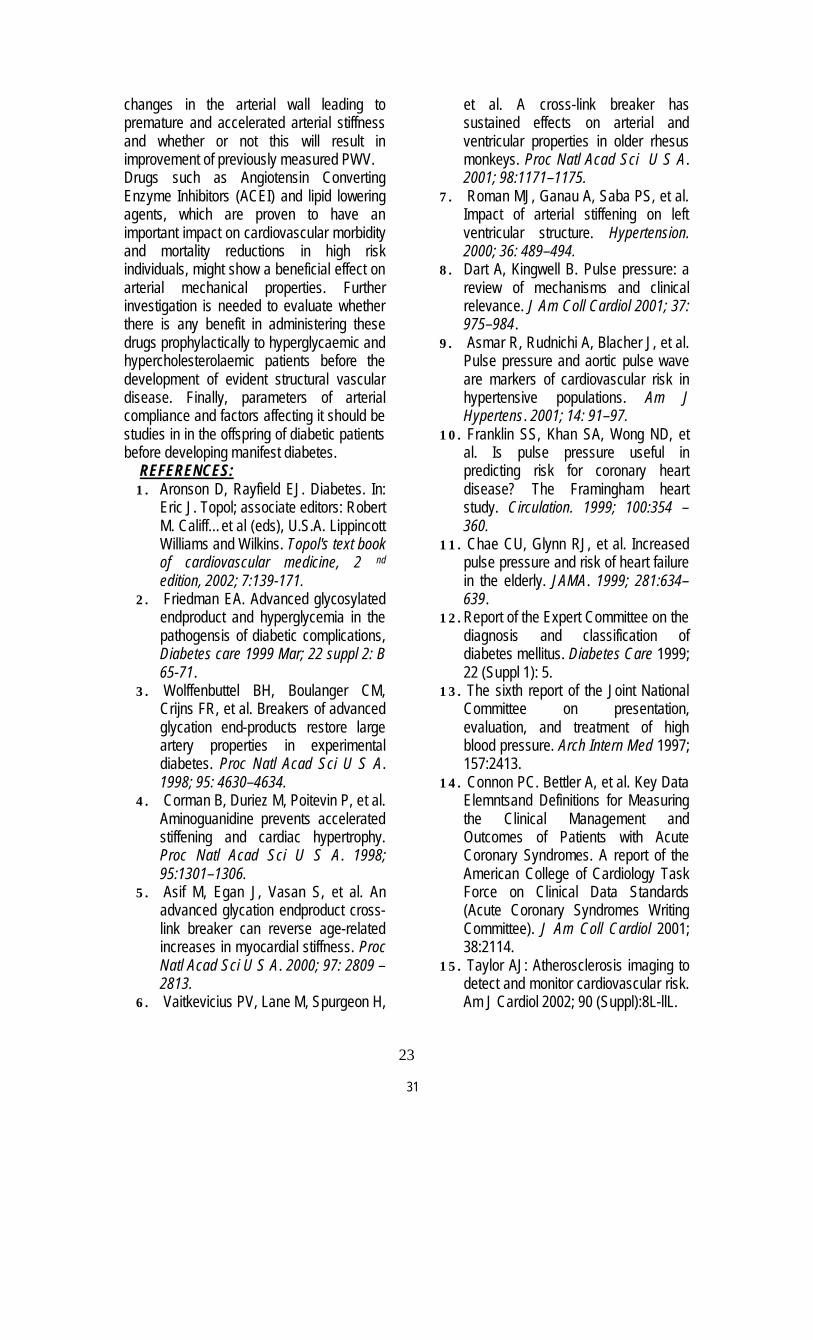
changes in the arterial wall leading to premature and accelerated arterial stiffness and whether or not this will result in improvement of previously measured PWV. Drugs such as Angiotensin Converting Enzyme Inhibitors (ACEI) and lipid lowering agents, which are proven to have an important impact on cardiovascular morbidity and mortality reductions in high risk individuals, might show a beneficial effect on arterial mechanical properties. Further investigation is needed to evaluate whether there is any benefit in administering these drugs prophylactically to hyperglycaemic and hypercholesterolaemic patients before the development of evident structural vascular disease. Finally, parameters of arterial compliance and factors affecting it should be studies in in the offspring of diabetic patients before developing manifest diabetes.
REFERENCES: 1. Aronson D, Rayfield EJ. Diabetes. In:
Eric J. Topol; associate editors: Robert M. Califf…et al (eds), U.S.A. Lippincott Williams and Wilkins. Topol's text book of cardiovascular medicine, 2 nd edition, 2002; 7:139-171.
2. Friedman EA. Advanced glycosylated endproduct and hyperglycemia in the pathogensis of diabetic complications, Diabetes care 1999 Mar; 22 suppl 2: B 65-71.
3. Wolffenbuttel BH, Boulanger CM, Crijns FR, et al. Breakers of advanced glycation end-products restore large artery properties in experimental diabetes. Proc Natl Acad Sci U S A. 1998; 95: 4630–4634.
4. Corman B, Duriez M, Poitevin P, et al. Aminoguanidine prevents accelerated stiffening and cardiac hypertrophy. Proc Natl Acad Sci U S A. 1998; 95:1301–1306.
5. Asif M, Egan J, Vasan S, et al. An advanced glycation endproduct cross-link breaker can reverse age-related increases in myocardial stiffness. Proc Natl Acad Sci U S A. 2000; 97: 2809 –2813.
6. Vaitkevicius PV, Lane M, Spurgeon H,
et al. A cross-link breaker has sustained effects on arterial and ventricular properties in older rhesus monkeys. Proc Natl Acad Sci U S A. 2001; 98:1171–1175.
7. Roman MJ, Ganau A, Saba PS, et al. Impact of arterial stiffening on left ventricular structure. Hypertension. 2000; 36: 489–494.
8. Dart A, Kingwell B. Pulse pressure: a review of mechanisms and clinical relevance. J Am Coll Cardiol 2001; 37: 975–984.
9. Asmar R, Rudnichi A, Blacher J, et al. Pulse pressure and aortic pulse wave are markers of cardiovascular risk in hypertensive populations. Am J Hypertens. 2001; 14: 91–97.
10. Franklin SS, Khan SA, Wong ND, et al. Is pulse pressure useful in predicting risk for coronary heart disease? The Framingham heart study. Circulation. 1999; 100:354 –360.
11. Chae CU, Glynn RJ, et al. Increased pulse pressure and risk of heart failure in the elderly. JAMA. 1999; 281:634–639.
12. Report of the Expert Committee on the diagnosis and classification of diabetes mellitus. Diabetes Care 1999; 22 (Suppl 1): 5.
13. The sixth report of the Joint National Committee on presentation, evaluation, and treatment of high blood pressure. Arch Intern Med 1997; 157:2413.
14. Connon PC. Bettler A, et al. Key Data Elemntsand Definitions for Measuring the Clinical Management and Outcomes of Patients with Acute Coronary Syndromes. A report of the American College of Cardiology Task Force on Clinical Data Standards (Acute Coronary Syndromes Writing Committee). J Am Coll Cardiol 2001; 38:2114.
15. Taylor AJ: Atherosclerosis imaging to detect and monitor cardiovascular risk. Am J Cardiol 2002; 90 (Suppl):8L-llL.
31

24
16. Stella A, Gessaroli M, Cifiello BI, Salardi S, Reggiani, Cacciari E, D'Addato M. Elastic modulus in young diabetic patients (ultrasound measurements of pulse wave velocity). Angiology. 1984; 35:729-734.
17. Airaksinen KE, Salmela PI, Linnaluoto MK, Ikaheimo MJ, Ahola K, Ryhanen LJ. Diminished arterial elasticity in diabetes: association with fluorescent advanced glycosylation end products in collagen: Cardiovasc Res. 1993, 27:942-945.
18. Toto-Moukouo JJ, Achimastos A, Asmar RG, Hugues CJ, Safar ME. Pulse wave velocity in patients with obesity and hypertension. Am Heart J. 1986, 112:136-140.
19. Taquet A, Bonithon-Kopp C, Simon A, Levenson J, Scarabin, Malmejac A, Ducimetiere P, Guize L. Relations of cardiovascular risk factors to aortic pulse wave in asymptomatic middle-aged women. Epidemiol. 1993; 9:298-306.
20. Amar J, Chamontin B, Pelissier M, Garelli I, Salvador M. Influence of glucose metabolism on nyctohemeral blood pressure variability in hypertensives with an elevated waist-hip ratio: a link with arterial distensibility. Am J Hypertens. 1995; 8(pt 1):426-428.
21. Salomaa V, Riley W, Kark JD, Nardo C, Folsom AR. Non-insulin-dependent diabetes mellitus and fasting glucose and insulin concentrations are associated with arterial stiffness indexes: the Atherosclerosis Risk in Communities Study. Circulation. 1995, 91:1432-1443.
22. Kupari M, Hekali P, Keto P, Poutanen VP, Tikkanen MJ, Standerstkjold-Nordenstam CG. Relation of aortic stiffness to factors modifying the risk of atherosclerosis in healthy people. Arterioscler Thromb. 1994; 14: 386-394.
23. Mackey R. Correlates of aortic stiffness by carotid-femoral pulse wave velocity in a subgroup of the cardiovascular health study. Circulation. 1998; 97:828. Abstract 85; 71:202-210.
24. Malmberg K, Yusuf S, Gerstein HC, Brown J, Zhao P, Hunt D, Piegas L, Calvin J, Keltai M, Budaj A: Impact of diabetes on long-term prognosis in patients with unstable angina and non-Q-wave myocardial infarction: results of the OASIS (Organization of Assess Strategies for Ischemic Syndromes) Registry.Circulation2000; 102:1014-1019.
25. Ohnishi H, Saitoh S,Takagi S, Ohata J, Isobe T, Kikuchi Y ,Takeuchi H, Simamoto K: Pulse wave velocity as an indicator of atherosclerosis in impaired fasting glucose .Diabetes care 2003; 26:437-440.
26. Taniwaki H, Kawagishi T, Emoto M, Shoji T, Kanda H, Maekawa K, Nishizawa Y, Morii H: correlation between intima–media thickness of the carotid artery and aortic pulse wave velocity in patients with type 2 diabetes. Diabetes care1999; 22:1851-1857.
27. Poirier P, Bogaty P, Garneau C, Marois L, Dumesnil J: Diastolic dysfunction in normotensive men with well-controlled Type 2 Diabetes. Diabetes Care 2001; 24(1):5-10.
28. Cruickshank K, Anderson SG, WrightJS, DunnG, Gosling RG: Aortic pulse wave velocity and its relationship to mortality in diabetes and glucose intolerance. Circulation 2002; 106:2085.
29. James D, Elisabete S, Christopher J, Rajkumar C: The aging of elastic and muscular arteries. Diabetes care 2003 26:2133-2138.
30. Wright JS: Doppler ultrasound measurement of aortic compliance in diabetic patients and community controls .Ph thesis. London, University of London1991.
32
33
Evaluation of the Sex Difference in Vascular Reactivity of the
Aortic Rings in Rats By
M. Hani Ayobe; Afaf. A. Mahmoud; Faten, M. A. Diab; Magda. H. M. Youssef and Mona, A. Ahmed*
Physiology Department, Faculty of Medicine, Ain Shams University.
ABSTRACT Several investigators have observed gender differences in vascular reactivity. However, it
is not settled, whether, the differences in the resistance vasculature could be related to the gender influence on endothelial nitric oxide (NO) biosynthesis. This work was planned to evaluate sex rule on aortic ring vascular reactivity and its possible underlying mechanism(s).
Aortic ring isolated from male, female and ovariectomized rat groups were suspended separately in an organ tissue bath containing 20 ml modified Kreb’s solution and studied for their responses to pressor agents phenylephrine (PE, 1μmol) & angiotensin II (Ang II, 5x10⁻³ μg) and to the depressor agent acetylcholine (10μmol). Moreover, aortic tissue nitrates level, plasma estradiol and testosterone levels were assayed.
Results of the present study demonstrated that the contractile vascular responses to PE and Ang II, either in absolute values or upon correction per mg wet aortic tissue, were more pronounced in aortic rings from male rats. Moreover, by calculating the PE & Ang II contractile responses as a percentage of the maximal contractile response induced by KCl, the significant difference between male and female were abolished indicating that the sex difference in the contractile response to PE & Ang II, is a general non specific difference to any vasoconstrictor agents.
Regarding acetylcholine-induced relaxation, it was significantly higher, whether its absolute or corrected values per mg aortic tissues, in aortic rings isolated from female rats than from both male or ovariectomized groups. Moreover, when acetylcholine-induced relaxation is calculated as percentage change from KCl-induced tension, it was still significantly higher in female rats denoting that acetylcholine acts via a specific mechanism that is more pronounced in female vascular tissues.
The aortic tissue nitrate level was significantly higher in female rats compared to either male or ovariectomized rats. Also, nitrate levels showed positive significant correlation with acetylcholine-induced relaxation and negative significant one with PE-induced contraction. Furthermore, a significant positive correlation was established between the nitrate level and estradiol.
In conclusion, the results of this study illustrate that aortic rings isolated from female rats have lower vascular reactivity with less sensitivity to the contractile factors and more pronounced relaxant response that could be ascribed to estradiol-induced NO bioavailability. INTRODUCTION There is a lower prevalence of hypertension and atherosclerosis among premenopausal women than men of similar age; however, the prevalence of cardiovascular diseases in women increases with age dramatically. Consequently, aging is associated with a different spectrum of cardiac and vascular maladaptations in
women compared with men (1). The endothelium has been shown to
modulate smooth muscle responses of intact blood vessels; and under pathophysiological conditions, alterations in such endothelial function participate in the pathogenesis of vascular diseases like atherosclerosis and hypertension (2). Endothelium-derived nitric

34
oxide (NO) plays an important role in maintaining homeostasis of the cardiovascular system. Nitric oxide has been found to be a principal factor involved in the anti-atherosclerotic properties of the endothelium. In addition, a relative deficiency in local NO availability could be a final common pathway that accelerates atherogenesis in humans (3).
Several investigators have observed gender differences in blood vessels reactivity (4-6). However, it is not settled, whether the differences in resistance vasculature could be related to gender influence on endothelial NO biosynthesis.
This work was performed to study the sex differences between male and female rats as regards their aortic ring vascular reactivity. Age matched ovariectomized rats were, also, studied in order to assess the possible protective role played by estrogen to clarify the mechanism(s) underlying such differences. MATERIAL AND METHODS Animals:
This work was performed on 52 Wistar adult albino rats of (4-6 months) of both sexes, purchased from Research Institute of Ophthalmology, Giza and maintained in the Physiology Department Animal House under standard conditions of boarding. Experimental Protocol:
Rats of this study were allocated in three groups: 1-Adult male rat group (n=16). 2-Adult female rat group (n=16). 3-ovariectomized Adult female rat group (n=20): rats of this group were subjected to bilateral ovariectomy (7) and studied after 2 months. Experimental Procedures:
On the day of sacrifice, overnight fasted rats were weighed and injected intra-peritoneally (I.P.) with 1000 I.U. heparin sodium (Nile Co.). Half an hour later, the rats were anaesthetized I.P. with pentobarbital sodium 40mg/kg body weight.
When the rat passed into anesthesia,
a midline abdominal incision was done, aorta was exposed and cannulated to get a blood sample for later determination of plasma sex hormonal levels estradiol or testosterone. Thereafter, the thoracic cage was opened and the thoracic aorta was dissected, excised and rapidly placed in modified Kreb’s solution containing 119mmol/L NaCl, 4.7mmol/L KCl, 1.18mmol/L KH2PO4, 1.17mmol/L MgSO4. 7H2O, 24.9 mmol/L NaHCO3, 0.023mmol/L Na2 EDTA, 1.6mmol/L CaCl2 and 11.1mmol/L glucose (8). 1- Preparation of isolated aortic rings:
The thoracic aorta was cleaned from adhering connective and fatty tissues and cut into rings, each 2-4 mm in length.
Rings of aorta were studied separately in an organ tissue bath containing 20 ml warmed (370C) modified Kreb’s solution that continually bubbled with 95% oxygen & 5% carbon dioxide. The aortic ring was suspended horizontally between two stainless steel hooks, one of them was fixed in the bath and the other connected to isometric force displacement transducer (UGO Basile, Comerio-Italy) for recording of isometric contractions.
2- Studying aortic rings reactivity: Aortic rings were studied for their
responses to pressor agents (phenylephrine, 1µM and angiotensin II, 5x10⁻³ µg) and depressor agent (acetylcholine, 10µM).
3- Measurement of tension developed by aortic rings: Aortic rings were equilibrated for 60 minutes under a resting tension of 1g to allow development of a stable basal tone. In the last 30 min. of equilibration, washing of rings with 80mM KCl was repeated every 10 minutes, three times until responses were stable. Rings were then allowed to contract in response to 20mM KCl until reproducible evoked contractile response was produced (8). The contractile response of aortic rings to 1µM phenylephrine (Sigma) was recorded 15 minutes later. After the plateau of contraction was reached, the relaxant response to 10µM acetylcholine (Sigma)

35
was obtained on top of phenylephrine contraction. Also, the contractile response to 5x10⁻³ µg angiotensin II (Sigma) was tested in separate aortic rings. Recording was performed on a four-channel oscillograph (UGO Basile Quartel 9400 four-channel recorder) with the upstroke representing the contraction and the downstroke representing the relaxation. The speed of recording was 1mm/min and the sensitivity was 6.5.
4- Calculation of results: The amplitude of the recorded
contraction and relaxation was measured in millimeters and the equivalent force of contraction and relaxation in gram (g) was obtained from calibration curve.
Calibration curve was performed at sensitivity 6.5 by adding different weights ranging from 0.079-0.968 grams to the thread of the transducer and the amplitude of the response in millimeter was recorded and calibration curve was constructed. The phenylephrine and the angiotensin-II induced contractions as well as the relaxant responses to acetylcholine were calculated as absolute values in grams (g) and as percentage (%) of KCl-induced tension. The weight of the aortic rings was measured in 5-Digit-Metler balance (AE 163) to normalize changes in tension and relaxation for the weight of the ring (g tension or g relaxation/mg weight of tissue). Rings were frozen at –800C for subsequent estimation of tissue nitrate level, the endogenous end product of nitric oxide metabolism.
5- Determination of nitrate level in aortic tissues:
Aortic rings were subjected firstly to subcellular fractionation (9) and nitrate level in the supernatant was next estimated according to Boris and Boris (10).
6- Estimation of plasma estradiol and testosterone levels:
Assessment of plasma level of estradiol in adult and ovariectomized female rats as well as the plasma testosterone in adult male rats was performed by radio-immunoassay in the Hormone Assay
Laboratory in Endocrinology Department in Ain Shams University Hospital, using kits supplied by Immunotech A Beckman Coulter Company (France).
Statistical Analysis:
For differences between means of 2 groups, the analysis was done using Student’s “t” test for unpaired data.
For differences between means of multiple groups, the analysis was determined by 1-way ANOVA (analysis of variance). Further analysis was made by LSD (least significant difference) multiple-range test to detect inter-groupal significance.
Correlation coefficients were calculated by linear regression analysis using the least square method.
All statistical studies, were performed by using SPSS (statistical program for social science) package version 8.0 and a probability of P<0.05 was considered significant. RESULTS
The results of the present work are displayed in tables (1-6) & figures (1-4) and plate (1).
Aortic ring tension developed in response to administration of KCl (20 mM) was significantly lower in adult female rats compared to male ones or to the ovariectomized rats (P<0.002). The same pattern and significance were obtained when KCl-induced tension was corrected per mg wet aortic ring weight (P<0.005) [table 1].
Aortic ring responses to
phenylephrine (PE, 1μM): Phenylephrine-induced tension was significantly lower in aortic rings from female rats than that developed in male rats and in ovariectomized rats (P<0.005). Also, correction of phenylephrine-induced tension per mg wet aortic ring weight, kept the differences the same i.e. higher in male than female rats and in ovariectomized than in female group (p<0.01) [table 2 & figure 1].
However, when PE-induced tension was calculated as % from KCl-induced tension the differences among the 3 groups

36
became insignificant [table 2]. Aortic ring responses to angiotensin II
(5 x 10⁻³ μg): Angiotensin II-induced tension showed no differences between the 3 models as absolute values as well as when corrected for KCl-induced tension.
However, when Ang II-induced tension was corrected per mg wet aortic tissue weight, it became significantly less in female adult rats than ovariectomized and male rats (P<0.02) [table 2 & figure 2].
Aortic ring responses to acetylcholine
(Ach, 10μM): As regards acetylcholine-induced relaxation, whether its absolute value or the corrected value per mg aortic ring, it was significantly higher in aortic rings from female rats than from their male counterparts and from ovariectomized rat group (P<0.001). Besides, male response was also significantly lower than ovariectomized rats (P<0.001) [table 3 & figure 3].
Ach-induced relaxation as % from KCl-induced tension showed a significant increase in normal females compared to both male and ovariectomized groups (P <0.001) [table 3].
Regarding aortic ring tissue nitrate level, as shown in table (4) aortic ring nitrate concentration was significantly higher in adult female than male rats. Ovariectomy produced a significant decline in nitrate concentration compared to age-matched female and even male rats (figure 4).
In respect to the sex hormones, table (5) illustrates that plasma estradiol was significantly lower in ovariectomized group compared to young (normal adult) female group.
By studying correlation coefficients between aortic ring nitrate concentrations and the ring vascular contractile responses to PE as well as its vascular relaxant responses to acetylcholine, a significant positive correlation was observed between nitrate and acetylcholine relaxation (r= 0.552, P<0.001) and a significant negative one (r= -0.386, P<0.05) with PE contraction. Moreover, a significant positive correlation was detected between aortic ring nitrate concentrations and female plasma estradiol levels (r=0.671, P <0.001) [table 6].
Table (1): Means ± SEM of contractions of aortic rings to KCl (20mM) in absolute terms (g) and relative to aortic ring weights (g/mg) in adults (4-6 months) male (M), female (F) and ovariectomized (OVX) rats.
Contractions to KCl (g) Contractions to KCl/ring weight (g/mg)
M F OVX M F OVX Mean ± SEM 0.382
±0.04 (16)
0.206 a ±0.02 (16)
0.340 b ±0.03 (20)
0.114 ±0.01 (16)
0.066 a ±0.01 (16)
0.106 b
±0.01 (20)
P <0.002 <0.005 F vs. M OVX vs. F OVX vs. M
53.9 % 165 % 89 %
57.9 % 160.6 %
93 % In parenthesis is the number of observations. P: significance by 1-way ANOVA among the three groups (M, F, OVX) a: significance by LSD at P<0.05 from male group. b: significance by LSD at P<0.05 from female group.
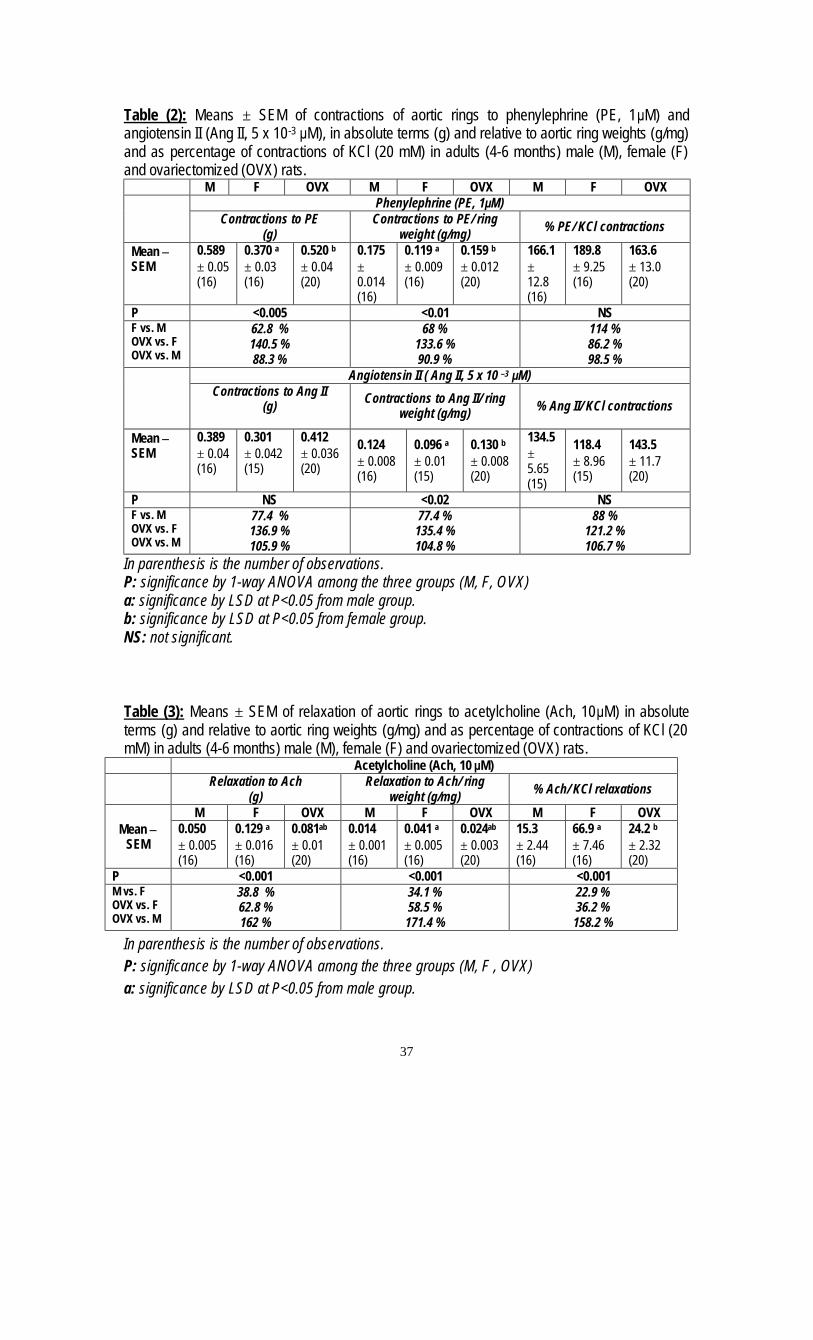
37
Table (2): Means ± SEM of contractions of aortic rings to phenylephrine (PE, 1μM) and angiotensin II (Ang II, 5 x 10⁻³ μM), in absolute terms (g) and relative to aortic ring weights (g/mg) and as percentage of contractions of KCl (20 mM) in adults (4-6 months) male (M), female (F) and ovariectomized (OVX) rats.
M F OVX M F OVX M F OVX Phenylephrine (PE, 1μM)
Contractions to PE (g)
Contractions to PE/ ring weight (g/mg) % PE/ KCl contractions
Mean ± SEM
0.589 ± 0.05 (16)
0.370 a
± 0.03 (16)
0.520 b ± 0.04 (20)
0.175 ± 0.014 (16)
0.119 a ± 0.009 (16)
0.159 b ± 0.012 (20)
166.1 ± 12.8 (16)
189.8 ± 9.25 (16)
163.6 ± 13.0 (20)
P <0.005 <0.01 NS F vs. M OVX vs. F OVX vs. M
62.8 % 140.5 % 88.3 %
68 % 133.6 % 90.9 %
114 % 86.2 % 98.5 %
Angiotensin II ( Ang II, 5 x 10 –3 μM)
Contractions to Ang II (g) Contractions to Ang II/ ring
weight (g/mg) % Ang II/ KCl contractions
Mean ± SEM
0.389 ± 0.04 (16)
0.301
± 0.042 (15)
0.412 ± 0.036 (20)
0.124 ± 0.008 (16)
0.096 a ± 0.01 (15)
0.130 b ± 0.008 (20)
134.5 ± 5.65 (15)
118.4 ± 8.96 (15)
143.5 ± 11.7 (20)
P NS <0.02 NS F vs. M OVX vs. F OVX vs. M
77.4 % 136.9 % 105.9 %
77.4 % 135.4 % 104.8 %
88 % 121.2 % 106.7 %
In parenthesis is the number of observations. P: significance by 1-way ANOVA among the three groups (M, F, OVX) a: significance by LSD at P<0.05 from male group. b: significance by LSD at P<0.05 from female group. NS: not significant. Table (3): Means ± SEM of relaxation of aortic rings to acetylcholine (Ach, 10μM) in absolute terms (g) and relative to aortic ring weights (g/mg) and as percentage of contractions of KCl (20 mM) in adults (4-6 months) male (M), female (F) and ovariectomized (OVX) rats.
Acetylcholine (Ach, 10 μM)
Relaxation to Ach (g)
Relaxation to Ach/ ring weight (g/mg) % Ach/ KCl relaxations
M F OVX M F OVX M F OVX Mean ±
SEM 0.050 ± 0.005 (16)
0.129 a
± 0.016 (16)
0.081ab ± 0.01 (20)
0.014 ± 0.001 (16)
0.041 a ± 0.005 (16)
0.024ab ± 0.003 (20)
15.3 ± 2.44 (16)
66.9 a ± 7.46 (16)
24.2 b ± 2.32 (20)
P <0.001 <0.001 <0.001 M vs. F OVX vs. F OVX vs. M
38.8 % 62.8 % 162 %
34.1 % 58.5 % 171.4 %
22.9 % 36.2 % 158.2 %
In parenthesis is the number of observations. P: significance by 1-way ANOVA among the three groups (M, F , OVX) a: significance by LSD at P<0.05 from male group.

38
b: significance by LSD at P<0.05 from female group.
Table (4): Means ± SEM of nitrate concentration (μ mol/ mg) in aortic rings from adult (4-6 months) male (M), female (F) and ovariectomized (OVX) rats.
Nitrate concentration (μ mol/mg) M F OVX
Mean ± SEM 0.254 ± 0.060
(10)
0.417 a ±0.036
(14)
0.138 ab ±0.016
(14) P <0.001 M vs. F OVX vs. F OVX vs. M
60.9 % 33.1 % 54.3 %
In parenthesis is the number of observations. P: significance by 1-way ANOVA among the three groups (M, F, OVX). a: significance by LSD at P<0.05 from male group. b: significance by LSD at P<0.05 from female group. Table (5): Means ± SEM of plasma estrdiol values (pg/ml) in normal adult (4-6 months) female (F) and ovariectomized (OVX) rats as well as the plasma testosterone level (ng/ml) in normal adult male (M) rats.
Plasma estradiol (pg/ml) Plasma testosterone (ng/ml)
F OVX M Mean ± SEM 34.28 ± 2.57
(14) 16.78 ± 3.81
(18) 1.83 ± 0.58
(10) P <0.01
In parenthesis is the number of observations. P: significance of difference between adult female and ovariectomized rats calculated by student’s “t” test for unpaired data. Table (6): Correlation coefficients between nitrate concentration (μ mol/ mg) of the aortic rings and the acetylcholine induced relaxation/ ring weight (g/mg), phenylephrine induced contraction/ ring weight (g/mg), female plasma estradiol (pg/ml) as well as male plasma testosterone (ng/ml) in the studied rats.
r P Nitrate vs. acetylcholine relaxation (n=38)
+0.552 < 0.001
Nitrate vs. phenylephrine contraction (n=38)
-0.386 < 0.05
Nitrate vs. plasma estradiol (n=27)
+0.671 < 0.001
Nitrate vs. plasma testosterone (n=10)
-0.531 NS
In parenthesis is the number of observations. NS: not significant.

39
a: significance by LSD at P < 0.05 from male (M) group. b: significance by LSD at P < 0.05 from female (F) group. Plate I:
A. Record of contractions to KCl (20 mM) and phenylephrine (PE, 1μM) and relaxation to acetylcholine (Ach, 10 μM) in adult male, female and ovariectomized rats.

40
B. Record of contractions to KCl (20 mM) and angiotensin II (Ang II, 5 X 10 –3 μM) in adult male, female and ovariectomized rats.
DISCUSSION
Results of the present study demonstrated that the contractile vascular responses were more pronounced in aortic rings from male rats, while the relaxant vascular responses were more marked in aortic rings from female rats. Such sex differences in vascular responses were
eliminated by ovariectomy of female rats. In response to phenylephrine, the
vasoconstrictor (α) adreno-receptor agonist, the contraction of aortic rings from female rats was only 62.8% that of the male with a rise to 88.3% in ovariectomized rats. In response to angiotensin II, aortic rings contraction in female rats was 77.4% that

41
from male rings, rising to 105.9% with ovariectomy. In contrast, acetylcholine (Ach)-induced relaxation demonstrated that aortic rings from female rats are more sensitive to the vasodilator actions of Ach. The relaxant responses of male aortic rings were only 38.8% that of female rings, while the response of aortic rings from ovariectomized rats was 62.8% that of intact female rat rings.
In order to validate our data, we proceeded to investigate whether the differences in the number and weight of contractile units and/or differences in the maximal responses are responsible for such differences in contractile and relaxant responses of aortic rings in both sexes. Upon correction per mg wet aortic ring weight, the significant sex differences in response to PE and Ach were maintained and sex differences in contractions to Ang II in the form of reduction in the contractile responses in female rats compared to male and ovariectomized ones, were revealed. This indicates that the sex differences were not due to differences in the number and weight of contractile units in aortic rings of different sexes. Thus, each contractile unit in the male rat aortic rings showed higher responses to vasoconstrictors PE and Ang-II and lower responses to vasodilator Ach than the female rat aortic rings, and ovariectomy reversed the female pattern towards the male side.
In order to elucidate any differences in maximal response, the contractile responses to a non-specific reference vasoconstrictor, KCl (20mM), were compared in aortic rings from male, female and ovariectomized rats. KCl-induced contraction is known to be due to depolarization and voltage-dependent activation of calcium channels (11). The pattern of KCl-induced contractions observed in the 3 groups was similar to that obtained with other vasoconstrictors (PE and Ang-II), aortic rings from female rats showing 53.9% that of contraction of male rings with a rise to 89% in ovariectomized rats. These data are clear proof of the significant sex differences in contractile maximal responses; being
greater in aortic rings from male rats, smaller in female rats and in between in ovariectomized rats.
When contractions to PE and Ang-II were calculated as percentages of that induced by KCl, the significant differences between male and female rats or between intact female and ovariectomized rats were abolished. This indicates that sex differences in PE and Ang II responses are not due to true specific sex difference in the agonist-receptor responsiveness of aortic rings to either PE or Ang II, but can be attributed to differences in maximal response i.e. a general non-specific difference to any vasoconstrictor.
On the other hand, when Ach-relaxing response was calculated as a percentage of KCl-induced contraction, the significant differences between male and female rats and that between intact female and ovariectomized rats persisted. This indicates that Ach acts via a specific mechanism and that its relaxant effect is more in female vascular tissues than in male or ovariectomized rats.
Therefore, the results of the present work revealed that the aortic rings from intact female rats were less sensitive, and actually more resistant to all vasoconstrictor agents studied: KCl (direct vasoconstrictor, non receptor mediated), PE (α-receptor mediated agonist) and Ang-II (AT1-receptor mediated) than the aortic rings from male or ovariectomized rats. The gender difference in the enhanced non-specific generalized contractile responses to the 3 vasoconstrictor agents studied (KCl, PE and Ang-II) in the vascular tissues in male or ovariectomized rats than those in intact female rats, could be related to differences in the net resultant effect of vasoconstrictor and vasodilator substances released by the vascular endothelium.
Endothelial cells synthesize and release several vasodilators and vasoconstrictors, which inhibit and stimulate the contraction & proliferation of the underlying vascular smooth muscle,

42
respectively. Vasodilators include nitric oxide (NO), prostacyclin (PGI2) and endothelium-derived hyperpolarizing factor (EDHF). Vasoconstrictors include endothelin, superoxide anion (O2-), thromboxan A2 (TxA2) and prostaglandin H2 (PGH2) (12). Amongst such multitude of vasoconstrictor and vasodilator substances, it seems that nitric oxide (NO) plays the most important and significant role in modulation of the vascular responses to vasoactive substances.
Consequently, the gender differences in vascular reactivity could be attributed, firstly, to the differences in basal and stimulated release of NO and/or secondly, to the difference in the release of other contractile factors from the endothelium.
In agreement with the first approach, when measuring the tissue nitrate level, there was a higher basal nitrate release from aortic rings of female rats than those from either male or ovariectomized rats (being 60.9 % and 33.1% respectively compared to that in intact female rats). Therefore, these results suggest that vascular tissues from female rats have higher capability to release the smooth muscle relaxant NO than the vascular tissues from male or ovariectomized animals. These finding are supported by pervious studies on animal (4) and in human (13).
Moreover, in this study, female rats showed a more pronounced basal as well as stimulated release of NO than either male or ovariectomized rats. This can account for the more resistance and therefore, less sensitivity of female vascular tissue to vasoconstrictor agents such as PE, Ang-II or KCl than male or ovariectomized rat vascular tissues. In support of our conclusion, NO has been shown to be a potent vasodilator which suppresses vasoconstrictor responses to various vasoactive substances (14).
In this work, the significant positive correlation established between aortic tissue nitrate level and Ach-induced relaxation (r = + 0.552, P<0.001) whereas the inverse significant correlation established between
vascular responses to PE and tissue nitrate level (r = - 0.386, P<0.05) provides further support of our conclusion. Considerable evidence suggests that NO synthesis may be regulated by sex hormones. In our study, significant positive correlation was established between tissue nitrate and plasma estradiol (r = +0.671, P<0.001) whereas no significant correlation could be established between tissue nitrate and plasma testosterone (r = -0.531, NS).
Several mechanisms whereby estrogen could stimulate NO-mediated endothelium-derived relaxation have been proposed. Estrogen could provoke the activity of NO synthase via transcriptional stimulation of NOSIII gene expression (4). Also, estrogen causes non-genomic activation of second messenger (Ca++, cAMP) (15) and augments NO release (16) as well as it could attenuate the degradation of NO by oxygen free radicals (17).
In agreement with the second approach that attributes gender differences in vascular reactivity to the differences in the release of other contractile factors from the endothelium; the plasma endothelin levels and the release of TxA2 and PGH2 from the endothelium were found to be more pronounced in male than female counterparts (18,19). Also, estrogen in female could reduce the synthesis of endothelin and increase the formation of the vasodilator prostacyclin by inducing the expression of prostacyclin synthase and cyclooxygenase (20).
In conclusion, the results of this study illustrate that aortic ring isolated from female rats have lower vascular reactivity with less sensitivity to the contractile factors and more pronounced relaxant response that could be ascribed to estradiol-induced NO bio-availability. REFERENCES 1. Rich-Edwards, J.W., Manson, J.A.E. and Hennebens, C.H. (1995): The primary prevention of coronary heart disease in women. N. Engl. J. Med.; 332: 1758-1766. 2. Puddu, P., Puddu, G.M., Zaca, F.

43
and Muscari, A. (2000): Endothelial dysfunction in hypertension. Acta Cardiol.; 55(4): 221-232. 3. Ross, R. (1993): The pathogenesis of atherosclerosis: a perspective for the 1990s. Nature; 362: 801-809. 4. Hayashi, T., Fukuto, J.M. and Ignarro, L.J. (1992): Basal release of nitric oxide from aortic rings is greater in female rabbits then in male rabbits: implications for atherosclerosis. Proc Natl. Acad. Sci. U.S.A.; 89: 11259-11263 5. Kauser, K. and Rubanyi, G.M. (1994): Gender difference in bioassayable endothelium-derived nitric oxide release from isolated rat aortae. Am. J. physiol.; 267:H2311-H2317. 6. Wellman, G.C., Bonev, A.D. and Nelson, M.T. (1996): Gender differences in coronary artery diameter involves esrtrogen, nitric oxide and Ca2+ dependent K+ channels. Cir. Res.; 79: 1024-1030. 7. Waynforth, H.B. (1980): Specific surgical operations. In experimental and surgical technique in the rat. Ch. 4, p. 124-208. Waynforth, H.B. (1980): Waynforth, H.B. (ed.). Academic Press Inc. (London). 8. Rahimian, R., Laher, I. and Dube, G. (1997): Estrogen and selective estrogen receptor modulator LY117018 enhance release of nitric oxide in rat aorta. J. Pharmacol. Exp. Ther.; 283: 116-122. 9. Eissa, S., Khalifa, A. and El-Ahmady, O. (1990): Tumor markers in malignant and benign breast tissue CA15.3, CEA and ferritin in cytosol and membrane enriched fractions. J. Tumor Marker Oncol.; 5: 220. 10. Bories, P.N. and Bories, C. (1995): Nitrate determination in biological fluids by an enzymatic one-step assay with nitrate reductase. Clin. Chem.; 41/6: 904-907 11. Wali, F.A., Greenidge, E. and Tugwell, A.C. (1988): Effect of verapamil on the contractions produced by high
potassium and by noradrenaline in human isolated saphenous vein. Acta Physiol. Hung.; 72(1): 115-21. 12. Shimokawa, H. (1999): Endothelial dysfunction: a Novel Therapeutic Target. Primary endothelial dysfunction: Atherosclerosis. J. Mol. Cell Cardio.; 31: 23-37. 13. Forte, P., Kneale, B.J. and Milne, E. (1998): Evidence for a difference in nitric oxide biosynthesis between healthy women and men. Hypertension; 32(4): 730-734. 14. Palmer, R.H.J., Ferrige, A.G. and Moncada, S. (1987): Nitric oxide release accounts for the biological activity of endothelium derived relaxing factor. Nature; 327: 524-526. 15. Kauser, K. and Rubanyi, G.M. (1997): Potentially cellular signaling mechanisms mediating upregulation of endothelial nitric oxide production by estrogen. J. Vasc. Res.; 34: 229-36. 16. Rusko, J., Li, L. and Van Breeman, C. (1995): 17-B-estradiol stimulation of endothelial K+ channels. Biochem. Biophys. Res. Commun.; 21: 367-372. 17. Keaney, J.F., Gaziano, J.M. and Xu, A. (1994): 17-Beta-estradiol preserves endothelial vasodilator function and limits low-density lipoprotein oxidation in hypercholesterolemic swine. Circulation; 89: 2251-9. 18. Polderman, K.H., Stehouwer, C.D.A. and VanKamp, G.J. and Dekker, G.A.D. (1993): Influence of sex hormones on plasma endothelin levels. Ann. Int. Med.; 118: 429-432. 19. Kahonen, M., Talvanen, J.P., Sallinen, K. and Wu, X. (1998): Influence of gender on control of arterial hypertension in experimental hypertension. Am. J. Physio.; 275: H15-H22. 20. Dubey, R.K., Oparil, S. Imthurn, B. (2002): Sex hormones and hypertension. Cardiovasc. Res.; 53: 688-708.
21.
Insulin Resistance and Transforming growth factor-beta Gene Expression in
Male Albino Rats Mary A. Youssef *, Abdel-Moneim I. Ahmed*,Sanaa S. Abdel-Shaffy** & Nashwa El-Tablawy* .
* Physiology department / Cairo University. ** Clinical and chemical pathology department/ Bani Seuif University.
Abstract:
An elevated blood pressure occurs twice as commonly in the insulin resistant state compared to the insulin sensitive state. Both increased insulin concentrations and decreased insulin sensitivity have been identified as independent risk factors for cardiovascular diseases. Also, diabetes induces abnormalities in the expression of various cytokines and vasoactive peptides such as transforming growth factor-beta (TGF-beta). The fructose rat model provides an ideal means for investigating the causes of a simulated syndrome X in animals. In the present study, we investigated the link between insulin resistance and hypertension using the fructose rat model and we studied the expression of TGF-β1 gene in insulin resistance to demonstrate whether it has a possible role in induction of hypertension in such condition or not. An overexpression of TGF-β1 gene was detected by real time polymerase chain reaction in insulin resistant rats but it was not causally related to hypertension in such condition, otherwise hypertension was related to both hyperinsulinemia and hyperglycemia.
Introduction: An elevated blood pressure occurs
twice as commonly in the insulin resistant state compared to the insulin sensitive state (1). On the other hand, approximately 50% of persons with hypertension can be considered to have insulin resistance and hyperinsulinemia (2). However insulin resistance is not present in patients with secondary forms of hypertension (3). Therefore, multiple studies over the past two decades have tried to elucidate the mechanisms of this association.
Early studies suggested that hypertension in diabetes was associated with volume expansion, and insulin is known to enhance proximal tubular sodium reabsorption (4). There is also evidence that insulin stimulates the sympathetic nervous system (5). Insulin infusion for up to 7 days in rats was reported to produce a sustained increase in arterial pressure (6). Also both increased insulin concentrations and decreased insulin sensitivity have been identified as independent risk factors for cardiovascular diseases (7).
Moreover, Hyperglycemia, developed later in type 2 diabetes, have
many adverse effects on vascular tissue. Hyperglycemia can produce these effects through many mechanisms including : the non-enzymatic glycation of both extracellular and intracellular proteins; the activation of protein kinase C; the induction of oxidative stress.
It is reported that diabetes induces abnormalities in the expression of various cytokines and vasoactive peptides such as TGF-beta, TNF-alpha, angiotensin II and endothelin-I. Expression of TGF-β1 is upregulated in vitro, in vascular cells exposed to raised glucose concentrations, and in vivo in diabetic vascular tissues (7). Some studies implicated the over expression of TGF-β1 gene in insulin resistance as a risk factor for the development of hypertension (8,9). On the other hand, others reported a beneficial role of TGF-β1 (10). Aim of work : Our aims were; 1. To investigate the link between insulin resistance and hypertension. 2. To study the expression of TGF-β1 in type 2 diabetes.
44
Materials and Methods: A total of 42 male Sprague-Dawley
rats were included in this study weighing 175-250 g. As previous studies demonstrated that estradiol treatment was associated with reduction in TGF-β gene expression (11), this study was applied on male rats only.
The animals were housed in wire mesh cages at room temperature, with normal light/dark cycle. The rats were fed the commercial rat chow diet and had free access to water. These rats were divided into the following groups: Group (1): Control male albino rats (n=12) fed rats’chow diet. Group (2): Fructose-induced insulin resistant rats. This group was further subdivided into three subgroups: - Subgroup (2a), Rats fed fructose rich diet for 3 weeks (n=10). - Subgroup (2b), Rats fed fructose rich diet for 5 weeks (n=10). - Subgroup (2c), Rats fed fructose rich diet for 5 weeks and thiazolidinedione was given in the last 2 weeks as a treatment (n=10). Rosiglitazone maleate tablets (5-[4-{2-(methyl-2-pyridinylamino) ethoxy} phenyl] methyl)-2,4-thiazolidinedione were given to
the rats in a dose of 2 mg/Kg/day in the diet for 2 weeks (12).
The experiments involved in the present study were done on overnight fasted rats. Rats of group 2 were fed a high-fructose diet. The fructose content provided 60% of the diet weight (13) for 3 and 5 weeks. The blood samples were drawn (at 8-10 a.m.) in the next day through the retro-orbital route using capillary tubes. About 3cm of venous blood were obtained each time and the blood samples were divided into: 1.5 cm of whole blood were collected on EDTA vacutainers and immediately frozen and stored at -80 oC until analyzed for the expression of TGF- β1 gene (14); 1.5 cm of whole blood were collected in serum separator tubes, left to clot and centrifuged for 20 min. The serum was removed and stored at –80 for subsequent measurement of fasting glucose and insulin. Insulin concentrations were measured in previously frozen and thawed serum samples by enzymeimmunoassay using the Rat Insulin ELISA kits (DRG). The blood glucose was assayed by the method adopted by Trinder (1969) (15). The test materials for this method were supplied as kits by “Diamond Diagnostics”. Assessment of insulin resistance was done by the mean of the Homeostasis Model Assessment of insulin resistance (HOMA-IR):
)16(5.22
[mmol/L] Glucose Fasting U/ml]Insulin[ FastingIR-HOMA ×=
µ
Assessment of β cell function was done by the mean of the Homeostasis Model Assessment of β cell function (HOMA-β)
)16(3.5- ol/L]Glucose[mm Fasting
20 U/ml]Insulin[ Fasting)-(HOMAfunction cell- ofn Calculatio ×=
µββ
RT-PCR for detection of TGF- β 1 mRNA : Total RNA was extracted using QIAamp RNA extration kit (Qiagen) from the whole blood. All RNA samples were reverse transcribed simultaneously using cDNA Cycle Kit (Qiagen). cDNA synthesis was
conducted in a 20 µl reaction vol containing 1µg of RNA, 200 ng of oligo deoxynucleotide tri-phosphate, 5mM dNTP, 100mM Tris-HCL, pH 8.3, 40 mM KCL, 2.5 mM MgCl2, 4mM sodium pyrophosphate, 0.2 mM spermidine, 10 U of RNase inhibitor, 5U of Avian myeloblastosis virus (AMV) reverse
45

transcriptase, and 1 µCi of [32P]dCTP. After 60 min incubation at 42oC, 5 U of AMV reverse transcriptase were added and cDNA synthesis continued for an additional 60 min at 42oC. Samples were then heated at 95oC for 3 min and quickly chilled on ice. Phenol extraction and ethanol precipitation were performed before freezing and storing cDNA. The cDNA was diluted to 0.1 ng µl in diethyl pyrocarbonate-treated water and stored at –20oC until use. Primers sequences for rat β 2-microglobulin and TGF β 1 used were: Β2- microglobulin Sense 5’ primer- 5’ ATCTTTCTGGTGCTT-GTCTC –3’ Antisense 3’ primer – 5’ AGTGTGAGCC-AGGATGTAG –3’ TGFβ-1 Sense 5’ primer- 5’- ACCAACTACT-GCTTCAGCTC- 3’
Antisense 3’ primer-5’- TGTTGGTTGTAG-AGGGCAAG-3’, based on published sequences (17). DNA amplification was conducted using 0.5 ng of cDNA for cytokine amplification and 0.025 ng of cDNA for 2-microglobulin amplification in PCR buffer (10 mM Tris-HCl, pH 8.3, 50 mM KCl, 2mM MgCl2) supplemented with 2 mM dNTP (0.5 mM each). 15 pM each of 5’- and 3’-specific primers and 1 U of Taq DNA polymerase in a final volume of 50 l. The samples were heated at 95oC for 1 min then subjected to 30 cycles using a model 2400 Perkin-Elmer thermal cycler as follows: denaturation at 95oC for 1 min, annealing at 55oC for 1 min, and primer extension at 72oC for 1 min. The reaction was terminated by an additional 5 min incubation at 72oC, followed by 5 min at 30oC, and cooling at 4oC. PCR amplification of B2-microglobulin as control was run in parallel for each sample. The PCR products from a given set samples were analyzed for cytokine and B2-microglobulin genes on 2% agarose gel stained with ethidium bromide.
Before blood sampling, systolic blood pressure was measured by the rat tail-cuff method in all groups.
Figure 1
Expression of TGf-β in three different samples associated with the used reference gene (β2 microglobulin).
46

Statistical analysis :
Results are presented as the mean + SD of the mean. Statistical comparisons were made using Student’s “t” test for unpaired samples. Comparison of proportions in different groups was made using the Chi-Square test (X2). Results: 1. Comparison studies:
The effects of fructose-enriched diet for 3 weeks on fasting serum glucose, insulin, HOMA-IR, HOMA- β cell function and systolic blood pressure are shown in table
(1). The results show that fasting serum glucose, fasting insulin, HOMA-IR and systolic blood pressure were higher in fructose fed rats for 3 weeks versus control rats. However, there was no statistically significant difference in TGF- β 1 mRNA expression between control rats (group1) and insulin resistant rats (subgroup 2a) as shown in table (2). Table (1) : Comparison of fasting serum glucose, fasting serum insulin, HOMA-IR, HOMA- β cell function and systolic blood pressure in control group (1) and in insulin resistant rats which were fed fructose rich diet for 3 weeks (subgroup 2a)
Group (1) Subgroup (2a) Item
Mean ± S.D. Mean ± S.D “t” test P value
Glucose (mg/dl) 87.59 ± 12.49 184.72 ± 29.67 10.331 <0.001
Insulin (µU/ml) 11.41 ± 2.88 33.91 ± 14.83 4.708 <0.001
HOMA-IR 2.53 ± 0.83 15.66 ± 7.53 5.480 <0.001
HOMA- β 210.6 ± 57.62 103.81 ± 52.07 2.034 0.057
Systolic blood pressure 131.50 ± 5.18 158.8 ± 13.26 6.579 <0.001
Figure 2 Readings of systolic blood pressure in the rats using the rat tail electrosphygmomanometer.
47
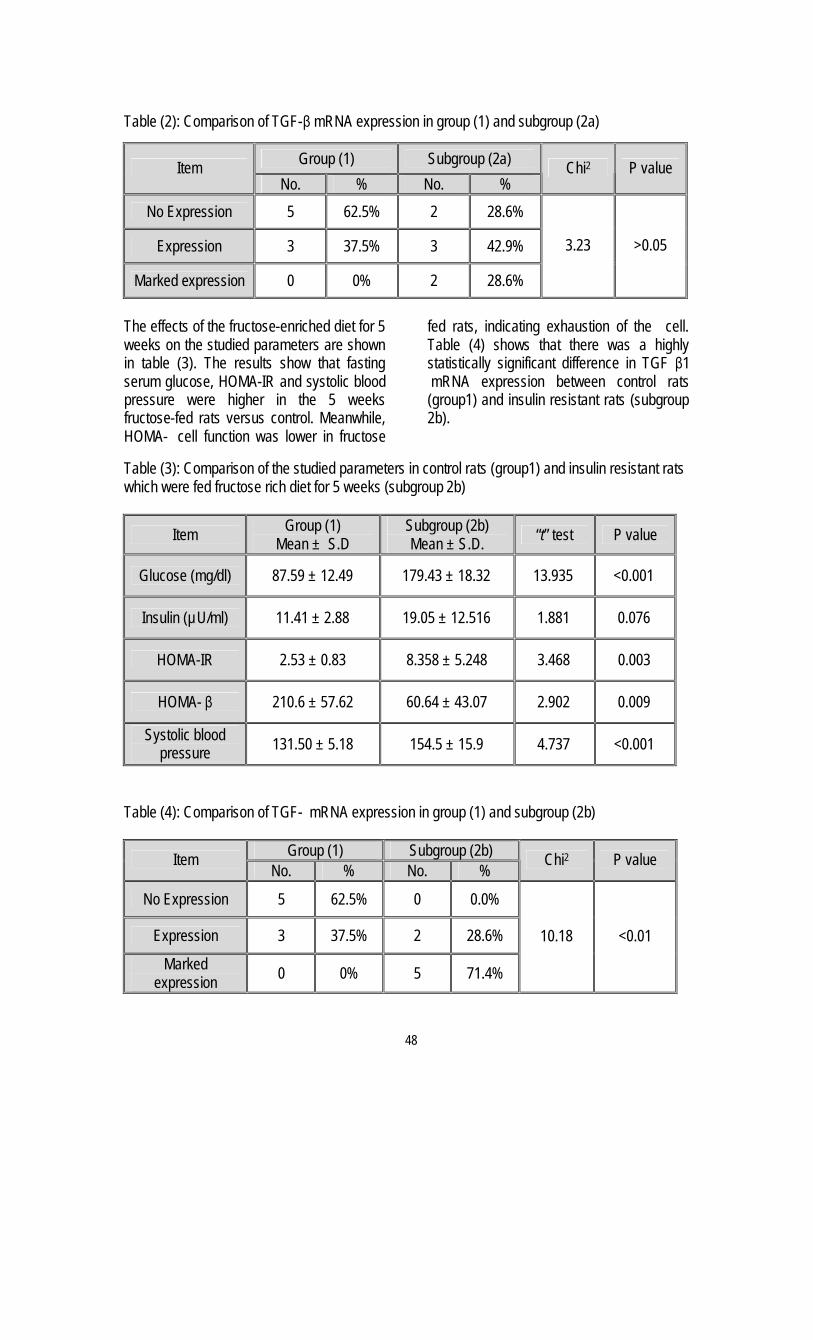
Table (2): Comparison of TGF-β mRNA expression in group (1) and subgroup (2a)
Group (1) Subgroup (2a) Item No. % No. %
Chi2 P value
No Expression 5 62.5% 2 28.6%
Expression 3 37.5% 3 42.9%
Marked expression 0 0% 2 28.6%
3.23 >0.05
The effects of the fructose-enriched diet for 5 weeks on the studied parameters are shown in table (3). The results show that fasting serum glucose, HOMA-IR and systolic blood pressure were higher in the 5 weeks fructose-fed rats versus control. Meanwhile, HOMA- cell function was lower in fructose
fed rats, indicating exhaustion of the cell. Table (4) shows that there was a highly statistically significant difference in TGF β1 mRNA expression between control rats (group1) and insulin resistant rats (subgroup 2b).
Table (3): Comparison of the studied parameters in control rats (group1) and insulin resistant rats which were fed fructose rich diet for 5 weeks (subgroup 2b)
Item Group (1) Mean ± S.D
Subgroup (2b) Mean ± S.D. “t” test P value
Glucose (mg/dl) 87.59 ± 12.49 179.43 ± 18.32 13.935 <0.001
Insulin (µU/ml) 11.41 ± 2.88 19.05 ± 12.516 1.881 0.076
HOMA-IR 2.53 ± 0.83 8.358 ± 5.248 3.468 0.003
HOMA- β 210.6 ± 57.62 60.64 ± 43.07 2.902 0.009
Systolic blood pressure 131.50 ± 5.18 154.5 ± 15.9 4.737 <0.001
Table (4): Comparison of TGF- mRNA expression in group (1) and subgroup (2b)
Group (1) Subgroup (2b) Item No. % No. %
Chi2 P value
No Expression 5 62.5% 0 0.0%
Expression 3 37.5% 2 28.6%
Marked expression 0 0% 5 71.4%
10.18 <0.01
48
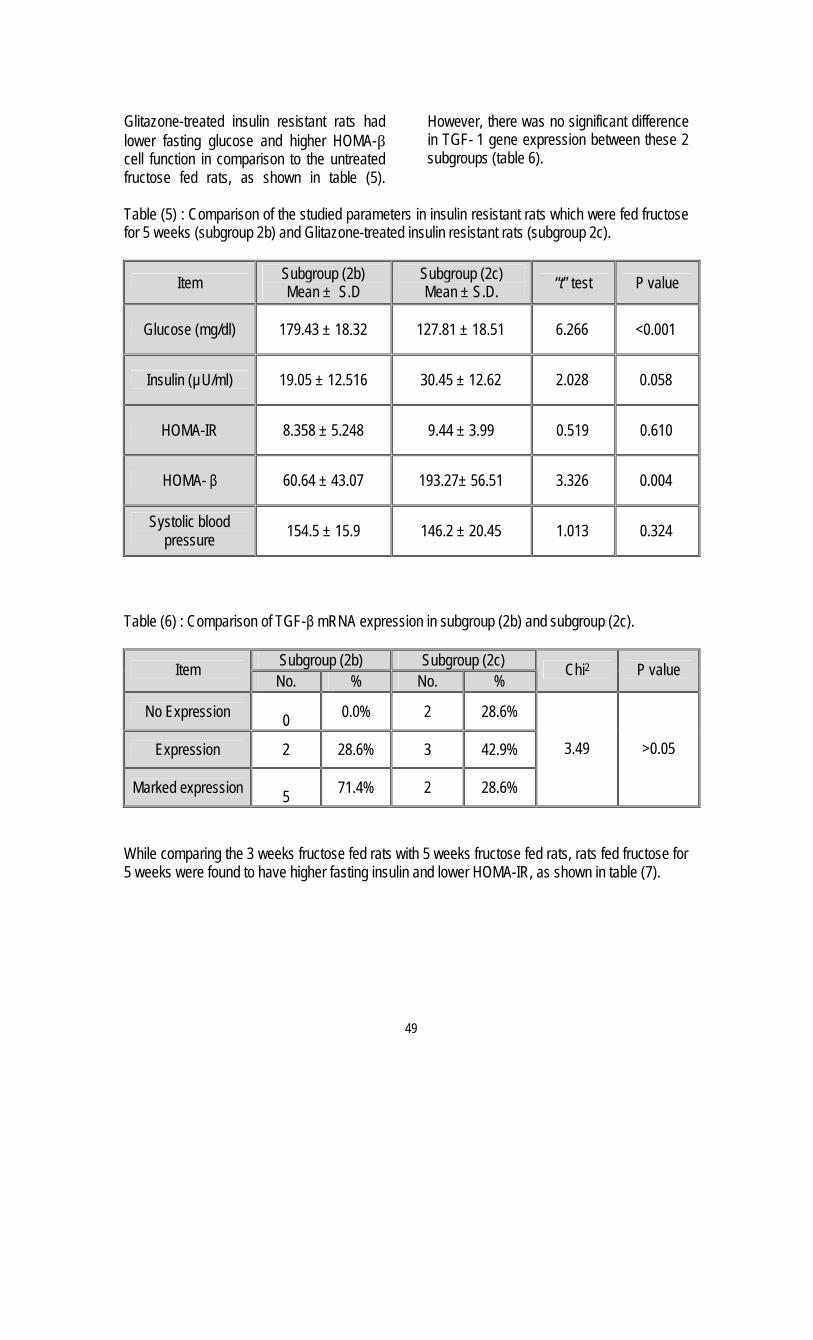
Glitazone-treated insulin resistant rats had lower fasting glucose and higher HOMA-β cell function in comparison to the untreated fructose fed rats, as shown in table (5).
However, there was no significant difference in TGF- 1 gene expression between these 2 subgroups (table 6).
Table (5) : Comparison of the studied parameters in insulin resistant rats which were fed fructose for 5 weeks (subgroup 2b) and Glitazone-treated insulin resistant rats (subgroup 2c).
Item Subgroup (2b) Mean ± S.D
Subgroup (2c) Mean ± S.D. “t” test P value
Glucose (mg/dl) 179.43 ± 18.32 127.81 ± 18.51 6.266 <0.001
Insulin (µU/ml) 19.05 ± 12.516 30.45 ± 12.62 2.028 0.058
HOMA-IR 8.358 ± 5.248 9.44 ± 3.99 0.519 0.610
HOMA- β 60.64 ± 43.07 193.27± 56.51 3.326 0.004
Systolic blood pressure 154.5 ± 15.9 146.2 ± 20.45 1.013 0.324
Table (6) : Comparison of TGF-β mRNA expression in subgroup (2b) and subgroup (2c).
Subgroup (2b) Subgroup (2c) Item No. % No. %
Chi2 P value
No Expression 0 0.0% 2 28.6%
Expression 2 28.6% 3 42.9%
Marked expression 5 71.4% 2 28.6%
3.49 >0.05
While comparing the 3 weeks fructose fed rats with 5 weeks fructose fed rats, rats fed fructose for 5 weeks were found to have higher fasting insulin and lower HOMA-IR, as shown in table (7).
49
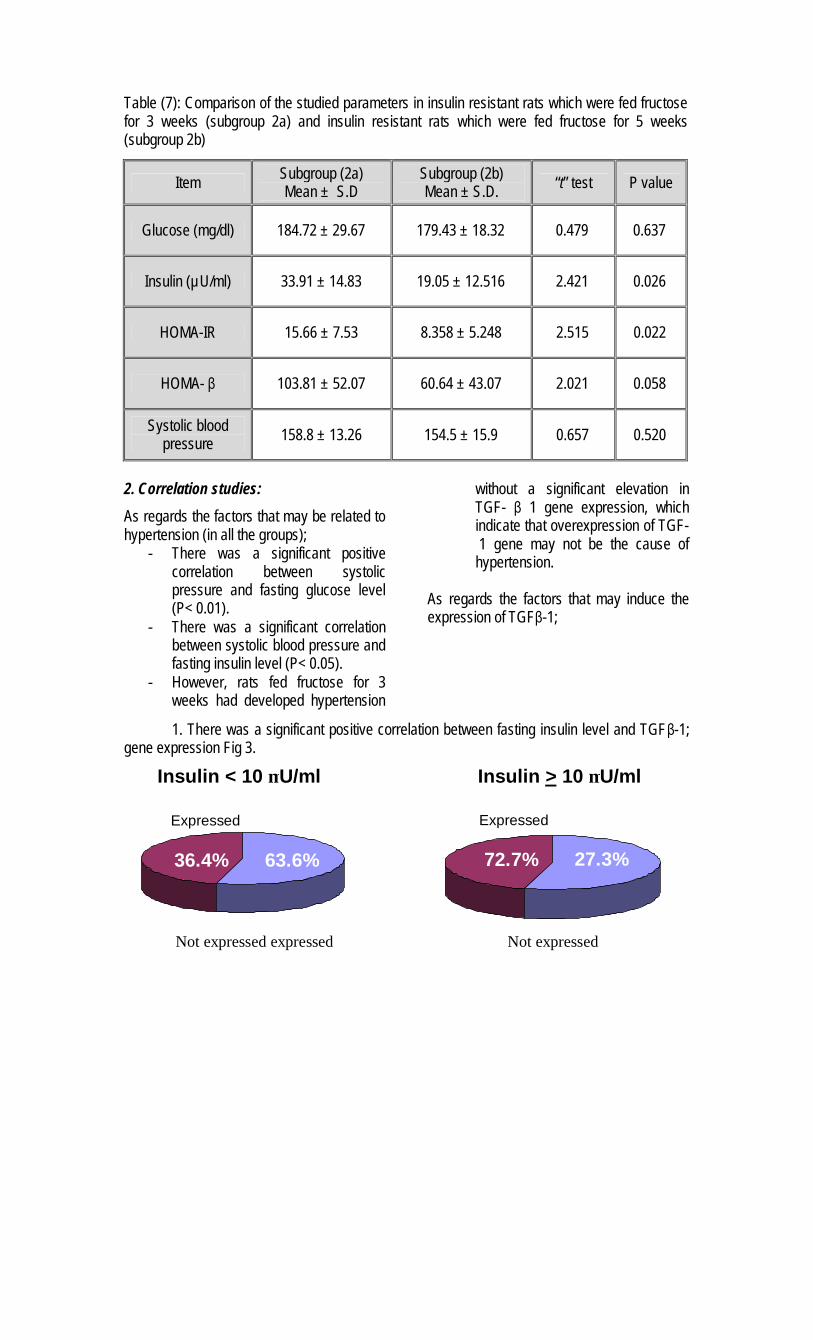
Table (7): Comparison of the studied parameters in insulin resistant rats which were fed fructose for 3 weeks (subgroup 2a) and insulin resistant rats which were fed fructose for 5 weeks (subgroup 2b)
Item Subgroup (2a) Mean ± S.D
Subgroup (2b) Mean ± S.D. “t” test P value
Glucose (mg/dl) 184.72 ± 29.67 179.43 ± 18.32 0.479 0.637
Insulin (µU/ml) 33.91 ± 14.83 19.05 ± 12.516 2.421 0.026
HOMA-IR 15.66 ± 7.53 8.358 ± 5.248 2.515 0.022
HOMA- β 103.81 ± 52.07 60.64 ± 43.07 2.021 0.058
Systolic blood pressure 158.8 ± 13.26 154.5 ± 15.9 0.657 0.520
2. Correlation studies:
As regards the factors that may be related to hypertension (in all the groups);
- There was a significant positive correlation between systolic pressure and fasting glucose level (P< 0.01).
- There was a significant correlation between systolic blood pressure and fasting insulin level (P< 0.05).
- However, rats fed fructose for 3 weeks had developed hypertension
without a significant elevation in TGF- β 1 gene expression, which indicate that overexpression of TGF- 1 gene may not be the cause of hypertension.
As regards the factors that may induce the expression of TGFβ-1;
1. There was a significant positive correlation between fasting insulin level and TGFβ-1; gene expression Fig 3.
Expressed
72.7% 27.3%
Expressed
36.4% 63.6%
Insulin < 10 µU/ml ml/Uµ 10 >Insulin
Not expressed expressed Not expressed
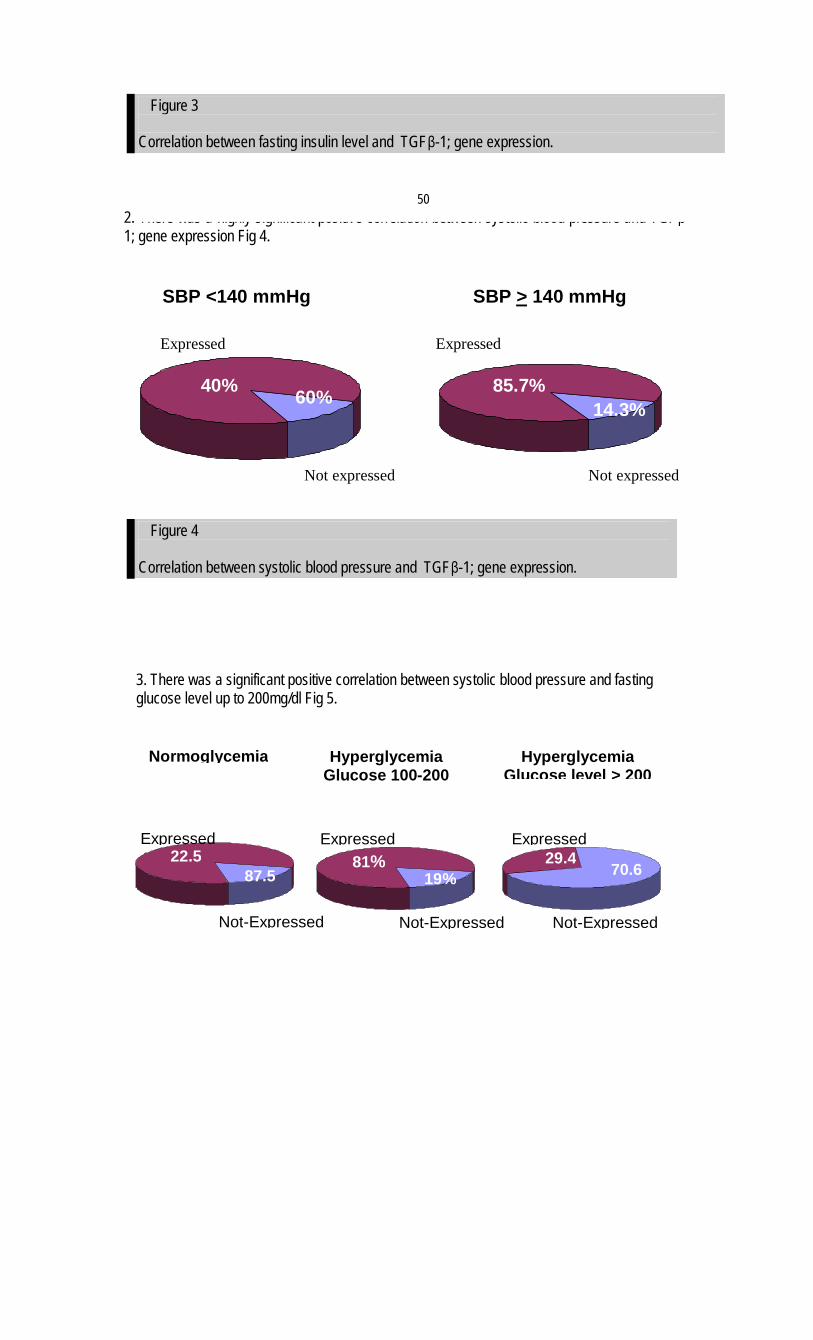
2. There was a highly significant positive correlation between systolic blood pressure and TGFβ-1; gene expression Fig 4.
3. There was a significant positive correlation between systolic blood pressure and fasting glucose level up to 200mg/dl Fig 5.
Figure 3
Correlation between fasting insulin level and TGFβ-1; gene expression.
Figure 4
Correlation between systolic blood pressure and TGFβ-1; gene expression.
40% 60% 85.7% 14.3%
SBP <140 mmHg mmHg140 >SBP
Expressed
Not expressed
Expressed
Expressed 22.5
% 87.5
Not-Expressed
Normoglycemia
Expressed 81%
19%
Not-Expressed
Hyperglycemia Glucose 100-200
mg/dl
Expressed 29.4
% 70.6
Not-Expressed
Hyperglycemia 200 >Glucose level
Not expressed
50

Discussion:
Hypertension is common in the setting of insulin resistance; 70% of patients with type 2 diabetes have a blood pressure greater than or equal to 140/90 mmHg (18).
The aim of the present study was to investigate the link between insulin resistance and hypertension, and whether the transforming growth factor-beta has a role in this association.
In this study, we focused on the expression of TGFβ-1 gene in peripheral blood mononuclear leukocytes in the different groups described above. We studied the expression of TGFβ-1 gene, because the transcriptional activation is not necessarily equale with stimulation of translation and de-novo protein synthesis (19).
Feener and King (20) have reported that hyperglycemia is the most identifiable factor for microvascular and macrovascular diseases in diabetes. However, hyperinsulinaemia is implicated by many authors in induction of hypertension in insulin resistant state (21, 22). These studies are consistent with our findings, as the insulin resistant rats which had both hyperglycemia and hyperinsulinaemia had also a significant elevation of the systolic blood pressure.
Hyperinsulinaemia leads to hypertension, perhaps by changing the sodium balance (23), increasing vascular reactivity (24), enhancing sympathetic tone (22), or some other mechanisms that most probably do not involve the elevated expression of TGFβ-1 gene, as our results showed that hyperinsulinaemia and hyperglycemia without significant elevation in TGFβ-1 mRNA level were associated with marked elevation of systolic blood pressure.
These data, demonstrated that Glitazone improves the insulin sensitivity in
comparison to untreated rats as it lowers the fasting serum glucose level. This effect may occur through the binding of Glitazone to PPAR-γ receptors as reported by Dong et al. (25).
In this study, it seems that Glitazone not only improved the insulin action, but also improved the cell function, as it is observed by the great difference between the treated and untreated rats in HOMA-b cell function and this is consistent with a study carried by Stagner et al. (26). They demonstrated that Glitazone prolongs the functional survival and promotes the function of islet cells of the pancreas. The overexpression of TGFβ-1 gene in untreated rats fed fructose rich diet for 5 weeks might be related to; - The higher hyperglycemia in these rats
in comparison to the treated insulin resistant rats (P<0.01) and in comparison to control rats (P<0.01).
- The longer the duration of insulin resistance/hyperinsulinaemia in these rats in comparison to the insulin resistant rats which were fed fructose for only 3 weeks. However, the untreated insulin resistant
rats which were fed fructose for 5 weeks had significantly lower HOMA-IR in comparison to the 3 weeks fructose fed rats (P<0.022). This could be explained by the observation that the 5 weeks untreated rats which developed a significant over expression of TGFβ-1 mRNA in comparison to control rats (P<0.01) had better insulin sensitivity than the 3 weeks untreated rats.
These results are confirmed by the fact that TGFβ-1 down regulates TNF-alpha receptors (27) and inhibits TNF-α release (28). This may improves the insulin sensitivity as it is well known that TNF-α impairs insulin signaling by increasing serine phosphorylation of insulin receptor substrate
Figure 5
Correlation between fasting glucose level and TGFβ-1; gene expression.
51

(IRS-1) which inhibits insulin receptor tyrosine kinase activity (29, 30). A possible explanation is that inhibition of TNF-alpha receptor expression and release by TGFβ-1 is a dose-dependent mechanism.
This study showed a great difference in the expression of TGFβ-1 between the insulin resistant rats and type 1 diabetic rats. However, the marked elevation of TGFβ-1 gene expression occurred after the insulin resistant rats have developed hypertension, so we conclude that the hypertension seen in large number of type 2 diabetic patients is not due to the over expression of TGFβ-1 in insulin resistant state but it may be induced by hypertension itself as well as other factors (hyperglycemia and hyperinsulinemia seen in this condition.
Therefore, over expression of TGFβ-1 in insulin resistant state may play an important role as a cell protection factor? It has many protective effects which counter act the harmful effects hyperinslinemia seen in this condition. Conclusion:
Over expression of TGF-β1 gene in insulin resistant rats was found to have a beneficial role in improving the insulin sensitivity as indicated by reducing the Homeostasis model assessment of insulin resistance (HOMA-IR) level but was unable to improve the cell function as indicated by severe reduction of Homeostasis model assessment of cell function (HOMA-b in the rats which were fed fructose for 5 weeks.
Rats fed fructose for 3 weeks Rats fed fructose for 5 weeks
TGF- 1 gene expression
Not significantly elevated in comparison to control
Significantly elevated in comparison to control (P<0.01)
HOMA-IR 15.66 8.35 HOMA-β cell
function 103.81 60.64
References: 1. Christopher M., Hew F. L., Oakley M., Rantzau C., Alford F. (2003): Defects of insulin action and skeletal muscle glucose metabolism in growth hormone-deficient adults persist after 24 months of recombinant human growth hormonetherapy.J.Clin.Endocrinol..Metab.83(5):1668-81. 2. McLaughlin T. and Reaven G. (2000): Insulin resistance and hypertension: patients in double jeopardy for CVD. Geriatrics. 55/6: 28-35. 3. Laws A, Reaven GM (1990):Effect of physical activity on age-related glucose intolerance. Clin.Geriatr.Med.Nov;6(4):849-63. 4. Trevisan R. et al. (1990):Role of insulin and atrial natriuretic peptide in sodium retention in insulin-treated IDDM patients during isotonic volume expansion. Diabetes, 39(3): p. 289-98.
5. Anderson E. A. et al. (1991): Hyperinsulinemia produces both sympathetic neural activation and vasodilation in normal humans. J Clin Invest, 87(6): p. 2246-52. 6. Brands M.W. and Hall J.E. (1992):Insulin resistance, hyperinsulinemia, and obesity-associated hypertension. J Am Soc Nephrol; Nov. 3(5): 1064-77. 7. Feener E.P. and King G.L. (1997):Vascular dysfunction in diabetes mellitus. Lancet 350 (suppl1): 913. 8. Argotis A., Saltis J., Dilley R., Bray P., Bobik A. (1995):TGF-β1 and the development of vascular hypertrophy in hypertension. Blood Press Suppl; 243-8. 9. Sato M., Ohsaki Y., Tobise K. (1995):TGF-β1 proliferated vascular smooth muscle cells from spontaneously hypertensive rats. Am J Hypertens. Feb 8 (2): 160-6. 10. Chen H., Li D., Saldeen T. and Mehta J.L. (2003):TGF-β1 attenuates myocardial ischemia-reperfusion injury via inhibition of
53

upregulation of MMP-1. Am.J.physiol 284(5):H1612-H1617. 11. Muller V., Szabo A., Viklicky O., Gaul I., Portl S., Philipp T., Heemann U.W. (1999):Sex hormones and gender-related differences: their influence on chronic renal allograft rejection. Kidney Int 55 (5): 2011-20. 12. Lee M. K., Miles P. D., Khoursheed M., Gao K. M., Moossa A. and Olefsky J. M. (1994): Metabolic effects of troglitazone on fructose-induced insulin resistance in the rat. Diabetes, Vol. 43, 1435-1439. 13. Mooradian A.D., Wong N.C., Shah G.N. (1997): Apolipoprotein A1 expression in young and aged rats is modulated bt dietary carbohydrates. Metabolism Oct; 46 (10): 1132-6. 14. Nagai Y., Nishio Y., Nakamura T., Maegawa H. et al (2002): Amelioration of high fructose induced metabolic derangements by activation of PPAR-alpha. Am J Physiol Endocrinol Metab 282 Jan (22): E1180-E1190. 15. Trinder P. (1969): Determination of blood glucose using 4-aminophenazone as oxygen acceptor. J Clin Pathol 22 (2): 246. 16. Levy J.C., Matthews D.R., Hermans M.P. (1998): Correct hemostasis model assessement evaluation uses the computer program. Diabetes Care, 21: 2191-2192. 17. Lemarie L. and Ouellet S. (1996) : Role of transforming growth factor- 1 in down-regulating TNF production by alveolar macrophages during asbestos-induced pulmonary fibrosis. Mediators Inflamm. 5:37. 18. Christopher M., Hew F. L., Oakley M., Rantzau C., Alford F. (2003): Defects of insulin action and skeletal muscle glucose metabolism in growth hormone-deficient adults persist after 24 months of recombinant human growth hormonetherapy. J. Clin Endocrinol Metab.83(5):1668-81. 19. Fraser D., Wakefield L., Phillips A., (2002): Independent regulation of TGF- 1 transcription by glucose and platelet derived growth factor. American journal of pathology 161: 1039-1049.
20. Feener E.P. and King G.L. (1997): Vascular dysfunction in diabetes mellitus. Lancet 350 (suppl1): 913. 21. Lee M. K., Miles P. D., Khoursheed M., Gao K. M., Moossa A. and Olefsky J. M. (1994): Metabolic effects of troglitazone on fructose-induced insulin resistance in the rat. Diabetes, Vol. 43, 1435-1439. 22. Huang Y.J., Fang V.S., Juan C.C., Chou Y.C., Kwok C.F. and Ho L.T. (1997): Amelioration of insulin resistance and hypertension in a fructose-fed rat model with fish oil supplementation. Metabolism 46 (11): 1252-1258. 23. Grundy S. G., Hansen B., Smith S. C., Cleeman J. I., Kahn R. A. (2004): Clinical Management of Metabolic Syndrome. Circulation. 109:551-556. 24. Hosomi N., Noma T., Ohyama H., Takahashi T., Kohno M. (2002): Vascular proliferation and transforming growth factor-beta expression in pre-and early stage of diabetes mellitus in Otsuka Long-Evans Tokushima fatty rats. Atherosclerosis. 162(1): 69-76. 25. Dong M.J., Akinari T., Hayato N., Ken-Ichiro F., Toshiharu A. and Makoto O. (2000): Troglitazone prevents and reverses dyslipidemia, insulin secretory defects, and histologic abnormalities in a rat model of naturally occurring obese diabetes. Metabolism, Vol 49. pp 1167-1175. 26. Stagner J., Tanwani L., Lohano V., Mokshagundam S. (2001): Troglitazone prolongs the functional survival and promate the function of islet cells of the pancreas. International pancreas and islet transplant association. 27. Tedgui A., Mallat Z. (2001): Anti-Inflammatory mechanisms in the vascular wall. Circulation Research. 877-887. 28. Chen H., Li D., Saldeen T. and Mehta J.L. (2003): TGF-β1 attenuates myocardial ischemia-reperfusion injury via inhibition of upregulation of MMP-1. Am.J.physiol 284(5):H1612-H1617. 29. Kanety H., Feinstein R., Papa M.Z., Hemi R., Karasik A. (1995): TNF-alpha induced phosphorylation of insulin receptor substrate-1. Possible mechanism of suppression of

insulin-stimulated tyrosine phosphorylation of IRS-1. J Biol Chem. 270: 23780-23784. 30. De Alvaro C., Teruel T., Hernandez R., Lorenzo M. (2004): Tumor necrosis factor alpha produces insulin resistance in skeletal
muscle by activation of inhibitor kB kinase in a p38 mitogen-activated protein kinase-dependent manner. J. Bio. Chem. Feb 4 (Epub ahead of print).
54

HDL-CHOLESTEROL, THE RISK FACTOR AND THE FUTURE THERAPEUTIC TARGET: A
STATEMENT FROM THE EGYPTIAN HYPERTENSION SOCIETY M. Mohsen Ibarhim, MD.
HIGH-DENSITY LIPOPROTEIN (HDL) STRUCTURE AND COMPOSITION
• HDL belongs to the group of plasma lipoproteins, characterized by having high density (> 1.063 g/ml) and small size.
• HDL is a very heterogeneous class of small particles which vary in their size, density, shape and composition.
• Mature HDL particles are spherical particles with a hydrophobic lipid core of cholesterol esters and triglycerides and an outer shell of apolipoproteins, cholesterol, a number of other proteins such as cholesterol ester transfer protein (CETP), phospholipid transfer protein (PLTP) and enzymes such as lecithin-cholesterol acyltransferase (LCAT) and paraoxanase (PON). These proteins determine the antiatherogenic properties of HDL.
• The chief apoprotein in HDL particles is apolipoprotein (apo) A-1. Apo A-1 is secreted by the liver and intestine. Its rate of synthesis is enhanced by lifestyle, dietary and pharmacologic interventions.
• Apo A-1 synthesis rate is the rate-limiting step in maintaining plasma HDL concentration. • Apo A-1 is responsible for many of the antiatherogenic and anti-inflammatory functions of HDL.
FORMATION AND DISPOSAL OF HDL
Figure1: Reverse Cholesterol Transport CE= cholesterol ester; FC= free cholesterol; A-1= apolipoproteinA-1; ABC1= ATP-binding cassettte protein-1; LCAT= Lecithin:cholesterol acyl transeferase; CETP= cholesterol ester transfer protein SR-B1=scavenger receptor class B1; SR-A= scavenger receptor class A
CEFC
Macrophage
ABC1Nascent HDL
Secreted from liver or intestine
FC
A-1
LCAT
A-1
Mature HDL
CESR-B1
CE
FC
Bile
VLDL/LDL
B
CETP
CE
LDLreceptor
HDL metabolism: Reverse cholesterol transport and the role of CETP
Oxidation
SR-A

• Lipid free Apo A-1 particles acquire lipids from the cell membrane to form HDL particles.
• Cholesterol and phospholipids in the cell are carried through a special cell membrane transporter protein knows as ATP-binding cassette protein (ABC) transporter A1 (ABCA1) to lipid free Apo A-1 particles leading to the formation immature nascent disc shaped HDL particles.
• PLTP facilitates the formation of HDL from cell and lipoprotein surface phospholipids.
• Through LCAT enzyme, cholesterol is esterified to the hydropholic cholesterol esters which translocate to the core of HDL particles inviting the transfer of more cholesterol from cells through ABCA, producing a larger spherical mature HDL-particles.
• Cholesterol esters in the mature HDL are exchanged with triglycerides (TG) in TG rich lipoproteins (LDL, VLDL and remnant lipoproteins) through cholesterol ester transport protein (CETP).
• CEPT helps in the shuttle and movement of cholesterol and TG between different lipoproteins.
• Increased TG of HDL particles makes these a good substrate for hepatic triglycerides lipase. This enzyme breaks down TG enriched HDL particles into smaller dense particles with little functional capacity to accept and transfer cholesterol form cells to liver and makes them easily cleared by the kidney which decreases HDL-C in plasma.
• In hepatic cells, scavenger receptor- B1 (SR-B1) directly uptake cholesterol in HDL particles.
• The process of transport of cholesterol form peripheral cells to hepatocytes through HDL for further metabolism and excretion in the bile is known as reversed cholesterol transport.
• The formation of efficient cholesterol acceptors such as ABCA1, which helps cholesterol efflux, is an important initial step in reversed cholesterol transport.
• ABCA1 plays a critical role in determining plasma HDL levels.
• ABCA1 deficiency (Tangier disease) is characterized by very low plasma HDL levels.
FUNCTIONS OF HDL Reversed Cholesterol Transport: HDL through the process of reversed cholesterol transport helps to maintain cholesterol level in peripheral cells within physiologic levels required for formation of cell membrane. HDL deficiency leads to accumulation of cholesterol in the cells with subsequent development of atherosclerosis. Anti-Inflammatory Actions: HDL through its Apo- A1 has an anti-inflammatory actions interfering with monocyte recruitment and adhesion to vascular endothelium and limiting the production of adhesion molecules. Vascular Endothelium Protection: HDL helps in nitric oxide (NO) generation through activation of endothelial NO synthase enzyme. Anti-oxidant Action: Through Apo A-1, HDL counteracts LDL oxidation. Apo A-1 reduces hydroproxide. HDL also carries enzymes that destroy lipid hydroperoxides such as PON. Anti-thrombotic Potential: HDL decreases plasma fibrinogen level. DEFINITION AND CAUSES OF LOW HDL
• A plasma level of HDL-C below 40 mg/dL carries an increased risk of future cardiovascular events and has been defined as the threshold for low HDL-C.
• More than 50% of causes of low HDL are genetic in origin.
• Other causes of low HDL include sedentary life style, obesity, cigarette smoking, very rich carbohydrate, poor fat diet, disease conditions such as diabetes, liver disease and hyperthyroidism Some dugs such as thiazide diuretics, beta-adrenergic blockers (non-cardio specific) and steroids induce low HDL.
• Genetic causes of low HDL are related to mutations in gene coding for ABCA1, CETP and hepatic lipases.
• Very severe reductions in HDL are usually due to genetic factors and there is tendency for familial aggregations. PREVALENCE OF LOW HDL-C
• Epidemiologic studies showed that low HDL-C is not uncommon in the general population.

• Depending on the definition cut point of HDL-C less than 35 mg/dL, prevalence of low HDL varies between 8 to 32 % in males. Low HDL-C is more common among men than women.
• In Egypt, low HDL-C was present in 32.2% of males and 20.6% of females.
• In patients with coronary heart disease (CHD), low HDL-C is the commonest lipid abnormality particularly among males. Levels below 40 mg/dL were present in 49.2% of Egyptian patients with CHD.
• Young patients with a history of myocardial infarction have very high prevalence of low HDL-C. CLINICAL FORMS OF LOW HDL-C
• Low HDL-C can present as an isolated biochemical abnormality with no other cardiovascular risk factors or more commonly in association with other metabolic disorders.
• The commonest mechanism underlying low HDL-C are interaction between genetic predisposition and life style factors such as lack of physical activity, obesity and cigarette smoking.
• Commonest biochemical abnormality associated with low HDL-C is increased plasma triglycerides. This combination is present in patients with diabetes, obesity and metabolic syndrome.
• Abdominal obesity with fat accumulation in abdominal wall, mesentery and retroperitoneal space is commonly accompanied with low HDL-C*.
• Insolated low HDL-C is of genetic origin and is commonly present in many members of the same family. This condition is present in apparently healthy individuals who are not obese and free from other risk factors.
• Atherogenic dyslipidemia is a triad of low HDL-C, mild to moderate hypertriglyceridemia and increased atherogenic small dense LDL particles. This condition is associated with increased risk of atherosclerosis and CHD. It is common in some ethnic groups (South Asians) with increased risk of type 2 diabetes.
TREATMENT OF LOW HDL-C Life Style for Raising HDL-C Should be initiated in all individuals with low HDL-C, however, compliance is poor and its effectiveness is limited particularly in severe forms.
1. Weight loss through low caloric diet can produce transient reduction of HDL-C during active dieting, however, HDL increases once weight is stabilized. There is an increase of HDL of 1 mg/dL for every 7 pounds lost.
2. Diet: use of monounsaturated fat (e.g. olive oil) in exchange of saturated fats or carbohydrates. The effects of omega-3 fatty acids or fish oil supplementations is modest.
3. Aerobic exercise is the most important non-pharmacologic method for raising low HDL-C. It increased HDL-C by 20%. There is 1 mg/dL increase in HDL-C for 4 to 5 miles run per week.
4. Smoking cessation. PHARMACOLOGIC INTERVENTIONS Nicotinic Acid (Niacin)
• Pharmacologic agent of choice for raising HDL-C. It can elevate HDL-C by 30%. Mechanism of Action of Nicotinic Acid
• Inhibits catabolism of Apo A-1 in the liver. • Activities ABCA1 transporter, thereby
stimulating cholesterol efflux. • Inhibits lipolysis in adipocytes and TG
synthesis resulting in decreased output of TG rich lipoproteins by liver.
• Other beneficial effects of nicotinic acid include: improve endothelial function, reduce inflammation and thrombosis. Nicotinic acid inhibits the coagulation cascade, decreases platelet aggregation and increases fibrinolytic activity. Nicotinic acid lowers plasma LDL-C and triglyceride levels.
* Fat cells in abdominal wall and between abdominal viscera are metabolically active characterized by increased TG breakdown into fatty acids. Increased plasma fatty acids reaching the liver will augment TG synthesis in the liver, which are secreted in form of VLDL particles. Increased production of VLDL will augment TG transfer to HDL in exchange for cholesterol esters via CETP action resulting in increased TG in HDL particles which are more susceptible to hepatic lipase.

• It reduces Lp(a) by a substantial degree. • In combination with statins, Niacin carries
less risk of rhabdomyolysis than fibrate. Preparations
• Three formulations of nicotinic acids are available: immediate release (IR), extended or sustained release and prolonged release forms. Flushing, pruritus, and skin rash are common with the IR forms, while hepatic toxicity is present with sustained-release formulation. Prolonged release (Niaspan) has less side effects and toxicity.
• Niacin should be avoided in patients with active peptic ulcer or gout, but it can be used in diabetic patients.
• The dose of Niaspan is 1000-2000 mg given once daily at bed time, starting with an initial dose of 500 mg. Fibrates (gemfibrozil, fenofibrate)
• Raised HDL-C by activating peroxisome proliferator-activated receptor alpha (PPARα). PPARα enhances the expression of the LDL-regulating genes, apolipoproteins A-1, lipoprotein lipase and ABCA1.
• Fibrates raise HDL-C by an average of 5 to 20 %, but they are superior to niacin and statins in reducing plasma triglycerides.
• Combination with statin carries increased risk of rhabdomyolysis. Statins
• Raise HDL-C by an average of 5-10%. • Mechanism of action includes the activation
of PPAR α and apolipoprotein A-1. they increase Apo A-1 production in the liver and enhance cholesterol efflux and reversed cholesterol transport.
• Rosuvastatin and Simvastatin are the most effective statins in raising HDL-C.
• Drugs of choice for lowering LDL-C level. New HDL-C Elevating Agents
1. CETP inhibitors (torcetrapib) can increase HDL-C up to 60% in a dose-dependent manner.
2. Agents that increase expression of Apo A-2 or up-regulate ABCA1 transporter.
3. Intravenous recombinant HDL-C apo A-1 (apo A-1 Milano).
4. Rimonabant: cannabinoid receptor blocker.
RECOMMENDATIONS FOR MANAGEMENT OF PATIENTS WITH LOW HDL-C
1. Measurement of plasma level of HDL-C should be through a standardized, accurate and reproducible technique.
2. If low HDL-C (< 40 mg/dl) is discovered, it is preferable to repeat the test.
3. After confirming the presence of low HDL-C, further management will depend upon the following factors:
a. Degree of reduction in HDL-C, how low it is?
b. Presence of coronary heart disease or coronary heart disease risk equivalent.
c. Presence of other cardiovascular risk factors.
d. Presence of correctable cause of low HDL-C.
4. Therapies to raise low HDL-C levels should be individually tailored based on the patient's overall coronary heart disease risk. Global cardiovascular risk assessment is part of routine management.
5. Life style modification and non-pharmacologic therapy (particularly stopping smoking, weight reduction and increased physical activity) should be initiated and stressed in all patients with careful follow-up.
6. Pharmacologic treatment is indicated in the following groups:
a. Isolated low HDL-C associated with: 1. Cigarette smoking. 2. History of hypertension. 3. Strong family history of
premature coronary heart disease.
b. High and intermediate risk patients with low HDL-C after lowering of LDL-C through statin therapy to the optimal level. This group include: 1. Coronary heart disease patients. 2. Patients with history of stroke, PAD, and abdominal aortic aneurysm. 3. Diabetics. 4. Multiple cardiovascular risk fators.
c. Low risk patients with severe reduction in HDL < 25 mg/dL.
7. Target HDL-C is > 40 mg/dL in men and > 50 mg/dL in women.

8. Nicotinic acid is the drug of choice in majority of cases of low HDL-C except in patients with increased triglycerides where fibrates are of first priority. Prolonged
release formulation of nicotinic acid (Niaspan) is the preferred form because of the low incidence of side effects (flushing and hepatic toxicity).
Effects of Niacin and Fibrates on Plasma Lipids (Average Changes) Total Cholesterol LDL-C Triglycerides HDL-C
Niacin ↓ 10% ↓ 12% ↓ 20% ↑ 16%
Fibrates ↓ 11% ↓ 8% ↓ 36% ↑ 10%
Source: Birjmohun RS, et al. J Am Coll Cardiol 2005; 45:185-97.