the effects of the steel voluntary restraint agreements on
TRANSCRIPT
lllHE EFFECTS OF THE STEEL VOLUNTARY -RESTRAINT AGREEMENTS ON U.S. STEEL-CONSUMING INDUSTRIES
Report to the Subcommittee on Trade of the House Committee on Ways and Means on Investigation No. 332-270 Under Section 332 of the Tariff Act of 1 930
USITC PUBLICATION 2182
MAY 1989
United States International Trade Commission Washington, DC 20436

UNITED STATES INTERNATIONAL TRADE COMMISSION
COMMISSIONERS
Anne E. Brunsdale, Chairman Ronald A. Cass, Vice Chairman
Alfred E. Eckes Seeley G. Lodwick
David B. Rohr Don E. Newquist
Office of Economics
John W. Suomela, Director
Research Division
Donald J. Rousslang, Chief
This report was prepared principally by
Gerald C. Berg, Project Leader
Hugh Arce and Andrew Parks, Office of Economics
and
James Brandon, Richard Brown, Nancy Fulcher, Georgia Jackson, Juanita Kavalauskas, Karen Laney-Cummings,
Alison Lippa, Mark Paulson, and Lena Shapiro Office of Industries
with assistance from
Peter A very, Office of Industries
Address all communications to Kenneth. R. Mason, Secretary to the Commission
United States International Trade Commission Washington, DC 20436
PREFACE
On February 27, 1989, at the request of the Subcommittee on Trade of the Committee on Ways and Means of the U.S. House of Representatives (see appendix A), and in accordance with section 332(g) of the Tariff Act of 1930 (19 U.S.C. 1332(g)), the United States International Trade Commission instituted Investigation No. 332-270, "The Effects of the Steel Voluntary Restraint Agreements on U.S. Steel-Consuming Industries." This report on the Commission's study contains estimates of the effects of VRAs on exports, imports, and domestic sales of major U.S. steel consuming industries for each of the years 1985 through 1988, an analysis of the likely effects of continuing these restraints in the future, and an analysis of oilier economic effects focusing on the following industries: automotive, construction, agricultural equipment, construction equipment, major household appliances, forging, and metal stamping~
Public notice of this investigation was given in the Federal Register of March 2, 1989 (54 F.R. 8835) and by posting copies of the notice in the Office of the Secretary, U.S. International Trade Corilmission, Washington, DC.
A public hearing in connection with this investigation was held in the Commission's hearing room on March 10, 1989. The calendar of witnesses who testified at the hearing appears in appendix B.
Information contained in this report was obtained from testimony at the hearing, written submissions from the public, fieldwork, the Commission's files, other Government agencies, and other sources.

CONTENTS
Page
Preface .......................... ····.········································
Executive Summary . . . . . . . . . . . . . . . . . . . . . . . . . . . . . . . . . . . . . . . . . . . . . . . . . . . . . . . . . . . . vii
Chapter 1. Introduction The purpose and scope of this study . . . . . . . . . . . . . . . . . . . . . . . . . . . . . . . . . . . . . . . . . . . . 1-1 Background . . . . . . . . . . . . . . . . . . . . . . . . . . . . . . . . . . . . . . . . . . . . . . . . . . . . . . . . . . . . . . . . 1-1 The product . . . . . . . . . . . . . . . . . . . . . . . . . . . . . . . . . . . . . . . . . . . . . . . . . . . . . . . . . . . . . . . . 1-1 The VRA program . . . . . . . . . . . . . . . . . . . . . . . . . . . . . . . . .. . . . . . . . . . . . . . . . . . . . . . . . . . 1-1 The Commission's study in 1985 . . . . . . . . . . . . . . . . . . . . . . . . . . . . . . . . . . . . . . . . . . . . . . . 1-2 Views on extension of the VRAs . . . . . . . . . . . . . . . . . . . . . . . . . . . . . . . . . . . . . . . . . . . . . . . 1-2
Arguments for extension . . . . . . . . . . . . . . . . . . . . . . . . . . . . . . . . . . . . . . . . . . . . . . . . . . . . 1-2 Arguments against extension . . . . . . . . . . . . . . . . . . . . . . . . . . . . . . . . . . . . . . . . . . . . . . . . . 1-3
Chapter 2. The effects of VRAs on exports, imports, and domestic sales of U.S. steel-consuming industries:
Overview of the methodology used to estimate the effects in 1985-88 and the industries studied . . . . . . . . . . . . . . . . . . . . . . . . . . . . . . . . . . . . . . . . . . . 2-1
Estimated effects on steel prices . . . . . . . . . . . . . . . . . . . . . . . . . . . . . . . . . . . . . . . . . . . . . . . . 2-1 Estimated effects on exports, imports, and domestic sales . . . . . . . . . . . . . . . . . . . . . . . . . . . 2-2 The effects of VRAs beyond 1989.............................................. 2-2
Chapter 3. Other effects of the VRAs Background . . . . . . . . . . . . . . . . . . . . . . . . . . . . . . . . . . . . . . . . . . . . . . . . . . . . . . . . . . . . . . . . 3-1
Price . . . . . . . . . . . . . . . . . . . . . . . . . . . . . . . . . . . . . . . . . . . . . . . . . . . . . . . . . . . . . . . . . . . . 3-1 Quality . . . . . . . . . . . . . . . . .. . . . . . . . . . . . . . . . . . . . . . . . . . . . . . . . . . . . . . . . . . . . . . . . . . . 3-1 Availability . . . . . . . . . . . . . . . . . . . . . . . . . . . . . . . . . . . . . . . . . . . . . . . . . . . . . . . . . . . . . . . 3-2
The automotive industry: . . . . . . . . . . . . . . . . . . . . . . . . . . . . . . . . . . . . . . . . . . . . . . . . . . . . . 3-2 Structure of the domestic industry . . . . . . . . . . . . . . . . . . . . . . . . . . . . . . . . . . . . . . . . . . . . 3-2 Conditions in the industry . . . . . . . . . . . . . . . . . . . . . . . . . . . . . . . . . . . . . . . . . . . . . . . . . . . 3-3 Trade patterns . . . . . . . . . . . . . . . . . . . . . . . . . . . . . . . . . . . . . . . . . . . . . . . . . . . . . . . . . . . . 3-3 Effects of the VRAs . . . . . . . . . . . . . . . . . . . . . . . . . . . . . . . . . . . . . . . . . . . . . . . . . . . . . . . . 3-4
Prices . . . . . . . . . . . . . . . . . . . . . . . . . . . . . . . . . . . . . . . . . . . . . . . . . . . . . . . . . . . . . . . . . . 3-4 Supply and quality.. . . . . . . . . . . . . . . . . . . . . . . . . . . . . . . . . . . . . . . . . . . . . . . . . . . . . . . 3-5
Views on continuation of the VRAs . . . . . . . . . . . . . . . . . . . . . . . . . . . . . . . . . . . . . . . . . . . 3-5 Construction: fabricated structural steel . . . . . . . . . . . . . . . . . . . . . . . . . . . . . . . . . . . . . . . . . 3-5
Structure of the domestic industry . . . . . . . . . . . . . .. . . . . . . . . . . . . . . . . . . . . . . . . . . . . . . 3-6 Conditions in the industry . . . . . . . . . . . . . . . . . . . . . . . . . . . . . . . . . . . . . . . . . . . . . . . . . . . 3-6 Trade patterns . . . . . . . . . . . . . . . . . . . . . . . . . . . . . . . . . . . . . . . . . . . . . . . . . . . . . . . . . . . . 3-7 Effects of the VRAs . . . . . . . . . . . . . . . . . . . . . . . . . . . . . . . . . . . . . . . . . . . . . . . . . . . . . . . . 3-7
Prices . . . . . . . . . . . . . . . . . . . . . . . . . . . . . . . . . . . . . . . . . . . . . . . . . . . . . . . . . . . . . . . . . . 3-9 Procurement . . . . . . . . . . . . . . . . . . . . . . . . . . . . . . . . . . . . . . . . . . . . . . . . . . . . . . . . . . . . 3-9 Substitution of materials . . . . . . . . . . . . . . . . . . . . . . . . . . .. . . . . . . . . . . . . . . . . . . . . . . . . 3-9 Competitiveness . . . . . . . . . . . . . . . . . . . . . . . . . . . . . . . . . . . . . . . . . . . . . . . . . . . . . . . . . . 3-9
Views on continuation of the VRAs . . . . . . . . . . . . . . . . . . . . . . . . . . . . . . . . . . . . . . . . . . . 3-9 Agricultural equipment:
Structure of the domestic industry . . . . . . . . . . . . . . . . . . . . . . . . . . . . . . . . . . . . . . . . . . . . 3-1 O Conditions in the industry . . . . . . . . . . . . . . . . . . . . . . . . . . . . . . . . . . . . . . . . . . . . . . . . . . . 3-10 Trade patterns . . . . . . . . . . . . . . . . . . . . . . . . . . . . . . . . . . . . . . . . . . . . . . . . . . . . . . . . . . . . 3-11 Effects of the VRAs . . . . . . . . . . . . . . . . . . . . . . . . . . . . . . . . . . . . . . . . . . . . . . . . . . . . . . . . 3-11
Supply and quality . . . . . . . . . . . . . . . . . . . . . . . . . . . . . . . . . . . . . . . . . . . . . . . . . . . . . . . . 3-11 Prices . . . . . . . . . . . . . . . . . . . . . . . . . . . . . . . . . . . . . . . . . . . . . . . . . . . . . . . . . . . . . . . . . . 3-12 Competitiveness .................................. ·. . . . . . . . . . . . . . . . . . . . . . . . 3-12
iii
CONTENTS-Continued
Page
Chapter 3. Other effects of the VRAs-Continued
Views on continuation of the VRAs . . . . . . . . . . . . . . . . . . . . . . . . . . . . . . . . . . . . . . . . . . . 3-12 Construction machinery and equipment:
Structure of the domestic industry . . . . . . . . . . . . . . . . . . . . . . . . . . . . . . . . . . . . . . . . . . . . 3-13 Conditions in the industry . . . . . . . . . . . . . . . . . . . . . . . . . . . . . . . . . . . . . . . . . . . . . . . . . . . 3-13 Trade patterns . . . . . . . . . . . . . . . . . . . . . . . . . . . . . . . . . . . . . . . . . . . . . . . . . . . . . . . . . . . . 3-13 Effects of the VRAs:
Supply and quality . . . . . . . . . . . . . . . . . . . . . . . . . . . . . . . . . . . . . . . . . . . . . . . . . . . . . . . 3-13 Prices . . . . . . . . . . . . . . . . . . . . . . . . . . . . . . . . . . . . . . . . . . . . . . . . . . . . . . . . . . . . . . . . . . 3-15 Competitiveness . . . . . . . . . . . . . . . . . . . . . . . . . . . . . . . . . . . . . . . . . . . . . . . . . . . . . . . . . . 3-15
Views on continuation of the VRAs . . . . . . . . . . . . . . . . . . . . . . . . . . . . . . . . . . . . . . . . . . . 3-15 Major household appliances:
Structure of the domestic industry . . . . . . . . . . . . . . . . . . . . . . . . . . . . . . . . . . . . . . . . . . . . 3-15 Conditions in the industry . . . . . . . . . . . . . . . . . . . . . . . . . . . . . . . . . . . . . . . . . . . . . . . . . . . 3-15 Trade patterns . . . . . . . . . . . . . . . . . . . . . . . . . . . . . . . . . . . . . . . . . . . . . . . . . . . . . . . . . . . . 3-16 Effects of the VRAs:
Supply and quality . . . . . . . . . . . . . . . . . . . . . . . . . . . . . . . . . . . . . . . . . . . . . . . . . . . . . . . 3-17 Prices . . . . . . . . . . . . . . . . . . . . . . . . . . . . . . . . . . . . . . . . . . . . . . . . . . . . . . . . . . . . . . .. . . . 3-17 Competitiveness . . . . . . . . . . . . . . . . . . . . . . . . . . . . . . . . . . . . . . . . . . . . . . . . . . . . . . . . . . 3-17
Views on continuation of the VRAs . . . . . . . . . . . . . . . . . . . . . . . . . . . . . . . . . . . . . . . . . . . 3-18 The forging industry:
Structure of the domestic industry . . . . . . . . . . . . . . . . . . . . . . . . . . . . . . . . . . . . . . . . . . . . 3-18 Conditions in the industry . . . . . . . . . . . . . . . . . . . . . . . . . . . . . . . . . . . . . . . . . . . . . . . . . . . 3-19 Trade patterns . . . . .. . . . . . . . . . . . . . . . . . . . . . . . . . . . . . . . . . . . . . . . . . . . . . . . . . . . . . . . 3-19 Effects of the VRAs:
Prices . . . . . . . . . . . . . . . . . . . . . . . . . . . . . . . . . . . . . . . . . . . . . . . . . . . . . . . . . . . . . . . . . . 3-21 Supply and quality . . . . . . . . . . . . . . . . . . . . . . . . . . . . . . . . . . . . . . . . . . . . . . . . . . . . . . . 3-21 Competitiveness . . . . . . . . . . . . . . . . . . . . . . . . . . . . . . . . . . . . . . . . . . . . . . . . . . . . . . . . . . 3-22
Views on Continuation of the VRAs ................................. , . . . . . . . . . 3'-22 The metal stamping industry:
Structure . . . . . . . . . . . . . . . . . . . . . . . . . . . . . . . . . . . . . . . . . . . . . . . . . . . . . . . . . . . . . . . . . 3-22 Conditions in the industry . . . . . . . . . . . . . . . . . . . . . . . . . . . . . . . . . . . . . . . . . . . . . . . . . . . 3-22 Trade patterns . . . . . . . . . . . . . . . . . . . . . . . . . . . . . . . . . . . . . . . . . . . . . . . . . . . . . . . . . . . . 3-23 Effects of the VRAs:
Supply and quality . . . . . . . . . . . . . . . . . . . . . . . . . . . . . . . . . . . . . . . . . . . . . . . . . . . . . . . 3-23 Prices . . . . . . . . . . . . . . . . . . . . . . . . . . . . . . . . . . . . . . . . . . . . . . . . . . . . . . . . . . . . . . . . . . 3-25 Competitiveness . . . . . . . . . . . . . . . . . . . . . . . . . . . . . . . . . . . . . . . . . . . . . . . . . . . . . . . . . . 3-25
· Views on continuation of the VRAs . . . . . . . . . . . . . . . . . . . . . . . . . . . . . . . . . . . . . . . . . . . 3-25 Other steel-consuming industries . . . . . . . . . . . . . . . . . . . . . . . . . . . . . . . . . . . . . . . . . . . . . . . 3-25
Companies in support of VRA extension . . . . . . . . . . . . . . . . . . . . . . . . . . . . . . . . . . . . . . . 3-25 Companies in opposition to VRA extension . . . . . . . . . . . . . . . . . . . . . . . . . . . . . . . . . . . . . 3-2 6
Appendixes:
iv
Appendix A. Letter from Chairman Gibbons of the Subcommittee on Trade of the House Ways and Means Committee to Acting Chairman Anne Brunsdale requesting this investigation . . . . . . . . . . . . . . . . . . . . . . . . . . . . . . . . A-1
Appendix B. Public notice of the Commission's investigation . . . . . . . . . . . . . . . . . . . . . . . . B-1 Appendix C. Calendar of public hearing . . . . . . . . . . . . . . . . . . . . . . . . . . . . . . . . . . . . . . . . . C-1 Appendix D. Methodology and data used to estimate the effects of
voluntary restraint agreements on exports, imports, and domestic sales in U.S. steel-consuming industries . . . . . . . . . . . . . . . . . . . . . . . . . . . . D-1
Appendix E. Estimated effects of VRAs on exports, imports, and domestic sales in 79 U.S. steel-consuming industries . . . . . . . . . . . . . . . . . . . . . . . . . E-1
Appendix F. U.S. Apparent consumption, producer's shipments, exports, and imports of certain steel mill and fabricated steel products . . . . . . . . . . . . . . . . . F-1
CONTENTS-Continued
Page
Appendixes-Continued
Appendix G. Steel exports and export ceilings negotiated under the VRAs . . . . . . . . . . . . . G-1 Appendix H. The steel market during 1984-88 . . . . . . . . . . . . . . . . . . . . . . . . . . . . . . . . . . . H-1
Tables
2-1. Effects of VRAs: counterfactual and actual steel imports as shares of U.S. apparent consumption, estimated percentage decrease in steel imports, and estimated percentage increases in import, domestic, and weighted average prices of steel in the U.S. market, 1985-88 . . . . . . . . . . . . . . . . . . . . . . . . . . . . . . . . . . . . 2-2
2-2. Effects of VRAs: estimated changes in exports, imports, domestic sales, and total sales of U.S. steel-consuming industries, 1985-88 . . . . . . . . . . . . . . . . . . . . . . . . . . . . . . . . . . . . . . . . . . . . . . . . . . . 2-3
3-1. Automotive industry: U.S. retail sales of domestic and imported passenger automobiles, trucks, and buses; and U.S. retail sales of imported passenger automobiles, trucks, and buses as a percent of total U.S. retail sales, 1980-88 . . . . . . . . . . . . . . . . . . . . . . . . . . . . . . . . 3-4
3-2. Automotive industry: U.S. imports, by principal sources, 1982-88 . . . . . . . . . . . . . . . . . . . . . . . . . . . . . . . . . . . . . . . . . . . . . . . . . . . . . . . . . . . . 3-4
3-3. Automotive industry: U.S. exports of domestic merchandise, by principal markets, 1980-88 . . . . . . . . . . . . . . . . . . . . . . . . . . . . . . . . . . . . . . . . . . 3-5
3-4. Fabricated Structural Steel: U.S. producers shipments, exports of domestic merchandise, imports for consumption, and apparent consumption, 1980-88 . . . . . . . . . . . . . . . . . . . . . . . . . . . . . . . . . . . . . . . . . . . . . . . . 3-7
3-5. Fabricated structural steel: U.S. imports, by principal sources, 1980-88 . . . . . . . . . . . . . . . . . . . . . . . . . . . . . . . . . . . . . . . . . . . . . . . . . . . . . . . . . . . . 3-8
3-6. Fabricated Structural Steel: U.S. exports, by principal markets, 1980-88 . . . . . . . . . . . . . . . . . . . . . . . . . . . . . . . . . . . . . . . . . . . . . . . . . . . . 3-8
3-7. Agricultural Machinery: U.S. producers' shipments, exports of domestic merchandise, imports for consumption, and apparent consumption, 1980-88 . . . . . . . . . . . . . . . . . . . . . . . . . . . . . . . . . . . . . . . . . . . . . . . . 3-11
3-8. Agricultural Machinery: U.S. imports, by principal sources, 1980-88 . . . . . . . . . . . . . . . . . . . . . . . . . . . . . . . . . . . . . . . . . . . . . . . . . . . . . . . . . . . . 3-12
3-9. Agricultural Machinery: U.S. exports, by principal markets, 1980-88 . . . . . . . . . . . . . . . . . . . . . . . . . . . . . . . . . . . . . . . . . . . . . . . . . . . . . . . . . . . . 3-12
3-10. Construction machinery and equipment industry: U.S. producers' shipments, imports for consumption, exports of domestic merchandise, and apparent consumption, 1980-88 . . . . . . . . . . . . . . . . . . . . . . . . . 3-14
3-11. Construction machinery and equipment industry: U.S. imports for consumption, by principal sources, 1980-88 . . . . . . . . . . . . . . . . . . . . . . . . . . . . 3-14
3-12. Construction machinery and equipment industry: U.S. exports of domestic merchandise, by principal markets, 1980-88 . . . . . . . . . . . . . . . . . . . . 3-14
3-13. Major household appliances industry: U.S. producers' shipments, exports of domestic merchandise, imports for consumption, and apparent consumption, 1984-88 . . . . . . . . . . . . . . . . . . . . . . . . . . . . . . . . . . . . . . . . 3-16
3-14. Major household appliances industry: U.S. imports for consumption, by principal sources, 1984-88 . . . . . . . . . . . . . . . . . . . . . . . . . . . . . . . . . . . . . . . . . . 3-17
3-15. Major household appliances industry: U.S. exports of domestic merchandise,_ by principal markets, 1984-88 . . . . . . . . . . . . . . . . . . . . . . . . . . . . . . 3-18
3-16. Forgings of iron or steel: U.S. producers shipments, imports for consumption, exports of domestic merchandise, and apparent consumption, 1980-88 . . . . . . . . . . . . . . . . . . . . . . . . . . . . . . . . . . . . . . . . 3-20
3-17. Forgings of iron or steel: U.S. import shares of principal suppliers, 1980-88 . . . . . . . . . . . . . . . . . . . . . . . . . . . . . . . . . . . . . . . . . . . . . . . . . . . 3-20
3-18. Forgings of iron or steel: U.S. export shares to principal markets, 1980-88 . . . . . . . . . . . . . . . . . . . . . . . . . . . . . . . . . . . . . . . . . . . . . . . . . . . . 3-21
v
CONTENTS-Continued
Page
Chapter 3. Other effects of the VRAs-Continued
Views on continuation of the VRAs . . . . . . . . . . . . . . . . . . . . . . . . . . . . . . . . . . . . . . . . . . . 3-12 Construction machinery and equipment:
Structure of the domestic industry . . . . . . . . . . . . . . . . . . . . . . . . . . . . . . . . . . . . . . . . . . . . 3-13 Conditions in the industry . . . . . . . . . . . . . . . . . . . . . . . . . . . . . . . . . . . . . . . . . . . . . . . . . . . 3-13 Trade patterns . . . . . . . . . . . . . . . . . . . . . . . . . . . . . . . . . . . . . . . . . . . . . . . . . . . . . . . . . . . . 3-13 Effects of the VRAs:
Supply and quality . . . . . . . . . . . . . . . . . . . . . . . . . . . . . . . . . . . . . . . . . . . . . . . . . . . . . . . 3-13 Prices . . . . . . . . . . . . . . . . . . . . . . . . . . . . . . . . . . . . . . . . . . . . . . . . . . . . . . . . . . . . . . . . . . 3-15 Competitiveness . . . . . . . . . . . . . . . . . . . . . . . . . . . . . . . . . . . . . . . . . . . . . . . . . . . . . . . . . . 3-15
Views on continuation of the VRAs . . . . . . . . . . . . . . . . . . . . . . . . . . . . . . . . . . . . . . . . . . . 3-15 Major household appliances:
Structure of the domestic industry . . . . . . . . . . . . . . . . . . . . . . . . . . . . . . . . . . . . . . . . . . . . 3-15 Conditions in the industry ............................ .,...._, . . . . . . . . . . . . . . . . . . . . 3-15 Trade patterns . . . . . . . . . . . . . . . . . . . . . . . . . . . . . . . . . . . . . . . . . . . . . . . . . . . . . . . . . . . . 3-16 Effects of the VRAs:
Supply and quality . . . . . . . . . . . . . . . . . . . . . . . . . . . . . . . . . . . . . . . . . . . . . . . . . . . . . . . 3-17 Prices . . . . . . . . . . . . . . . . . . . . . . . . . . . . . . . . . . . . . . . . . . . . . . . . . . . . . . . . . . . . . . . . . . 3-17 Competitiveness . . . . . . . . . . . . . . . . . . . . . . . . . . . . . . . . . . . . . . . . . . . . . . . . . . . . . . . . . . 3-17
Views on continuation of the VRAs . . . . . . . . . . . . . . . . . . . . . . . . . . . . . . . . . . . . . . . . . . . 3-18 The forging industry:
Structure of the domestic industry . . . . . . . . . . . . . . . . . . . . . . . . . . . . . . . . . . . . . . . . . . . . 3-18 Conditions in the industry . . . . . . . . . . . . . . . . . . . . . . . . . . . . . . . . . . . . . . . . . . . . . . . . . . . 3-19 Trade patterns . . . . ... . . . . . . . . . . . . . . . . . . . . . . . . . . . . . . . . . . . . . . . . . . . . . . . . . . . . . . . 3-19 Effects of the VRAs:
Prices ............... ; ........................................... ·. . . . . . . 3-21 Supply and quality . . . . . . . . . . . . . . . . . . . . . . . . . . . . . . ... . . . . . . . . . . . . . . . . . . . . . . . 3-21 Competitiveness . . . . . . . . . . . . . . . . . . . . . . . . . . . . . . . . . . . . . . . . . . . . . . . . . . . . . . . . . . 3-22
Views on Continuation of the VRAs . . . . . . . . . . . . . . . . . . . . . . . . . . . . . . . . . . . . . . . . . . . 3-22 The metal stamping industry:
Structure . . . . . . . . . . . . . . . . . . . . . . . . . . . . . . . . . . . . . . . . . . . . . . . . . . . . . . . . . . . . . . . . . 3-22 Conditions in the industry . . . . . . . . . . . . . . . . . . . . . . . . . . . . . . . . . . . . . . . . . . . . . . . . . . . 3-22 Trade patterns . . . . . . . . . . . . . . . . . . . . . . . . . . . . . . . . . . . . . . . . . . . . . . . . . . . . . . . . . . . . 3-23 Effects of the VRAs:
Supply and quality . . . . . . . . . . . . . . . . . . . . . . . . . . . . . . . . . . . . . . . . . . . . . . . . . . . . . . . 3-23 Prices . . . . . . . . . . . . . . . . . . . . . . . . . . . . . . . . . . . . . . . . . . . . . . . . . . . . . . . . . . . . . . . . . . 3-25 Competitiveness .............. : . . . . . . . . . . . . . . . . . . . . . . . . . . . . . . . . . . . . . . . . . . . 3-25
Views on continuation of the VRAs . . . . . . . . . . . . . . . . . . . . . . . . . . . . . . . . . . . . . . . . . . . 3-25 Other steel-consuming industries . . . . . . . . . . . . . . . . . . . . . . . . . . . . . . . . . . . . . . . . . . . . . . . 3-25
Companies in support of VRA extension . . . . . . . . . . . . . . . . . . . . . . . . . . . . . . . . . . . . . . . 3-25 Companies in opposition to VRA extension . . . . . . . . . . . . . . . . . . . . . . . . . . . . . . . . . . . . . 3-26
Appendixes:
iv
Appendix A. Letter from Chairman Gibbons of the Subcommittee on Trade of the House Ways and Means Committee to Acting Chairman Anne Brunsdale requesting this investigation . . . . . . . . . . . . . . . . . . . . . . . . . . . . . . . . A-1
Appendix B. Public notice of the Commission's investigation . . . . . . . . . . . . . . . . . . . . . . . . B-1 Appendix C. Calendar of public hearing . . . . . . . . . . . . . . . . . . . . . . . . . . . . . . . . . . . . . . . . . C-1 Appendix D. Methodology and data used to estimate the effects of
voluntary restraint agreements on exports, imports, and domestic sales in U.S. steel-consuming industries . . . . . . . . . . . . . . . . . . . . . . . . . . . . D-1
Appendix E. Estimated effects of VRAs on exports, imports, and _ domestic sales in 79 U.S. steel-consuming industries . . . . . . . . . . . . . . . . . . . . . . . . . E-1
Appendix F. U.S. Apparent consumption, producer's shipments, exports, and imports of certain steel mill and fabricated steel products . . . . . . . . . . . . . . . . . F-1
Executive Summary Steel imports into the United States are currently restricted by "voluntary restraint
agreements" (VRAs) with 19 major supplying nations and the European Community (EC) .1 By limiting steel imports, VRAs raise the price of steel in the U.S. market, which benefits the steel industry but raises production costs for steel-consuming industries.2
In this report, the Commission provides (1) estimates of the effects of the VRAs during 1985-88 on exports, imports, and domestic sales in steel-consuming industries in the United States,3,4 (2) an analysis of the likely future effects if the VRAs are extended in their current form, and (3) an analysis of other effects of the VRAs, focusing on seven major steel-consuming industries.
Effects of VRAs on Exports, Imports, and Domestic Sales, 1985-88
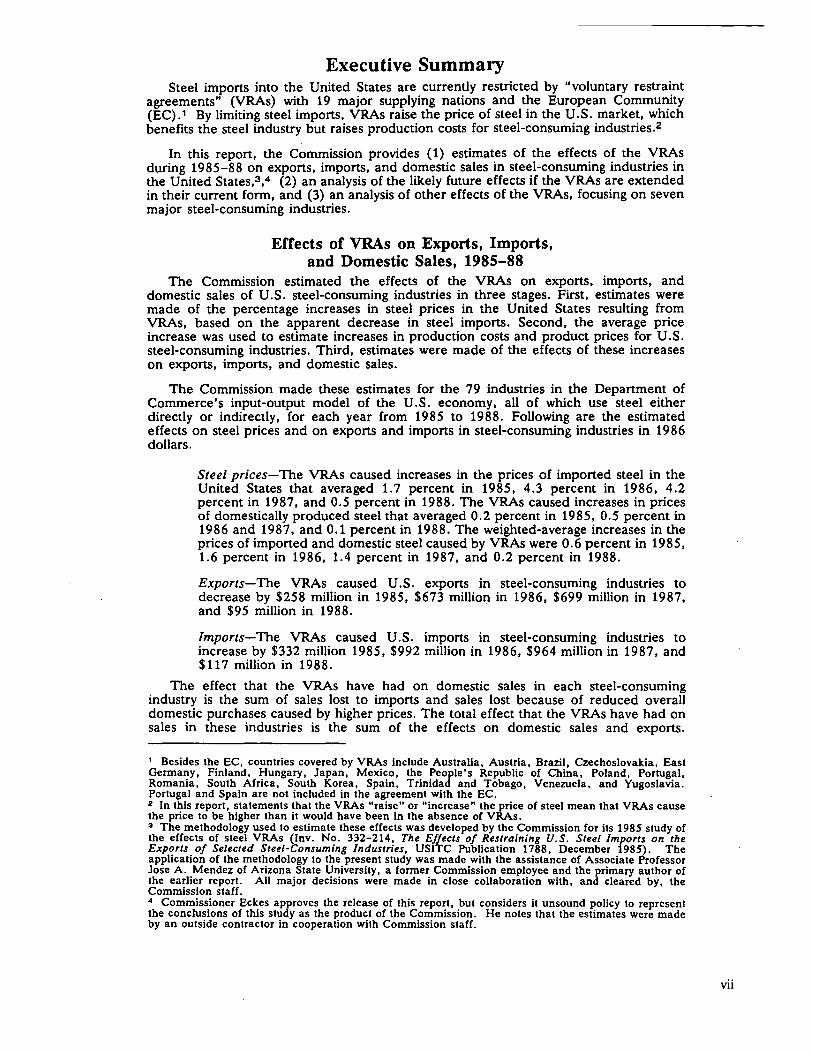
The Commission estimated the effects of the VRAs on exports, imports, and domestic sales of U.S. steel-consuming industries in three stages. First, estimates were made of the percentage increases in steel prices in the United States resulting from VRAs, based on the apparent decrease in steel imports. Second, the average price increase was used to estimate increases in production costs and product prices for U.S. steel-consuming industries. Third, estimates were made of the effects of these increases on exports, imports, and domestic sales.
The Commission made these estimates for the 79 industries in the Department of Commerce's input-output model of the U.S. economy, all of which use steel either directly or indirectly, for each year from 1985 to 1988. Following are the estimated effects on steel prices and on exports and imports in steel-consuming industries in 1986 dollars.
Steel prices-The VRAs caused increases in the prices of imported steel in the United States that averaged 1.7 percent in 1985, 4.3 percent in 1986, 4.2 percent in 1987, and 0.5 percent in 1988. The VRAs caused increases in prices of domestically produced steel that averaged 0.2 percent in 1985, 0.5 percent in 1986 and 1987, and 0.1 percent in 1988. The weighted-average increases in the prices of imported and domestic steel caused by VRAs were 0.6 percent in 1985, 1.6 percent in 1986, 1.4 percent in 1987, and 0.2 percent in 1988.
Exports-The VRAs caused U.S. exports in steel-consuming industries to decrease by $258 million in 1985, $673 million in 1986, $699 million in 1987, and $95 million in 1988.
Imports-The VRAs caused U.S. imports in steel-consuming industries to increase by $332 million 1985, $992 million in 1986, $964 million in 1987, and $117 million in 1988.
The effect that the VRAs have had on domestic sales in each steel-consuming industry is the sum of sales lost to imports and sales lost because of reduced overall domestic purchases caused by higher prices. The total effect that the VRAs have had on sales in these industries is the sum of the effects on domestic sales and exports.
1 Besides the EC, countries covered by VRAs include Australia, Austria, Brazil, Czechoslovakia, East Germany, Finland, Hungary, Japan, Mexico, the People's Republic of China, Poland, Portugal, Romania, South Africa, South Korea, Spain, Trinidad and Tobago, Venezuela, and Yugoslavia. Portugal and Spain are not included in the agreement with the EC. 2 In this report, statements that the VRAs "raise" or "increase" the price of steel mean that VRAs cause the price to be higher than it would have been in the absence of VRAs. 3 The methodology used to estimate these effects was developed by the Commission for its 1985 study of the effects of steel VRAs (Inv. No. 332-214, The Effects of Restraining U.S. Steel Imports on the Exports of Selected Steel-Consuming Industries, USITC Publication 1788, December 1985). The application of the methodology to -the present study was made with the assistance of Associate Professor Jose A. Mendez of Arizona State University, a former Commission employee and the primary author of the earlier report. All major decisions were made in close collaboration with, and cleared by, the Commission staff. 4 Commissioner Eckes approves the release of this report, but considers it unsound policy to represent the conclusions of this study as the product of the Commission. He notes that the estimates were made by an outside contractor in cooperation with Commission staff.
vii
viii
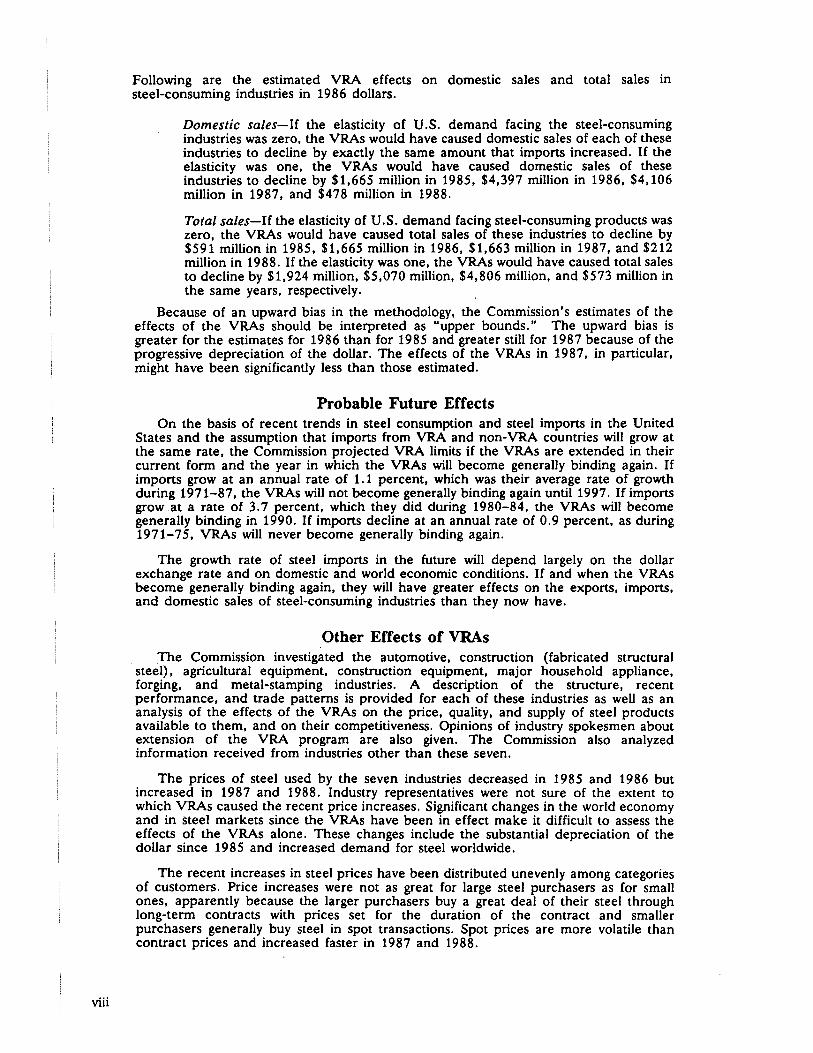
Following are the estimated VRA effects on domestic sales and total sales in steel-consuming industries in 1986 dollars.
Domestic sales-If the elasticity of U.S. demand facing the steel-consuming industries was zero, the VRAs would have caused domestic sales of each of these industries to decline by exactly the same amount that imports increased. If the elasticity was one, the VRAs would have caused domestic sales of these industries to decline by $1,665 million in 1985, $4,397 million in 1986, $4,106 million in 1987, and $478 million in 1988.
Total sales-If the elasticity of U.S. demand facing steel-consuming products was zero, the VRAs would have caused total sales of these industries to decline by $591 million in 1985, $1,665 million in 1986, $1,663 million in 1987, and $212 million in 1988. If the elasticity was one, the VRAs would have caused total sales to decline by $1,924 million, $5,070 million, $4,806 million, and $573 million in the same years, respectively.
Because of an upward bias in the methodology, the Commission's estimates of the effects of the VRAs should be interpreted as "upper bounds." The upward bias is greater for the estimates for 1986 than for 1985 and greater still for 1987 because of the progressive depreciation of the dollar. The effects of the VRAs in 1987, in particular, might have been significantly less than those estimated.
Probable Future Effects On the basis of recent trends in steel consumption and steel imports in the United
States and the assumption that imports from VRA and non-VRA countries will grow at the same rate, the Commission projected VRA limits if the VRAs are extended in their current form and the year in which the VRAs will become generally binding again. If imports grow at an annual rate of 1.1 percent, which was their average rate of growth during 1971-8 7, the VRAs will not become generally binding again until 1997. If imports grow .at a rate of 3.7 percent, which they did during 1980-84, the VRAs will become generally binding in 1990. If imports decline at an annual rate of 0.9 percent, as during 1971-75, VRAs will never become generally binding again.
The growth rate of steel imports in the future will depend largely on the dollar exchange rate and on domestic and world economic conditions. If and when the VRAs become generally binding again, they will have greater effects on the exports, imports, and domestic sales of steel-consuming industries than they now have.
Other Effects of VRAs . The Commission investigated the automotive, construction (fabricated structural steel), agricultural equipment, construction equipment, major household appliance, forging, and metal-stamping industries. A description of the structure, recent performance, and trade patterns is provided for each of these industries as well as an analysis of the effects of the VRAs on the price, quality, and supply of steel products available to them, and on their competitiveness. Opinions of industry spokesmen about extension of the VRA program are also given. The Commission also analyzed information received from industries other than these seven.
The prices of steel used by the seven industries decreased in 19 8 5 and 19 8 6 but increased in 19 8 7 and 19 8 8. Industry representatives were not sure of the extent to which VRAs caused the recent price increases. Significant changes in the world economy and in steel markets since the VRAs have been in effect make it difficult to assess the effects of the VRAs alone. These changes include the substantial depreciation of the dollar since 1985 and increased demand for steel worldwide.
The recent increases in steel prices have been distributed unevenly among categories of customers. Price increases were not as great for large steel purchasers as for small ones, apparently because the larger purchasers buy a great deal of their steel through long-term contracts with prices set for the duration of the contract and smaller purchasers generally buy steel in spot transactions. Spot prices are more volatile than contract prices and increased faster in 1987 and 1988.
The Commission received contradictory information about product quality from steel purchasers. Quality problems reportedly led to increased costs for some steel-consumers. Smaller steel purchasers reported quality problems more often than larger ones. ·
Steel became less readily available in 1987 and 1988 as demand increased. Besides raising prices, many U.S. producers rationed available supplies by lengthening lead times for delivery and imposing limitations on tonnage. Many purchasers perceived this as a "shortage" because they could not buy all they wanted at the market price and obtain timely deliveries. Some evidence suggests that the perception of a shortage of steel may itself have led to increased demand which made steel more difficult to obtain for a time.
Some steel consumers reported that they lost sales as a result of poor steel quality and insufficient supply.
Spokesmen for the agricultural equipment, construction equipment, major household appliance, forging, and metal-stamping industries generally oppose extension of the VRAs, although there are some exceptions in the first three industries. Spokesmen for the construction (fabricated structural steel) industry, which is itself covered by the VRAs, favor extension. In the automotive industry, only Chrysler expressed a preference one way or the other, and it favors extension. If the VRAs are extended, many believe they should be modified to allow greater flexibility in periods of unusual scarcity.
Among spokesmen from industries besides the seven who expressed their views to the Commission, nearly all who said that the VRAs have had beneficial effects and favor extension are covered by the VRAs. Spokesmen who indicated adverse effects and oppose extension include some from industries that are protected by the VRAs and some that are not.
Other Information in This Report This report also provides background information on the production and utilization
of steel in the United States, a description of the VRA program, and arguments that have been made in favor of and in opposition to extension of the program.
ix

Chapter 1
Introduction
The Purpose and Scope of This Study Steel imports into the United States are
currently limited by "voluntary restraint agreements" (VRAs) with most major foreign suppliers. When the limits set by the VRAs are binding, they reduce the supply of steel in the United States and thereby increase steel prices. Increased steel prices benefit the U.S. steel industry but harm other U.S. industries that use steel as an input in production.
The purpose of this study is to evaluate the effects of the steel VRAs on steel-consuming industries in the United States. The Commission provides estimates of the effects of these VRAs on the exports, imports, and domestic sales of steel-consuming industries during 1985-88 and projections of the likely future effects if the VRAs are extended in their current form. These estimates are made using the method developed by the Commission in its study of the effects of steel VRAs in 1985.1 A detailed explanation of this methodology is provided in appendix D.
This report also provides an analysis of other effects of the VRAs focusing on seven major steel-consuming industries, namely: automotive, construction, agricultural equipment, construction equipment, major household appliances, forging, and metal stamping.
Background Having been among the world's technological
leaders and a major steel producer and exporter for more than half a century, the United States became a net importer of steel in 1959, the year of a 4-month strike by steelworkers. Imports captured increasing shares of the U.S. market in the 1960s, reaching 16.7 percent in 1968.2 In
·that year, the United States Government negotiated limits on imports of certain steel products from Japan and six European nations. Import restrictions of some kind have been in force for most of the two decades since the implementation of those agreements in 1969 and have expanded to include more products and other foreign suppliers.
The Product Steel is a generic term for a v~riety of
iron-carbon alloys. Variations m the compositionof elements in steel products result in variations in such properties as hardness,
1 USITC Inves1igation No. 332-214, op. cit. 2 U.S. Depa_rt~ent of Commerce data as reported in Annual Stat1st1cal Report of the American Iron and Steel Institute, 1970, p.8.
strength, and resistance to corrosion, but in all cases the primary element in terms of weight is iron. Steel is often categorized as either carbon or alloy. Two important grades of alloy steel are stainless and tool, which are collectively referred to as "specialty" steels. Steel products are classified by their sizes and shapes and by whether they will be processed into other steel products before being used. For the purposes of the this study, semifinished steel products include ingots, blooms and billets, and slabs. Finished steel products include sheets and strips, plates, bars, wire rod, wire and wire products, rails and accessories, and pipes and tubes, and structural shapes and units.
Steel products are used either directly or indirectly in the production of nearly all manufactured goods. U.S. apparent consumption of steel was just over 90 million short tons in 1987 or 738 pounds per person. In that year, the United States shipped 76.5 million short tons of steel, which generated sales of $28.9 billion. The steel industry currently employs 169,000 workers.3
The VRA Program Following a presidential directive on steel
policy issued on September 18, 1984, the U.S. Go~ernment negotiated VRAs with 19 supplying nations. Those agreements supplemented the VRA made with the EC in 1982.4 The VRAs limit imports of a variety of steel products, with product coverage varying by country. In some cases, the agreement specifies market share limits. as a percentage of projected U.S. apparent consumption. In other cases, the agreement sets unchanging quantitative limits. Some countries are subject to both kinds of restrictions for different products. More detailed information on the VRAs, including market share and quantitative limits by country and product coverage by country, is provided in appendix G. . ~e ~ program is ~ore flexible than many
trad1t1onal import quotas m three respects. First, the VRA quotas that are based on market shares allow imports to vary with the level of domestic demand. Second, countries that underfill their quotas in one year are often allowed to carry forward at least part of the unused portion to the next year. Both of these provisions enable increased imports in periods of greater scarcity.
3 U.S. International Trade Commission, "Monthly Report on the Status of the Steel Industry," February 1989, USITC Publication 2153, p. 1. 4 T.he V~ with the EC does not apply to Portugal and Spam which were not members of the EC in 1982. Imports from Portugal and Spain are restricted by ~eparate agreei_nents that remained in force after they JOmed the EC m 1986. Other countries covered by VRAs include Australia, Austria Brazil Czechoslova~ia, East Germ.any, Finland'. Hungary, Japan, _MeXIco, the ~eople s Republic of China, Poland, Romania, South Afnca, South Korea, Trinidad and Tobago, Venezuela, and Yugoslavia.
1-1
The third flexibility of the VRA program is that it allows waivers of import limits for products that are found to be in "short supply" in the United States. Petitions for these waivers are usually made by individual companies. If the Department of Commerce approves, it issues the petitioner a license to import the product from a specified foreign supplier in excess of that country's export limit. As of February 7, 1989, 9 6 short supply waivers had been approved, totaling about 1.4 million tons.1
The VRAs are scheduled to expire on September 30, 1989. The U.S. Government is currently considering extending them, possibly in a revised form.
The Commission's Study in 1985
At the request of the Senate Finance Committee in 1985, the Commission investigated the probable effects that the steel program would have on the exports of steel-consuming industries.2 At that time, most of the VRAs had just been negotiated. The Commission estimated the probable effects by first comparing the restricted import levels for 1985-89 with hypothetical import levels that would have occurred if foreign suppliers had maintained their 1984 market share for finished steel products and if they had reached an estimated import level for semifinished steel products.3 Based on the difference between the actual and hypothetical import levels, the Commission estimated the effects on steel prices and production costs and the consequent effects on sales prices and foreign sales in 79 steel-consuming industries.
The Commission estimated that the steel VRAs would raise steel prices in the United States by an average of 2.9 percent in each year during 1984-89 and that they would reduce exports by $903 million in 1985 and by progressively greater amounts in the following years up to a reduction of $5.627 billion in 1989, representing 1.92 percent of U.S. exports.
The Commission also estimated the effects of the VRA with the EC for the two years it had already been in effect, 1983 and 1984.4 The Commission estimated that the VRA reduced U.S. exports of steel-using industries by $189 million in 1983 and by $402 million in 1984.
1 A discussion of the flexibility of steel VRAs and its effects is given in David J. Cantor, "Steel Imports: Are the VRA Countries Filling Their Quotas?," Congressional Research Service, Washington, DC, February 1989. 2 See USITC Investigation No. 332-214, op. cit. 3 In making its estimates of effects, the Commission did not consider the VRAs with Austria, the People's Republic of China, Portugal, Trinidad and Tobago, and Yugoslavia, which had not been negotiated at that time. 'A slightly different methodology was used. For an explanation see USITC Investigation No. 332-214.
1-2
In addition, the Commission analyzed in depth the effects of steel VRAs in four major steel-consuming industries-namely, ball and roller bearings, construction machinery and equipment, pipes and tubes, and steel shipping drums and barrels. In general, the Commission found that VRAs had or probably would increase production costs in these industries and thus tend to decrease exports and encourage capital to move offshore.
The Commission cautioned, however, that its estimates were "worst case" estimates; the actual effects of the VRAs might be smaller. The Commission also noted that it was not possible to take into consideration exchange rate changes that might occur during the study period and that a significant . depreciation of the dollar would mitigate the effects of the VRAs. After early 1985, the dollar did depreciate substantially against the currencies of many major steel exporters:
Views on Extension of the VRAs A wealth of opinions have been expressed in
public forums about the wisdom of extending the VRAs.
Arguments for extension Four main arguments have been advanced for
extending the VRA program. The first is that VRAs are an appropriate response to alleged unfair trade practices by foreign suppliers.s This argument has three variants, namely that (1) it would be unfair for the domestic steel producers to have to compete with imports that are being dumped or subsidized, (2) the imposition of VRAs would give U.S. negotiators something to trade in exchange for agreements to mitigate these unfair trade practices by steel exporters, and (3) without VRAs, import penetration will increase enough to injure seriously the U.S. steel industry and such injury would be harmful to U.S. national interests.a
The second argument is that the steel industry needs several more years of ensured limits on imports to enable it to continue to modernize and improve efficiency in order to become or remain internationally competitive. 7
11 The Department of Commerce has determined that foreign steel has been dumped in the U.S. market or that its sale has been subsidized in numerous cases in the 1980s involving more than a score of supplying nations. 11 See the testimony of James F. Collins and William J. Pendleton to the Commission, Mar. 10, 1989, and written statements to the Commission by Charles 0. Verrill, Jr., et. al. on behalf of the Georgetown Steel Corp., Raritan River Steel Co., and certain other producers of carbon steel wire rod, Mar. 17, 1989, and the Maytag Corp., McLean, VA, Mar. 16, 1989. 7 Putnam, Hayes & Bartlett, Inc., "Economic Effects of Extending Steel VRAs," prepared for the American Iron and Steel Institute, Washington, DC, February 1989; American Iron and Steel Institute, "White Paper on Steel VRAs," Washington, DC. See also the testimony of Thomas Parkinson, James F. Collins, and Roger Schagrin to the Commission, Mar. 10, 1989.
The third argument is that without the VRAs the domestic steel industry will petition for relief under the U.S. trade laws and that the results would be more costly to both the industry and consumers. 1
The fourth argument, which is largely a rebuttal of arguments made by opponents of extension, is that VRAs have benefited the steel industry and have not caused higher steel prices or otherwise injured steel consumers.2
There are some who advocate extension of VRAs with modifications of their duration, product or country coverage, or other provisions.3
Arguments against extension The main argument against extending the
VRAs is that they generate costs to the economy that exceed their benefits; that is, that the costs to consumers and to steel-consuming industries is
- greater than the benefits to the steel industry. 4
1 Alan W. Wolff, statement before the DC Bar, Mar. 15, 1989. See also the written statement to the Commission by Charles 0. Verrill, Jr. , et al. , op. cit. , American Iron and Steel Institute, op. cit. 2 Putnam, Hayes & Bartlett, Inc., op. cit. See also the testimony of Roy A. Herman, Paul J. Darling, George Vary, and William J. Pendleton to the Commission, Mar. 10, 1989, and the written statement to the Commission by Charles 0. Verrill, Jr., et al., op. cit., and Alan W. Wolff, op. cit. 3 See the statement to the Commission by Andrew G. Sharkey, III, and David S. Soble, the Steel Service Center Institute, Washington, DC, Mar. 17, 1989. ' See the testimony of Frederick Hall, William C. Lane, and A. L. Leffler to the Commission, Mar. 10, 1989.
Apart from the effect on prices, some observers argue that the VRAs have reduced the quality of steel available to steel users, increased delivery lead times, and in some cases made steel products unavailable altogether.s,e
A second argument is that the U.S. steel industry does not now need protection because depreciation of the dollar and recent improvements in efficiency have made the U.S. steel industry competitive in the world market. Advocates of this argument cite the industry's recent record of profitability and increased steel exports. 7
A third argument is that if foreign suppliers are engaging in or are benefiting from unfair trade practices, as is alleged, a better policy would be to allow the injured industries to seek relief under U.S. trade laws.a
0 See the testimony of Patrick Thompson and Anthony J. Rose to the Commission, Mar. 10, 1989, and written statements to the Commission of the Steel Service Center Institute, Washington, DC, Mar. 17, 1989, S.E. Koehle of the Berg Steel Pipe Corp., Panama City, FL, Mar. 17, 1989, the Spring Manufacturers Institute, Inc., Wheeling, IL, Mar. 16, 1989, and Rockwell International Corp./Automotive Operations, Troy Ml, Mar. 17, 1989, 0 A detailed discussion of the costs of the steel program is provided in "Rebuilding American Manufacturing in the 1990s: the Case Against Steel VRAs," the Stern Group, Inc., Washington, DC, February 1989. 7 The Stern Group, Ibid., pp. 42-48. 8 Gary Hufbauer, "Trade Policy for Troubled Industries," International Institute of Economics, Washington, DC, March 1986.
1-3

Chapter 2
The Effects of VRAs on Exports, Imports and Domestic Sales of
U.S. Steel-Consuming Industries
Overview of the Methodology Used to Estimate the Effects in 1985-88 and the
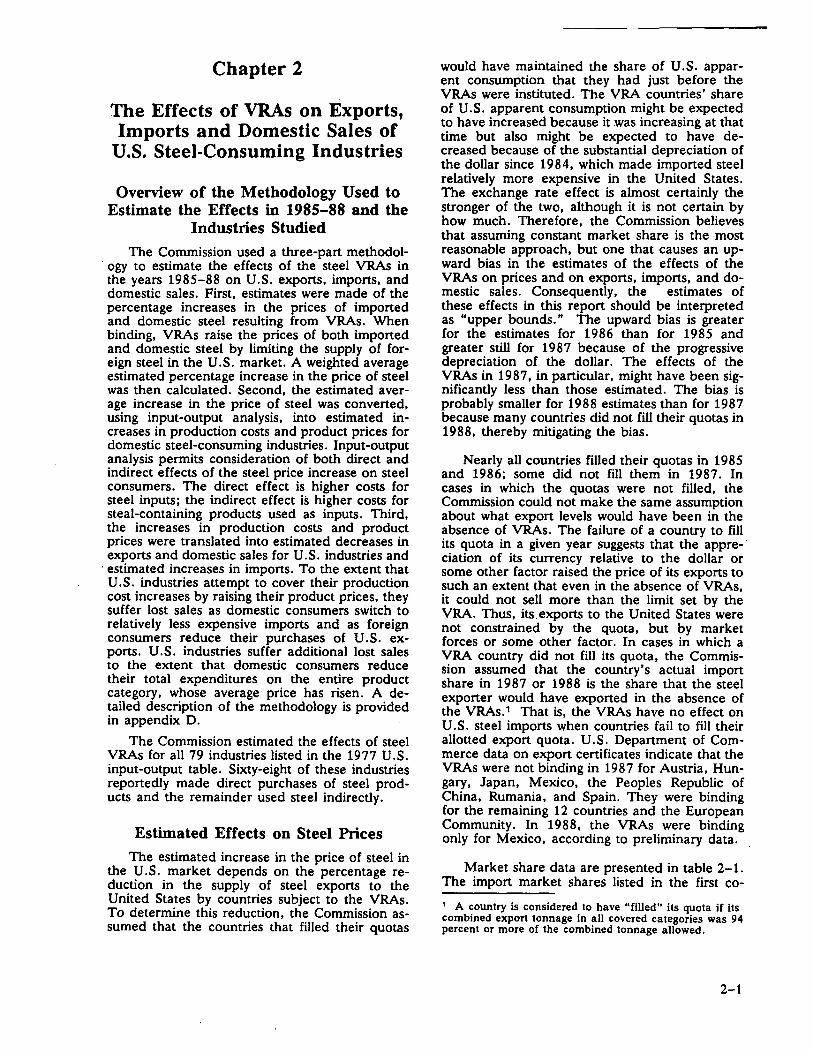
Industries Studied The Commission used a three-part methodol-
. ogy to estimate the effects of the steel VRAs in the years 1985-88 on U.S. exports, imports, and domestic sales. First, estimates were made of the percentage increases in the prices of imported and domestic steel resulting from VRAs. When binding, VRAs raise the prices of both imported and domestic steel by limiting the supply of foreign steel in the U.S. market. A weighted average estimated percentage increase in the price of steel was then calculated. Second, the estimated average increase in the price of steel was converted, using input-output analysis, into estimated increases in production costs and product prices for domestic steel-consuming industries. Input-output analysis permits consideration of both direct and indirect effects of the steel price increase on steel consumers. The direct effect is higher costs for steel inputs; the indirect effect is higher costs for steal-containing products used as inputs. Third, the increases in production costs and product prices were translated into estimated decreases in exports and domestic sales for U.S. industries and
· estimated increases in imports. To the extent that U.S. industries attempt to cover their production cost increases by raising their product prices, they suffer lost sales as domestic consumers switch to relatively less expensive imports and as foreign consumers reduce their purchases of U.S. exports. U.S. industries suffer additional lost sales to the extent that domestic consumers reduce their total expenditures on the entire product category, whose average price has risen. A detailed description of the methodology is provided in appendix D.
The Commission estimated the effects of steel VRAs for all 79 industries listed in the 1977 U.S. input-output table. Sixty-eight of these industries reportedly made direct purchases of steel products and the remainder used steel indirectly.
Estimated Effects on Steel Prices The estimated increase in the price of steel in
the U.S. market depends on the percentage reduction in the supply of steel exports to the United States by countries subject to the VRAs. To determine this reduction, the Commission assumed that the countries that filled their quotas
would have maintained the share of U.S. apparent consumption that they had just before the VRAs were instituted. The VRA countries' share of U.S. apparent consumption might be expected to have increased because it was increasing at that time but also might be expected to have decreased because of the substantial depreciation of the dollar since 1984, which made imported steel relatively more expensive in the United States. The exchange rate effect is almost certainly the stronger of the two, although it is not certain by how much. Therefore, the Commission believes that assuming constant market share is the most reasonable approach, but one that causes an upward bias in the estimates of the effects of the VRAs on prices and on exports, imports, and domestic sales. Consequently, the estimates of these effects in this report should be interpreted as "upper bounds." The upward bias is greater for the estimates for 1986 than for 1985 and greater still for 19 8 7 because of the progressive depreciation of the dollar. The effects of the VRAs in 1987, in particular, might have been significantly less than those estimated. The bias is probably smaller for 1988 estimates than for 1987 because many countries did not fill their quotas in 1988, thereby mitigating the bias.
Nearly all countries filled their quotas in 1985 and 1986; some did not fill them in 1987. In cases in which the quotas were not filled, the Commission could not make the same assumption about what export levels would have been in the absence of VRAs. The failure of a country to fill its quota in a given year suggests that the appre- · ciation of its currency relative to the dollar or some other factor raised the price of its exports to such an extent that even in the absence of VRAs, it could not sell more than the limit set by the VRA. Thus, its exports to the United States were not constrained by the quota, but by market forces or some other factor. In cases in which a . VRA country did not fill its quota, the Commission assumed that the country's actual import share in 1987 or 1988 is the share that the steel exporter would have exported in the absence of the VRAs. 1 That is, the VRAs have no effect on U.S. steel imports when countries fail to fill their allotted export quota. U.S. Department of Commerce data on export certificates indicate that the VRAs were not binding in 1987 for Austria, Hungary, Japan, Mexico, the Peoples Republic of China, Rumania, and Spain. They were binding for the remaining 12 countries and the European Community. In 19 8 8, the VRAs were binding only for Mexico, according to preliminary data.
Market share data are presented in table 2-1. The import market shares listed in the first co-
1 A country is considered to have "filled" its quota if its combined export tonnage in all covered categories was 94 percent or more of the combined tonnage allowed.
2-1
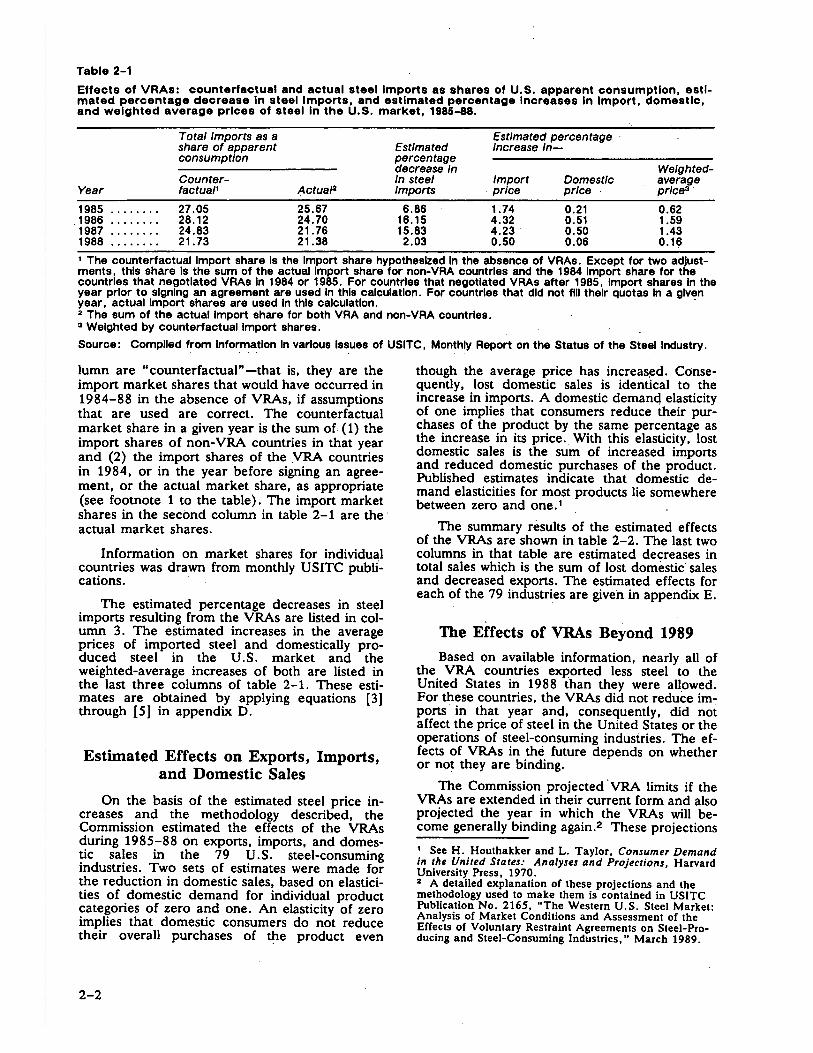
Table 2-1
Effects of VRAs: counterfactual and actual steel Imports as shares of U.S. apparent consumption, estimated percentage decrease In steel Imports, and estimated percentage Increases In Import, domestic, and weighted average prices of steel In the U.S. market, 1985-88.
Total Imports as a Estimated percentage share of apparent Estimated Increase In-consumption percentage
decrease In Weighted-Counter- In steel Import Domestic average
Year factua11 ,l\ctual2 Imports price price prlce3 ·
1985 ........ 27.05 25.67 6.86 1.74 0.21 0.62 1986 ........ 28.12 24.70 16.15 4.32 0.51 1.59 1987 ........ 24.83 21.76 15.83 4.23 0.50 1.43 1988 ........ 21.73 21.38 2.03 0.50 0.06 0.16 1 The counterfactual Import share Is the Import share hypothesized In the absence of VRAs. Except for two adjustments, this share Is the sum of the actual Import share for non-VRA countries and the 1984 Import share for the countries that negotiated VRAs In 1984 or 1985. For countries that negotiated VRAs after 1985, Import shares In the year prior to signing an agreement are used In this calculation. For countries that did not fill their quotas In a given year, actual Import shares are used In this calculatlon. · 2 The sum of the actual Import share for both VRA and non-VRA countries. 3 Weighted by counterfactual Import shares.
Source: Compiled from Information In various Issues of USITC, Monthly Report on the Status of the Steel Industry.
lumn are "counterfactual"-that is, they are the import market shares that would have occurred in 1984-88 in the absence of VRAs, if assumptions that are used are correct. The counterfactual market share in a given year is the sum of ( 1) the import shares of non-VRA countries in that year and (2) the import shares of the VRA countries in 1984, or in the year before signing an agreement, or the actual market share, as appropriate (see footnote 1 to the table). The import market shares in the second column in table 2-1 are the · actual market shares.
Information on market shares for individual countries was drawn from monthly USITC publi-cations. ·
The estimated percentage decreases in steel imports resulting from the VRAs are listed in column 3. The estimated increases in the average prices of imported steel and domestically produced steel in the U.S. market and · the weighted-average increases of both are listed in the last three columns of table 2-1. These estimates are obtained by applying equations [3] through [ 5] in appendix D.
Estimated Effects on Exports, Imports, and Domestic Sales
On the basis of the estimated steel price increases and the methodology described, the Commission estimated the effects of the VRAs during 1985-88 on exports, imports, and domestic sales in the 79 U.S. steel-consuming industries. Two sets of estimates were made for the reduction in domestic sales, based on elasticities of domestic demand for individual product categories of zero and one. An elasticity of zero implies that domestic consumers do not reduce their overall purchases of ~e product even
2-2
though the average price has increas~d. Consequently, lost domestic sales is identical to the increase in imports. A domestic demanq elasticity of one implies that consumers reduce their purchases of the product by the same percentage as the increase in its price. With this elasticity, lost domestic sales is the sum of increased imports and reduced domestic purchases of the product. Published estimates indicate that domestic demand elasticities for most products lie somewhere between zero and one. 1
The summary results of the estimated effects of the VRAs are shown in table 2-2. The last two columns in that table are estimated decreases in total sales which is the sum of lost domestic· sales and decreased exports. The estimated effects for each of the 79 industries are given in appendix E.
. .
The Effects of VRAs Beyond 1989
Based on available information, nearly. all of the VRA · countries exported less steel to the United States in 1988 than they were allowed. For these countries, the VRAs did not reduce imports in that year and, consequently, did not affect the price of steel in the United States or the operations of steel-consuming industries. The effects of VRAs in the future depends on whether or not they are binding.
The Commission projected 'VRA limits if the VRAs are extended in their current form and also projected the year in which the VRAs will become generally binding again.2 These projections 1 See H. Houthakker and L. Taylor, Consumer Demand in the United States: Analyses and Projections, Harvard University Press, 1970. 2 A detailed explanation of these projections and the methodology used to make them is contained in USITC Publication No. 2165, "The Western U.S. Steel Market: Analysis of Market Conditions and Assessment of the Effects of Voluntary Restraint Agreements on Steel-Producing and Steel-Consuming Industries," March 1989.
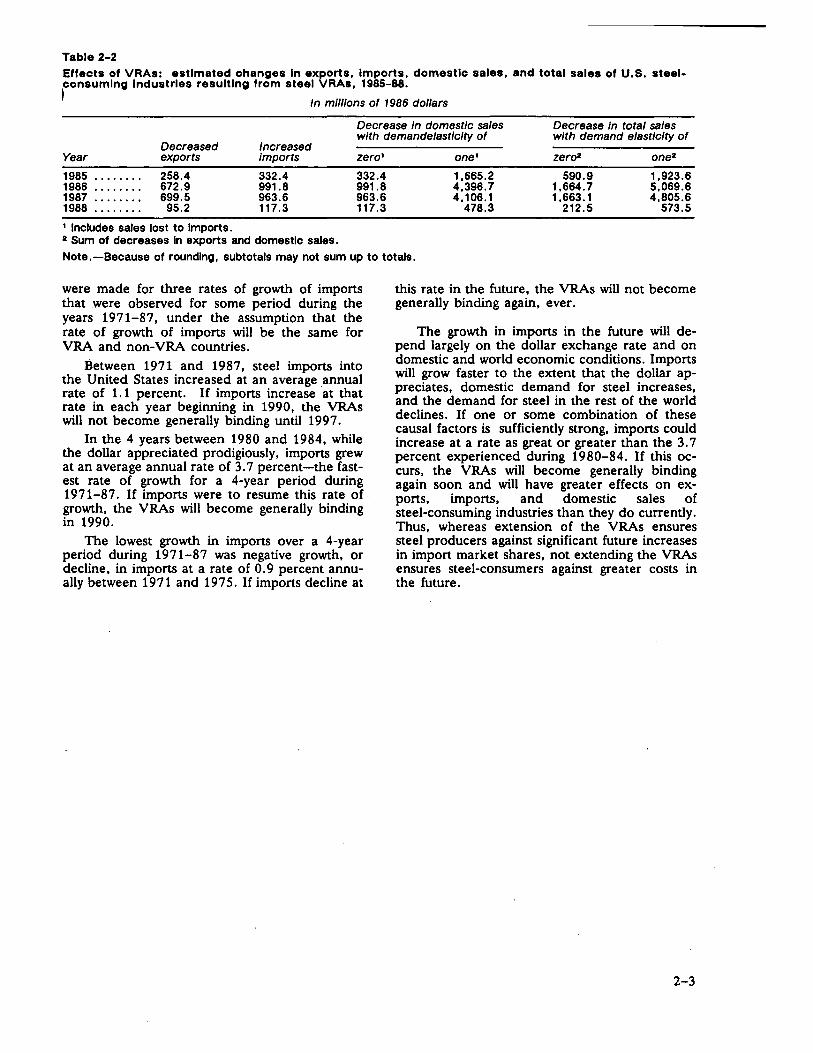
Table 2-2 Effects of VRAs: estimated changes In exports, Imports, domestic sales, and total sales of U.S. steelconsuming Industries resultlng from steel VRAs, 1985-88.
~ In ml/lions of 1986 dollars
Decrease In domestic sales with demandelastlclty of
Decrease In total sales with demand elasticity of
Decreased Increased Year exports Imports
1985 ........ 258.4 332.4 1986 ........ 672.9 991.8 1987 ........ 699.5 963.6 1988 ........ 95.2 117 .3
1 Includes sales lost to Imports. 2 Sum of decreases In exports and domestic sales.
zero1 one1
332.4 1,665.2 991.8 4,396.7 963.6 4, 106.1 117.3 478.3
zera2
590.9 1,664. 7 1,663.1
212.5
one2
1,923.6 5,069.6 4,805.6
573.5
Note. -Because of rounding, subtotals may not sum up to totals.
were made for three rates of growth of imports that were observed for some period during the years 1971-87, under the assumption that the r;lte of growth of imports will be the same for VRA and non-VRA countries.
Between 1971 and 1987, steel imports into the United States increased at an average annual rate of 1.1 percent. If imports increase at that rate in each year beginning in 1990, the VRAs will not become generally binding until 1997.
In the 4 years between 1980 and 1984, while the dollar appreciated prodigiously, imports grew at an average annual rate of 3. 7 percent-the fastest rate of growth for a 4-year period during 1971-87. If imports were to resume this rate of. growth, the VRAs will become generally binding in 1990.
The lowest growth in imports over a 4-year period during 1971-87 was negative growth, or decline, in imports at a rate of 0.9 percent annually between 1971 and 1975. If imports decline at
this rate in the future, the VRAs will not become generally binding again, ever.
The growth in imports in the future will depend largely on the dollar exchange rate and on domestic and world economic conditions. Imports will grow faster to the extent that the dollar appreciates, domestic demand for steel increases, and the demand for steel in the rest of the world declines. If one or some combination of these causal factors is sufficiently strong, imports could increase at a rate as great or greater than the 3. 7 percent experienced during 1980-84. If this occurs, the VRAs will become generally binding again soon and will have greater effects on exports, imports, and domestic sales of steel-consuming industries than they do currently. Thus, whereas extension of the VRAs ensures steel producers against significant future increases in import market shares, not extending the VRAs ensures steel-consumers against greater costs in the future.
2-3

Chapter 3
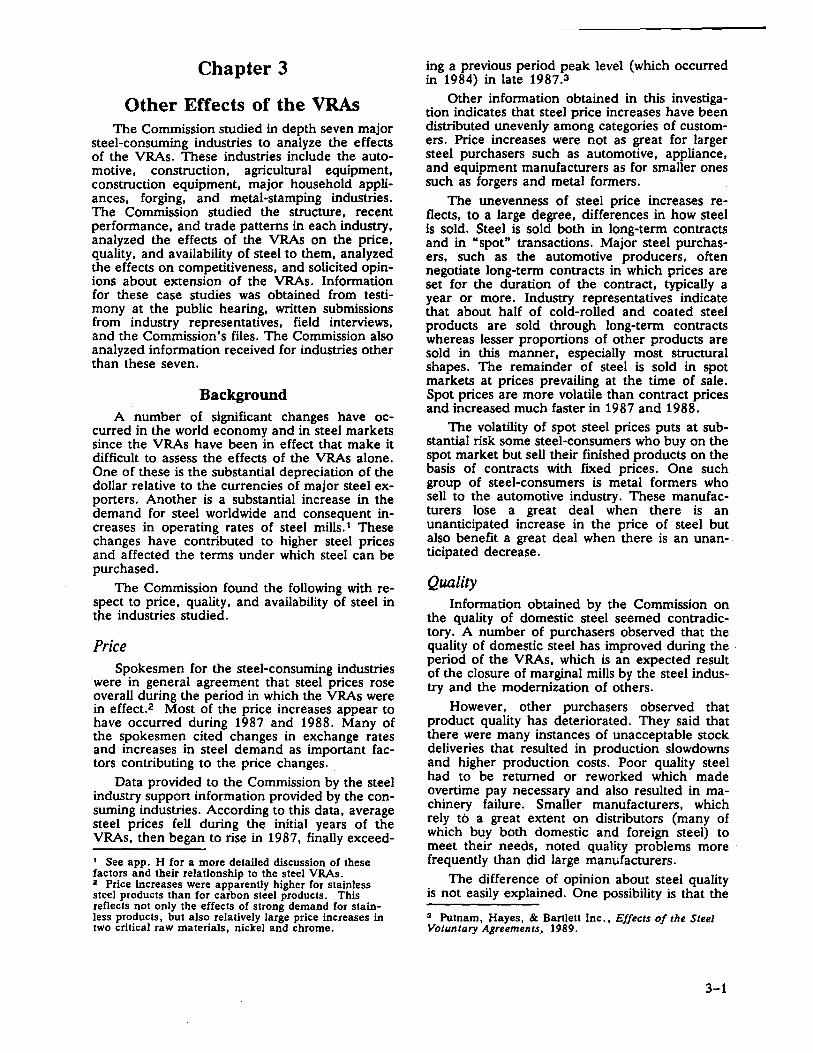
Other Effects of the VRAs The Commission studied in depth seven major
steel-consuming industries to analyze the effects of the VRAs. These industries include the automotive, construction, agricultural equipment, construction equipment, major household appliances, forging, and metal-stamping industries. The Commission studied the structure, recent performance, and trade patterns in each industry, analyzed the effects of the VRAs on the price, quality, and availability of steel to them, analyzed the effects on competitiveness, and solicited opinions about extension of the VRAs. Information for these case studies was obtained from testimony at the public hearing, written submissions from industry representatives, field interviews, and the Commission's files. The Commission also analyzed information received for industries other than these seven.
Background A number of significant changes have oc
curred in the world economy and in steel markets since the VRAs have been in effect that make it difficult to assess the effects of the VRAs alone. One of these is the substantial depreciation of the dollar relative to the currencies of major steel exporters. Another is a substantial increase in the demand for steel worldwide and consequent increases in operating rates of steel mills. 1 These changes have contributed to higher steel prices and affected the terms under which steel can be purchased.
The Commission found the following with respect to price, quality, and availability of steel in die industries studied.
Price Spokesmen for the steel-consuming industries
were in general agreement that steel prices rose overall during the period in which the VRAs were in effect.2 Most of the price increases appear to have occurred during 1987 and 1988. Many of the spokesmen cited changes in exchange rates and increases in steel demand as important factors contributing to the price changes ..
Data provided to the Commission by the steel industry support information provided by the consuming industries. According to this data, average steel prices fell during the initial years of the VRAs, then began to rise in 1987, finally exceed-
1 See app. H for a more detailed discussion of these factors and their relationship to the steel VRAs. 2 Price increases were apparently higher for stainless steel products than for carbon steel products. This reflects not only the effects of strong demand for stainless products, but also relatively large price increases in two critical raw materials, nickel and chrome.
ing a previous period peak level (which occurred in 1984) in late 1987.3
Other information obtained in this investigation indicates that steel price increases have been distributed unevenly among categories of customers. Price increases were not as great for larger steel purchasers such as automotive, appliance, and equipment manufacturers as for smaller ones such as forgers and metal formers.
The unevenness of steel price increases reflects, to a large degree, differences in how steel is sold. Steel is sold both in long-term contracts and in "spot" transactions. Major steel purchasers, such as the automotive producers, often negotiate long-term contracts in which prices are set for the duration of the contract, typically a year or more. Industry representatives indicate that about half of cold-rolled and coated steel products are sold through long-term contracts whereas lesser proportions of other products are sold in this manner, especially most structural shapes. The remainder of steel is sold in spot markets at prices prevailing at the time of sale. Spot prices are more volatile than contract prices and increased much faster in 19 8 7 and 19 8 8.
The volatility of spot steel prices puts at substantial risk some steel-consumers who buy on the spot market but sell their finished products on the basis of contracts with fixed prices. One such group of steel-consumers is metal formers who sell to the automotive industry. These manufacturers lose a great deal when there is an unanticipated increase in the price of steel but also benefit a great deal when there is an unan- . ticipated decrease.
Quality Information obtained by the Commission on
the quality of domestic steel seemed contradictory. A number of purchasers observed that the quality of domestic steel has improved during the . period of the VRAs, which is an expected result of the closure of marginal mills by the steel industry and the modernization of others.
However, other purchasers observed that product quality has deteriorated. They said that there were many instances of unacceptable stock deliveries that resulted in production slowdowns and higher production costs. Poor quality steel had to be returned or reworked which made overtime pay necessary and also resulted in machinery failure. Smaller manufacturers, which rely to a great extent on distributors (many of which buy both domestic and foreign steel) to meet their needs, noted quality problems more · frequently than did large manufacturers.
The difference of opinion about steel quality is not easily explained. One possibility is that the
3 Putnam, Hayes, & Bartlett Inc., Effects of the Steel Voluntary Agreements, 1989.
3-1
better production facilities were used during the period of low operating rates and that subsequent use of poorer facilities occurred during the market upswing. Another possibility is that steel buyers found that they could not obtain adequate supplies form their traditional suppliers when the market tightened and that other suppliers proved less satisfactory. A number of forgers indicated that this happened to producers in their industry. A third possibility is that quality control may, in some cases, have become less effective as mill operating rates increased.
Another quality issue that Commission staff discussed with producers and purchasers (primarily service center representatives) is the interaction between primary and secondary steel markets. 1 Some industry representatives advised the Commission staff that when steel demand is weak, steel producers sometimes sell prime material in the secondary market in order to maintain efficient scales of operation. During periods of strong demand producers reduce sales in the secondary market for two reasons. First, steel purchasers in the primary market might· be less likely to reject material and rejected steel is a source of supply to the secondary market. Second, producers are less likely to sell materials initially in the secondary market. Thus, during strong markets, the quality of the available secondary steel may decline.
Availability Steel-consumers have sometimes had diffi
culty finding steel products available for purchase while the VRAs have been in effect. Short supply requests that have been filed with the Department of Commerce are evidence of this.
Availability became a greater problem in 1987 and 1988, when the domestic steel industry's operating . rates increased significantly. From the purchasers' perspective, the tightened market and the effects of the VRAs resulted in ·shortages of certain products and a subsequent disruption in their respective operations. This, in fact, does appear to have occurred in certain instances.
In response to increased demand, steel producers were in the position of having to decide how to ration available supply. Besides raising prices, industry sources indicate that producers generally did this by lengthening lead times for delivery and imposing limitations on tonnage. Because they could not buy all the steel they wanted at the market price and obtain timely deliveries, purchasers believed that there was a "shortage" of steel. Producers, however, viewed the rationing system as simply a way to ensure that they could supply customers with their historical tonnage on a continuous basis. ·
1 Secondary steel is steel which does not meet certain standards and therefore is not sold ~ prime material.
3-2
As a result of problems associated with steel supply, a number of consumers indicated that they lost sales. As discussed above, it is difficult to determine the extent to which these problems would have occurred in the absence of the VRAs. In light of the underfilling of quotas in 1988, it seems unlikely that the VRAs were a significant cause in that year. The degree to which VRAs caused availability problems and lost sales is less clear for 19 8 7, when quota utilization rates were higher and domestic steel industry operating rates were rising.
With regard to the nature and significance of supply problems, information provided by the Steel Service Center Institute (SSCI) and the National Association of Purchasing Management (NAPM) indicates that the perception that steel was in short supply caused some manufacturers to purchase additional inventories, which may have exacerbated any existing imbalances.
None of the NAPM companies surveyed during January 1985 through August 1986 believed that inventories were too low.2 By November of 1987, however, 23 percent believed it was. In 1988, however, the number of companies reporting insufficient inventories decreased and the number reporting excess inventories increased. A similar series of opinions about inventories was reported for steel service centers.
Trends in inventories of steel plate, which had one of the more active markets during 1987 and 1988 lend further support to this assessment. Data compiled by the SSCJ3 show that plate inventories declined in tonnage during 1987; the decline was sharper in terms of the number of months supply as shipments were increasing. During 1988 inventories increased markedly, exceeding those for all other carbon steel products by a substantial margin. The peak was reached in July of 1988 when 5.6 months of inventory were held; this compares with an average inventory level of about 3.5 months in early 1987.
Following are our findings for the seven industries.
The Automotive Industry
Structure of the domestic industry
The majority of the 60 major auto- and truckassembly facilities located in the United States are situated in the midwestem States of Ohio, Michi-
2 Surveys are conducted on a monthly basis. 3 Service centers are the single largest market for steel producers; in 1987 about 43 percent of domestic shipments classified by the industry were shipped to this segment.
gan, Illinois, Missouri, Kentucky, and Tennessee.1 The industry is highly concentrated; about 90 percent of these facilities are owned by three companies-General Motors, Corp. (GM), Ford Motor Co., and Chrysler Corp. The remaining 10 percent is owned by other domestic companies and by Japanese producers who have ~stab~shed assembly plants in a number of locations m the United States.
Employment in the industry has ~een relatively . stable in recent years, ~angmg from approximately 299,000 employees m 1983 to an estimated 309,000 employees in 1988.2 Improvements in productivity attained thr~ugh the modernization of factories and streamlined production processes have moderated the increase in employment in the years since the 1980-82 recession.
The U.S. automotive industry is one of the single largest end users of steel, purchasing 11.3 million tons of steel directly from domestic producers in 1987, (or about 15 percent of total U.S. steel consumption) .3
The steel used represents about 5 to 6 percent of the average car's sales price,4 (approximately $600) with average cost for body-in-white stamping& (including acquisition, conversion, transportation, and handling) amounting to $947 per vehicle in 1986.B By far the largest quantity of material used in automobiles is steel. Use of carbon steel in automobiles declined from about 1,915 pounds in a typical car in 1978 to 1,440. pounds in 1988. At the same time, high-strength steel usage in automobiles increased from 133 poundS per car in 1978 ~o 232 pound~ in 1988. Stainless steel consumption has also increased, from 26 pounds in a typical car in 1978 to 31 pounds in a car in 1988, whereas usage of other steels declined from 55 pounds in 1978 to 45 pounds in 1988.7
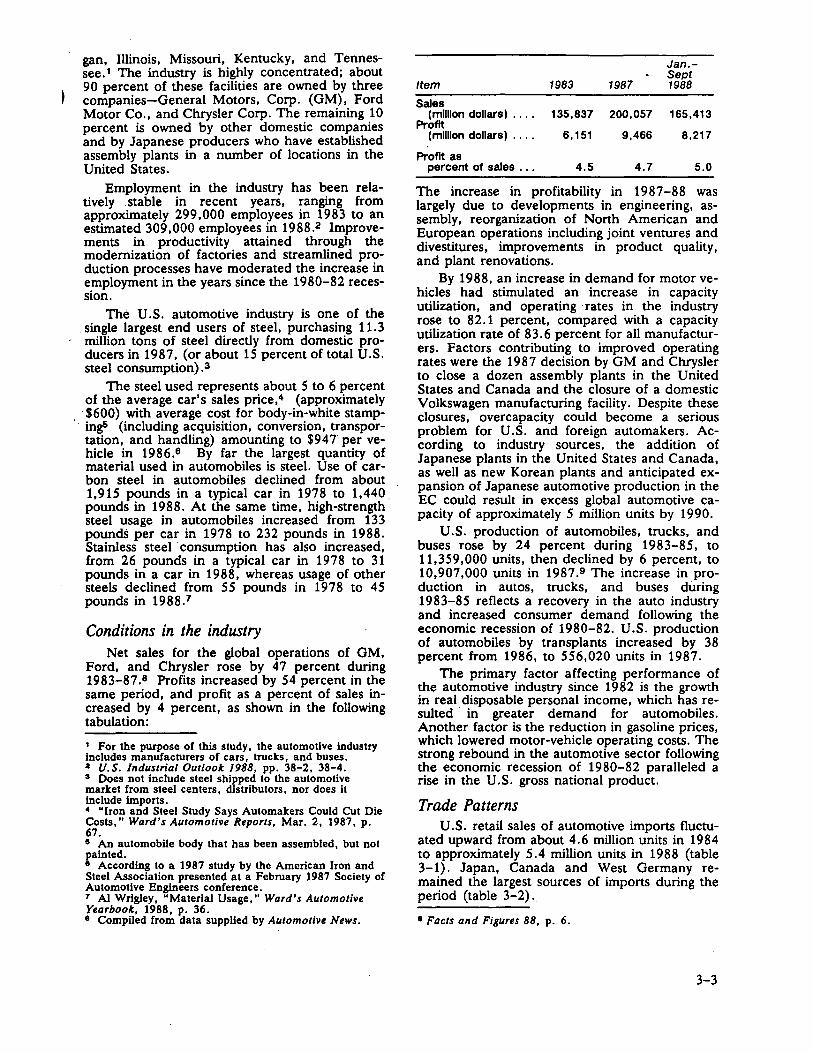
Conditions in the industry Net sales for the global operations of GM,
Ford, and Chrysler rose by 4 7 percent during 1983-87.B Profits increased by 54 percent in the same period, and profit as a percent of sales increased by 4 percent, as shown in the following tabulation:
1 For 1he purpose of this study, the automotive industry includes manufacturers of cars, trucks, and buses. a U.S. Industrial Outloolc 1988, pp. 38-2, 38-4. 3 Does not include steel shipped to the automotive market from steel centers, distributors, nor does it include imports. 4 "Iron and Steel Study Says Automakers Could Cut Die Costs," Ward's Automotive Reports, Mar. 2, 1987, p. 67. o An automobile body that has been assembled, but not Dainted. ii According to a 1987 study by the American Iron and Steel Association presented at a February 1987 Society of Automotive Engineers conference. 7 AI Wrigley, "Material Usage," Ward's Automotive Yearbook, 1988, p. 36. e Compiled from data supplied by Automotive News.
Jan.-Sept
Item 1983 1987 1988
Sales (mllllon dollars) .... 135,837 200,057 165,413
Profit (mllllon dollars) .... 6, 151 9,466 8,217
Profit as percent of sales ... 4.5 4.7 5.0
The increase in profitability in 1987-88 was largely due to developments in engineering, assembly, reorganization of North American and European operations including joint ventures and divestitures, improvements in product quality, and plant renovations.
By 1988, an increase in demand for motor vehicles had stimulated an increase in capacity utilization, and operating rates in the industry rose to 82.1 percent, compared with a capacity utilization rate of 83.6 percent for all manufacturers. Factors contributing to improved operating rates were the 1987 decision by GM and Chrysler to close a dozen assembly plants in the United States and Canada and the closure of a domestic Volkswagen manufacturing facility. Despite these closures, overcapacity could become a serious problem for U.S. and foreign automakers. According to industry sources, the addition of Japanese plants in the United States and Canada, as well as new Korean plants and anticipated expansion of Japanese automotive production in the EC could result in excess global automotive capacity of approximately 5 million units by 1990.
U.S. production of automobiles, trucks, and buses rose by 24 percent during 1983-85, to 11,359,000 units, then declined by 6 percent, to 10,907,000 units in 1987.9 The increase in production in autos, trucks, and buses during 1983-85 reflects a recovery in the auto industry and increased consumer demand following the economic recession of 1980-82. U.S. production of automobiles by transplants increased by 38 percent from 1986, to 556,020 units in 1987.
The primary factor affecting performance of the automotive industry since 1982 is the growth in real disposable personal income, which has resulted · in greater demand for automobiles. Another factor is the reduction in gasoline prices, which lowered motor-vehicle operating costs. The strong rebound in the automotive sector following the economic recession of 1980-82 paralleled a rise in the U.S. gross national product.
Trade Patterns U.S. retail sales of automotive imports fluctu
ated upward from about 4.6 million units in 1984 to approximately 5.4 million units in 1988 (table 3-1). Japan, Canada and West Germany remained the largest sources of imports during the period (table 3-2).,
•Facts and Figures 88, p. 6.
3-3
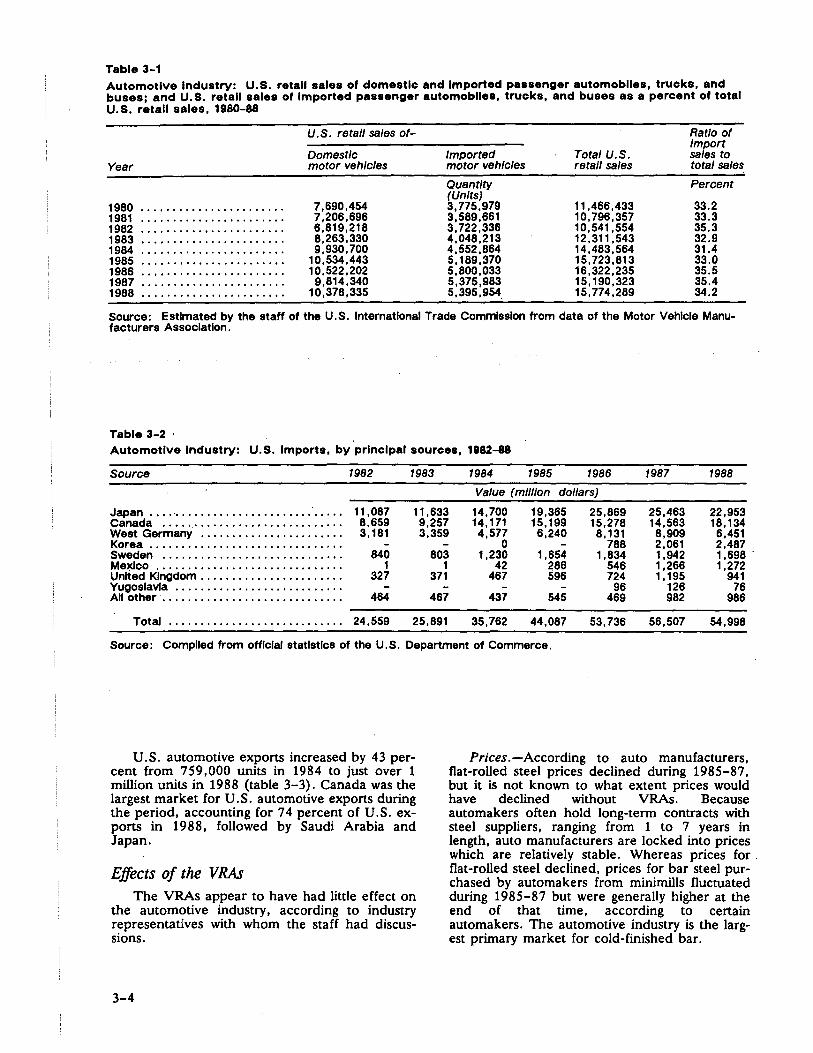
Table 3-1 Automotive Industry: U.S. retail sales of domestic and Imported passenger automobiles, trucks, and buses; and U.S. retail sales of Imported passenger automoblles, trucks, and buses as a percent of total U.S. retail sales, 1980-88
U.S. retail sales of- Ratio of Import
Domestic Imported Total U.S. sales to Year motor vehicles motor vehicles retail sales total sales
Quantity Percent (Units)
1980 ....................... 7,690,454 3,775,979 11,466,433 33.2 1981 ....................... 7,206,696 3,589,661 10,796,357 33.3 1982 ....................... 6,819,218 3,722,336 10,541 ,554 35.3 1983 ....................... 8,263,330 4,048,213 12,311,543 32.9 1984 ....................... 9,930,700 4,552,884 14,483,564 31.4 1985 ....................... 10,534,443 5, 189,370 15,723,813 33.0 1986 o o 0 f o o o 0 o o 0 o o 0 0 o o I 0 o o o o 10,522,202 5,800,033 16,322,235 35.5 1987 ....................... 9,814,340 5,375,983 15, 190,323 35.4 1988 ....................... 10,378,335 5,395,954 15,774,289 34.2
Source: Estimated by the staff of the U.S. International Trade Commission from data of the Motor Vehlcle Manufacturers Association.
Table 3-2 Automotive Industry: U.S. Imports, by prlnclpal sources, 1982-88
Source 1982 1983 1984 1985 1986 1987 1988
Value (ml/I/on dollars)
Japan ................................ 11 ,087 11,633 14,700 19,365 25,869 25,463 22,953 Canada ............................. 8,659 9,257 14, 171 15, 199 15,278 14,563 18, 134 West Germany o 0 0 0 o o 0 o o Io o 0 o o 0 0 o 0 0 o o 0 3, 181 3,359 4,577 6,240 8, 131 8,909 6,451 Korea ............................... - 0 788 2,061 2,487 Sweden ............................. 840 803 1,230 1,654 1,834 1 ,942 1,698 . Me)'.<lco .............................. 1 1 42 286 546 1 ,266 1,272 United Kingdom ....................•.. 327 371 467 596 724 1. 195 941 Yugoslavla ........................... 96 126 76 All other· ............................. 464 467 437 545 469 982 986
Total ............................ 24,559 25,891 35,762 44,087 53,736 56,507 54,998
Source: Compiled from offlclal statistics of the U.S. Department of Commerce.
U.S. automotive exports increased by 43 percent from 759,000 units in 1984 to just over 1 million units in 1988 (table 3-3). Canada was the largest market for U.S. automotive exports during the period, accounting for 7 4 percent of U.S. exports in 1988, followed by Saudi Arabia and Japan.
Effects of the VRAs The VRAs appear to have had little effect on
the automotive industry, according to industry representatives with whom the staff had discussions.
3-4
Prices.-According to auto manufacturers, flat-rolled steel prices declined during 1985-87, but it is not known to what extent prices would have declined without VRAs. Because automakers often hold long-term contracts with steel suppliers, ranging from 1 to 7 years in length, auto manufacturers are locked into prices which are relatively stable. Whereas prices for . flat-rolled steel declined, prices for bar steel purchased by automakers from minimills fluctuated during 1985-87 but were generally higher at the end of that time, according to certain automakers. The automotive industry is the largest primary market for cold-finished bar.
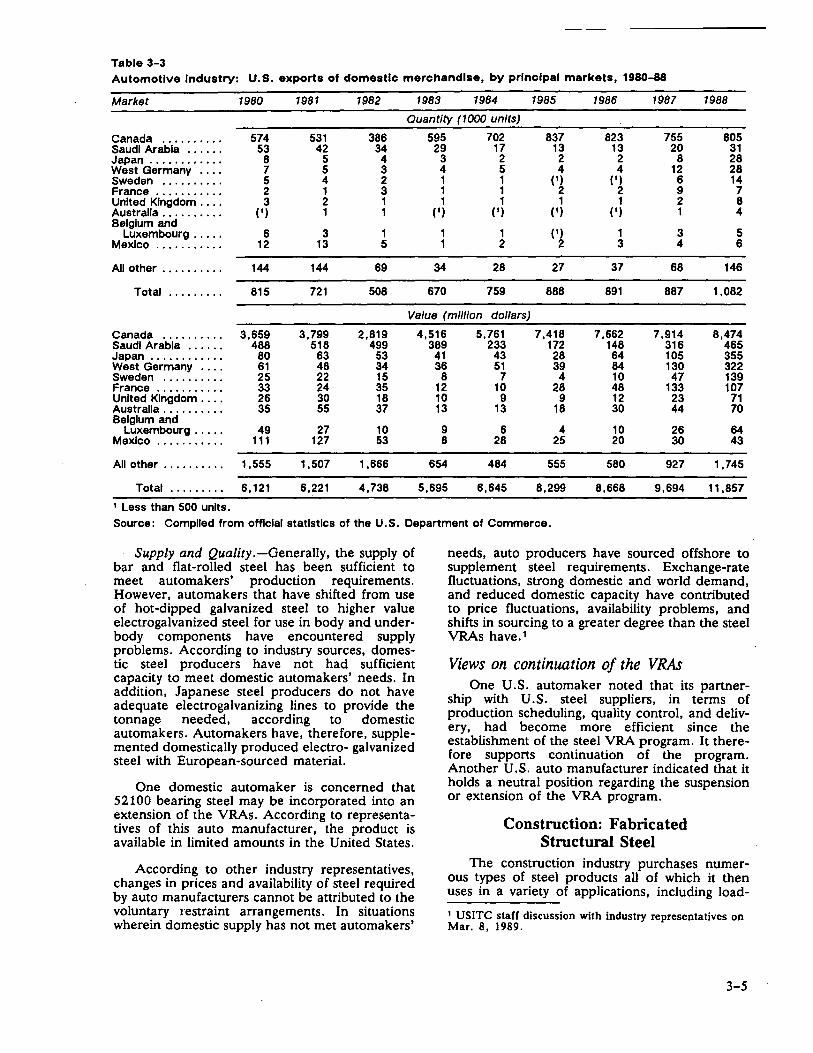
Table 3-3 Automotive Industry: U.S. exports of domestic merchandise, by prlnclpal markets, 1980-88
Market 1980 1981 1982 1983 1984 1985 1986 1987 1988
Ouantlty (1000 units)
Canada .......... 574 531 386 595 702 837 823 755 805 Saudi Arabia ...... 53 42 34 29 17 13 13 20 31 Japan ...•...•.•.. 8 5 4 3 2 2 2 8 28 West Germany .... 7 5 3 4 5 4 4 12 28 Sweden .......... 5 4 2 1 1 (1) (1) 6 14 France ..•....•... 2 1 3 1 1 2 2 9 7 United Kingdom .... 3 2 1 1 1 1 1 2 8 Australia •......... (1) 1 1 (1) (1) (1) (1) 1 4 Belgium and
1 (1) 1 3 5 Luxembourg ..... 6 3 1 Mexico ..........• 12 13 5 2 2 3 4 6
Ali other .......... 144 144 69 34 28 27 37 68 146
Total ......... 815 721 508 670 759 888 891 887 1,082
Value (ml/lion dollars)
Canada .......... 3,659 3,799 2,819 4,516 5,761 7,418 7,662 7,914 8,474 Saudi Arabia ...... 488 518 499 389 233 172 148 316 465 Japan ............ 80 63 53 41 43 28 64 105 355 West Germany .... 61 48 34 36 51 39 84 130 322 Sweden .......... 25 22 15 8 7 4 10 47 139 France ........... 33 24 35 12 10 28 48 133 107 United Kingdom .... 26 30 18 10 9 9 12 23 71 Australia .......... 35 55 37 13 13 18 30 44 70 Belgium and
Luxembourg ..... 49 27 10 9 6 4 10 26 64 Mexico .......•... 111 127 53 8 28 25 20 30 43
All other .......... 1,555 1,507 1,666 654 464 555 580 927 1,745
Total ......... 6, 121 6,221 4,738 5,695 6,645 8,299 8,668 9,694 11,857 1 Less than 500 units. Source: Complied from official statistics of the U.S. Department of Commerce.
Supply and Quality.-Generally, the supply of bar and flat-rolled steel has been sufficient to meet automakers' production requirements. However, automakers that have shifted from use of hot-dipped galvanized steel to higher value electrogalvanized steel for use in body and underbody components have encountered supply problems. According to industry sources, domestic steel producers have not had sufficient capacity to meet domestic automakers' needs. In addition, Japanese steel producers do not have adequate electrogalvanizing lines to provide the tonnage needed, according to domestic automakers. Automakers have, therefore, supplemented domestically produced electro- galvanized steel with European-sourced material.
One domestic automaker is concerned that 52100 bearing steel may be incorporated into an extension of the VRAs. According to representatives of this auto manufacturer, the product is available in limited amounts in the United States.
According to other industry representatives, changes in prices and availability of steel required by auto manufacturers cannot be attributed to the voluntary restraint arrangements. In situations wherein domestic supply has not met automakers'
needs, auto producers have sourced offshore to supplement steel requirements. Exchange-rate fluctuations, strong domestic and world demand, and reduced domestic capacity have contributed to price fluctuations, availability problems, and shifts in sourcing to a greater degree than the steel VRAs have.1
Views on continuation of the VRAs One U.S. automaker noted that its partner
ship with U.S. steel suppliers, in terms of production scheduling, quality control, and delivery, had become more efficient since the establishment of the steel VRA program. It therefore supports continuation of the program. Another U.S. auto manufacturer indicated that it holds a neutral position regarding the suspension or extension of the VRA program.
Construction: Fabricated Structural Steel
The construction industry purchases numerous types of steel products all of which it then uses in a variety of applications, including load-
1 USITC staff discussion with industry representatives on Mar. 8, 1989.
3-5
bearing, reinforcing, sheathing, and ventilation functions, as well as for a wide array of hardware items. Of an estimated 10 to 15 million tons of steel consumed annually by the industry, approximately 6 million tons are used in structural steel applications, the largest single steel-consuming group within the industry. The following analysis focuses on the fabricated structural steel (FSS) segment of the construction industry and its experience during the period of the VRAs. This industry is unique among the seven studied in depth in the investigation in that it is not only a buyer but is also a seller of goods subject to the VRAs.
Structure of the Domestic Industry The fabricated structural steel industry trans
forms steel mill products, primarily structural shapes and plates, into component parts of the load-bearing. structures of buildings and . bridges. Virtually all production is tailored for specific jobs or contracts and the work, therefore, is custom in nature.
The industry operates in regional markets, with firms usually serving a 200 to 300 mile radius. Larger firms may serve more expansive markets, but there are no firms with facilities located throughout the country. Because of the small marketing areas, the industry is geographically dispersed and comprises slightly over 1,000 firms. 1 The vast ~ajority of these firms are either. family-owned or closely held companies; no single producer is believed to account for more than 2 percent of production.
Employment in the industry has declined 10-15 percent since 1985, continuing a trend established in the late 1970's. Productivity has shown a concurrent increase, rising 11 percent in real terms from $97 ,000 of sales per employee in 1983 to $108,000 of sales per employee in 1987.2
. Steel represents a significant portion of the costs of the FSS industry. Most contracts for FSS include erection of the steel on the jobsite, with steel representing 50-60 percent of total erected costs.3 If erection services are not included, steel costs can represent upwards of 80 percent of production costs.
Conditions in the Industry Profitability in the industry since 1983 has
been relatively low. As depicted in the tabulation
1 Estimate of the American Institute of Steel Construction (AISC). U.S. Department of Commerce data for SIC 3441, an industry classification that is slightly broader than the fabricated structural steel industry, indicates approximately 1, 400 firms. 2 AISC annual report, 1987. Current dollar figures for 1987 were deflated to 1983 dollars usin~ the Bureau of Labor Statistics' Producer Price Index (3441-P) for SIC 3441, Fabricated Structural Metal. 3 Interviews with industry officials.
3-6
below, net income after taxes for companies reporting to the industry's trade association (the American Institute of Steel Construction (AISC)) rose from a low of 0.02 percent of total sales in 19 83 to 2. 08 percent in 19 8 7. This compares with a recent peak in net income of 4.36 percent in 1974.
Year
1983 1984 1985 1986 1987
................................ . .............................. . 1 AISC annual report, 1987.
Net Income
0.02 .09
1.83 1.62 2.081
Discussions with industry officials' indicate that 1988 profitability for the industry will again average about 2 percent.
Estimated industry shipments increased steadily since 1983, rising by 26 percent from 4,350,000 tons in 1983 to 5,500,000 tons in 1988 (table 3-4).
However, bookings4 for 19 8 9 are expected either to be unchanged over their 19 8 8 level or to decrease somewhat because of cutbacks in office building construction, the largest end-use category for FSS.
Financial performance during 1985-88 has been affected to some extent by geographic location. On the east coast, competition from low-cost Canadian fabricators apparently has narrowed profit margins, as well as decreased the volume of work available to domestic fabricators. On the west coast, competition from VRA nations, such as Japan and Korea, and from non-VRA nations, such as Singapore, Taiwan, and Thailand, has reportedly had a similar effect. In the Midwest and South, import competition is perceived as contributing less to plant closures than do certain other factors, such as decreased demand, unsuccessful business strategies, or asset liquidation by private firms. In addition, factors cited as affecting performance in various regions include increasing insurance costs and an inability to invest in plant modernization.
Some restructuring of production facilities has taken place, as smaller firms have exited the business or merged with other firms. Discussions with industry officials indicate that firms are exiting the industry primarily because of poor financial performance. In terms of operating rates, capacity utilization in the industry is estimated to have been between 60 and 70 percent between 1984 and 1987.
4 Shipments typically lag bookings by 3 to 6 months, although in some cases this lag can extend a year or more.
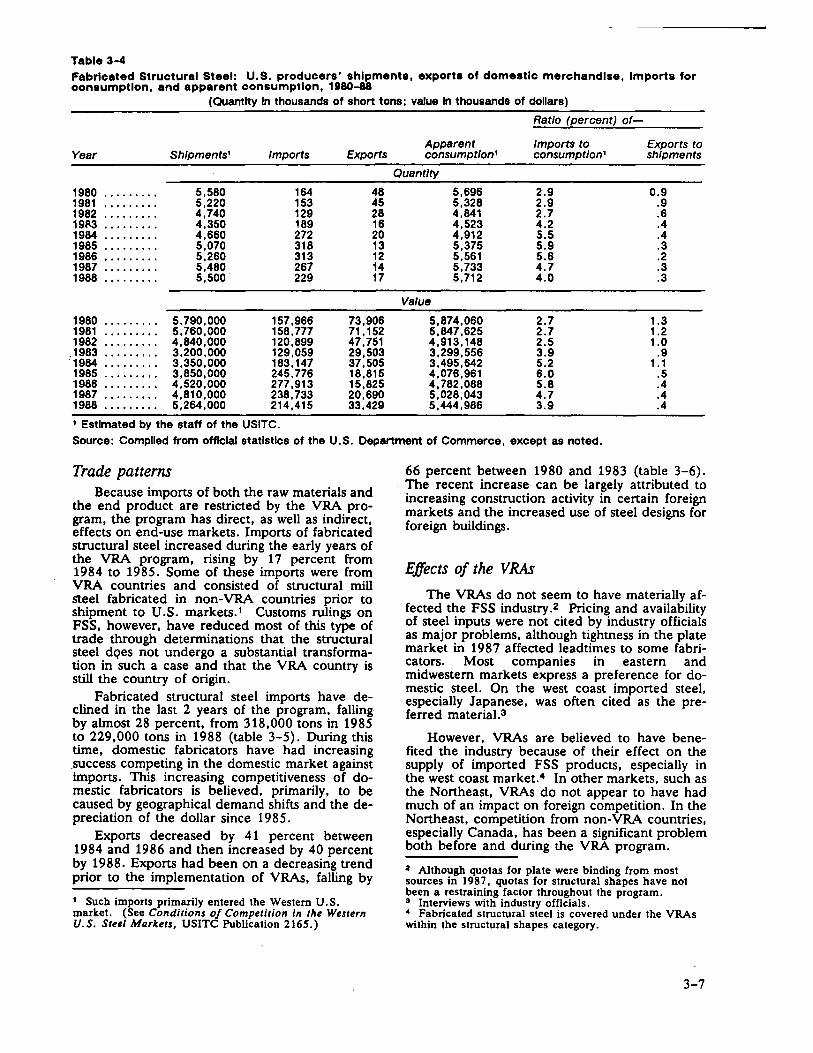
Table 3-4 Fabricated Structural Steel: U.S. producers' shipments, exports of domestic merchandise, Imports for consumption, and apparent consumption, 1980-88
(Quantity In thousands of short tons; value In thousands of dollars)
Ratio (percent) of-
Apparent Imports to Exports to Year Shlpments1 Imports Exports consumption, consumptlon1 shipments
Quantity
1980 ......... 5,580 164 48 5,696 2.9 0.9 1981 ......... 5,220 153 45 5,328 2.9 .9 1982 ......... 4,740 129 28 4,841 2.7 .6 19fl3 ......... 4,350 ~89 16 4,523 4.2 .4 1984 ......... 4,660 272 20 4,912 5.5 .4 1985 ......... 5,070 318 13 5,375 5.9 .3 1986 0 0 I 0 o o o o o 5,260 313 12 5,561 5.6 .2 1987 o o o o o I 0 Io 5,480 267 14 5,733 4.7 .3 1988 ......... 5,500 229 17 5,712 4.0 .3
Value
1980 ......... 5,790,000 157,966 73,906 5,874,060 2.7 1.3 1981 ......... 5,760,000 158,777 71, 152 5,847,625 2.7 1.2 1982 ......... 4,840,000 120,899 47,751 4,913, 148 2.5 1.0
.1983 ......... 3,200,000 129,059 29,503 3,299,556 3.9 .9 ·1954 ......... 3,350,000 183, 147 37,505 3,495,642 5.2 1. 1 1985 ......... 3,850,000 245,776 18,815 4,076,961 6.0 .5 1986 ......... 4,520,000 277,913 15,825 4,782,088 5.8 .4 1987 ......... 4,810,000 238,733 20,690 5,028,043 4.7 .4 1988 ......... 5,264,000 214,415 33,429 5,444,986 3.9 .4 1 Estimated by the staff of the USITC. Source: Compiled from official statistics of the U.S. Department of Commerce, except as noted.
Trade patterns Because imports of both the raw materials and
the end product are restricted by the VRA program, the program has direct, as well as indirect, effects on end-use markets. Imports of fabricated structural steel increased during the early years of the VRA program, rising by 17 percent from 1984 to 1985. Some of these imports were from VRA countries and consisted of structural mill &'teel fabricated in non-VRA countries prior to shipment to U.S. markets.1 Customs rulings on FSS, however, have reduced most of this type of trade through determinations that the structural steel dqes not undergo a substantial transformation in such a case and that the VRA country is still the country of origin.
Fabricated structural steel imports have declined in the last 2 years of the program, falling by almost 28 percent, from 318,000 tons in 1985 to 229,000 tons in 1988 (table 3-5). During this time, domestic fabricators have had increasing .success competing in the domestic market against imports. This increasing competitiveness of domestic fabricators is believed, primarily, to be caused by geographical demand shifts and the depreciation of the dollar since 19 8 5.
Exports decreased by 41 percent between 1984 and 1986 and then increased by 40 percent by 1988. Exports had been on a decreasing trend prior to the implementation of VRAs, falling by
1 Such imports primarily entered the Western U.S. market. (See Conditions of Competition in the Western U.S. Steel Markets, USITC Publication 2165.)
66 percent between 1980 and 1983 (table 3-6). The recent increase can be largely attributed to increasing construction activity in certain foreign markets and the increased use of steel designs for foreign buildings.
Effects of the VRAs
The VRAs do not seem to have materially affected the FSS industry .2 Pricing and availability of steel inputs were not cited by industry officials as major problems, although tightness in the plate market in 1987 affected leadtimes to some fabricators. Most companies in eastern and midwestem markets express a preference for domestic steel. On the west coast imported steel, especially Japanese, was often cited as the preferred material.3
However, VRAs are believed to have benefited the industry because of their effect on the supply of imported FSS products, especially in the west coast market.4 In other markets, such as the Northeast, VRAs do not appear to have had much of an impact on foreign competition. In the Northeast, competition from non-VRA countries, especially Canada, has been a significant problem both before and during the VRA program.
2 Although quotas for plate were binding from most sources in 1987, quotas for structural shapes have not been a restraining factor throughout the program. 3 Interviews with industry officials. • Fabricated structural steel is covered under the VRAs within the structural shapes category.
3-7
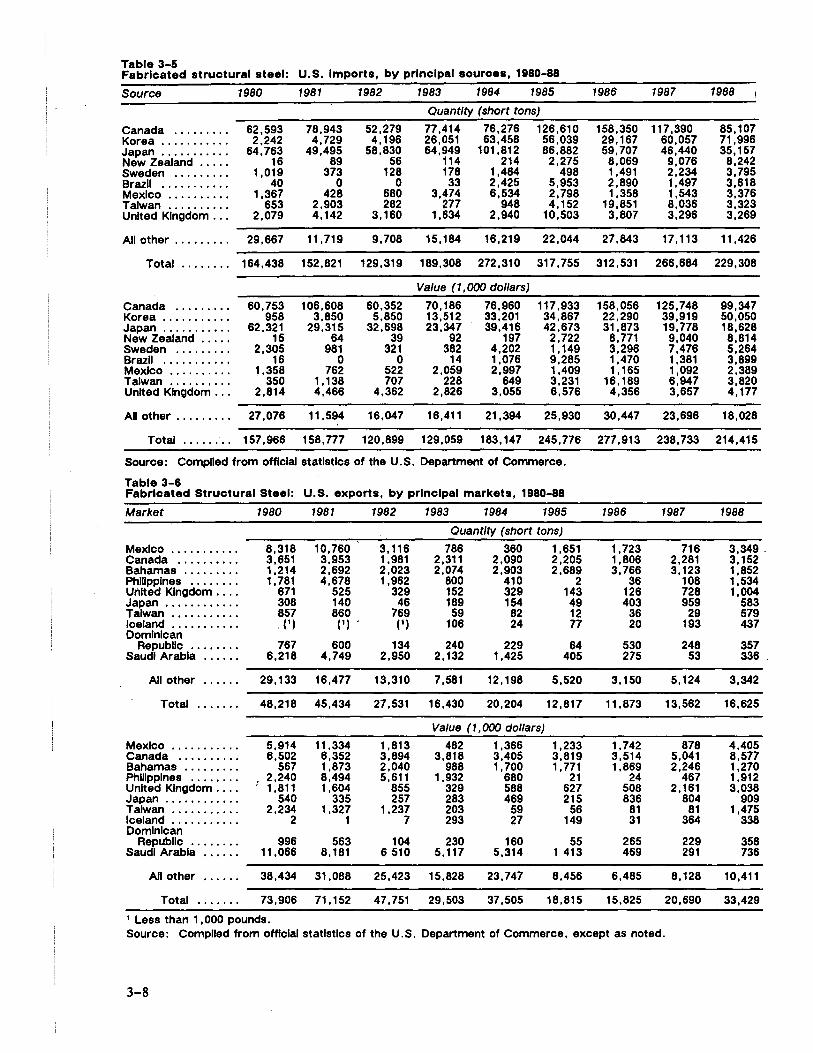
Table 3-5 Fabricated structural steel: U.S. Imports, by prlnclpal sources, 1980-88
Source 1980 1981 1982 1983 1984 1985 1986 1987 1988
Quantity (short tons)
Canada ......... 62,593 78,943 52,279 77,414 76,276 126,610 158,350 117,390 85, 107 Korea ........... 2,242 4,729 4, 196 26,051 63,458 56,039 29, 167 60,057 71,996 Japan ........... 64,763 49,495 58,830 64,949 101,812 86,882 59,707 46,440 35, 157 New Zealand ..... 16 89 56 114 214 2,275 8,069 9,076 8,242 Sweden ......... 1,019 373 128 178 1,484 498 1,491 2,234 3,795 Brazll ........... 40 0 0 33 2,425 5,953 2,890 1,497 3,618 Mexico .......... 1,367 428 680 3,474 6,534 2,798 1,358 1,543 3,376 Taiwan .......... 653 2,903 282 277 948 4, 152 19,851 8,036 3,323 United Kingdom ... 2,079 4, 142 3, 160 1,634 2,940 10,503 3,807 3,296 3,269
All other ......... 29,667 11, 719 9,708 15, 184 16,219 22,044 27,843 17,113 11,426
Total ........ 164,438 152,821 129,319 189,308 272,310 317,755 312,531 266,684 229,308
Value (1,000 dollars)
Canada ......... 60,753 106,608 60,352 70, 186 76,960 117,933 158,056 125,748 99,347 Korea ........... 958 3,850 5,850 13,512 33,201 34,867 22,290 39,919 50,050 Japan ........... 62,321 29,315 32,698 23,347 39,416 42,673 31,873 19,778 18,628 New Zealand ..... 15 64 39 92 197 2,722 8,771 9,040 8,814 Sweden ......... 2,305 981 321 382 4,202 1, 149 3,296 7,476 5,264 Brazll ........... 16 0 0 14 1,076 9,285 1,470 1,381 3,899 Mexico .......... 1.358 762 522 2,059 2,997 1,409 1, 165 1,092 2,389 Taiwan .......... 350 1, 138 707 228 649 3,231 16, 189 6,947 3,820 United Kingdom ... 2,814 4,466 4,362 2,826 3,055 6,576 4,356 3,657 4, 177
All other ......... 27,076 11,594 16,047 16,411 21,394 25,930 30,447 23,696 18,028
Total ..... .' ... 157,966 158,777 120,899 129,059 183, 147 245,776 277,913 238,733 214,415
Source: Compiled from official statistics of the U.S. Department of Commerce.
Table 3-6 Fabricated Structural Steel: U.S. exports, by prlnclpal markets, 1980-88
Market 1980 1981 1982 1983 1984 1985 1986 1987 1988
Quantity (short tons)
Mexico ........... 8,318 10,760 3,116 786 360 1,651 1,723 716 3,349. Canada .......... 3,651 3,953 1,981 2,311 2,090 2,205 1,806 2,281 3, 152 Bahamas ......... 1,214 2,692 2,023 2,074 2,903 2,689 3,766 3, 123 1,852 Philippines ........ 1,781 4,678 1,962 800 410 2 36 108 1,534 United Kingdom .... 671 525 329 152 329 143 126 728 1,004 Japan ............ 308 140 46 189 154 49 403 959 583 Taiwan ........... 857 860 769 59 82 12 36 29 579 Iceland ........... . (1) (1) . (1) 106 24 77 20 193 437 Dominican
Republic ........ 767 600 134 240 229 64 530 248 357 Saudi Arabia 6,218 4,749 2,950 2, 132 1,425 405 275 53 336 .
All other ...... 29, 133 16,477 13,310 7,581 12.198 5,520 3, 150 5, 124 3,342
Total ....... 48,218 45,434 27,531 16,430 20,204 12,817 11,873 13,562 16,625
Value (1,000 dollars)
Mexico ........... 5,914 11,334 1,813 482 1,366 1,233 1,742 878 4,405 Canada .......... 6,502 6,352 3,894 3,818 3,405 3,819 3,514 5,041 8,577 Bahamas ......... 567 1,873 2,040 988 1,700 1,771 1,869 2,246 1,270 Philippines ........ 2,240 8,494 5,611 1,932 680 21 24 467 1,912 United Kingdom .... 1,811 1,604 855 329 588 627 508 2, 161 3,038 Japan ............ 540 335 257 283 469 215 836 804 909 Taiwan ........... 2,234 1,327 1,237 203 59 56 81 81 1,475 Iceland ........... 2 1 7 293 27 149 31 364 338 Dominican
Republic ........ 996 563 104 230 160 55 265 229 358 Saudi Arabia 11,066 8, 181 6 510 5, 117 5,314 1 413 469 291 736
All other ...... 38,434 31,088 25,423 15,828 23,747 8,456 6,485 8, 128 10,411
Total ....... 73,906 71.152 47,751 29,503 37,505 18,815 15,825 20,690 33,429 1 Less than 1 , 000 pounds. Source: Complied from official statistics of the U.S. Department of Commerce, except as noted.
3-8
Prices.-Although prices for both structurals and plate rose in 1987 and 1988, most fabricators are not sure of the extent to which these increases can be attributed to the VRA program. These fabricators note that prices fell during 1984-86, and that it was not until early to mid-1987 that plate prices (current dollars) rose to the same levels prevailing in late 1984. For structurals, prices in mid- to late 1987 began to exceed late 1984 prices for the first time. Since mid-1987, prices have continued to strengthen, and in late 1988 were between 5 and 36 percent higher (current dollars) than in late 1984. Structurals prices are expected to fall in the near future, as new domestic capacity for the popular wide-flange beams has recently come on line and additional capacity expansions are planned.
Most domestic fabricators contacted attributed the price increases after 1986 to increased worldwide demand and the depreciation of the dollar.2 Pricing information submitted by some west coast fabricators shows costs for domestic steel beams averaging between 8 and 19 percent higher than costs for foreign beams between 1984 and 19 8 8, representing a difference not deemed unusual in the industry because foreign steel generally sells at a discount.a This pricing gap closed considerably with the deregulation of railroad freight rates, and domestic steel has been more competitive on a price basis in recent years.
Procurement.-Availability of plate and structurals does not appear to have been a major problem for the industry, although there apparently were some instances in 1987 and 1988 when fabricators found it difficult to acquire specific products, especially plate. In these instances, lead-times for delivery were extended by suppliers, generally by several weeks. No cases of lost sales due to lack of mill product availability were revealed during contact with industry officials or as a result of post-hearing briefs.
There were, however, several short·supply requests filed for plate products and structural shapes and sections, including FSS. The eight requests made for plate were filed primarily by pipemakers and equipment manufacturers. In four cases, the requests were granted, totaling 45,500 tons. There have also been six requests for products falling in the structural shapes category, two of which were for FSS. The requests for shapes typically have been for special shapes that
1 World Steel Intelligence, "Steel Pricetrak #26," World Steel Dynamics, Paine Webber, Sept. 29, 1988. 2 See also, Cantor, David J. , "Steel Prices and Import Restraints," Congressional Research Service, Mar. 15, 1988. 3 A variety of nonprice factors considered in the purchase decision, such as delivery leadtimes, tend to dictate lower prices for imports in order for them to compete with domestic steel.
are not rolled by domestic producers. In three of the four cases Commerce granted the requests. 4
Substitution of materials.-Steel price levels are a primary concern of the fabricators, since the cost of steel represents a large proportion of final product cost in the FSS industry and it is difficult for the industry to absorb increases .in mill steel costs. This is particularly important in markets where steel competes with reinforced concrete. Industry officials indicate that competition from reinforced concrete is very keen now, due partially to pricing and partially to technological advances that are expanding the ability and versatility of reinforced concrete as a structural material.
Competitiveness.-Because of their effect on the FSS industry's end product, the VRAs have improved the competitiveness of fabricators in certain regions. In the west coast and the northeast, however, domestic firms have been significantly outbid on a number of jobs by foreign fabricators.s While the effect of VRAs on steel prices may have been a factor in the pricing differential, other factors giving advantages to foreign fabricators include lower labor rates, U.S. insurance and regulatory costs, exchange rates, and export rebates offered by foreign mills to foreign fabricators. 6 Virtually all industry officials interviewed indicated that domestic prices for mill products have not, in their opinion, had a significant impact on their competitiveness, either in domestic or foreign markets. 7
Views on continuation of the V.RAs Most firms in the industry appear to be in fa
vor of extending the VRA program, expressing the view that a healthy domestic steel industry is . important to their operations. Others, however, believe that the current program has achieved its goal of allowing the domestic steel industry to adjust and modernize. The latter group favors use of existing unfair trade laws as a preferable alternative to an extension of the program.
4 The grants totaled 13,550 tons, of which 13,000 tons was a single request for rolled, heavy-equipment track shoes not produced in the United States. The two requests for FSS involved antique City of London telephone booths and modular bridge sections. In the bridge sections case, filed by the EC, the U.S. Department of Commerce found that the product was not in short supply in the United States. 15 On Jan. 11, 1988, the American Institute of Steel Construction, Inc. petitioned the U.S. International Trade Commission and the U.S. Department of Commerce for import relief, claiming that certain fabricated structural steel from Canada was being sold in the United States at less than fair value. On Feb. 22, 1988, the Commission determined, with Commissioner Eckes dissenting, that there was no reasonable indication that the domestic industry was materially injured or threatened with material injury or that the establishment of an industry in the United States was materially retarded by reason of imports from Canada of the subject goods alleged to be sold at less than fair value (Inv. No. 731-TA-387). 8 Based on interviews with industry officials. 7 Eighteen fabricators and the AISC were contacted. Submissions were received from, or interviews conducted with, 10 fabricators of various sizes and geographic locations.
3-9

Many fabricators, especially those located in the Northeast, would like to see Canada included in an extended VRA program, with a view toward inclusion of imports of Canadian fabricated steel. Others urge that quotas should be relaxed for mill steel, such as plate or structural shapes, or that more flexibility should be built into the program. These fabricators blamed recent tight supplies for price increases in the domestic market.
A few of the officials contacted thought that a multinational agreement on steel trade that would remove the influence of governmental subsidization would be preferable to the type of quantitative restrictions imposed by VRAs. The firms would generally prefer having no restriction
. on the source of their raw materials, even though many expressed a preference for purchasing domestically produced material.
Agricultural Equipment
Structure of the domestic industry The agricultural equipment analyzed in this
study include wheel tractors, combines and other harvesting machines, tillers, cultivators, plows, turf equipment, animal feeders, driers, and fertilizer spreaders. These products are included in SIC product category 3523.
Until recently, there were six U.S. producers of farm equipment. These firms supplied over 60 percent of total U.S. production and numerous mid-sized and private specialty producers (known as "shortliners") accounted for the other 40 percent. However, recent ·consolidations of manufacturing facilities and liquidation of capital stocks have reduced the number of major producers to four: Deere & Co., Case IH (a Tenneco Inc. subsidiary), Massey-Ferguson Inc. (held by Canadian-based Varity Corp.) and Ford New Holland Inc. 1 Although these companies are headquartered in the Midwest and Eastern United ·states, the majority of their production capacity is located overseas and carries U.S. brand names. Until recently, for example, only farm tractors of more than 100 horsepower (hp) were produced in the United States;. and only two main manufacturers are involved in their produc-tion.2 .
The mergers and acquisitions that ha.ve occurred in the industry have reduced production capacity by 27 percent and lowered employme11t by half since 1981.3 During 1985-88, total employment declined by 14 percent, from 67 ,000 to 57,300. .
The primary steel products used to manufacture agricultural machinery are wire rods, plates,
1 Standard & Poor's Industry Surveys, July 7, 1988. 2 White-New Idea recently began producing and plans to market 40-60 hp tractors in the United States. It is the first smaller model to be U.S. built in a decade. 3 Business Wed:, "The Quotas That Saved Steel lue · Backfiring On Buyers," Sept. 26, 1988.
3-10
hot- and cold-rolled sheets, hot-rolled bars, mechanical tubing, and some galvanized sheet steel. In 19 8 7, the industry purchased 210, 2 71 tons of steel directly from U.S. producers, only half the amount purchased by the industry in 19 7 8, reflecting the effects of consolidation within the industry and reduced domestic demand for agricultural equipment. 4
Large U.S. producers indicate that raw steel accounts for approximately 60 percent of material costs, but averages about 15 to 20 percent of production costs.5
Conditions in the industry Relatively high interest rates, declining com
modity prices, and poor farming conditions · adversely affected agriculture sales during
1983-88 and thus decreased U.S. demand for farm equipment. The farm equipment industry has operated at a loss virtually every year since 1983, thus requiring large capital investments from some parent companies to keep operations viable. For example, Tenneco, Inc. reportedly subsidized its Case IH operations by $154 million in 1987 and by $43 million in 1988.8
Industrywide difficulties in the 1980s also have caused the largest U.S. producers of farm machinery to restructure and U.S. multinationals to transfer their production capacity to Europe. By concentrating production in the larger European farm machinery market, U.S. firms wanted to lower production costs and at the same time increasing their share of the European market. U.S. multinationals accounted for 40 percent of total EC output by 19 8 8, although for some of the material supplies used, over 80 percent came from North America.
The positive effect of the relatively low value of the dollar on U.S. exports, and improved demand for replacement equipment in the U.S. market contributed to a partial recovery of the industry in early 1988. The recovery was limited, however, because the severe drought that year made it difficult for dealers to sell existing inventory, and dealers placed fewer orders. As a result, net industry shipments of farm machinery increased by only 2 percent in 1988 over 1987 levels and were 25 to 30 percent below 1983-1984 levels, respectively. (table 3-7)7
Net profits as a percent of sales have declined steadily in the 1980s, but have recovered somewhat in 1987, as shown in the following tabulation:8
' Shipments of Steel Products by Market Classifications, Amencan Iron and Steel Institute, 1987. Purchases from distributors and foreign suppliers are not included. 11 USITC staff interview with industry sources, February 1989. 11 Farm Equipment, "The Future of Case IH Still Questionable," February 1989. 7 U.S. Department of.Commerce, U.S. Industrial Outlook, 1987. 11 Estimated data from Value Line, March 1989.
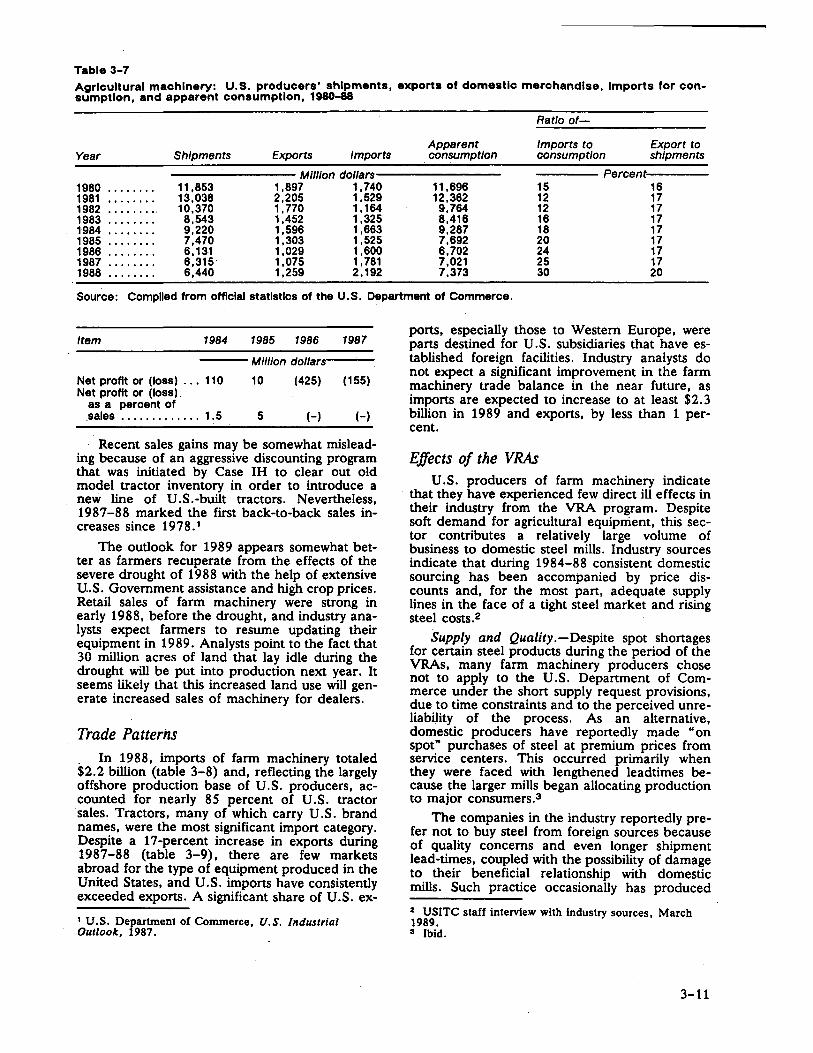
Table 3-7 Agricultural machinery: U.S. producers' shipments, exports of domestic merchandise, Imports for consumption, and apparent consumption, 1980-88
Ratio of-
Apparent Imports to Export to Year Shipments Exports Imports consumption consumption shipments
Ml/lion dollars Percent 1980 ........ 11 ,853 1,897 1,740 11,696 15 16 1981 ........ 13,038 2,205 1,529 12,362 12 17 1982 ......... 10,370 1,770 1, 164 9,764 12 17 1983 ........ 8,543 1,452 1,325 8,416 16 17 1984 ........ 9,220 1,596 1,663 9,287 18 17 1985 ........ 7,470 1,303 1,525 7,692 20 17 1986 ........ 6, 131 1,029 1,600 6,702 24 17 1987 ........ 6,315 1,075 1,781 7,021 25 17 1988 ........ 6,440 1,259 2, 192 7,373 30 20
Source: Complied from official statistics of the U.S. Department of Commerce.
Item 1984 1985 1986 1987
--- Miii/on dollars·----
Net profit or (loss) ... 110 Net profit or (loss)
as a percent of _sales ............. 1.5
10 (425) (155)
5 (-) (-)
. Recent sales gains may be somewhat misleading because of an aggressive discounting program that was initiated by Case IH to clear out old model tractor inventory in order to introduce a new line of U.S.-built tractors. Nevertheless, 1987-88 marked the first back-to-back sales increases since 19 7 8. 1
The outlook for 1989 appears somewhat better as farmers recuperate from the effects of the severe drought of 1988 with the help of extensive U.S. Government assistance and high crop prices. Retail sales of farm machinery were strong in early 1988, before the drought, and industry analysts expect farmers to resume updating their equipment in 1989. Analysts point to the fact that 30 million acres of land that lay idle during the drought will be put into production next year. It seems likely that this increased land use will generate increased sales of machinery for dealers.
Trade Patterns
_ In 1988, imports of farm machinery totaled $2.2 billion (table 3-8) and, reflecting the largely offshore production base of U.S. producers, accounted for nearly 85 percent of U.S. tractor sales. Tractors, many of which carry U.S. brand names, were the most significant import category. Despite a 17-percent increase in exports during 1987-88 (table 3-9), there are few markets abroad for the type of equipment produced in the United States, and U.S. imports have consistently exceeded exports. A significant share of U.S. ex-
1 U.S. Department of Commerce, U.S. Industrial Outlook, 1981.
ports, especially those to Western Europe, were parts destined for U.S. subsidiaries that have established foreign facilities. Industry analysts do not expect a significant improvement in the farm machinery trade balance in the near future, as imports are expected to increase to at least $2.3 billion in 1989 and exports, by less than 1 percent .
Effects of the VRAs U.S. producers of farm machinery indicate
that they have experienced few direct ill effects in their industry from the VRA program. Despite soft demand for agricultural equipment, this sector contributes a relatively large volume of business to domestic steel mills. Industry sources indicate that during 1984-88 consistent domestic sourcing has been accompanied by price discounts and, for the most part, adequate supply lines in the face of a tight steel market and rising steel costs.2
Supply and Quality.-Despite spot shortages for certain steel products during the period of the VRAs, many farm machinery producers chose not to apply to the U.S. Department of Commerce under the short supply request provisions, due to time constraints and to the perceived unreliability of the process. As an alternative, domestic producers have reportedly made "on spot" purchases of steel at premium prices from service centers. This occurred primarily when they were faced with lengthened leadtimes because the larger mills began allocating production to major consumers.3
The companies in the industry reportedly prefer not to buy steel from foreign sources because of quality concerns and even longer shipment lead-times, coupled with the possibility of damage to their beneficial relationship with domestic mills. Such practice occasionally has produced
2 USITC staff interview with industry sources, March 1989. 3 Ibid.
3-11
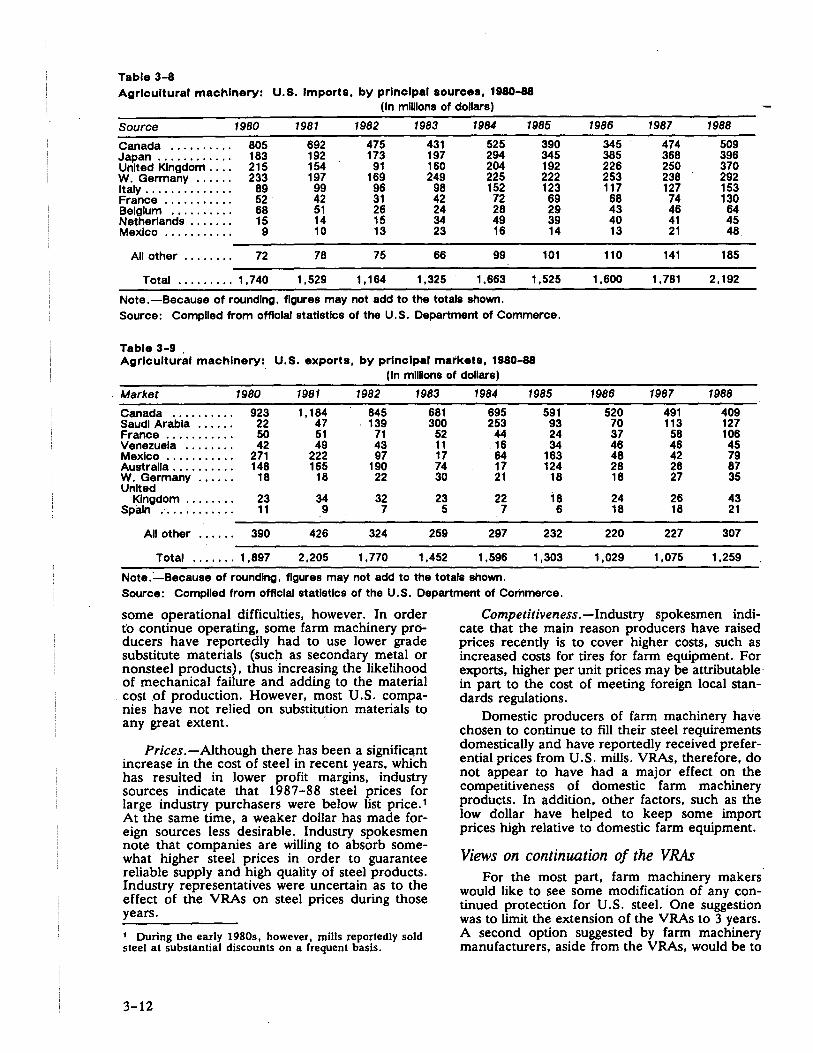
Table 3-8 Agricultural machinery: U.S. Imports, by principal sources, 1980-88
(In mllllons of dollars)
Source 1980 1981 1982 1983 1984 1985 1986 1987 1988
Canada .......... 805 692 475 431 525 390 345 474 509 Japan ............ 183 192 173 197 294 345 385 368 396 United Kingdom .... 215 154 91 160 204 192 226 250 370 W. Germany ...... 233 197 169 249 225 222 253 238 292 Italy .............. 89 99 96 98 152 123 117 127 153 France ........... 52 42 31 42 72 69 68 74 130 Bel glum .......... 68 51 26 24 28 29 43 46 64 Netherlands ....... 15 14 15 34 49 39 40 41 45 Mexico ........... 9 10 13 23 16 14 13 21 48
All other ........ 72 78 75 66 99 101 110 141 185
Total ......... 1 , 740 1,529 1, 164 1,325 1,663 1,525 1,600 1, 781 2, 192
Note. -Because of rounding, figures may not add to the totals shown. Source: Complied from offlclal statistics of the U.S. Department of Commerce.
Table 3-9 . Agricultural machinery: U.S. exports, by principal markets, 1980-88
(In mllllons of dollars)
Market 1980 1981 1982 1983 1984 1985 1986 1987 1988
Canada .......... 923 1, 184 845 681 695 591 520 491 409 Saudi Arabia ...... 22 47 139 300 253 93 70 113 127 France ........... 50 51 71 52 44 24 37 58 106 Venezuela ........ 42 49 43 11 . 16 34 46 46 45 Mexico ........... 271 222 97 17 64 163 48 42 79 Australia .......... 148 165 190 74 17 124 28 28 87 W. Germany ...... 18 18 22 30 21 18 18 27 35 United
Kingdom ........ 23 34 32 23 22 18 24 26 43 Spain ............. 11 9 7 5 7 6 18 18 21
All other ...... 390 426 324 259 297 232 220 227 307
Total ....... 1,897 2,205 1,770 1,452 1,596 1,303 1,029 1,075 1,259
Note,:_Because of rounding, figures may not add to the totals shown. Source: Compiled from official statistics of the U.S. Department of Commerce .
. some operational difficulties, however. In order Competitiveness.-lndustry spokesmen indi-to continue operating, some farm machinery pro- cate that the main reason producers have raised ducers have reportedly had to use lower grade prices recently is to cover higher costs, such as substitute materials (sucn as secondary metal or increased costs for tires for farm equipment. For nonsteel products), thus increasing the likelihood exports, higher per unit prices may be attributable of mechanical failure and adding to the material in part to the cost of meeting foreign local stan-cost of production. However, most U.S. compa- dards regulations. nies have not relied on substitution materials to any great extent. · Domestic producers of farm machinery have
chosen to continue to fill their steel requirements
Prices.-Although there has been a signific~nt increase in the cost of steel in recent years, which has resulted in lower profit margins, industry sources indicate that 1987-88 steel prices for large industry purchasers were below list price. 1
At the same time, a weaker dollar has made foreign sources less desirable. Industry spokesmen note that companies are willing to absorb somewhat higher steel prices in order to guarantee reliable supply and high quality of steel products. Industry representatives were uncertain as to the effect of the VRAs on steel prices during those years.
1 During the early 1980s, however, mills reportedly sold steel at substantial discounts on a frequent basis.
3-12
domestically and have reportedly received preferential prices from U.S. mills. VRAs, therefore, do not appear to have had a major effect on the competitiveness of domestic farm machinery products. In addition, other factors, such as the low dollar have helped to keep some import prices high relative to domestic farm equipment.
Views on continuation of the VRAs For the most part, farm machinery makers
would like to see some modification of any continued protection for U.S. steel. One suggestion was to limit the extension of the VRAs to 3 years. A second option suggested by farm machinery manufacturers, aside from the VRAs, would be to
increase the use of joint ventures between U.S. and foreign steel producers.
Industry spokesmen indicate that the VRAs have had little effect on the farm machinery industry. However, if, in the future, U.S. steel prices continue to rise substantially, agricultural equipment manufacturers indicate that it is their intention to oppose the extension of restrictions on foreign steel sources.
Construction Machinery and Equipment
Structure of the domestic industry Construction machinery is manufactured in
the United States by establishments primarily engaged in the manufacture of heavy machinery and equipment used by the construction industry, including such equipment as bulldozers, power shovels, and hydraulic excavators. The U.S. construction machinery industry is composed of more than 900 producers concentrated in the Central and North Central states of Illinois, Michigan, Ohio, and Wisconsin. The major producers are Caterpillar Tractor Company, Clark Equipment Company, Dresser Industries, Inc., Gehl, Inc., J.I. Case, Inc., and John Deere and Company. Three of the largest producers are multinationals, producing a wide product line and accounting for approximately 53 percent of domestic sales/production. 1 Many small- and medium-size companies concentrate on producing a number of variations of basic machines for particular segments of the industry. Employment in the U.S. construction machinery industry was estimated at 88,900 in 1988, down from 95,000 in 1984. This decline resulted largely from major structural changes that have taken place in the U.S. industry over the past decade, including mergers and acquisitions, plant closings, joint venture agreements with foreign manufacturers, and shifts to offshore production.
The U.S. construction machinery industry is estimated to have consumed over 341,000 tons of
·steel in 1988, primarily utilizing plate, bar, hotand cold-rolled sheet, tubing, and structural shapes. Discussions with U.S. industry officials indicate that purchases of steel account for about 12 to 24 percent of production costs.
Conditions in the industry In general, the U.S. construction machinery
industry was relatively prosperous during 1984-88. Increased domestic construction activity during the period and the low value of the U.S. dollar relative to the Japanese yen and West German mark were significant factors affecting domestic sales, exports, and net operating profits in the U.S. construction machinery industry. U.S. shipments increased by 25 percent, to $14.5 bil-
1 Estimated by staff of the U.S. International Trade Commission.
lion during 1984-88 (table 3-10). As a result of this upswing in production and higher prices, U.S. producers increased net operating profits during 1984-88 by 15 to 20 percent.2
The U.S. construction · machinery industry had an operating rate of about 70 percent during 1984-88 as a result of a decade of restructuring activities. The streamlining of the U.S. industry included the adoption of such measures as·" just in time" (JIT) inventory practices, downsizing of plant operations, augmented product lines, and refinement of effective worldwide distribution and service capabilities emphasizing product quality.
Other industry changes during 1984-88 focused on increased globalization of the industry as high U.S. labor and material costs encouraged many U.S. companies to establish or expand foreign production through subsidiaries, joint ventures, or licensing.
Trade patterns Although the U.S. market grew relatively
slowly during 1984-88, U.S. imports of construction machinery increased by 162 percent during 1984-88, to $3.0 billion (table 3-11), in part because large U.S. producers imported different models and sizes of machines from their foreign subsidiaries and joint venture operations in order to round out product lines. U.S. imports of construction machinery were estimated to be 21 percent of total U.S. consumption in 1988, representing an increase of 91 percent over 1984. The rise in U.S. exports during 1984-88 (up 20 percent, to $3.2 billion) is largely attributable to shifts in exchange rates and increased construction activity in Canada and certain Latin American markets. These two markets accounted for 33 percent of all exports during those years (table 3-12).
Effects of the VRAs Supply and quality.-Domestic manufacturers
indicated that they have historically had difficulty in obtaining timely, high-quality domestic steel products, and that this has continued while ~he VRAs have been in force. To maintain smooth production schedules, the U.S. producers source a minimum of 80 percent of their steel from a variety of domestic sources, including mills, warehouses, and service centers.
For certain types of imported steel products, such as plate, VRA quotas were binding in 1987 from most sources; other VRA categories were not completely filled during this period. U.S. producers of construction machinery generally . believe that the VRAs have caused both tight supply and price increases of imported specialty and structural steel products. 3
2 Interview with officials of the Construction Industry Manufacturers Association. 3 Interviews with industry officials, February 1989.
3-13
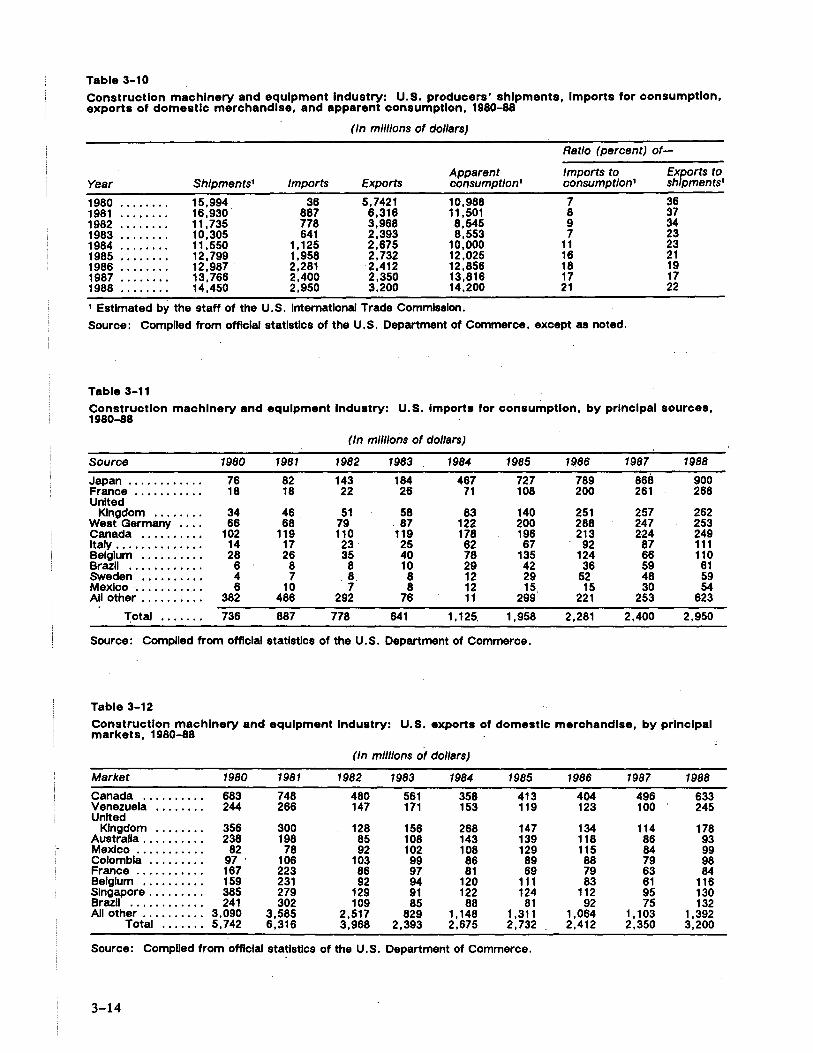
Table 3-10
Construction machinery and equipment Industry: U.S. producers' shipments, Imports for consumption, exports of domestic merchandise, and apparent consumption, 1980-88
(In ml/lions of dollars)
Ratio (percent) of-
Apparent Imports to Exports to Year Shlpments1 Imports Exports consumptlon1 consumptlon1 shlpments1
1980 ........ 15,994 36 5,7421 10,988 7 36 1981 ........ 16,930. 887 6,316 11,501 8 37 1982 ........ 11,735 778 3,968 8,545 9 34 1983 0 I I 0 O O 0 0 10,305 641 2,393 8,553 7 23 1984 ........ 11,550 1.125 2,675 10,000 11 23 1985 ........ 12,799 1,958 2.732 12,025 16 21 1986 ........ 12,987 . 2,281 2,412 12,856 18 19 1987 ........ 13,766 2,400 2,350 13,816 17 17 1988 ........ 14,450 2,950 3,200 14.200 21 22
1 Estimated by. the staff of the U.S. International Trade Commission.
Source: Compiled from official statistics of the U.S. Department of Commerce, except as noted.
Table 3-11
Construction machinery and equipment Industry: U.S. Imports for consumption, by prlnclpal sources, 1980-88
(In mllllons of dollars)
Source 1980 1981 1982 1983 1984 1985 1986 1987 1988
Japan ............ 76 82 143 184 467 727 789 868 900 France ........... 18 18 22 26 71 108 200 261 268 United
Kingdom ........ 34 46 51 58 83 140 251 257 262 West Germany •... 66 68 79 87 122 200 288 247 253 Canada .......... 102 119 110 119 178 196 213 224 249 Italy .............. 14 17 23 25 62 67 92 87 111 Belgium .......... 28 26 35 40 78 135 124 66 110 Brazil ............ 6 8 8 10 29 42 36 59 61 Sweden .......... 4 7 8. 8 12 29 52 48 59 Mexico·, .......... 6 10 7 8 12 15 15 30 54 All other .......... 382 486 292 76 11 299 221 253 623
i;otal ....... 736 887 778 641 1, 125. 1,958 2,281 2,400 2,950
Source: Compiled from official statistics of the U.S. Department of Commerce.
Table 3-12
Construction machinery and equipment Industry: markets, 1980-88
U.S. exports of domestic merchandise, by prlnclpal
(In ml/lions of dollars)
Market 1980 1981 1982 1983 1984 1985 1986 1987 1988
Canada .......... 683 748 480 561 358 413 404 496 633 Venezuela ........ 244 266 147 171 153 119 123 100 245 United
Kingdom ........ 356 300 128 156 268 147 134 114 178 Australia .......... 238 198 85 108 143 139 118 86 93 Mexico ........... 82 78 92 102 108 129 115 84 99 Colombia ......... 97 . 106 103 99 86 89 88 79 98 France ........... 167 223 86 97 81 69 79 63 84 Belgium .......... 159 231 92 94 120 111 83 61 116 Singapore .•....... 385 279 129 91 122 124 112 95 130 Brazil ............ 241 302 109 85 88 81 92 75 132 All other .......... 3,090 3,585 2,517 829 1, 148 1,311 1,064 1, 103 1,392
Total ....... 5,742 6,316 3,968 2,393 2,675 2,732 2,412 2,350 3,200
Source: Compiled from official statistics of the U.S. Department of Commerce.
3-14
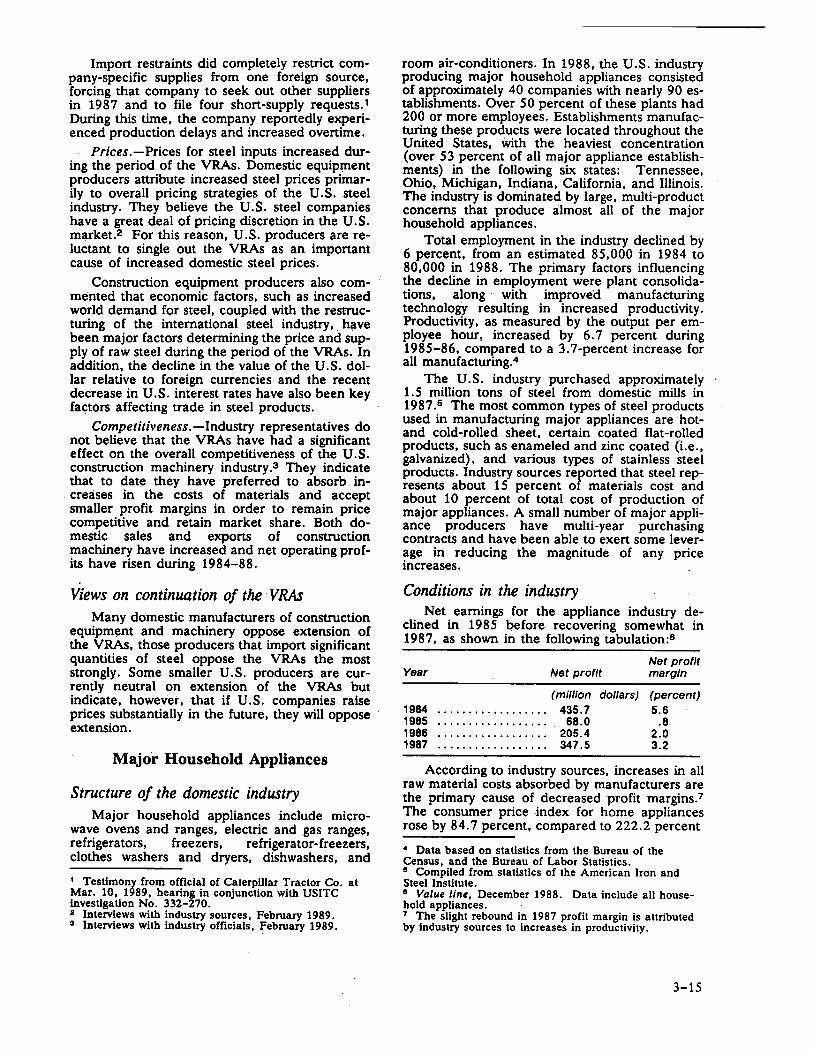
Import restraints did completely restrict company-specific supplies from one foreign source, forcing that company to seek out other suppliers in 1987 and to file four short-supply requests. 1
During this time, the company reportedly experienced production delays and increased overtime.
Prices. - Prices for steel inputs increased during the period of the VRAs. Domestic equip~ent producers attribute increased steel prices primarily to overall pricing strategies of the U.S. steel industry. They believe the U.S. steel companies have a great deal of pricing discretion in the U.S. market.2 For this reason, U.S. producers are reluctant to single out the VRAs as an important cause of increased domestic steel prices.
Construction equipment producers also commented that economic factors, such as increased world demand for steel, coupled with the restructuring of the international steel industry, . have been major factors determining the price and supply of raw steel during the period of the VRAs. In addition, the decline in the value of the U.S. dollar relative to foreign currencies and the recent decrease in.U.S. interest rates have also been key factors affecting trade in steel products.
Competitiveness.-Industry representatives do not believe that the VRAs have had a significant effect on the overall competitiveness of the U.S. construction machinery industry ,3 They indicate that to date they have preferred to absorb in-
. creases in the costs of materials and accept smaller profit margins in order to remain price competitive and retain market share. Both domestic sales and exports of construction machinery have increased and net operating profits have risen during 1984-88.
Views on continuation of the VRAs Many domestic manufacturers of construction
equipment and machinery oppose extension of the. VRAs, those producers that import significant quantities of steel oppose the VRAs the most strongly. Some smaller U.S. producers are currently neutral on extension of the VRAs but indicate, however, that if U.S. companies raise prices substantially in the future, they will oppose extension.
Major Household Appliances
Structure of the domestic industry Major household appliances include micro
wave ovens and ranges, electric and gas ranges, refrigerators, freezers, refrigerator-freezers, clothes washers and dryers, dishwashers, and
1 Testimony from official of Caterpillar Tractor Co. at Mar. 10, 1989, hearing in conjunction with USITC investigation No. 332-270. 2 Interviews with industry sources, February 1989. 3 Interviews with industry officials, ~ebruary 1989.
room air-conditioners. In 1988, the U.S. industry producing major household appliances consisted of approximately 40 companies with nearly 90 establishments. Over 50 percent of these plants had 200 or more employees. Establishments manufacturing these products were located throughout the United States, With the heaviest concentration (over 53 percent of all major appliance establishments) in the following six states: Tennessee, Ohio, Michigan, Indiana, California, and Illinois. The industry is dominated by large, multi-product concerns that produce almost all of the major household appliances.
Total employment in the industry declined by 6 percent, from an estimated 85,000 in 1984 to 80,000 in 1988. The primary factors influencing the decline in employment were plant consolidations, along · with improved manufacturing technology resulting in increased productivity. Productivity, as measured by the output per employee hour, increased by 6. 7 percent during 1985-86, compared to a 3.7-percent increase for all manufacturing.4
The U.S. industry purchased approximately 1.5 million tons of steel from domestic mills in 1987.s The most common types of steel products used in manufacturing major appliances are hotand cold-rolled sheet, certain coated flat-rolled products, such as enameled and zinc coated (i.e., galvanized), and various types of stainless steel products. Industry sources reported that steel represents about 15 percent of materials cost and about 10 percent of total cost of production of major appliances. A small number of major appliance producers have multi-year purchasing contracts and have been able to exert some leverage in reducing the magnitude of any price increases.
Conditions in the industry Net earnings for the appliance industry de
clined in 1985 before recovering somewhat in 1987, as shown in the following tabulation:&
Year Net profit
(mil/Ion dollars) 1984 . . . .. . . . . . .. . . . . . . 435. 7 1985 . . . . . . . . . . . . . . . . . . 68.0 1986 ................... 205.4 1987 .. .. . .. .. .. .. . .. .. 347.5
Net profit margin
(percent) 5.6
.8 2.0 3.2
According to industry sources, increases in all raw material costs absorbed by manufacturers are the primary cause of decreased profit margins.7
The consumer price index for home appliances rose by 84.7 percent, compared to 222.2 percent
4 Data based on statistics from the Bureau of the Census, and the Bureau of Labor Statistics. 11 Compiled from statistics of the American Iron and Steel Institute. 11 Value line, December 1988. Data include all household appliances. 7 The slight rebound in 1987 profit margin is attributed by industry sources to increases in productivity.
3-15
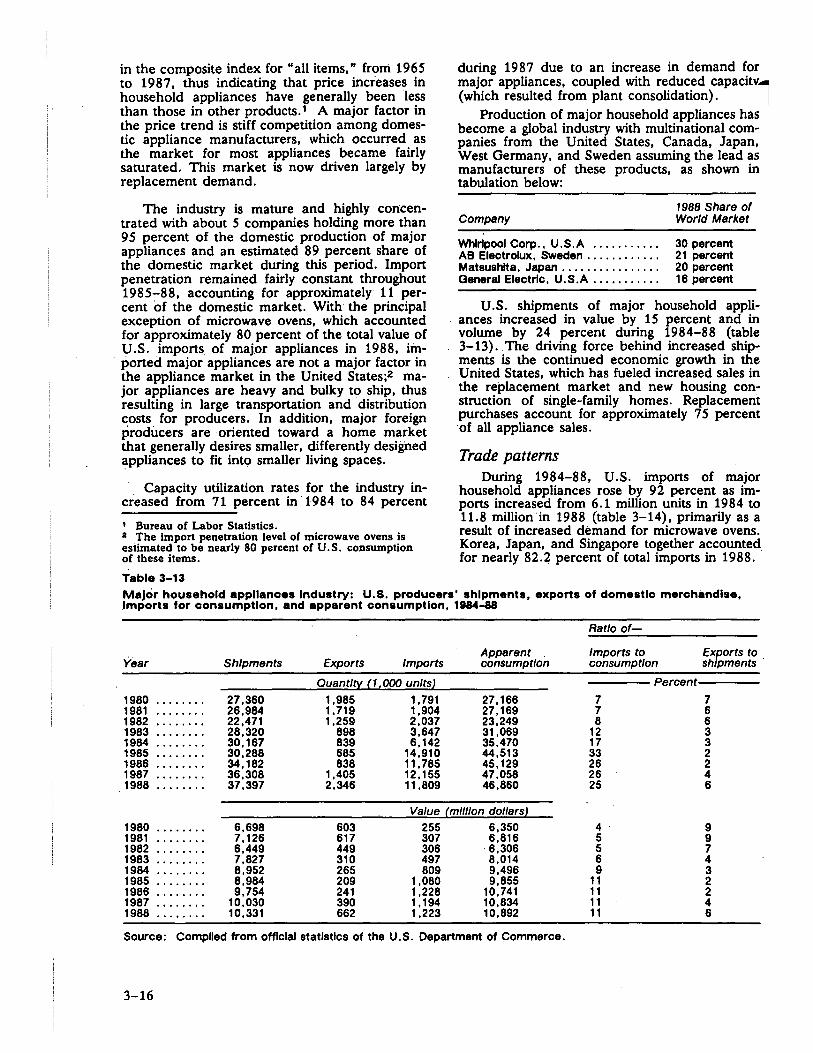
in the composite index for "all items, n from 1965 to 1987, thus indicating that price increases in household appliances have generally been less than those in other products. 1 A major factor in the price trend is stiff competition among domestic appliance manufacturers, which occurred as the market for most appliances became fairly saturated. This market is now driven largely by replacement demand.
The industry is mature and highly concentrated with about 5 companies holding more than 9 5 percent of the domestic production of major appliances and an estimated 89 percent share of the domestic market during this period. Import penetration remained fairly constant throughout 1985-88, accounting for approximately 11 percent of the domestic market. With the principal exception of microwave ovens, which accounted for approximately 80 percent of the total value of U.S. imports of major appliances in 1988, iin-
. ported major appliances are not a major factor in the appliance market in the United States;2 major appliances are heavy and bulky to ship, thus resulting in large transportation and distribution costs for producers. In addition, major foreign producers are oriented toward a home market that generally desires smaller, differently designed appliances to fit into smaller living spaces.
. Capacity utilization rates for the industry increased from 71 percent in" 1984 to 84 percent
1 Bureau of Labor Statistics. 2 The import penetration level of microwave ovens is estimated to be nearly 80 percent of U.S. consumption of these items.
Table 3-13
during 1987 due to an increase in demand for major appliances, coupled with reduced capacitv.1 (which resulted from plant consolidation).
Production of major household appliances has become a global industry with multinational companies from the United States, Canada, Japan, West Germany, and Sweden assuming the lead as manufacturers of these products, as shown in tabulation below:
Company
Whlrfpool Corp .• U.S. A .......... . AB Electrolux, Sweden ........... . Matsushita, Japan ............... . General Electrtc, U.S.A .......... .
1988 Share of World Market
30 percent 21 percent 20 percent 16 percent
U.S. shipments of major household appliances increased in value by 15 percent and in volume by 24 percent during 1984-88 (table 3-13) .. The driving force behind increased shipments is the continued economic growth in the United States, which has fueled increased sales in the replacement market and new housing construction of single-family homes. Replacement purchases account for approximately 7 5 percent ·of all appliance sales.
Trade patterns During 1984-88, U.S. imports of major
household appliances rose by 92 percent as imports increased from 6.1 million units in 1984 to 11.8 million in 1988 (table 3-14), primarily as a result of increased demand for microwave ovens. Korea, Japan, and Singapore together accounted_ for nearly 82.2 percent of total imports in 1988.
Major household appttances Industry: U.S. producers' shipments, exports of domestic merchandise, .Imports for consumption, and apparent consumption, 1984-88
Ratio of-
Year Apparent Imports to Exports to
Shipments Exports Imports consumption consumption shipments
Quantl!t_ (1 1 000 unltsl Percent
1980 ........ 27,360 1,985 1,791 27, 166 7 7 1981 ........ 26,984 1. 719 1,904 27, 169 7 6 1982 ........ 22,471 1,259 2,037 23,249 8 6 1983 ........ 28,320 898 3,647 31,069 12 3 1984 ........ 30, 167 839 6, 142 35,470 17 3 1985 ........ 30,288 685 14,910 44,513 33 2 1986 ........ 34, 182 838 11. 785 45, 129 26 2 1987 o o o o o Io o 36,308 1,405 12, 155 47,058 26 4 1988 ........ 37,397 2,346 11,809 46.860 25 6
Value (million dollarsl 1980 ........ 6,698 603 255 6,350 4 9 1981 ........ 7, 126 617 307 6,816 5 9 1982 ........ 6,449 449 306 . 6,306 5 7 1983 ........ 7,827 310 497 8,014 6 4 1984 ........ 8,952 265 809 9,496 9 3 1985 ........ 8,984 209 1,080 9,855 11 2 1986 ........ 9,754 241 1,228 10,741 11 2 1987 ........ 10,030 390 1, 194 10.834 11 4 1988 ........ 10,331 662 1,223 10,892 11 6
Source: Complied from official statistics of the U.S. Department of Commerce.
3-16
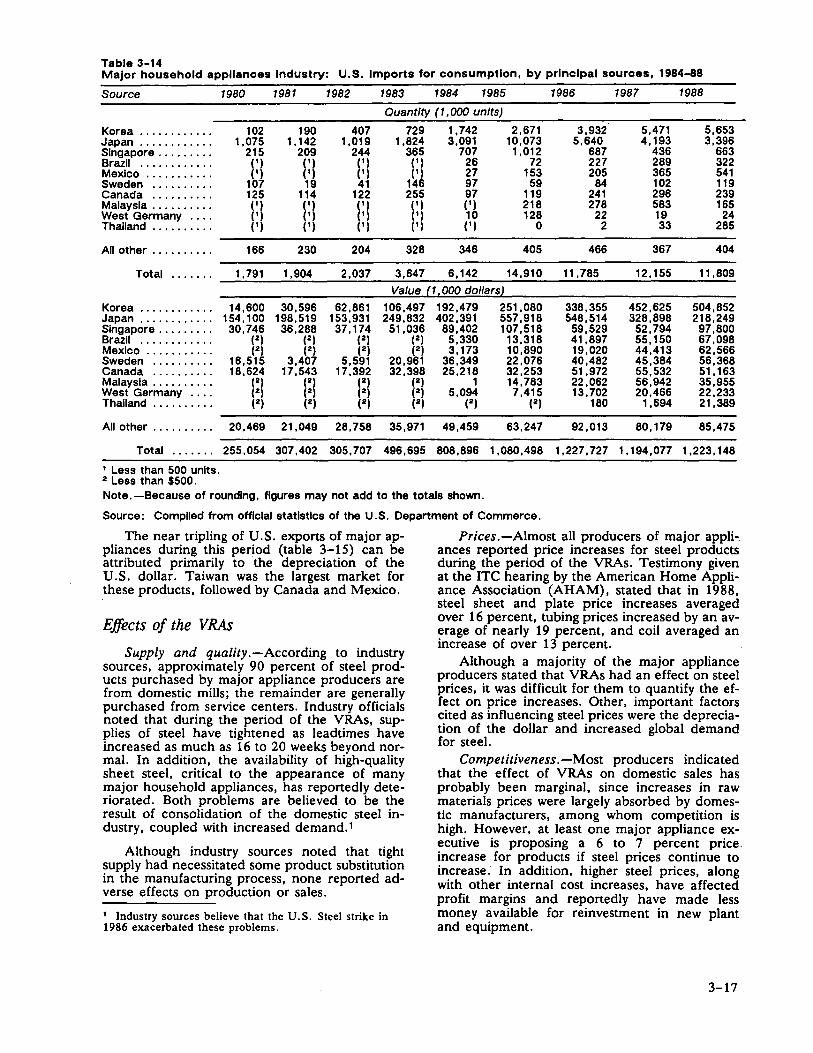
Table 3-14 Major household appliances Industry: U.S. Imports for consumption, by principal sources, 1984-88
Source 1980 1981 1982 1983 1984 1985 1986 1987 1988
Quantity (1,000 units)
Korea ............ 102 190 407 729 1,742 2,671 3,932 5,471 5,653 Japan ............ 1,075 1, 142 1,019 1,824 3,091 10,073 5,640 4, 193 3,396 Singapore ...•..... 215 209 244 365 707 1,012 687 436 663 Brazil ............ (11 (11 (11 (11 26 72 227 289 322 Mexico ........... (1) (11 (11 111 27 153 205 365 541 Sweden .......... 107 19 41 146 97 59 84 102 119 Canada .......... 125 114 122 255 97 119 241 296 239 Malaysia .......... (1) (1) (1) (11 11) 218 278 583 165 West Germany .... (11 (11 (1) 111 10 128 22 19 24 Thailand .......... (11 (11 (11 (11 (11 0 2 33 285
All other .......... 166 230 204 328 346 405 466 367 404
Total ....... 1, 791 1,904 2,037 3,647 6, 142 14,910 11, 785 12, 155 11,809
Value (1 1 000 dollarsl
Korea ............ 14,600 30,596 62,861 106,497 192,479 251,080 338,355 452,625 504,852 Japan ............ 154, 100 198,519 153,931 249,832 402,391 557,918 548,514 328,898 218,249 Singapore ......... 30,746 36,288 37, 174 51,036 89,402 107,518 59,529 52,794 97,800 Brazil ....•....... (21 (21 (21 (21 5,330 13,318 41,897 55, 150 67,098 Mexico ........... (21 (21 (21 (21 3, 173 10,890 19,020 44,413 62,566 Sweden .......... 16,515 3,407 5,591 20,961 36,349 22,076 40,482 45,384 56,368 Canada .......... 18,624 17,543 17,392 32,398 25,218 32,253 51,972 55,532 51, 163 Malaysia .......... 121 (2) (21 121 1 14,783 22,062 56,942 35,955 West Germany .... (21 121 (21 121 5,094 7,415 13,702 20,466 22,233 Thailand .......... 121 (21 (21 (21 (2) (21 180 1,694 21,389
All other .......... 20,469 21,049 28, 758 35,971 49,459 63,247 92,013 80, 179 85,475
Total ....... 255,054 307,402 305,707 496,695 808,896 1,080,498 1,227,727 1, 194,077 1,223, 148
1 Less than 500 units. 2 Less than $500. Note.-Because of rounding, figures may not add to the totals shown.
Source: Complied from offlclal statistics of the U.S. Department of Commerce.
The near tripling of U.S. exports of major appliances during this period (table 3-15) can be attributed primarily to the depreciation of the U.S. dollar. Taiwan was the largest market for these products, followed by Canada and Mexico.
Effects of the VRAs
Supply and quality.-According to industry sources, approximately 90 percent of steel products purchased by major appliance producers are from domestic mills; the remainder are generally purchased from service centers. Industry officials noted that during the period of the VRAs, supplies of steel have tightened as leadtimes have increased as much as 16 to 20 weeks beyond normal. In addition, the availability of high-quality sheet steel, critical to the appearance of many major household appliances, has reportedly deteriorated. Both problems are believed to be the result of consolidation of the domestic steel industry, coupled with increased demand. 1
Although industry sources noted that tight supply had necessitated some product substitution in the manufacturing process, none reported adverse effects on production or sales.
1 Industry sources believe that the U.S. Steel strike in 1986 exacerbated these problems.
Prices.-Almost all producers of major appliances reported price increases for steel products during the period of the VRAs. Testimony given at the ITC hearing by the American Home Appliance Association (AHAM), stated that in 1988, steel sheet and plate price increases averaged over 16 percent, tubing prices increased by an average of nearly 19 percent, and coil averaged an increase of over 13 percent.
Although a majority of the major appliance producers stated that VRAs had an effect on steel prices, it was difficult for them to quantify the effect on price increases. Other, important factors cited as influencing steel prices were the depreciation of the dollar and increased global demand for steel.
Competitiveness. -Most producers indicated that the effect of VRAs on domestic sales has probably been marginal, since increases in raw materials prices were largely absorbed by domestic manufacturers, among whom competition is high. However, at least one major appliance executive is proposing a 6 to 7 percent price. increase for products if steel prices continue to increase. In addition, higher steel prices, along with other internal cost increases, have affected profit margins and reportedly have made less money available for reinvestment in new plant and equipment.
3-17
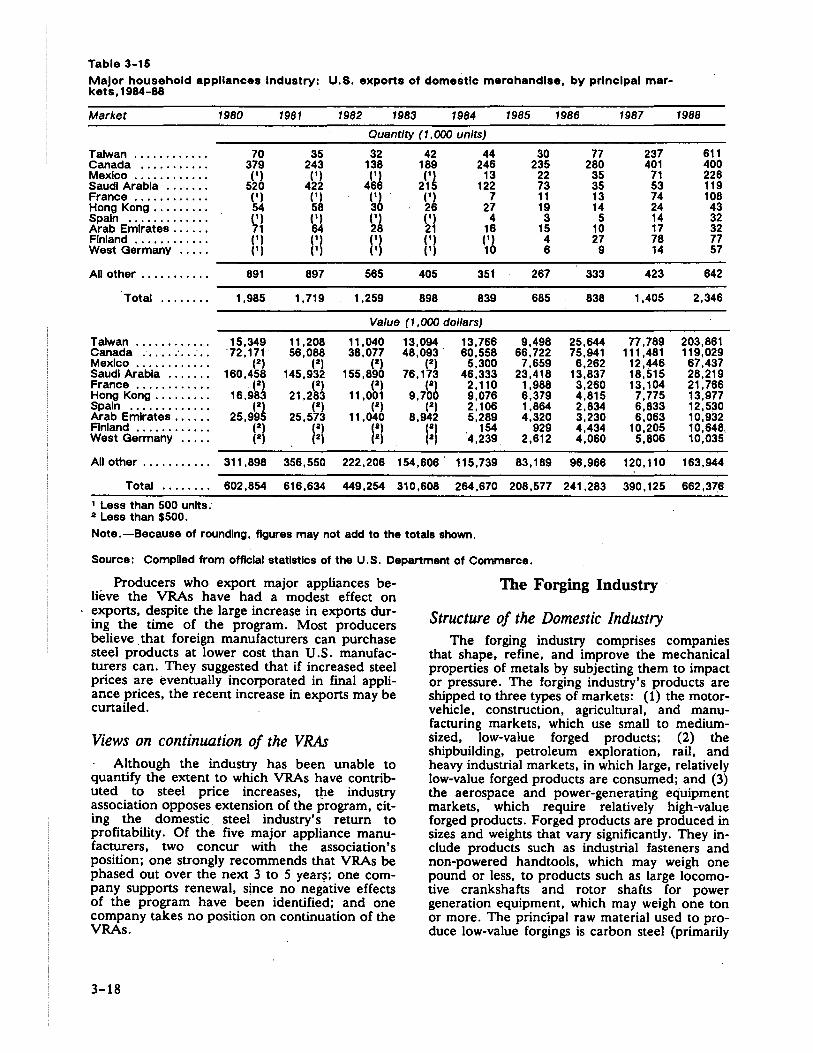
Table 3-15
Major household appllances Industry: U.S. exports of domestic merchandise, by prlnclpal markets, 1984-88
Market 1980 1981 1982 1983 1984 1985 1986 1987 1988
Quantity (1,DDD units)
Taiwan ............ 70 35 32 42 44 30 77 237 611 Canada ........... 379 243 138 189 246 235 280 401 400 Mexico ............ (1) (1) ,,i ,,~ 13 22 35 71 226 Saudi Arabia ....... 520 422 46 21 122 73 35 53 119 France ............ (1) ~A ~~ ~i 7 11 13 74 108 Hong Kong ......... 54 27 19 14 24 43 Spain ............. ~l (1) ~A (1) 4 3 5 14 32 Arab Emirates ...... 64 21 16 15 10 17 32 Finland ............ (1)
1:1 111 111 (1) 4 27 78 77 West Germany ..... ,,, (1 (1 10 6 9 14 57
All other ........... 891 897 565 405 351 267 333 423 642
Total ........ 1,985 1,719 1,259 898 839 685 838 1,405 2,346
Value (1,000 dollars)
Taiwan ............ 15,349 11,208 11,040 13,094 13,766 9,498 25,644 77,789 203,861 Canada ........... ·12, 171 56,088 38,077 48,093. 60,558 66,722 75,941 111,481 119,029 Mexico ............ (2) (2) (2) (2) 5,300 7,659 6,262 12,446 67,437 Saudi Arabia ....... 160,458 145,932 155,890 76, 173 46,333 23,418 13,837 18,515 28,219 France ............ (2) (2) (2) (2) 2, 110 1,988 3,260 13,104 21, 766 Hong Kong ......... 16,983 21,283 11,001 9,700 9,076 6,379 4,815 7,775 13,977 Spain ............. (2) (2) (2) (2) 2, 106 1,864 2,834 6,833 12,530 Arab Emirates ...... 25,995 25,573 11,040 8,942 5,289 4,320 3,230 6,063 10,932 Finland ............ (2) (2)
1:1 (2) 154 929 4,434 10,205 10,648,
West Germany ..... (2) (2) (2) 4,239 2,612 4,060 5,806 10,035
All other ........... 311,898 356,550 222,206 154,606 115,739 83,189 96,966 120,110 163,944
Total ........ 602,854 616,634 449,254 310,608 264,670 208,577 241,283 390, 125 662,376 1 Less than 500 units. 2 Less than $500.
Note. -Because of rounding, figures may not add to the totals shown.
Source: Compiled from official statistics of the U.S. Department of Commerce.
Producers who export major appliances believe the VRAs have had a modest effect on exports, despite the large increase in exports during the time of the program. Most producers believe . that foreign manufacturers can purchase steel products at lower cost than U.S. manufacturers can. They suggested that if increased steel prices are eventually incorporated in final appliance prices, the recent increase in exports may be curtailed.
Views on continuation of the VRAs Although the industry has been unable to
quantify the extent to which VRAs have contributed to steel price increases, t!ie industry association opposes extension of the program, citing the domestic steel industry's return to profitability. Of the five major appliance manufacturers, two concur with the association's position; one strongly recommends that VRAs be phased out over the next 3 to 5 year~; one company supports renewal, since no negative effects of the program have been identified; and one company takes no position on continuation of the VRAs.
3-18
The Forging Industry
Structure of the Domestic Industry The forging industry comprises companies
that shape, refine, and improve the mechanical properties of metals by subjecting them to impact or pressure. The forging industry's products are shipped to three types of markets: (1) the motorvehicle, construction, agricultural, and manufacturing markets, which use small to mediumsized, low-value forged products; (2) the shipbuilding, petroleum exploration, rail, and heavy industrial markets, in which large, relatively low-value forged products are consumed; and (3) the aerospace and power-generating equipment markets, which require relatively high-value forged products. Forged products are produced in sizes and weights that vary significantly. They include products such as industrial fasteners and non-powered handtools, which may weigh one pound or less, to products such as large locomotive crankshafts and rotor shafts for power generation equipment, which may weigh one ton or more. The principal raw material used to produce low-value forgings is carbon steel (primarily
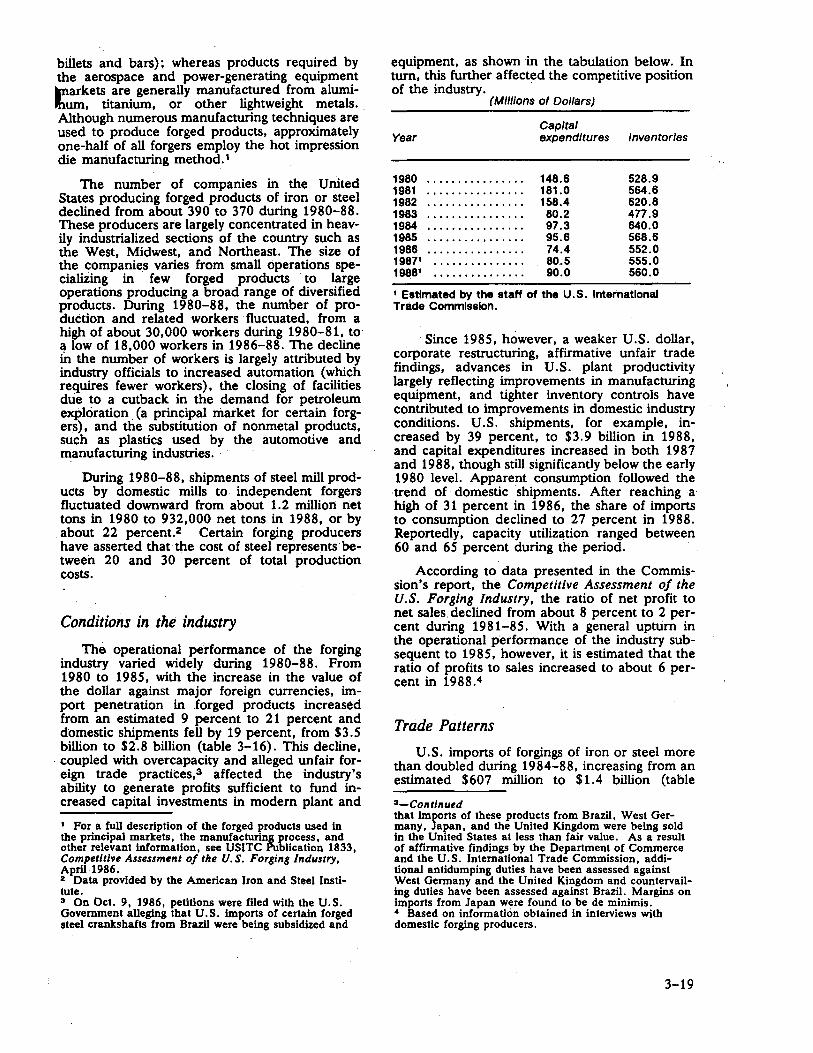
billets and bars); whereas products required by the aerospace and power-generating equipment ~arkets are generally manufactured from alumilium, titanium, or other lightweight metals .. Although numerous manufacturing techniques are used to produce forged products, approximately one-half of all forgers employ the hot impression die manufacturing method. 1
The number of companies in the Uruted States producing forged products of iron or steel declined from about 390 to 370 during 1980-88. These producers are largely concentrated in heavily industrialized sections of the country such as the West, Midwest, and Northeast. The size of the companies varies from small operations specializing in few forged products · to large operations producing a broad range of diversified products. During 1980-88, the number of production and related workers fluctuated, from a high of about 30,000 workers during 1980-81, to a low of 18,000 workers in 1986-88. The decline fu the number of workers is largely attributed by industry officials to increased automation (which requires fewer workers), the closing of facilities due to a cutback in the demand for petroleum exploration. (a prindpal market for certain forgers), and the substitution of nonmetal products, such as plastics used by the automotive and manufacturing industries.
During 1980-88, shipments of steel mill products by domestic mills to independent forgers fluctuated downward from about 1.2 million net tons in 1980 to 932,000 net tons in 1988, or by
. about 22 percent.2 Certain forging producers have asserted that the cost of steel represents between 20 and 30 percent of total production costs.
Conditions in the industry
. The operational performance of the forging industry varied widely during 1980-88. From 1980 to 1985, with the increase in the value of the dollar against major foreign currencies, import penetration in forged products increased from an estimated 9 percent to 21 percent and domestic shipments fell by 19 percent, from $3.5 billion to $ 2. 8 billion (table 3-16) . This decline,
. .coupled with overcapacity and alleged unfair foreign trade practices,3 affected the industry's ability to generate profits sufficient to fund increased capital investments in modem plant and
1 For a full description of the forged products used in the principal markets, the manufacturing process, and other relevant information, see USITC Publication 1833, Competitive Assessment of the U.S. Forging Industry, April 1986. 2 Data provided by the American Iron and Steel Institute. 3 On Oct. 9, 1986, petitions were filed with the U.S. Government alleging that U.S. imports of certain forged steel crankshafts from Brazil were being subsidized and
equipment, as shown in the tabulation below. In tum, this further affected the competitive position of the industry. ·
(Miiiions of Dollars)
Year Capital expenditures Inventories
1980 ............... . 1981 ............... . 1982 ............... . 1983 ............... . 1984 ............... . 1985 ............... . 1986 ............... . 19871 •••••••••••••••
19881 •••••••••••••••
148.6 181.0 158.4 80.2 97.3 95.6 74.4 80.5 90.0
528.9 564.6 620.8 477.9 640.0 568.6 552.0 555.0 560.0
1 Estimated by the staff of the U.S. International Trade Commission.
Since 1985, however, a weaker U.S. dollar, corporate restructuring, affirmative unfair trade findings, advances in U.S. plant productivity largely reflecting improvements in manufacturing equipment, and tighter inventory controls have contributed to improvements in domestic industry conditions. U.S. shipments, for example, increased by 39 percent, to $3.9 billion in 1988, and capital expenditures increased in both 1987 and 1988, though still significantly below the early 1980 level. Apparent consumption followed the trend of· domestic shipments. After reaching a high of 31 percent in 1986, the share of imports to consumption declined to 2 7 percent in 19 8 8 . Reportedly, capacity utilization ranged between 60 and 65 percent during the period. ·
According to data presented in the Commission's report, the Competitive Assessment of the U.S. Forging Industry, the ratio of net profit to net sales. declined from about 8 percent to 2 percent during 1981-85. With a general upturn in the operational performance of the industry subsequent to 1985, however, it is estimated that the ratio of profits to sales increased to about 6 percent in 1988.4
Trade Patterns
U.S. imports of forgings of iron or steel more than doubled during 1984-88, increasing from an estimated $607 million to $1.4 billion (table
3-Continued that imports of these products from Brazil, West Germany, Japan, and the United Kingdom were being sold in the United States at less than fair value. As a result of affirmative findings by the Department of Commerce and the U.S. International Trade Commission, additional antidumping duties have been assessed against West Germany and the United Kingdom and countervailing duties have been assessed against Brazil. Margins on imports from Japan were found to be de minimis. ' Based on information obtained in interviews with domestic forging producers.
3-19

Table 3-16 Forgings of Iron or steel: U.S. producers' shipments, Imports for consumption, exports of domestic merchandise, and apparent consumption, 1980-88
Ratio (percent) of-
Apparent Imports to E~orts to Year Shipments Imports Exports consumption consumption sh pments1
1980 ........ 3,476 350 125 3,701 9 4 1981 ........ 3,864 386 101 4, 149 .9 3 1982 ........ 3, 161 340 79 3,422 10 2 1983 ........ 2,707 363 69 3,001 12 3 1984 ........ 3,175 607 73 3,709 16 2 1985 ........ 2,809 728 70 3,467 21 2 1986 ........ 2,560 1, 128 60 3,628 31 2 1987 ........ 3,400 1, 173 64 4,509 26 2 1988 ........ 3,900 1,408 77 5,231 27 2
Source: Estimated by the staff of the U.S. lntematlonal Trade Commission; producers' shipments during 1980-86 were compiled from official statistics of the U.S. Department of Commerce.
3-16). 1 U.S. forging producers reported disadvantageous exchange rates and the rising cost of foreign products as the principal reasons for the increase in the value of imports. Canada, the largest supplier of imports to the U.S. market, increased its share of total imports from an estimated 4 7 percent to about 5 8 percent during
. 1980-84, before declining to a low of 34 percent in 1988 (table 3-17).2 Approximately 65 percent of imports from Canada consists of automotive parts such as crankshafts and connecting rods used by U.S. automotive manufacturers. Reportedly, about 10 percent of all forging operations in Canada are under U.S. ownership, and it is estimated that these operations account for approximately 40 percent of Canadian exports to the United States. The share of imports from
1 Import and export data for all forged products of iron or steel are not separately provided for by official statistics. Import and export data presented in tables 3-16, 3-17, and 3-18 are estimates compiled from information presented in the Commission's report, Competitille Assessment of the U.S. Forging Industry, and data compiled from official statistics of the U.S. Department of Commerce, which include forged and nonforged products. t Official data for import and export product classification include such a large volume of nonforged products that tables showing the vaule of imports and exports on a country basis would be misleading. Data on country shares are therefore provided. The country shares, however, continue to reflect substantial trade in nonforged products.
Table 3-17
Japan, the second-largest supplier, fluctuated upward from an estimated 11 percent of total U.S. imports in 1980 to 21 percent in 1988. .
During 1980-84, the share of imports of forgings from countries subject to the VRAs (i.e., Japan, Brazil, Mexico, United Kingdom, Italy, France, and West Germany) decline_d from an estimated 43 percent to 34 percent of total U.S. imports, before increasing to 55 percent in 1988; The share of imports from non-VRA countries was relatively low throughout the period. Industry sources allege that some VRA quotas were circumvented by downstream dumping of imports of certain forged products not covered under the VRAs.
During 1984-88, U.S. exports of forgings of iron or steel increased by 5 percent, from an estimated $73 million to $77 million (table 3-16): The major export markets for U .S.-produced forged products are Canada and Mexico. The automotive industries in these countries are the principal consumers of U.S. exports.
The share of U.S. exports to countries subject to the VRAs remained at an estimated 26 percent of total U.S. exports during most of 1980-1984, whereas during 1984-88, the share of U.S. exports to those countries increased from an estimated 26 percent to 34 percent.
Forgings of Iron or steel: U.S. Import shares of prlnclpal suppllers, 1980-88 (In percent)
Source
Canada ......... . Japan ........... . W. Germany ...... . United Kingdom ... . France .......... . Mexico .......... . Italy ...... : ...... . Brazil .•.......... Sweden ......... . Taiwan .......... .
Total ...... .
1980
47 11
8 12
4 1 6 2
(1) (1)
91
1 Less than 0. 5 percent.
1981
49 11 7
13 4 1 6 2
(1) (')
93
1982
50 10 7
12 7 1 5 2
(I) (I)
94
1983 1984
59 58 8 9 6 6 7 6 6 6 1 1 4 4 2 2 1 1 2 2
96 95
1985
54 10 5 7 7 1 4 2 1 2
93
1986
39 18 9 7 7 3 4 2 2 2
93
1987 1988
37 34 20 21 10 9 7 7 7 6 4 5 4 4 3 3 2 2 1 1
95 92
Source: Estimated by the staff of the U.S. International Trade Commission using data of the U.S. Department of Commerce.
3-20

Table 3-18
Forgings of Iron or steel: U.S. export shares to principal markets, 1980-88
(In percent)
Market 1980 1981 1982 1983 1984 1985 1986 1987 1988
Canada .......... 15 19 17 23 27 25 28 26 28 Mexico ........... 9 10 9 7 12 13 16 13 14 Belglum .......... 0 0 0 0 0 0 0 0 5 United
Kingdom ....... 5 5 4 4 3 3 4 4 4 Venezuela ........ 3 5 5 2 3 3 4 4 4 Australia .......... 2 2 3 2 2 2 2 3 3 Japan ............ 4 3 3 3 4 2 2 2 2 Singapore ......... 2 2 2 2 2 2 2 2 2 W. Germany ...... 3 2 3 2 2 2 2 2 2 Saudi Arabia ...... 7 5 7 6 4 3 3 2 2
Total ....... 50 53 53 51 59 55 63 58 66
Source: Estimated by the staff of the U.S. International Trade Commission using data of the U.S. Department of Commerce.
Effects of the VRAs
Prices.-One of the principal issues of concern to forgers is the apparent effect the VRAs have had on prices. According to a number of major forging producers, the implementation of the VRAs resulted in price increases of 20 to 40 percent, principally for billets and bar material, during 1985-88. These increases reportedly could not easily be passed along to customers without losing sales to competitive sources. Forging producers have also expressed concern about having to pay surcharges for scrap and certain alloys, be· ginning in 1987.
Upward price pressures would appear to be a continuing problem for the forgers. According to the trade press, 1 during the last half of 1988, sev· eral major mills raised prices on certain bar products. LTV Steel Co. raised prices $25 and $30 a ton (5 to 7 percent) on hot-rolled and cold· rolled bars, respectively, and Bethlehem Steel increased prices on hot-rolled bars by $25 a ton (5 percent). During the same period, Inland Steel and North Star Steel raised prices by $10 to $20 per. ton for carbon- and alloy-grade special bar quality products {1 to 3 percent) and Bliss and Laughlin hiked prices by $15 to $27 per ton (2 to 3 percent). With respect to surcharges, Bethlehem Steel decided to reduce its scrap surcharge from $40 to $25 per ton, effective in February 1988.
Inasmuch as the VRAs for steel bars were not binding (80 percent of quotas were filled in 1987; the available information indicate that the level was significantly lower in 1988), such price increases would appear to be directly attributable more to stronger global demand and reduced sup· ply of steel products in the U.S. market, reflecting domestic restructuring and capacity cutbacks, and to the depreciation of the dollar relative to other currencies rather than the VRAs.
1 American Metal Market, Jan. 20, 1988.
The VRAs would have had more direct effect on prices of billets as quotas for semifinished steel, which include billets, were filled from most sources in 1987. In 1988, however, it would ap· pear that quota tonnages were not as filled. Such a low percentage would have mitigated the price effects.
Supply and quality.-A second issue of con· cern to producers is the inability to obtain acJ.equate steel tonnages of bar and billet material to fill customer orders on a timely basis. Alleg· edly, these shortages are a reflection both of limitations imposed by the VRAs and of reduced capacity of domestic steel producers.2 Several forgings representatives suggested that domestic . steel producers have been more inclined to elimi· nate lower value steel bar operations rather than more profitable flat-rolled steel products opera· lions when closing facilities.
Reflecting limited domestic supply and rising global demand, the lead-times for delivery of steel products increased from 4 to 8 weeks beginning in early 1988 according to certain Midwest forg· · ings producers; prior to that period, production material reportedly could be obtained in 2 weeks or less. In addition, inadequate timely supply has reportedly caused producers to purchase from non traditional domestic sources, thus fostering uncertainty as to the quality of the material purchased. One major forgings producer in the Midwest noted that mill material often had to be reworked in order to continue supplying production lines with feedstock. This delay creates additional expense, slows production time, and adversely affects machinery life.
According to certain forgers, the increase in . prices for forged metal products has increased the use of nonmetal materials in certain automotive, manufacturing, and aerospace applications.
2 As of February 1989, forging producers had not filed short-supply requests with the Department of Commerce for additional bar or billet material.
3-21
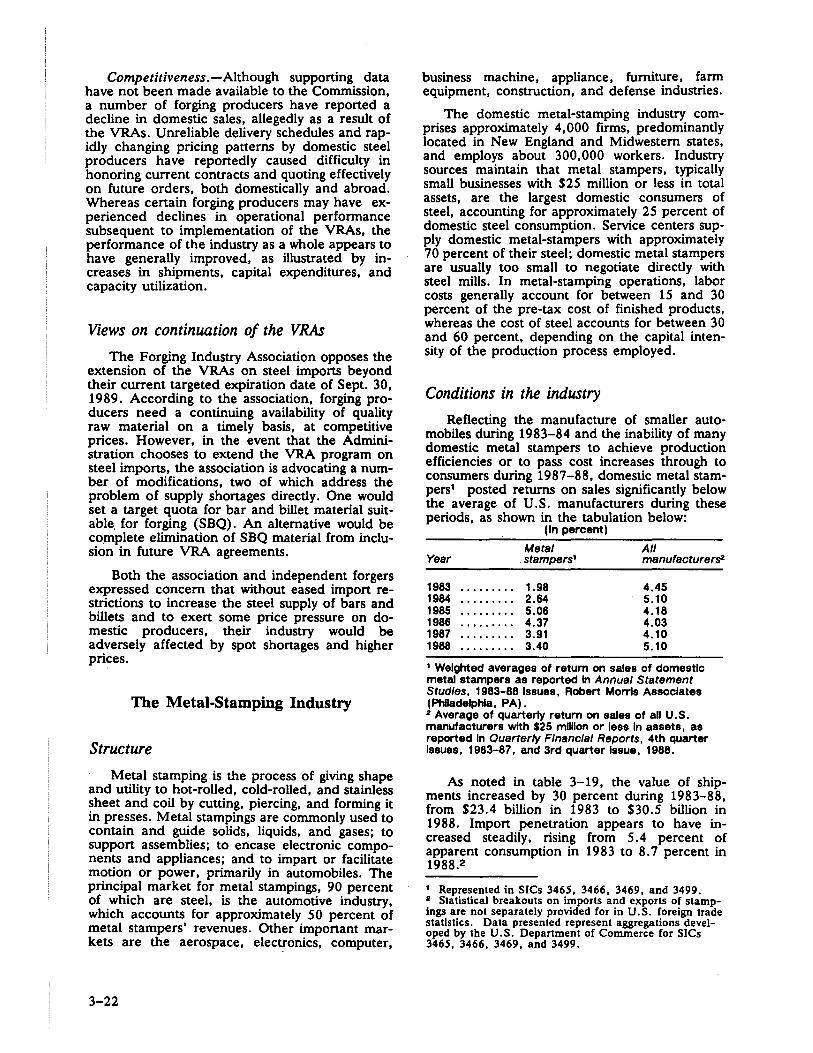
Competitiveness. -Although supporting data have not been made available to the Commission, a number of forging producers have reported a decline in domestic sales, allegedly as a result of !he VRAs .. Unrel~a?le delivery schedules and rapidly changing pncmg patterns by domestic steel producers have reportedly caused difficulty in honoring current contracts and quoting effectively on future orders, both domestically and abroad. Whereas certain forging producers may have experienced declines in operational performance subsequent to implementation of the VRAs, the performance of the industry as a whole appears to have generally improved, as illustrated by increases in shipments, capital expenditures, and capacity utilization.
Views on continuation of the VRAs
The Forging Industry Association opposes the extension of the VRAs on steel imports beyond their current targeted expiration date of Sept. 30, 1989. According to the association, forging producers need a continuing availability of quality raw material on a timely basis, at competitive prices. However, in the event that the Administrati~m chooses to extend the VRA program on steel imports, the association is advocating a number of modifications, two of which address the problem of supply shortages directly. One would set a target quota for bar and billet material suitable. for forging (SBQ). An alternative would be complete elimination of SBQ material from inclusion in future VRA agreements.
Both the association and independent forgers expressed concern that without eased import resf:rictions to increase the steel supply of bars and billets and to exert some price pressure on domestic producers, their industry would be ad.versely affected by spot shortages and higher pnces.
The Metal-Stamping Industry
Structure
· Metal stamping is the process of giving shape and utility to hot-rolled, cold-rolled, and stainless ~heet and coil by cutting, piercing, and forming it in presses. Metal stampings are commonly used to contain and gui~e solids, liquids, and gases; to support assembhes; to encase electronic componen~ and appliances; and to impart or facilitate m?ti~n or power, primarily in automobiles. The pnnci~al market for metal stampings, 90 percent of .which are steel, is the automotive industry, which accounts for approximately SO percent of metal stampers' revenues. Other important markets are the aerospace, elec~onics, computer,
3-22
business machine, appliance, furniture, farm equipment, construction, and defense industries.
The domestic metal-stamping industry comprises approximately 4,000 firms, predominantly located in New England and Midwestern states, and employs about 300,000 workers. Industry sources maintain that metal stampers, typically small businesses with $25 million or less in total assets, are the largest domestic consumers of steel, accounting for approximately 25 percent of domestic steel consumption. Service centers supply domestic metal-stampers with approximately 70 percent of their steel; domestic metal stampers are usually too small to negotiate directly with steel mills. In metal-stamping operations, labor costs generally account for between 15 and 30 percent of the pre-tax cost of finished products, whereas the cost of steel accounts for between 30 and 60 percent, depending on the capital intensity of the production process employed.
Conditions in the industry
Reflecting the manufacture of smaller automobiles during 1983-84 and the inability of many domestic metal stampers to achieve production efficiencies or to pass cost increases through to consumers during 1987-88, domestic metal stampers1 posted returns on sales significantly below the average of U.S. manufacturers during these periods, as shown in the tabulation below:
(In percent)
Metal All Year .stampers1 manufacturers2
1983 • •.•.I I I I 1.98 4.45 1984 I I I I Io I I I 2.64 5.10 1985 I I Io I I I 1 1 5.06 4.18 1986 I I I I I I I I I 4.37 4.03 1987 I I I I I I I I I 3.91 4.10 1988 I I I I I I I I I 3.40 5.10
1 Weighted averages of return on sales of domestic metal stampers as reported In Annual Statement Studies, 1983-88 Issues, Robert Morris Associates (Phlladelphla, PA). 2 Average of quarterly return on sales of all U.S. manufacturers with $25 m!Ulon or less In assets, as reported In Quarterly Financial Reports, 4th quarter Issues, 1983-87, and 3rd quarter Issue, 1988.
As .noted in table 3-19, the value of shipments increased by 30 percent during 1983-88, from $23.4 billion in 1983 to $30.S billion in 1988. Import penetration appears to have increased steadily, rising from S .4 percent of apparent consumption in 1983 to 8.7 percent in 1988.2
1 Represented in SICs 3465, 3466, 3469 and 3499 2 Statistical breakouts on imports and exports of st~mpings a~e not separately provided for in U.S. foreign trade statistics. Data presented represent aggregations developed by the U.S. Department of Commerce for SICs 3465, 3466, 3469, and 3499.
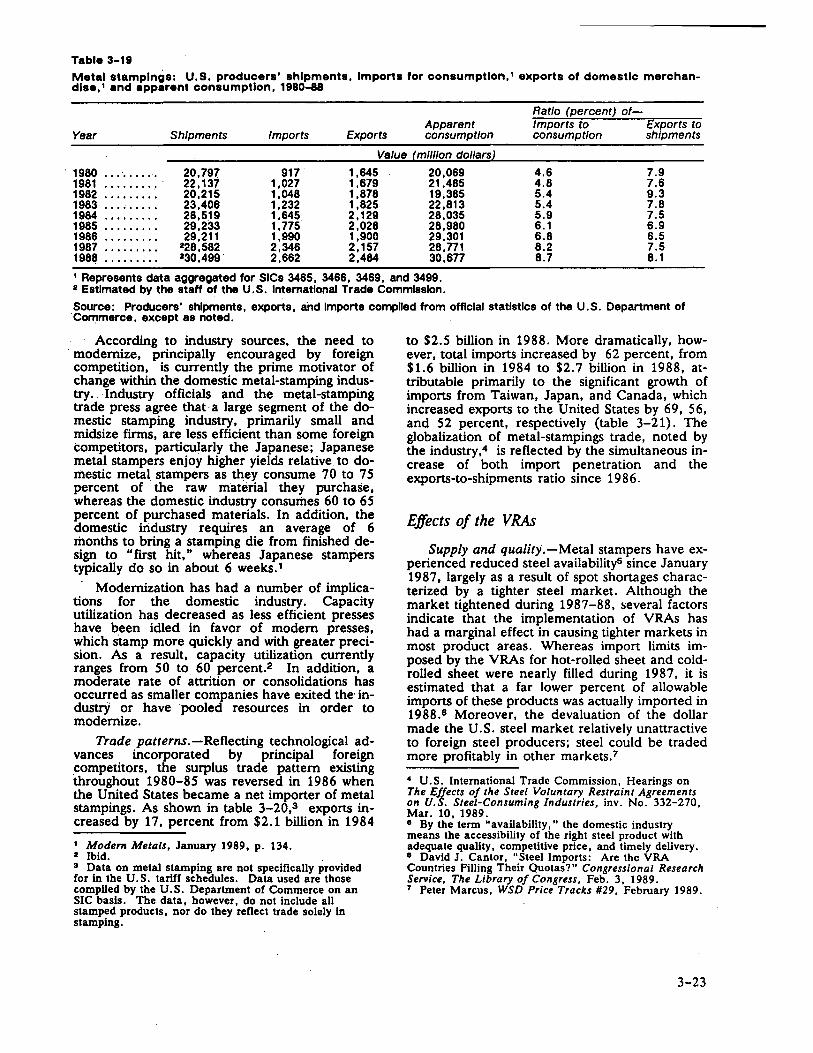
Table 3-19
Metal stampings: U. s. producers' shipments, Imports for consumption, 1 exports of domestic merchandlse, 1 and apparent consumption, 1980-88
Ratio (percent) of-Apparent Imports to Exports to
Year Shipments Imports Exports consumption consumption shipments
Value (million dollarsl
1980 I I I.I I I I 1°1 20,797. 917 1,645 20,069 4.6 7.9 1981 ......... 22, 137 1,027 1,679 21,485 4.8 7.6 1982 I I I I I I I I I 20,215 1,048 1,878 19,385 5.4 9.3 1983 ......... 23,406 1,232 1,825 22,813 5.4 7.8 1984 I I I I I I I I I 28,519 1,645 2,129 28,035 5.9 7.5 1985 I I I I I I I I I 29,233 1,775 2,028 28,980 6.1 6.9 1986 I I I I I I I I I 29,211 1,990 1,900 29,301 6.8 6.5 1987 I I I I I I I I I 228,582 2,346 2,157 28,771 8.2 7.5 1988 I I I I I I I I I 230,499 2,662 2,484 30,677 8.7 8.1
1 Represents data aggregated for SICs 3465, 3466, 3469, and 3499. 2 Estimated by the staff of the U.S. lntematlonal Trade Commission.
So~rce: Producers' shipments, exports, and Imports compiled from offlclal statistics of the U.S. Department of ·commerce, except as noted.
According to industry sources, the need to · modernize, principally encouraged by foreign competition, is currently the prime motivator of change within the domestic metal-stamping industry. . Industry officials and the metal-stamping trade press agree that· a large segment of the domestic stamping industry, primarily small and midsize firms, are less efficient than some foreign competitors, particularly the Japanese; Japanese metal stampers enjoy higher yields relative. to domestic metal stampers as they consume 70 to 75 percent of the raw material they purchase, whereas the domestic industry consumes 60 to 65 percent of purchased materials. In addition, the domestic industry requires an average of 6 months to bring a stamping die from finished design to "first hit," whereas Japanese stampers typically do so in about 6 weeks. 1
· Modernization has had a number of implications for the domestic industry. Capacity utilization has decreased as less efficient presses have been idled in favor of modern presses, which stamp more quiekly and with greater precision. As a result, capacity utilization currently ranges from 50 to 60 percent.2 In addition, a moderate rate of attrition or consolidations has occurred as smaller companies have exited the· industrY or have ·pooled resources in order to modernize.
Trade patterns.-Reflecting technological advances incorporated by principal foreign competitors, the surplus trade pattern existing throughout 1980-85 was reversed in 1986 when the United States became a net importer of metal stampings. As shown in table 3-20,3 exports increased by 17, percent from $2 .1 billion in 19 8 4
1 Modern Metals, January 1989, p. 134. 2 Ibid. 3 Data on metal stamping are not specifically provided for in the U.S. tariff schedules. Data used are those compiled by the U.S. Department of Commerce on an SIC basis. The data, however, do not include all stamped products, nor do they reflect trade solely in stamping.
to $2.5 billion in 1988. More dramatically, however, total imports increased by 62 percent, from $1.6 billion in 1984 to $2.7 billion in 1988, attributable primarily to the significant growth of imports from Taiwan, Japan, and Canada, which increased exports to the United States by 69, 56, and 52 percent, respectively (table 3-21). The globalization of metal-stampings trade, noted by the industry,4 is reflected by the simultaneous increase of both import penetration and the exports-to-shipments ratio since 19 8 6.
Effects of the VRAs
Supply and quality.-Metal stampers have experienced reduced steel availability5 since January 19 8 7, largely as a result of spot shortages characterized by a tighter steel market. Although the market tightened during 1987-88, several factors indicate that the implementation of VRAs has had a marginal effect in causing tighter markets in most product areas. Whereas import limits imposed by the VRAs for hot-rolled sheet and coldrolled sheet were nearly filled during 1987, it is estimated that a far lower percent of allowable imports of these products was actually imported in 1988.e Moreover, the devaluation of the dollar made the U.S. steel market relatively unattractive to foreign steel producers; steel could be traded more profitably in other markets. 7
~ U.S. International Trade Commission, Hearings on The Effects of the Steel Voluntary Restraint Agreements on U.S. Steel-Consuming Industries, inv. No. 332-270, Mar. 10, 1989. o By the term "availability," the domestic industry means the accessibility of the right steel product with adequate quality, competitive price, and timely delivery. 0 David J. Cantor, "Steel Imports: Are the VRA Countries Filling Their Quotas?" Congressional Research Service, The Library of Congress, Feb. 3, 1989. 7 Peter Marcus, WSD Price Tracks #29, February 1989.
3-23
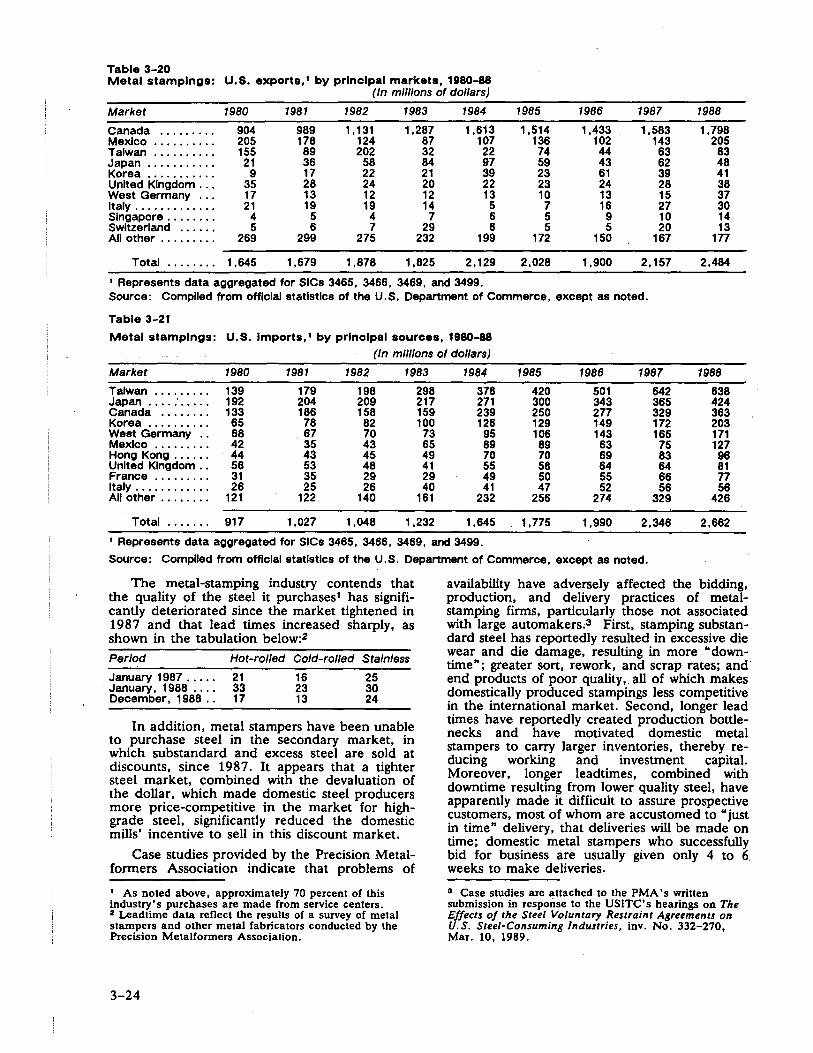
Table 3-20 Metal stampings: U.S. exports, 1 by prlnclpal markets, 1980-88
(In mlll/ons of dollars)
Market 1980 1981 1982 1983 1984 1985 1986 1987 1988
Canada ......... 904 989 1, 131 1,287 1,613 1,514 1,433 1,583 1,798 Mexico •.•....... 205 178 124 87 107 136 102 143 205 Taiwan •....•.... 155 89 202 32 22 74 44 63 83 Japan ........... 21 36 58 84 97 59 43 62 48 Korea .•......... 9 17 22 21 39 23 61 39 41 United Kingdom ... 35 28 24 20 22 23 24 28 38 West Germany 17 13 12 12 13 10 13 15 37 Italy ...•.....•... 21 19 19 14 5 7 16 27 30 Singapore •.••..•. 4 5 4 7 6 5 9 10 14 Switzerland 5 6 7 29 6 5 5 20 13 All other ......... 269 299 275 232 199 172 150 167 177
Total .....•.. 1,645 1,679 1,878 1,825 2,129 2,028 1,900 2, 157 2,484
' Represents data aggregated for SICs 3465, 3466, 3469, and 3499. Source: Compiled from official statistics of the U.S. Department of Commerce, except as noted.
Table 3-21
Metal stampings: U.S. Imports, 1 by prlnclpal sources, 1980-88
(In ml/lions of dollars)
Market 1980 1981 1982 1983 1984 1985 1986 1987 1988
Taiwan ......... 139 179 198 298 378 420 501 642 638 Japan .... : ..... 192 204 209 217 271 300 343 365 424 Canada ........ 133 186 158 159 239 250 277 329 363 Korea .....•...• 65 78 82 100 126 129 149 172 203 West Germany .. 68 67 70 73 95 106 143 165 171 Mexico ......... 42 35 43 65 89 89 63 75 127 Hong Kong •..... 44 43 45 49 70 70 69 83 96 United Kingdom .. 56 53 48 41 55 58 64 64 81 France ......... 31 35 29 29 49 50 55 66 77 Italy ....•....... 26 25 26 40 41 47 52 56 56 All other ........ 121 122 140 161 232 256 274 329 426
Total ..•.... 917 1,027 1,048 1,232 1,645 1,775 1,990 2,346 2,662 1 Represents data aggregated for SICs 3465, 3466, 3469, and 3499.
Source: Compiled from offlclal statistics of the U.S. Department of Commerce, except as noted.
The metal-stamping industry contends that the quality of the steel it purchases1 has significantly deteriorated since the market tightened in 1987 and that lead times increased sharply, as shown in the tabulation below:2
Period Hot-rolled Cold-rolled Stainless
January 1987..... 21 · January, 1988 • . . . 33
December, 1988 . . 17
16 23 13
25 30 24
In addition, metal stampers have been unable to purchase steel in the secondary market, in which substandard and excess steel are sold at discounts, since 1987. It appears that a tighter steel market, combined with the devaluation of the dollar, which made domestic steel producers more price-competitive in the market for highgrade steel, significantly reduced the domestic mills' incentive to sell in this discount market.
Case studies provided by the Precision Metalformers Association indicate that problems of
1 As noted above, approximately 70 percent of this industry's purchases are made from service centers. 2 Leadtime data reflect the results of a survey of metal stampers and other metal fabricators conducted by the Precision Metalformers Association.
3-24
availability have adversely affected the bidding, production, and delivery practices of metalstamping firms, particularly those not associated with large automakers,3 First, stamping substandard steel has reportedly resulted in excessive die wear and die damage, resulting in more "downtime"; greater sort, rework, and scrap rates; and· end products of poor quality, all of which makes domestically produced stampings less competitive in the international market. Second, longer lead times have reportedly created production bottlenecks and have motivated domestic metal stampers to carry larger inventories, thereby reducing working and investment capital. Moreover, longer leadtimes, combined with downtime resulting from lower quality steel, have apparently made it difficult to assure prospective customers, most of whom are accustomed to "just in time" delivery, that deliveries will be made on time; domestic metal stampers who successfully bid for business are usually given only 4 to 6. weeks to make deliveries.
3 Case studies are attached to the PMA's written submission in response to the USITC's hearings on The Effects of the Steel Voluntary Restraint Agreements on U.S. Steel-Consuming Industries, inv. No. 332-270, Mar. 10, 1989.
Although there are exceptions, metal stampers have not reportedly changed their sources of steel during the 1980s, although. some service centers have apparently shifted away from foreign sources to domestic sources as the depreciation of the dollar made foreign steel prices less competitive in the U.S. market. Some domestic metal stampers have indicated that the service centers' greater reliance on domestically produced steel reinforced the declining quality of steel available to domestic stampers.
Prices.-As a result of the strong demand for steel and the depreciation of the dollar, the price of steel increased during 1987-88. According to data compiled by the industry, the average cost of various grades of hot-rolled sheet, cold-rolled sheet, and stainless sheet increased by 24, 12, and 40 percent, respectively, during 1987-88. The largest price increase occurred in 300 series stainless sheet, the price of which increased by 52 percent during 1987-88; the largest increase in carbon sheet, which is more commonly used by stampers than are stainless grades, occurred in drawing-quality hot-rolled sheet, the price of which increased by 35 percent during 1987-88.1
According to industry sources, competitive pressures have prevented the metal-stamping industry from passing the higher cost of steel through to consumers, particularly the automotive industry, which has resulted in efforts to decrease production costs in order to maintain profit margins. Modernization programs have entailed large investments since 1983, particularly for automotive stampers, whose investments increased from $235 million in 1983 to $1.2 billion in 1986 (accounting for 43 and 73 percent of the metal-stamping industry's total investment in new machinery and facilities in 1983 and 1986, respectively). Investments in new facilities and machinery for the industry as a whole also increased during the 1983-86 period, constituting about 6 percent of the industry's assets in 1983 and approximately 15 percent of the industry's assets in 1986.2
Competitiveness.-A review of industry conditions suggests that the domestic metal stamping industry did in fact experience difficulties during 1987-88 as a result of increased prices and lengthened lead times. Given the strong international market for steel and the significant depreciation of the dollar, however, the degree to which VRAs contributed to the higher prices and longer lead times is not clear.
Industry officials indicate that foreign stampers developed a competitive advantage in the late 1970s and early 1980s when they implemented more efficient machinery and production methods. As a result of improved quality and lower prices relative to domestic stampers, import
1 Price data reflect the results of a survey of metal stampers and other metal fabricators conducted by the Precision Metalformers Association. 2 U.S. Department of Commerce, Annual Survey of Manufacturers.
penetration increased in value terms during the early 1980s.3 After increasing in 1986, imports increased again in 1987 and 1988, despite the depreciation of the dollar.
With respect to foreign markets, the value of U.S. exports grew significantly as domestic stampers improved the quality of their products and as the dollar depreciated. Export growth rates during 1987-88, 13.5 percent and 15.2 percent respectively, were significantly above the 1980s average of 5. 9 percent.
Views on continuation of the VRAs Continuation of the VRAs is opposed by the
Precision Metalformers' Association and all other members of the industry who were contacted. These sources maintain that the implementation of the VRAs adversely affected the domestic meal stamping industry by increasing prices and reducing availability, and that continued price and availability problems would have a significant effect on their competitive position.
Other Steel-Consuming Industries Spokesmen from several industries besides the
seven provided information about the effects of the VRAs to the Commission and expressed opinions about their extension. Nearly all who favor extension are from industries whose products are covered by the VRAs. Those who oppose extension include some from industries whose products are covered by the VRAs and some that are not.4
Companies in support of VRA extension Companies in support of VRA extension
stated that the import restraints have had positive effects on their operations by promoting market stability (in terms of steel availability). 5 Many of these companies also stated that there had been no steel price increase directly attributable to the VRAs, citing other contributory factors including the USX strike, increased worldwide demand for steel, and the depreciation of the dollar. e In addition, improved production efficiency stemming from modernization of the domestic steel industry (attributed to the effects of the VRAs) has reportedly improved the competitiveness of companies for whom steel is a major cost. A spokesman for one group of consumers noted that their increased competitiveness was reflected in a significant increase in their exports during 1987-88.7
3 Data expressing trade in terms of quantity are not available. " Views developed on the basis of information from the Commission's hearing in connection with this study, and from written submissions to the Commission. 5 See, for example, transcript, p. 136 (testimony of Paul Darling, President of Corey Steel Co.). 8 Transcript, pp. 139-141 (testimony of Mr. Roy Herman, President of UNR-Leavitt), and others. 7 Transcript, pp. 249-250 (testimony of the Committee on Pipe and Tube Imports (CPTI)), and CPTI submission, Mar. 17, 1989.
3-25
Four industry associations also stated to the Commission their support for extension of the VRAs. Three of the four groups also support expansion of the restraint program to include additional countries or product categories, while the fourth (Steel Service Center Institute (SSCI)) recommended that the agreements be continued for 3 years with certain modifications. A few steel consumers recommended that VRAs be eXtended for a period less than 5 years.
Information on companies supporting extension of the VRAs is provided in Table 3-22.
In addition, the Commission received information on other steel consumers that support extension of the VRAs.1 A coalition of steel using manufacturers was also formed which supports extension of the VRAs.
Companies in opposition to VRA extension Companies opposed to extension of the steel
VRAs represent a diverse range of steel-consuming businesses, including manufacturers of steel windows, commercial food preparation equipment, and material-handling equipment. Three industry associations also stated their opposition to extension of the VRAs. In general, these associations and most member companies contend that the VRAs have had adverse effects on their operations in terms of higher steel prices, reduced steel availability, and deteriorating steel quality.2
These companies indicated that the VRAs have contributed to higher prices for steel by limiting steel supplies from foreign sources. Although some of these consumers stated that the role of VRAs in price increases is difficult to quantify, 3
they believe that higher prices have adversely af-
1 See submissions for specific views and recommendations. 2 Ibid. 3 See, for example, submission by Enron Gas Pipeline Co. dated Mar. 10, 1989.
3-26
fected their company's competitiveness relative to similar foreign manufacturers.4 Some also noted that customer resistance to higher prices has hindered their ability to pass on increased steel costs and has subsequently resulted in lower profit margins. s One company indicated that steel price increases and the associated higher production costs have adversely affected its exports.a
Companies opposing extension of the VRAs also stated that the VRAs have adversely affected the availability of steel products, resulting in long lead times (up to 6 months) and delayed or cancelled deliveries. In some cases, the lack of availability of steel reportedly has caused some manufacturers to delay production, increase inventories, and miss production deadlines. 7
Spokesmen for these companies also stated that the VRAs have led to deteriorating steel product quality which has resulted i~ manufacturing downtime, increased start-up time, arid additional costs for inspection and reworking or removal of substandard material.a Table 3-23 presents information on companies that indicated to the Commission their opposition to VRA continuation.
In addition, a coalition of steel using manufacturers was formed in opposition to extension of the VRAs.9
4 Transcript, p. 85 (Burton Berrettini, representing the National Association of Food Equipment Manufacturers (NAFEM)) and p. 120 (Albert Leffler, CEO of the Material Handling lndustl).' of America). 5 Transcript, pp. 84-85 (NAFEM). 11 Transcript, p. 85 (NAFEM) and submission of the National Association of Food Eqliipment Manufacturers, Mar.10, 1989, p. 4. 7 Submissions by the Spring Manufacturers Institute, Mar. 16, 1989, p. 1; Enron Gas Pipeline Co., Mar. 10, 1989; the National Association of Food Equipment Manufacturers, Mar. 10, 1989, p. 4; and the William Bayley Co., Mar. 15, 1989, p. 2. 8 Transcript, p. 84 (NAFEM) and submission of the Spring Manufacturers Institute, p. 1. 9 See submissions for specific views and recommendations.

Table 3-22 Steel conaumera aupportlng VRA extenalon, by type of bualn•H and type of steel conaumed
Name
Company: Corey Steel'
Fisher Tank .•.•...........•...........
Thompson Steel Co1 ••••••••••••••••••••
UNA-Leavitt Div. of UNA lndustrles1 ••••••
Association: American Wire Producers Assn. a, :1
Committee of Domestic Steel Wire Rope and Speclalty Cable Manufacturers2, 4 •••
Committee on Pipe and Tube lmports2 ••••
Steel Service Center lnstltute2, 11 ••••••••••
Type of business
Producer of cold-finished steel bar and warehouser of metal (prlnclpaDy steel) products
Fabricator and erector of steel tanks for the storage of water, chemical. and petroleum products
Producer of cold-rolled strip steel and distributor of steel sheet and atrlp
Producer of pipe and tube products, principally square and rectangular structural tubing
Producers of wire and wire products
Produc.,.. of wire rope
Producers of pipe and tube products
Processors, warehouser&, and distributors of steel
1 Some, or all, of the company's end products are covered by the VRAs. 2 Some, or all, of the member companies' end products are covered by the VRAs.
Type of steel consumed
Bar, wire rod, colled sheet
Plate
Steel sheet
Flat-rolled steel (malnly hot-rolled sheets or bands)
Wire rod
Wire rod and wire.
Steel sheet, strip, bWets, and bars
Most types of steel mlll products
3 The member companies of the American Wire Producera Association represent approximately 75 percent of the domestic wire Industry. 4 The Committee of Domestic Steel Wire Rope and Specialty Cable Manufacturers consists of seven U.S. producers that account for the majority of steel wire rope production In the United States. 11 The Steel Service Center Institute Is an association of about 350 companies who process and distribute approximately one-third of the steel consumed In the United States.
Source: Submissions to the U.S. International Trade Commission In connection with Investigation no. 332-270, The Effects of the Steel Voluntary Restraint Agreements on U.S. Steel Consuming Industries, and testimony from the Investigation hearing. ·
3-27
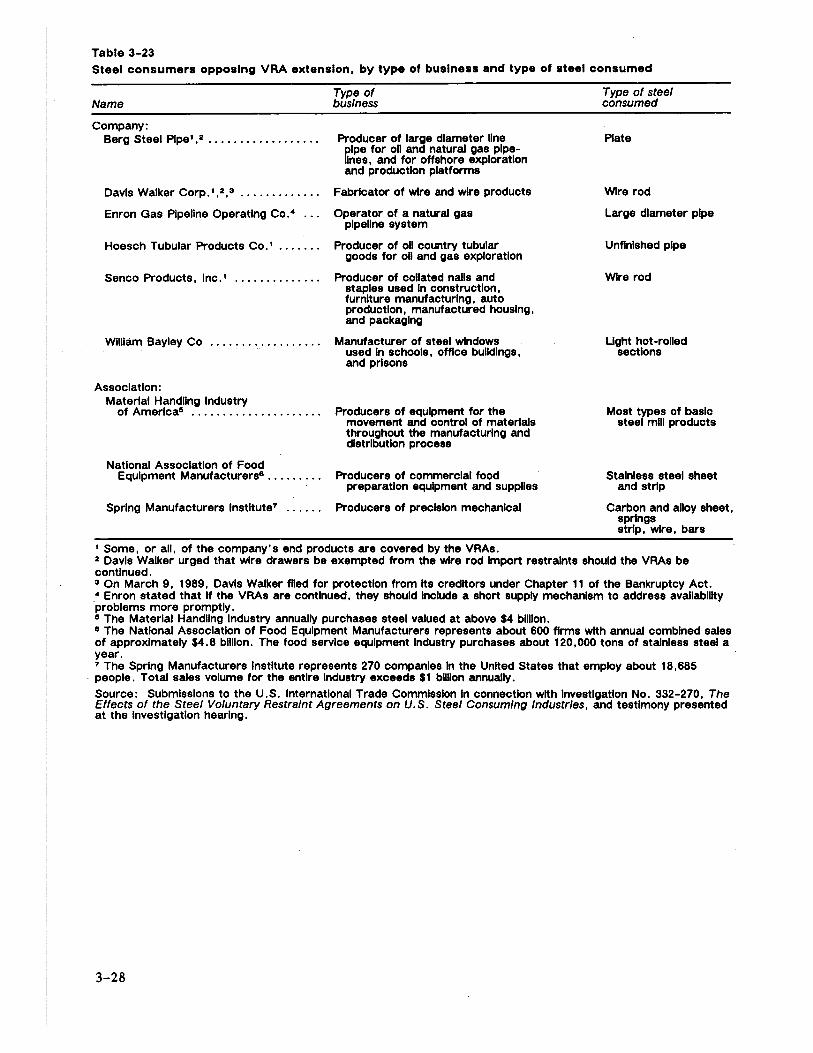
Table 3-23 Steel consumers opposing VRA extension, by type of business and type of steel consumed
Name
Company: Berg Steel Plpe1 ,2 ................. .
Davis Walker Corp.1,2,3 ............ .
Enron Gas Plpellne Operating Co." .. .
Hoesch Tubular Products Co. 1
Senco Products, Inc. 1 ••••••••••••••
William Bayley Co ................. .
Association: Material Handling Industry
of Amerlca5 •••••••••••••••••••••
National Association of Food Equipment Manufacturers8 •••••••••
Spring Manufacturers lnstltute7 ••••••
Type of business
Producer of large diameter line pipe for oU and natural gas pipelines, and for offshore exploration and production platforms
Fabricator of wire and wire products
Operator of a natural gas pipeline system
Producer of oll country tubular goods for oil and gas exploration
Producer of collated nails and staples used In construction, furniture manufacturing, auto production, manufactured housing, and packaging
Manufacturer of steel windows used In schools, office buildings, and prisons
Producers of equipment for the movement and control of materials throughout the manufacturing and distribution process
Producers of commercial food preparation equipment and supplies
Producers of precision mechanical
1 Some, or all, of the company's end products are covered by the VRAs.
Type of steel consumed
Plate
Wire rod
Large diameter pipe
Unfinished pipe
Wire rod
Light hot-rolled sections
Most types of basic steel mlll products
Stainless steel sheet and strip
Carbon and alloy sheet, springs strip, wire, bars
2 Davis Walker urged that wire drawers be exempted from the wire rod Import restraints should the VRAs be continued. 3 On March 9, 1989, Davis Walker flied for protection from Its creditors under Chapter 11 of the Bankruptcy Act. " Enron stated that If the VRAs are continued, they should Include a short supply mechanism to address availability problems more promptly. 5 The Material Handling Industry annually purchases steel valued at above $4 billion. 8 The National Association of Food Equipment Manufacturers represents about 600 firms with annual combined sales of approximately $4.8 billion. The food service equipment Industry purchases about 120,000 tons of stainless steel a year. 7 The Spring Manufacturers Institute represents 270 companies In the United States that employ about 18,685
· people. Total sales volume for the entire Industry exceeds $1 bllllon annually.
Source: Submissions to the U.S. International Trade Commission In connection with Investigation No. 332-270, The Effects of the Steel Voluntary Restraint Agreements on U.S. Steel Consuming Industries, and testimony presented at the Investigation hearing.
3-28

APPENDIX A LETTER FROM CHAIRMAN SAM GIBBONS OF THE SUBCOMMITTEE ON
TRADE OF THE HOUSE WAYS AND MEANS COMMITTEE TO ACTING CHAIRMAN ANN BRUNSDALE REQUESTING THIS INVESTIGATION

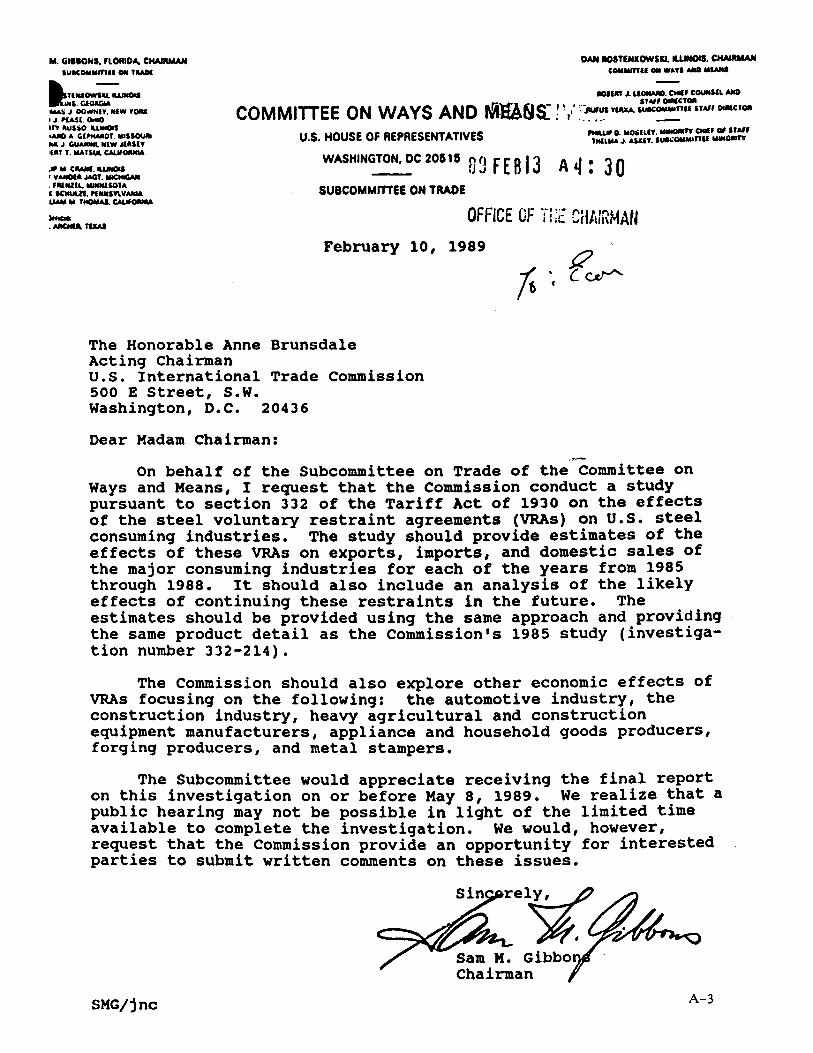
M. GIHONS. FLORIO"- CHAIMIAN DAN IOSTENIOWSll. IUIHOIS. CHAUIMAH COMlllnUOllWAYIMOllllMI IU9COMMmU Oii TllAOI
._llll&OWS--;-IWNOll lruos.GaoaGAA '""'~ J DO-Y. ldW YOM IJ.l'USl.OollO lrt llUhO IUllOCllS <AllO A. Gll'HAAOT. MISIOUlll IJo& J GU.UUNI. NlW JlllSIY lllll l. MATSUI.~
U.S. HOUSE OF REPRESENTATIVES
WASHINGTON, DC 20616 s ~ F E B J 3 .... c-. IWllOll rv-llJAGT.. flllNllL. -SOTA SUBCOMMITTEE ON TRADE I ICMIAZI. HllllSYlVANIA UAllll ... 1'MOllllAI. CAUfOlllllA
,._ • AllCMlll. TUAI
OFFICE G·F ·,-• , .• '"JI •!"'lu f I I ;C :,.,fl lli\(TJA '
February 10, 1989
The Honorable Anne Brunsdale Acting Chairman U.S. International Trade Commission 500 E Street, s.w. Washington, o.c. 20436
Dear Madam Chairman:
On behalf of the Subcommittee on Trade of the Committee on Ways and Means, I request that the Commission conduct a study pursuant to section 332 of the Tariff Act of 1930 on the effects of the steel voluntary restraint agreements (VRAs) on U.S. steel consuming industries. The study should provide estimates of the effects of these VRAs on exports, imports, and domestic sales of the major consuming industries for each of the years from 1985 through 1988. It should also include an analysis of the likely effects of continuing these restraints in the future. The estimates should be provided using the same approach and providing the same product detail as the Commission's 1985 study (investigation number 332-214).
The Commission should also explore other economic effects of VRAs focusing on the following: the automotive industry, the construction industry, heavy agricultural and construction equipment manufacturers, appliance and household goods producers, forging producers, and metal stampers.
The Subcommittee would appreciate receiving the final report on this investigation on or before May 8, 1989. We realize that .a public hearing may not be possible in light of the limited time available to complete the investigation. We would, however, request that the Commission provide an opportunity for interested parties to submit written comments on these issues.
SMG/jnc A-3

APPENDIX B PUBLIC NOTICE OF. THE COMMISSION'S INVESTIGATION

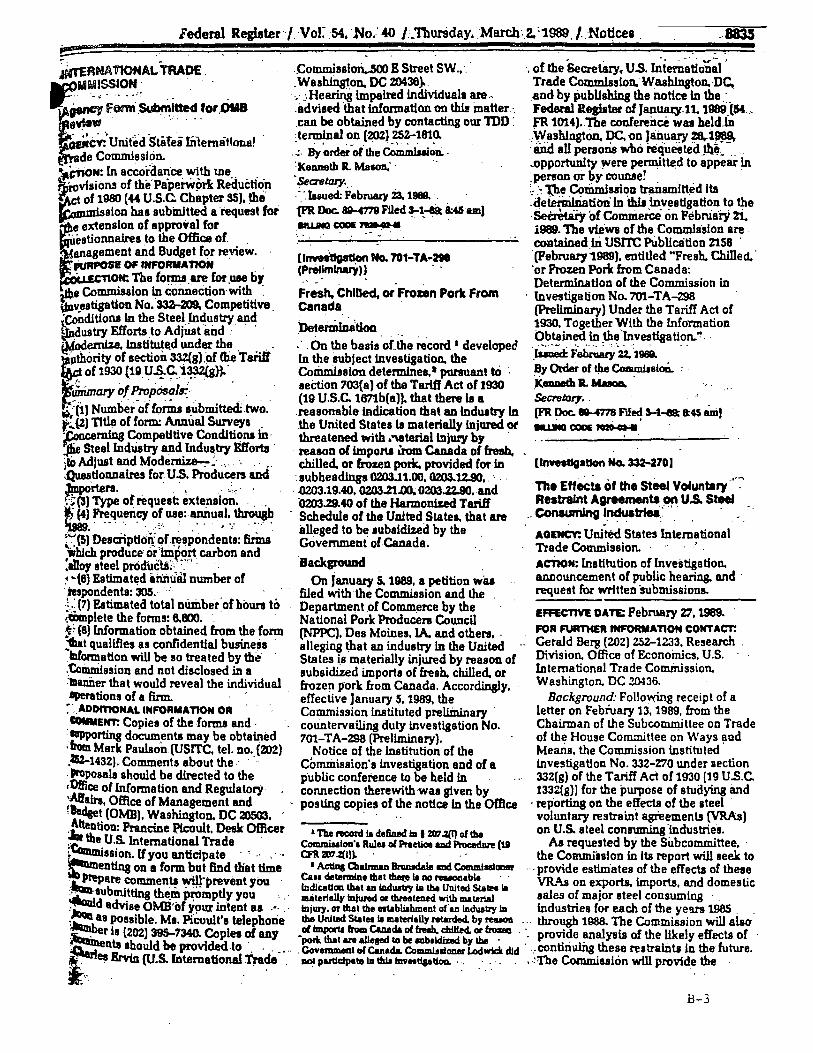
Federal Register I ·Vo[ 54, ·No.· 40 /_'fbuniday, · Marclr. 2.: 1989. / .. Notlcea . ..8835
$lr£RNATIONALTRADE. .Commiselori.mO B Street SW., MMISSIOH · . · · . Washi.Qgton. DC 20436).
· - ·· ··· · .• ·_:Hearing impaired Individuals are.~ ~ f~ .~itted for.Ous .advised that information on thU matter·. vbW ·· · · - · can be obtained by contacting our mo :
.;;cY:'urute'd States Iiilematlona1 . Jerminal on(~) ZSZ-l8t0. de Commissfcin. · .;. sY 'ordei-·0r· the ~~t:W~ -
~Cnc>N: In acccirda~ce. ~th me .. _ . . :Kenneth R. Ma10D,' ·· ··
~rovisioru of the"Papen¥9rk Re~uctio~ ·Seaetary. ~ct of ~980 (44 U.S.C. Chapter SS), the . ·;·.Issued: February 2a. 1989. . ~sion baa eubinitted a request for tFR DoC. 8&-C779 Filed ~1:.~ 8:45amJ
i. e extension of approval for _lllWMG COOE ~-
estionnaires to the Office of. . · .. _ ·..:..· ...;_-~--....;.._-----~ anagement and Budget for reyiew. · (1"""11gat!on No. 701-TA-291 fiURPOS2 OF INFORllAnoN · (Pr9flmlnarY)] . ·
::coiJ.EcnON: The fol'IIia. are for .use b)' ldi• Comm.i.aslon In connection·.wi~. . Fresh, ChlDed, or Frozen Pork From UDv.estigation No. 332-209. Competitive. Canada i,Conditions In the Steel.Jnd.~str)'.an~ _bet_ ~tioo ~ustry Efforts.to Adjustand : .... ~odemize, lnsti~~d under the . .. . . · . On the basis of.the record 1 develoj>ed ~µ~ority of section 332(glof Oie Taliff In the lubject Investigation. the ~ of 1930 {19 U~<;:._ 1:p2{g}J.. Cori:milAsion determines,• pursuant tO ·
~~ary of Proposals:_, · aeCt.ion 703(a) of the Tariff Act of 1930 (19 U.S.C. 1611b(a)). that there la a
_;{iJ Number.of fomu s_ubmitted:two. .reasonable indication that an Industry In J'.~{2) Tl~ of form: Annual Surveya . .the United States la materially injmed Ol' ~o.cernlns CompaUtive CondltiC?na In· threatened with ."8terial iDjury by ·
·. of the SeQ'et.8ry, U.S. ~tern~tlon;l , Trade Commlsalon. Waah.J.nston. ·D~ .and by publishing the notice In the.:. Federal llegilter of Januaey.11.1989.(54... FR 1014) •. The conference waa held.In ,\VashingtOn, J?C. on January ~1~ ·arid all persona who requested~~:.. .... .opportunity ~ere permitte.d to appear In .person ar by counae! - . ~ :~ tb:e .~tiimlui~n tranamitt~d Its .determlnatiori In thla in\testigatfon to the -Secretary of Commerc~i on Pebniary Zi. i989. The views of the Commission are . coatained lri usrrc Piiblication 2158 · ·(Pebniary~989}. entitled "Fresh. Chilled.· ·or Frozen Pork from Canada: Determination of the Commission in
· Investigation No. 701-TA-298 {Preliminary) Under the Tariff Act of 1930, Together With the lnf onnation Obtained in .the "Investigation.'! - · .~F~·U.1989. ..
By Order of the Commilsloii. : Kenneth a. 1i1aon. . Secretary . .
(FR Doc. 19-4778 Filed ~-- 8:45 am! . . . -.uMO CODE 1Cl2MIMil
' . ~Steel Industry and.Indu~try Bfl'orta · reason of lmpoJU irom Canada of fresh. ito Adjust and Modenuze-:-_· , .. •· . ·. .. chilled. or frozen pork. provided for In .(lnvestlg•tson No. 332-270) ~tionnaires for U.S. Producers and : eubheadinp 0203.11.00. 02.03.12.90, . · . . · · · · . · · , .• , lmportera. . • . ":... . . .o203.19.40, 0203.n.oo,; 0203.22.90, and ·Th• Effects of the Steel Vofunta
5 '!. ..
~(3) Type of request: extension~ . . . . tl203.29.40 of the Harmonized Tariff .. ~~~greemenl_-..... _ .. • ... ~ -~. U.S.. t"."" _. ¥; (4) Frequency of us~: annual, through - Schedule of the United States. that are --·-,. •RIU9u,.._ '1989. . . . . . · ·0·· . • . • ·; . •. . • alleged to be aubaidized by the AGoCr. United States International ~~{S) Descriptio~::9f ~spondents: firina GOvemment of-Canada. Trade Commission. which produce or lmpo~ carbon and ~llloy steel products~-~': ... · ·. ·eackground AcnoN: Institution of lnveiltigetfon. ~ ... {6) Estimated annu'B.l number of On January s. 1989. a petition wiu announcement of public hearing. and · · iespondenta: 305.· · · · · filed with the Commission and the request for written 'submissions. :.: (7) Estimated total number'of bours to Department.of Comm~rce by the EFRCTIW DATE February 'D, 1989. ;axnplete the fonns: 6.800. . · . National Pork Producers Council t;f8) Information obtained from the form (NPPC), Des Moines, IA. and others, . FOR F\JR114ER INFORMATION CONTACT: 1hllt qualifies as confidential business · alleging \bat an industry In the United -- Gerald Berg (202) ZSZ-1233. Research . ~lntonnatton will be so treated by the States ~s materially injured by reason of Division. Office of Econoinics. U.S. · .t:oinmission and not disclosed in a subsidized imports of fresh. chilled. or International Trade Commission. 11uumer that would reveal the individual frozen l)ork from C8.nada. Accordingly, . Washington. DC 20436. tlperations of a firm. · effective January s. 1989, the Background: Folloajng receipt of a
~-. ADDITIONAL INFORMATION OR Commission instituted prellininary · letter on February 13, 1989, from the COllMENr. Copies of the -forms and· countervailing duty Investigation No. Chairman of the Subcommittee on Trade :~rting docum~nta may be obtained 701-TA-298 (Preliminary). of the House Committee on Ways aad '&Om Mark Paulson. (USITC. tel. no. {202) Notice of the Institution of the Means. the Commission Instituted . • UZ-1432) .. Comments about the · · ·. Commission's Investigation and of a investigation No. 332-270 under 11ection · Pl'oposals should be directed to the p·ublic conference to be held In 33Z{g) of the Tariff Act of 1930 (19 U.S.C. ,Offlce of Information and Regulatory connection therewith was given by 1332(g)) for the i>wi>ose of studying and ~airs, Office of Management and · posting copies of the notice In the omce -reporting on the e~ects of the ateel 'A'dtet (OMB]. Washington. DC 20503, ' · · voluntary restraint agteementJ (VRAs) . ._!tention: Prancine Plcoult. Desk Officer , The ncord la defined 111 1 20'1 .2(ll of the on U.S. steel conlllIDling "industries. ':"'the U.S. lntemational Trade · Commiaatou'• Rulu at Practice and Procedure (111 Aa requested by the Subcommittee. -~~ssion. lfyou anticipate · ' ... · · CFR'll.11.2(11). · · the Commission In its report will seek to ~enttna on a form but find that thpe • Actlng Ciairman Brumdale IDd CocnmisslDllllf ·· -provide estiniates of the effects of these • P~a _,;,n Ca11 determiae that diel'.911 no ,_ab\a un A - rta imp rts d d ti ·~~.. re ~mmen~ ~IH·prevent you · lndleattoa that an IDdu.try la the United StalH 11 w n.-u on expo • o , an omes c ;· ... _,•ubauttfns the_m pr;omptly you , . · auiterl.U, lnlured or threatened with material sales of major steel consuming ~d advise OMB .. of ypur inlent as .•· . · Injury. or that the mablilhment ohn lllduatry Ill industries for each of the years 1985 . :~ aa possible. Ma: Pfooult'1 telephone th& United Sta tea Lt materially retarded. by~ . . . through 1988. The Commission will alsa ~r I (202) .....,7340. Co l of ol lmpor1a fnim Call.l!lda of fresh. cbilled. or frosl!ll · · vid al · o! th lik I ff •~ f · :'h....:..::.-· s ~ p es any -pork that an allesed to be mb11dimd by the . : pro . e ~ ysts e e y e ec ... o ~nta should be provided.to ". . . .. Covemmentof Canada. CommlulcmerLodwkkdld ._.contiriu.ijig these restraiiltJ in the future. (.. ~ Ervin (U.S. International Trade . aot partlc:IP9te 111 lhil IDY•Uaatioa. . .. _. . . . . , ::i'be Commission will provide the
B-3
8836 Federal Register I Vol. 54, No. 40 / Thursday. March 2. 1989 / N<_?tices
eatimates using the same approach and product detail as ln the Commission's .1985 study cusrrc Publication 1788, Report on Investigation No. 332-214, December 1985-copies are available from the Publications Office (202) 252-1807). The Commis~ion will also explore other economic effects of VRAa focusing on the· following: the automotive lnduatry, th& construction industry, · . heavy agricultural !Uld construction · •. equipment manufacturers, appliance . · and houaehold sooda producen, forgins produceres and metal stampers. · · The Subcommittee requested that the ·final report on this investigation be eubmitted OD or before May 8.1989 •. · Public Hearing and Written ·
Submissions: Interested persons are Invited to present. either at a public heartns or in written statement., Information concerning matten to be addreased in this 1tudy and to comment on the analytical approach used in the CommissiOn's 1985 study. In addidcm.
' Interested persona are requested to provide. u appropriate. response to the followtns quesUona regardlns conditions In steel consumins induatries and the effects of VRAa. ·Industry conditiona:
Please describe the primary market . ~cton th~t have affected your Industry d~ 1984-39 (Le .. how have supply and de!D$nd conditions for your products Chqed and what have been the principal facton underlyins the cbqes). Whaj was your company'• return on sales in each year durin& 1984-al?
. ;litel prices: ' Jlow has the price of steel purchased >)''your firm chansed in each year lwins 1984-697
How much of the changes. if any, do 1ou attribute to the steel VRAs? (Please 1xplain.)
What other factors (such aa changes n exchanse rates, raw materials costs. ind/ or world demand) may have :ontributed to steel price changes? iteel supply:
Please describe any dilficulties you .ave experienced in obtaining steel •roducts during 1984-697 Such problems ~ght include inability to purchase a :ertain product. relatively long lead imes, or quality problems.
Please explain the exten.t to which you attribute these difficulties to the steel VRAs.
What other (actors may have contributed to these t:lifficulties7 Ef!ects of the VRAs on competitive conditions:
How have steel price changes affected. . your unit production costs in each of the ! years durfns 1~.
B-4
Please expiain how steel supply problems affect~d your operations, if at all. during 1~9 (i.e., discuss the extent to which they may have resulted in lost sales;. production bottleoecka, or . changes in prpd~ction schedules).
· How do you believe the VRAs have affected yo~ ability to compete with Imports? . ·
How do you believe the VRAs have · affected your ability to nport?
· . What other effects, If ~Y· hive the VRAa had on your company (e.g:, have they affected investment decisions. the level of steel inventories held. or other . areas of your operations)? .. ' · :; Other: .
What positive effeCts. If any, do you '. believe the VRAa have bad on your · · operations (such as improved quality or. lower prices of domestic steel products)? Implications: .
Please describe the effects that you expect. If any, of continuation of the VRAa on your operations and your ability to coiDpete ln the U.S. and foreip markets.
In addition to your oral or written comments. please supply a copy of your most recent !lDDual report and 101C report with your response (if unavailable. comparable reports that eupply financial information for the years 1984-38 would be •ppreciated).
The public hearing on thil lnvestisation will be held ln the · Commission Hearing Room. 500 E Street. SW .. Washington. DC 20438. besinnins at 9:30 a.m. on March 10. 1989. All · persons 1hall have the right to appear by counsel or in person. to present . information and to be heard. Requests to appear at the public hearing should be filed with the Secretary, United States International Trade Commission. 500 E Street. SW .. Washington. DC 2Gl36. no later than noon. March 8, 1989.
Written statements and post-hearins briefs should be submitted to the Secretary of the Commiasion at the same address. Commercial or financial information that a submitter desires the Commission to treat as confidential must be submitted on separate sheets of paper. each clearly marked "Confidential Business Information" at the top. All submissions rP.questing confidential treatment must confonn with the requirements of I 201.e or the Commission's Rules of P.""Octice and Procedure (19 CFR 201.6). All written submissions. except for confidential business wc:mation. will be made available for inspection by interested persona in the Office or the Secretary to the Commission. To be assured of conaideration by the Commiuion. ..
written submissions should be receiv• no later than March 17, 1989. . . · •
Hearing-impaired persons are advised that information on this matter can be
·obtained by contacting the · . Commission's TDD t~rminal on (202) 252-1810. . .
By order the Coliimisaion. . lasued: February 28, 1989..
.IC.emsatla .R. Muon. 'Secretary. . .. . ·[FR Doc. 89-4978 Filed S-1-81t 8:45 am) . -.ul!IQ'CODI ~
DEPARTMENT OF JUmCE
. Information CollectJona Under Review
. PebrwUJ 1:/, 1989.
The Office of Manasement and Budge~ (OMB) hu been sent the following
· proposale for the collection of · information for review under the . provisions of the Paperwork Reduction Act (44 U.S.C. Chapter 35) and the Pai>erwork Reduction Reauthorization Act lince the last list was published. F.ntries are srouped into 1ubmission categories. Each entry contains the . following information: (1) The .title of tl: form or eollection; (2) the agency form number, If any, and the applicable component of the Department . sponsorfns the collection: (3) how ofter. the form mu1t be ftlled out or the information is collected: (4) who-will b· asked or required to respond. as well o: a brief abstract: (5) an estimate of the total number of respondents and the amount of time estimated for an avera respondent to respond: (6) an ~stimatC' .. of the total public burden (in h~urs) associated with 1he collection: and (ii an indication as to whether Section·'·· 350-l(h) of Public Law 96-511 applies. Comments and/or suggestions regard: the item(s) contained in this notice, ·especially those regarding the estima: response time, should be directed to 1 OMB reviewer, Mr. EJward H. Clark.1 on (202) 395-7340 A1"10 to the Department of Justice's Clearance Officer, Mr. Larry E. Miesse, on (202; 633-43U. U you anticipate commenti: on a form/collection. but find that tir to prepare such comments will pre'.'c you from prompt submission. you sf: so notify.the OMB re .. iewer A.'\'D th· DOJ Cleanmce Officer of your inten: soon as posilible. Written comments regarding the burden estimate or an: other aspect of the collection may b~· submitte~ to omce of Information a .. Regulatory Affail'.s. Office of Management and Budget. Washingtc DC 20503. AND to Mr. Larry E. Mies.
APPENDIX C CALENDAA OF PUBLIC HEARING

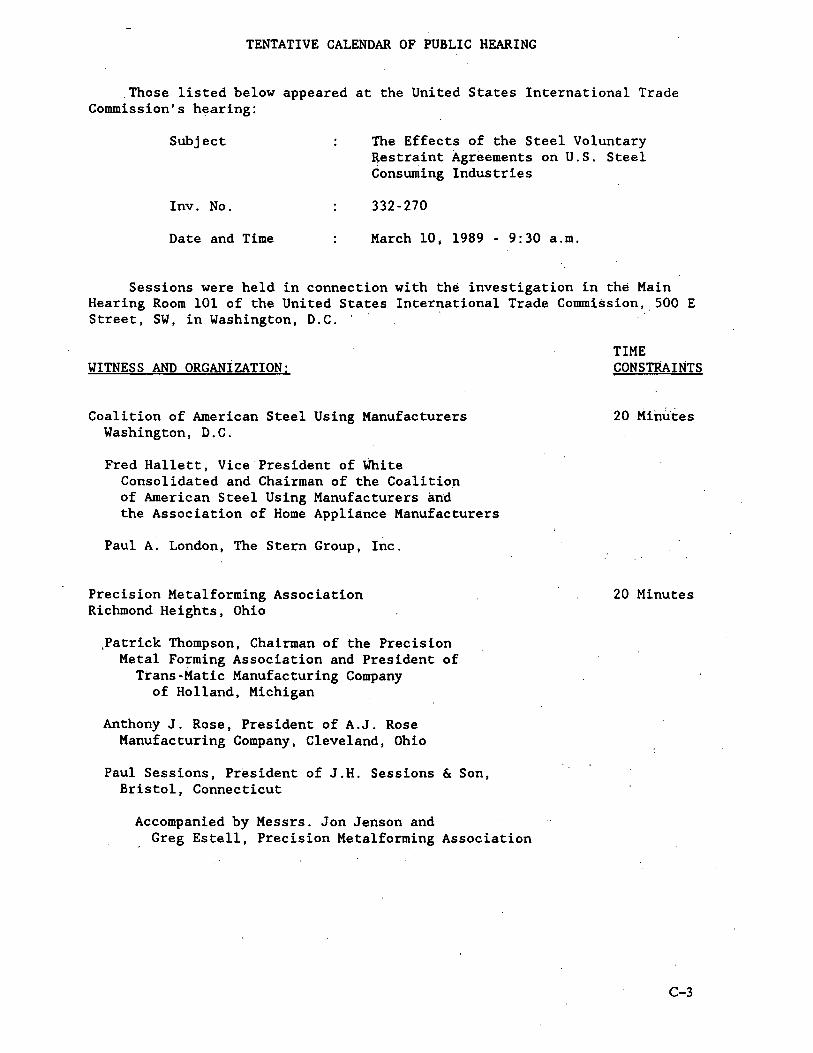
TENTATIVE CALENDAR OF PUBLIC HEARING
.Those listed below appeared at the United States International Trade Commission's h~aring:
Subject The Effects of the Steel Voluntary Restraint Agreements on U.S. Steel Consuming Industries
Inv. No. 332-270
Date and Time March 10, 1989 - 9:30 a.m.
Sessions were held in connection with the investigation in the Main Hearing Room 101 of the United States International Trade Commission,_500 E Street, SW, in Washington, D.C.
WITNESS AND ORGANiZATION:
Coalition of American Steel Using Manufacturers Washington, D.C.
Fred Hallett, Vice President of White Consolidated and Chairman of the Coalition of American Steel Using Manufacturers and the Association of Home Appliance Manufacturers
Paul A. London, The Stern Group, Inc.
Precision Metalforming Association Richmond Heights, Ohio
,Patrick Thompson, Chairman of the Precision Metal Forming Association and President of
Ttans-Matic Manufacturing Company of Holland, Michigan
Anthony J. Rose, President of A.J. Rose Manufacturing Company, Cleveland, Ohio
Paul Sessions, President of J.H. Sessions & Son, Bristol, Connecticut
Accompanied by Messrs. Jon Jenson and Greg Estell, Precision Metalforming Association
TIME CONSTRAINTS
20 Minu'tes
20 Minutes
C-3
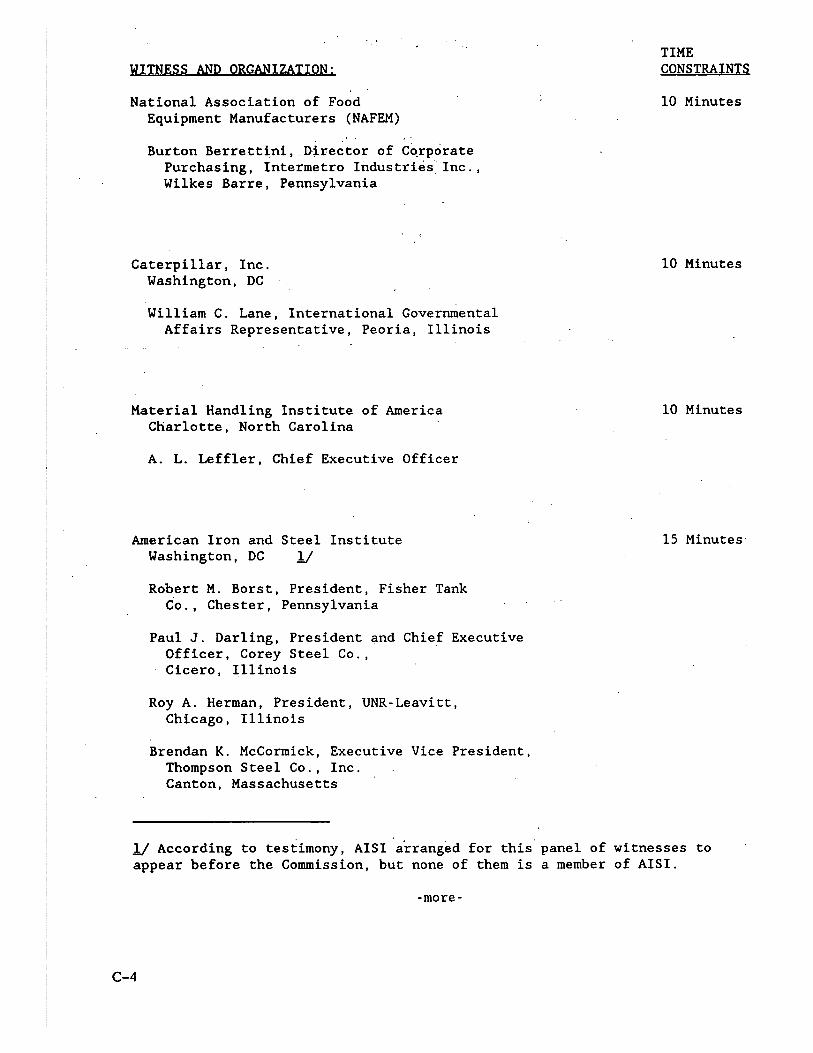
WITNESS AND ORGANIZATION:
National Association of Food Equipment Manufacturers (NAFEM)
Burton Berrett~ni, Director of Cqrporate Purchasing, Intermetro Industries· Inc., Wilkes Barre, Pennsylvania
Caterpillar, Inc. Washington, DC
William C. Lane, International Governmental Affairs Representative, Peoria, Illinois
Material Handling Institute of America Charlotte, North Carolina
A. L. Leffler, Chief Executive Officer
American Iron and Steel Institute Washington, DC l/
Robert M. Borst, President, Fisher Tank Co., Chester, Pennsylvania
Paul J. Darling, President and Chief Executive Officer, Corey Steel Co., Cicero, Illinois
Roy A. Herman, President, UNR-Leavitt, Chicago, Illinois
Brendan K. McCormick, Executive Vice President, Thompson Steel Co., Inc. Canton, Massachusetts
TIME CONSTRAINTS
10 Minutes
10 Minutes
10 Minutes
15 Minutes·
l/ According to testimony, AISI arranged for this panel of witnesses to appear before the Commission, but none of them is a member of AISI.
-more-
C-4
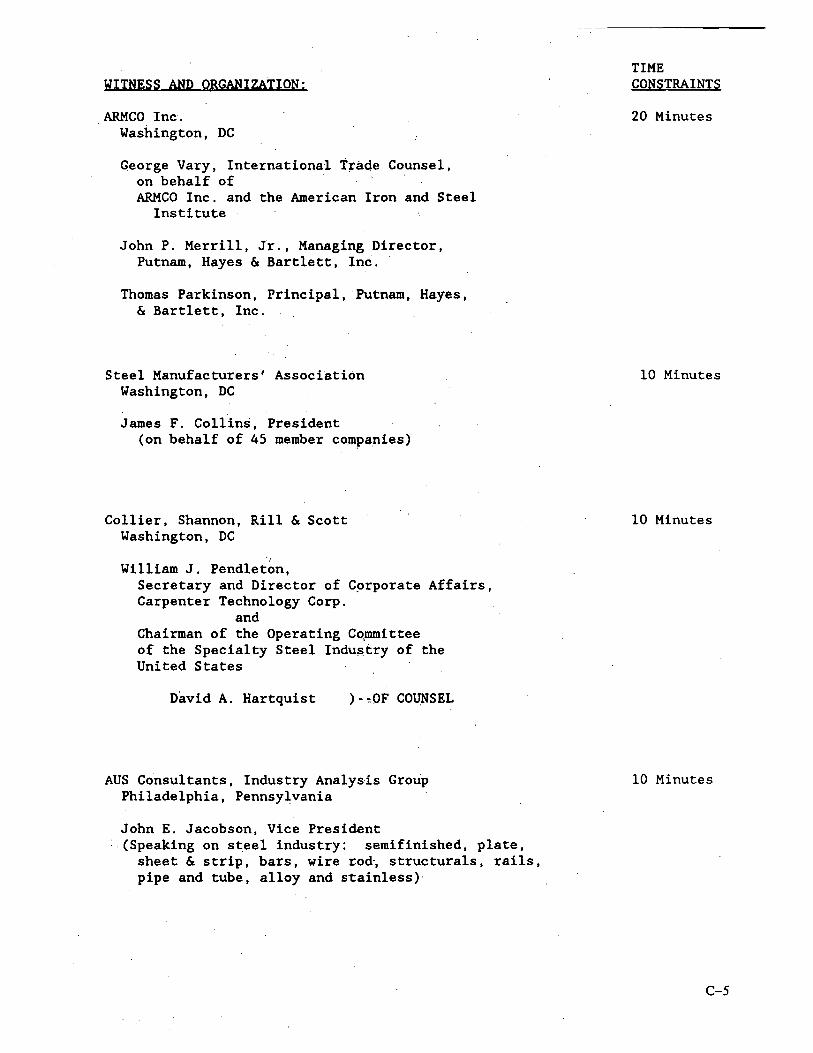
WITNESS AND ORGANIZAIION:
ARMCO Inc. Washington, DC
George Vary, International T;rade Counsel, on behalf of ARMCO Inc. and the American Iron and Steel
Institute
John P. Merrill, Jr., Managing Director, Putnam, Hayes & Bartlett, Inc.
Thomas Parkinson, Principal, Putnam, Hayes, & Bartlett, Inc.
Steel Manufacturers' Associ·ation Washington, DC
James F. Collins, President (on behalf of 45 member companies)
Collier, Shannon, Rill & Scott Washington, DC
·1
William J. Pendleton, Secretary and Director of C~rporate Affairs, Carpenter Technology Corp.
and Chairman of the Operating Cqmmittee of the Specialty Steel Indu~try of the United States
David A. Hartquist )-~OF COUNSEL
AUS Consultants, Industry Analysis Group Philadelphia, Pennsylvania
John E. Jacobson, Vice President (Speaking on steel industry: semifinished, plate,
sheet & strip, bars, wire r.od·, structurals, rails, pipe and tube, alloy and stainless)
TIME CONSTRAINTS
20 Minutes
10 Minutes
10 Minutes
10 Minutes
C-5
WITNESS AND ORGANIZATION:
Shagrin Associates Washington, DC on behalf of
The Committee on Pipe and Tube Imports (CPTI)
Roger B. Schagrin )--OF COUNSEL
C-6
TIME CONSTBAINTS
10 Minutes

APPENDIX D METHODOLOGY AND DATA USED TO ESTIMATE THE EFFEC'J'S OF VOLuNT.utY RESTRAINT AGREEMENTS ON EXPORl'S, IMPORl'S,
AND DOMESTIC SHIPMENTS IN U.S. STEEL-CONSUMING INDUSTRIES

,.

METHODOLOGY AND DATA
Introduction
The methodology employed in this study to estimate the effects of the steel restraints on U.S. imports, exports, and domestic shipments consists of three steps. First, an estimate is made of the percentage increase in the price of imported steel as a result of limiting steel imports. The methodology takes into account exchange-rate movements that have altered the import supply of several supplier countries and have resulted in unbinding export limits. Second, the estimate of the percentage increase in the price of imported steel is converted, using input-output analysis, into an increase in production costs and product prices for domestic steel-consuming industries. Third, the domestic price increases are translated into the increase in imports and decrease in exports and domestic sales that occur when expenditures switch away from domestic products towards foreign substitutes. Two sets of estimates are developed for· the reduction in domestic sales. The first is based on a zero demand elasticity and implies that domestic consumers do not reduce their overall purchases of the product even though the aggregate price has increased. This may be considered the smallest likely effect of the steel price increase on domestic sales. It consists of the sum of lost export sales and lost sales as domestic consumers switch to foreign products. The second set of estimates are based on a demand elasticity of unity for the product category. Published estimates indicate that this demand elasticity is likely to lie between zero and one for most products.
Estimating the Effects of VRAs on Imported Steel Prices
The percentage increase in the price of imported steel is estimated using a partial equilibrium analysis commonly used to determine the percentage increase in the price of a product given a reduction or limitation in its import supply. Similar treatments can· be found in David G. Tarr and Morris E. Morkre, Aggregate Costs to the United States of Tariffs and Quotas on Imports: General Tariff Costs and Removal of Quoias on Automobiles, Steel, Sugar and Textiles, An Economic Policy Analysis, Bureau of Economics Staff Report to the Federal Trade Commission, December 1984, and Donald J. Rousslang and John W. Suomela, Calculating the Consumer and Net Welfare Costs of Import Relief, Staff Research Study 15, Office of Economics, USITC, July 1985. As is common, the analysis considers only the effect on the aggregate market for steel mill products.
Under the assumption that domestic and imported steel are imperfect substitutes, it can be shown that the percentage increase in the price of imported steel (denoted as pm) and domestic steel (denoted as pd) are determined, respectively, from the following (reduced form) equations:
ln[l+pd) = [-(ndm)/(nmm(ed+ndd)-(ndmnmd))] ln[l+qm]
ln[l+pm] = [-(ndd+ed)/(nmm(ed+ndd)-(ndmnmd))] ln[l+qm] [2)
[1)
where qm is the percentage changes in the quantity of imported steel; ed is the Sl,lpply elasticity of domestic steel; nmd is the demand elasticity of imported steel with respect to a change in the price of domestic steel; and ndm is the demand elasticity of domestic steel with respect to a change in the price of imported steel. For convenience the equations have been written in constant elasticity form. Equations [1] and [2] can be simplified to
ln[l+pd] = [-.0292) ln[l+qm]
ln[l+pm) = [-.2454) ln[l+qm]
[3]
[4)
[3] and [4) are then weighted by the projected (i.e., absent the VRAs) share of domestic and import supply to obtain t, the weighted-average change in the price of steel induced by the restraints. Specifically,
t = Wd ln[l+pd] +Wm ln[l+pm] [5]
1 This appendix was prepared with the assistance of Professor Jose A. Mendez of Arizona State · University.
D-3
D-4
where Wd and Wm are the projected domestic and import share for steel. The above equations use data from the following tabulation of elasticity estimates, as provided by Robert W. Crandall, The U.S. Steel Industry in Recurrent Crisis, Policy Options in a Competitive World, 1981:
Demand Estimate -Odd -1.55 ndm 0.60 -nmm -4.55 nmd 4.00 Supply ed 3.50
Estimating the Effects of Change in Steel Price on Steel-Consuming Industries' Costs and Product Prices
The methodology that is used to calculate the effect of an increase in the price of steel on the costs of production and product prices of steel-consuming industries is an adaptation of that found in James Melvin, "Short-Run Price Effects of the Corporate Income Tax and Implications for International Trade, "American Economic Review, vol. 69, December 1979. This adaptation was applied in the two following publications: the Commission's The Effects of Restraining U.S. Steel Imports on the Exports of Selected Steel-Consuming Industries (Inv. 332-214, USITC Publication 1788, December 1985) and Jose A. Mendez, "The Short-Run Trade and Employment Effects of Steel Import Restraints," The Journal of World Trade Law, Vol. 30, September/October 1986.
The analysis takes into account the two ways in which an increase in the price of steel can affect production costs. A steel price increase can have an immediate effect on the production costs of those industries that use steel as an input. A steel price increase can also affect the production costs of those industries that use steel-containing products as inputs. Input-output analysis is used to measure the total effects on production costs. These, in turn, are translated into industry price increases under the assumption that the increase in the costs of production experienced by industries is passed forward to consumers of the product.
Derivation of direct effects of the steel price increase
To derive the immediate impact of the steel price increase, the Commission follows the analysis outlined by Melvin (1979). For any industry i, the condition that total cost (which includes the payments for intermediate goods and the factors of production) equals total revenue may be expressed as
PiXi = P1X1i +P2X2i+ ... +PnXni+WLi+rKi i=l,2,. .. ,n [6]
where Pi, w, and r are, respectively, the price of commodity i, the wage rate, and the return to capital. Li is labor and Ki is the stock of capital employed by industry i. The Xji refers to the amount of good j used in the production of good i. The above may be rewritten by dividing by PiXi to obtain
1 = ali + a2i + ... + ani + li + ki i=1,2, ... ,n [7]
The aji's are the technical or input-output coefficients and Ii and ki are, respectively, (wLi/PiXi) and (wKi/PiXi). In input-output analysis, the aji's are often referred to as the "direct requirements coefficients." They indicate that aji cents of industry j were required to produce a dollar's worth of i's output.
The immediate effect of an increase in the weighted-average price of steel of (say) "t" percent is to raise steel-consuming industries' production costs in proportion to the percentage of their total costs accounted for by steel. Letting i=2 refer to the steel industry, costs per unit in the ith industry rise by si = (a2i• t). For instance, a t=10 percent increase in the weighted-average price of steel would raise an industry's per-unit costs by s=1 percent if the amount of steel they used per dollar of output, a2i, is .10 or 10 percent. To reflect this direct and immediate effect on costs per unit, equation [7] can be rewritten as
l+si = au + a2i(l+t) + ... + ani +Ii + ki (8)
for i=l,2, ... ,n industries.
Derivation of total effect of steel price increase
Equation [8] captures the immedi~te effect of the rise in the price of steel on industry Xi's unit production costs or price. However, as noted earlier, the price of Xi is also affected indirectly by the increase in the price of steel. Industry i uses in its production the output of other industries whose price, like that of industry i, has been affected by the increase in the price of steel. The total effects can be expressed as
l+pi = au(l+p1) + a2i(l+t+p2) + ... + ani(l+pn) +Ii + ki [9]
for i=l,2, ... ,n industries. The pi's incorporate the direct and indirect effect of the price increase.
The objective now is to express the pi's in terms oft. To do so, subtract equation (7] from equation (9). The expression that results is
pi = au(p1) + a2i(p2) + ... + ani(pn) + a2i(t) [10a]
for i=l,2, ... ,n industries. Placing the equations for all n industries in matrix form, [ 1 Oa] becomes
P = [A] P + [a2i] t [10b]
where A is the United States input-output table; t is the initial change in the weighted-average price of steel induced by the restraints, and P is a vector of the percentage changes in prices. [lOb] can now be solved for the total percentage increase in the price of all commodities as a result of the t-percent increase in the price of steel. However, before continuing funher, consider the interpretation of equation [ 1 Ob] .
The first term on the right-hand side of equation [ 1 Ob] captures the indirect effects of the steel price increase as the costs of other domestic steel-consuming products rises. The second term on the right-hand side of equation [10b] measures the direct effect of an increase in the price of steel on steel-consuming industries. Solving equation [10b] for the total percentage increase in the domestic price of steel-consuming industries due to a t-percent increase in the weighted-average price of steel obtains
P = [1-A)-1 x [a2i] t [10c]
This equation is combined in the next section to determine the effect of steel restraints on U.S. impons, expons, and domestic shipments.
Estimating the Effects of the Steel Price Increase on U.S. Exports, Imports, and Domestic Sales
As noted above, limits on steel exports to the United States cause the price of steel to rise in the U.S. market. This price increase, in turn, raises production costs for industries that use steel directly (as an input) or indirectly (through the purchase of products that contain steel). As domestic steel-consuming industries attempt to cover their production cost increases by raising product prices, they experience a reduction in domestic sales. The domestic price increases induce domestic and foreign consumers to switch expenditures away from domestic products toward foreign substitutes. The sum of these expenditure changes represents a ponion of the sales that are lost by domestic producers. Domestic producers also experience an additional reduction in sales because domestic consumers-in addition to switching from the domestic to the foreign substitute-reduce their aggregate expenditures on the product category. Although switching expenditures ailows domestic consumers to lessen the effects of the increase on the price of the domestic product, these consumers still face a higher total price for the product.
D-5
D-6
Effect on imports
The change in the value of imports is calculated by the following equation:
dMi = Mi Nmd pi i=l,2, ... ,n (11]
where Mi is the initial value of imports in the ith steel-consuming industry and Nmm is the (compensated) cross-price elasticity of demand for industry i imports with respect to a change in the price of the domestic substitute. As defined earlier, pi is the percentage increase in the domestic price of the ith steel-consuming industry.
As written, equation [11) is not operational. A comparable set of estimates of Nmd for all steel-consuming industries does not exist. However, a comparable set of estimates of Nmm, the own-price import demand elasticity for the ith industry, is readily available for all industries. Thus, equation [ 11) may be made operational as follows. In conjunction with the assumption that commodities are weakly separable or that all price effects outside the ith product group can be ignored, the following well-known properties of compensated demand elasticities,
-Di Ndd + Mi Nmd = 0
Di Ndm -Mi Nmm = 0
Mi Nmd = Di Ndm,
may be used to rewrite (11) as
dMi = Mi Nmm pi i=l,2, ... ,n [11a)
Effect on exports
The change in the value of exports is calculated by the following equation:
dXi = -Xi Nxx pi i=l,2, ... ,n [ 12)
where Xi is the initial value of exports by the ith steel-consuming industry and Nxx is the (compensated) export-price elasticity of demand for industry i's product.
Effect on domestic sales
The change in the value of domestic sales comprises three parts. It consists of those sales lost as domestic consumers switch their expenditures towards imports (estimated by [ 11 a)) ; it consists of the sales lost to foreign consumers (estimated by [ 12)) ; and it consists of the sales lost as domestic consumers reduce their expenditures on the entire product category. The reduction in total sales is calculated by the following equation:
dTDi = -dMi + dXi + Di Ni (Di/Mi+Di) pi i=l,2, ... ,n [13)
where Di is the initial value of domestic sales, Ni is the own-price elasticity of demand for the entire product category, and (Di/Mi+Di) pi measures the weighted-average increase in the price of the product category.
Equation [ 13) is applied for two cases. In the first case, it is assumed that Ni= 0. That is, the demand for the product category is inelastic or unresponsive to a change in the product category's price. For the second case, it is assumed that Ni = 1 or is of unit elasticity. Although the Commission lacked estimates of Ni for each of the 79 input-output sectors, 37 of the 44 estimated own-price elasticities contained in a study by H. Houthakker and Lester Taylor (Consumer Demand in the United States: Analyses and Projections, Harvard University Press, 1970) were between zero and one.
After equations [ 11a], [ 12]. and [ 13) are placed in matrix form, the pi are then replaced with [ 1 Oc] to estimate the effects of the steel price increase.
Description of Data
The 79-sector (n=79) U.S. inpµt"'OUtput coefficient matrix, A, in [10b] is obtained from the U.S. Department of Cofumerce, The Detailed Input-Output Structure of the U.S. Economy, 1977.
Data on U.S. imports, Mi, and U.S. exports, Xi, are from official statistics of the U.S. Bureau of the Census. Imports are clas~ified by the Tariff Schedules of the United States (TSUS), and exports are classified by Schedule B. These trade data are concorded to the Bureau of Economic Analysis input-output categories using a concordance prepared by the Commission's Office of Industries. Imports are measured inclusive of international transport costs, but exclusive of duties paid, i.e. c.i.f. Exports are values f.a.s. at the U.S. port. Domestic shipments, Di, are from data tapes developed by the U.S. Bureau of Labor Statistics. Domestic shipment and trade data are deflated to 1977 dollar values using U.S. price deflators to make them comparable to the technical coefficients of the input-output table. The price deflators are constructed from estimates of constant-dollar domestic shipments prepared by the U.S. Bureau of Labor Statistics.
The import-, Nmm, and export-, Nxx, demand elasticities are obtained for each of the 79 2-digit input-output industries from Robert E. Baldwin and Wayne E. Lewis, "U.S. Tariff Effects on Trade and Employment in Detailed SIC Industries," in U.S. Department of Labor, Bureau of International J.,abQr Affairs, The Impact of International Trade and Investment on Employment, 1978.
D-7

APPENDIX E ESTIMATED EFFECI'S OF VRAs ON EXPORTS, IMPORTS, AND
DOMESTIC SALES IN 79 STEEL-CONSUMING INDUSTRIES

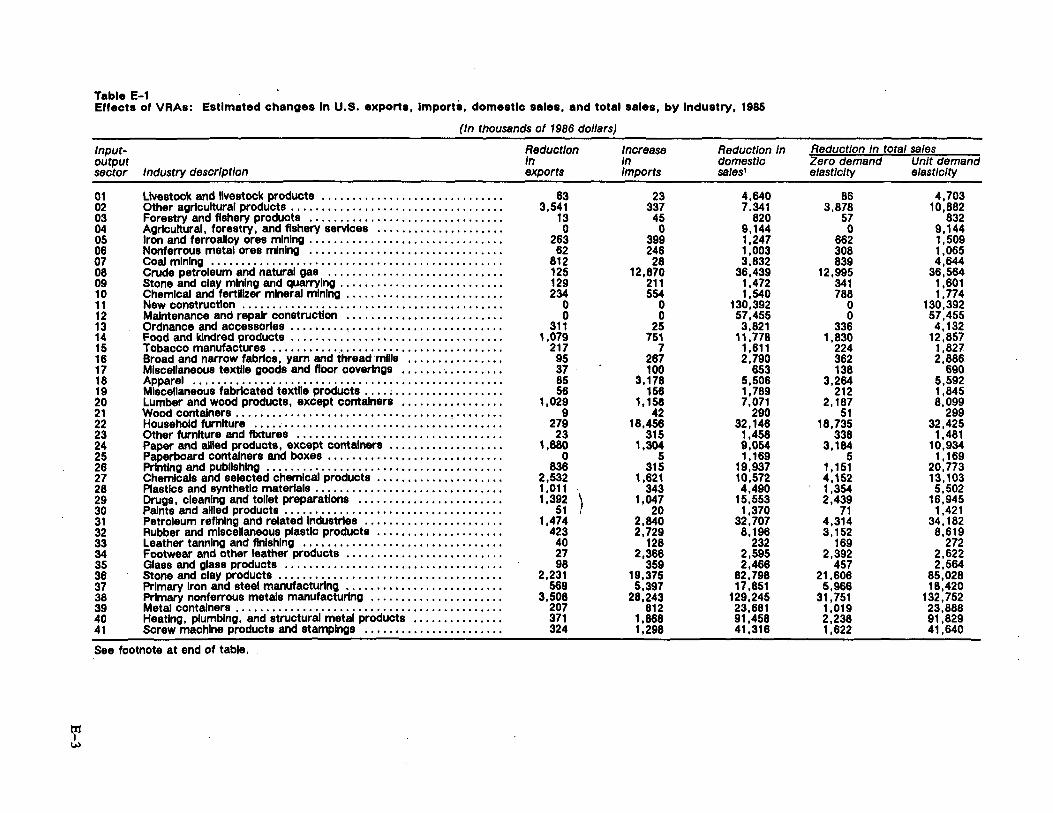
tr1 I w
Table E-1 . Effects of VRAs: Estimated changes In U.S. exports, Imports, domestic sales, and total sales, by Industry, 1985
(In thousands of 1986 dollars)
Inputoutput sector Industry description
01 02 03 04 05 06 07 08 09 10 11 12 13 14 15 16 17 18 19 20 21 22 23 24 25 26 27 28 29 30 31 32 33 34 35 36 37 38 39 40 41
Livestock and livestock products ............................ .. Other agricultural products .................................. . Forestry and fishery products ............................... . Agricultural, forestry. and fishery services •....•............... Iron and ferroalloy ores mining .....................•.......... Nonferrous metal ores mining .............................. .. Coal mining ............................................... . Crude petroleum and natural gas ..........................•.. Stone and clay mining and quarrying ......................... .. Chemical and fertlllzer mineral mining ......................... . New construction .......................................... . Maintenance and repair construction ..........•............... Ordnance and accessories •........•......................... Food and kindred products .................................. . Tobacco manufactures ............•.................•......... Broad and narrow fabrics, yarn and thread mllls ..............•. Miscellaneous textile goods and floor coverings ................• Apparel ................•.................................. Miscellaneous fabricated textile products .... ; ......•...•.•..... Lumber and wood products. except containers •......•..•.•.... Wood containers .•..•...•...........................•....... Household fUmlture ................................. ~ ..•.•... Other fUmlture and fixtures ................................. . Paper and allied products, except containers .......•.....••.... Paperboard containers and boxes ............................ . Printing and publishing ...................................... . Chemicals and selected chemical products ...........•••••••.•• Plastics and synthetic materials .............................. . Drugs, cleaning and tollet preparations •.............•....•.•.. Paints and allled products .•....•...•....................•.... Petroleum refining and related Industries .....•................. Rubber and mlscellaneous plastic products .......•............. Leather tanning and finishing ....•...•............•.....•..... Footwear and other leather products ...............•....•..... Glass and glass products .........................•.......... Stone and clay products .................................... . Primary Iron and steel manufacturing ......................... . Primary nonferrous metals manufacturing ..................... . Metal containers ...................................•...•.... Heating, plumbing, and structural metal products .............. . Screw machine products and stampings ......••...............
See footnote at end of table.
Reduction In exports
63 3,541
13 0
263 62
812 125 129 234
0 0
311 1,079
217 ·95 37 85 56
1,029 9
279 23
1,880 0
836 2,532 1,011 \ 1,392 I
51 ' 1,474
423 40 27 98
2,231 569
3,508 207 371 324
Increase In Imports
23 337 45 0
399 246 28
12,870 211 554
0 0
25 751
7 267 100
3, 178 156
1, 158 42
16,456 315
1,304 5
315 1,621
343 1,047
20 2,840 2,729
128 2,368
359 19,375 5,397
28,243 812
1,868 1,298
Reduction In domestic sales1
4,640 7.341
820 9,144 1,247 1,003 3,832
36,439 1,472 1,540
130,392 57,455 3,821
11,778 1,611 2,790
653 5,506 1,789 7,071
290 32, 146
1,458 9,054 1, 169
19,937 10,572 4,490
15,553 1,370
32,707 8,196
232 2,595 2,466
82,798 17,851
129,245 23,681 91,458 41,316
Reduction In total sales Zero demand Unit demand elasticity elasticity
86 3,878
57 0
662 308 839
12,995 341 788
0 0
336 1,830
224 362 138
3,264 212
2, 187 51
18,735 338
3,184 5
1, 151 4,152 1,354 2,439
71 4,314 3, 152
169 2,392
457 21,606 5,966
31, 751 1,019 2,238 1,622
4,703 10,882
832 9, 144 1,509 1,065 4,644
36,564 1,601 1,774
130,392 57,455 4, 132
12,857 1,827 2,886.
690 5,592 1,845 8,099
299 32,425
1,481 10,934
1, 169 20,773 13,103 5,502
16,945 1,421
34, 182 8,619
272 2,622 2,564
85,028 18,420
132,752 23,888 91,829 41,640
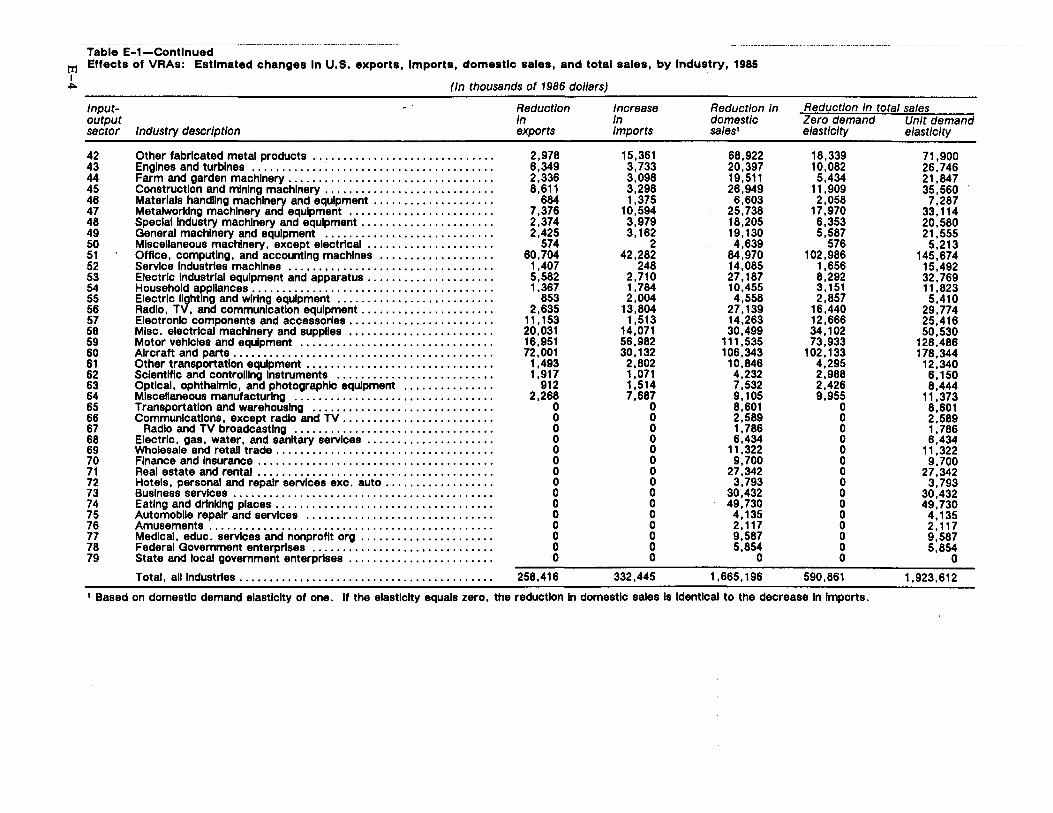
Table E-1-Contlnued tr:I Effects of VRAs: Estimated changes In U.S. exports, Imports, domestic sales, and total sales, by Industry, 1985 I .,..
Input-output sector
42 43 44 45 46 47 48 49 50 51 52 53 54 55 56 57 58 59 60 61 62 63 64 65 66 67 68 69 70 71 72 73 74 75 76 77 78 79
(In thousands of 1986 dollars)
- Reduction In
Industry description exports
Other fabricated metal products .............................. 2,978 Engines and turbines ............ · ............................ 6.349 Farm and garden machinery .................................. 2.336 Construction and mining machinery ............................ 8,611 Materials handling machine~ and equipment .................... 684 Metalworking machinery an equipment ........................ 7,376 Speclal Industry machinery and equipment ...................... 2,374 General machinery and equipment ............................ 2,425 Miscellaneous machinery, except electrical ..................... 574 Office, computing, and accounting machines ................... 60,704 Service Industries machines .................................. 1,407 Electric Industrial equipment and apparatus ..................... 5,582 Household appliances ........................................ 1,367 Electric l~htlng and wiring equipment .......................... 853 Radio. T , and communication equipment ...................... 2,635 Electronic components and accessories ........................ 11.153 Misc. electrlcal machinery and supplies ........................ 20,031 Motor vehicles and equipment ................................ 16,951 Aircraft and parts ........................................... 72,001 Other transportation equipment ............................... 1,493 Scientific and controlllng Instruments .......................... 1,917 Optical, ophthalmic, and photographic equipment ............... 912 MlsceHaneous manufacturing ................................. 2,268 Transportation and warehousing ....................•......... 0 Communications. except radio and TV ......................... 0
Radio and TV broadcasting ................................. 0 Electric. gas, water, and sanitary services ..................... 0 Wholesale and retail trade .................................... 0 Finance and Insurance ....................................... 0 Real estate and rental ....................................... 0 Hotels, personal and repair services exc. auto .................. 0 Business services ........................................... 0 Eating and drinking places .................................... 0 Automobile repair and services ............................... 0 Amusements ............................................... 0 Medical, educ. services and nonprofit org ...................... 0 Federal Government enterprises .............................. 0 State and local government enterprises ........................ 0
Total, all Industries .......................................... 258,416
Increase Reduction In In domestic Imports sales'
15,361 68,922 3,733 20,397 3,098 19,511 3,298 26,949 1,375 6,603
10,594 25,738 3,979 18,205 3, 162 19, 130
2 4,639 42,282 84,970
248 14,085 2,710 27.187 1,784 10,455 2,004 4,558
13,804 27, 139 1,513 14,263
14,071 30,499 56,982 111,535 30, 132 106,343 2,802 10,846 1,071 4,232 1,514 7,532 7,687 9, 105
0 8,601 0 2,589 0 1,786 0 6,434 0 11,322 0 9,700 0 27,342 0 3,793 0 30,432 0 49,730 0 4, 135 0 2, 117 0 9,587 0 5,854 0 0
332,445 1,665, 196
Reduction In total sales Zero demand Unit demand elasticity elasticity
18,339 71,900 10,082 26,746 5,434 21,847
11,909 35,560 2,058 7.287
17,970 33,114 6,353 20,580 5,587 21,555
576 5,213 102,986 145,674
1,656 15,492 8,292 32,769 3, 151 11,823 2,857 5,410
16,440 29,774 12,666 25,416 34, 102 50,530 73,933 128,486
102.133 178,344 4,295 12.340 2,988 6, 150 2,426 8,444 9,955 11,373
0 8,601 0 2,589 0 1,786 0 6,434 0 11,322 0 9,700 0 27,342 0 3,793 0 30,432 0 49,730 0 4, 135 0 2, 117 0 9,587 0 5,854 0 0
590,861 1,923,612
1 Based on domestic demand elasticity of one. If the elasticity equals zero, the reduction In domestic sales Is Identical to the decrease In Imports.
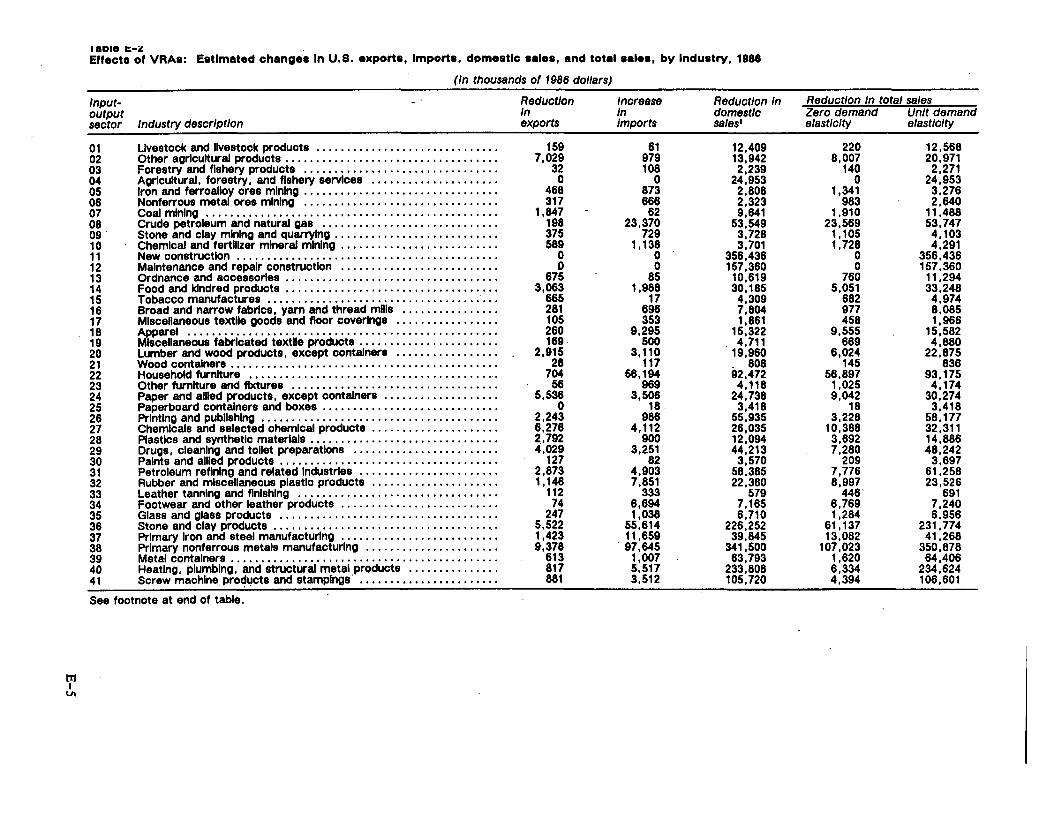
t?1 I
VI
1aD1e c-;,c Effecto of VRAa: Estimated change·a In U.S. exports, Imports, dpmestlc sales, and total aalea, by lnduatry, 1888
(In thousands of 1986 dollars)
/nputoutput sector Industry description
01 02 03 04 05 06 07 08 09 10 11 12 13 14 15 16 17 18 19 20 21 22 23 24 25 26 27 28 29 30 31 32 33 34 35 36 37 38 39 40 41
Livestock and livestock products ............................ .. Other agricultural products .................................. . Forestry and fishery products ............................... . Agrlcultural, forestry, and fishery services .................... . Iron and ferroalloy ores mining ............................... . Nonferrous metal ores mining ............................... . Coal mining .........................•...................... Crude petroleum and natural gas .............•............... Stone and clay mining and quarrying .......................... . Chemical and fertlllzer mineral mining ......................... . New construction ........•................................. , Maintenance and repair construction ..........•...•........... Ordnance and accessories .................................. . Food and kindred products ..............................•.... Tobacco manufactures •.................................. · ... Broad and narrow fabrics, yam and thread mllls .............•.. Miscellaneous textile goods and floor coverings ................ . Apparel .............................•..................... Miscellaneous fabricated textile products •...................... Lumber and wood products, except containers ...........•..... Wood containers .•.•................•.......•............... Household furniture .......................................•. Other furniture and fixtures ..•.......•...•..•............•... Paper and allled products, except containers .................. . Paperboard containers and boxes ............................ . Printing and publlshlng ..................................•..•. Chemicals and selected chemical products .................... . Plastics and synthetic materials ...............•..............• Drugs, cleaning and tollet preparations ..............•......... Paints and allled products ................................... . Petroleum refining and related Industries ...................... . Rubber and mlsceilaneous plastlc products .................... . Leather tanning and finishing ............................•.••• Footwear and other leather products ......................•... Glass and glass products ................................... . Stone and clay products ................................... , . Primary Iron and steel manufacturing ..............•.. , ....... . Primary nonferrous metals manufacturing ..................... . Metal containers ..............•............................. Heating, plumbing, and structural metal products ...•........... Screw machine. prod1,1cts and stampings· .....•••..••.•••••••..•
See footnote at end of table.
Reduction In exports
159 7,029
32 0
468 317
1,847 198 375 589
0 0
675 3,063
665 281 105 260 169
2,915 28
704 56
5,536 0
2,243 6,278 2,792 4,029
127 2,873 1, 148
112 . 74
247 5,522 1,423 9,378
613 817 881
Increase In Imports
61 979 108
0 873 668
62 23,370
729 1, 138
0 0
85 1,988
17 698 353
9,295 500
3, 110 117
58, 194 969
3,508 18
988 4, 112
900 3,251
82 4,903 7,851
333 6,694 1,038
55,614 11,659 97,645
1,007 5,517 3,512
Reduction In domestic sa/es1
12,409 13,942 2,239
24,953 2,808 2,323 9,841
53,549 3,728 3,701
356,438 157,360
10,619 30, 185
4,309 7,804 1,861
15,322 . 4,711
19,960 . 808 92,472 4, 118
24,738 3,418
55,935 26,035 12,094 44,213
3,570 58,385 22,380
579 7,165 6,710
226,252 39,845
341,500 63,793
233,808 105, 720
Reduction In total sales Zero demand Unit demand elastlclty elasticity
220 8,007
140 0
1,341 983
1,910 23,569
1, 105 1,728
0 0
760 5,051
682 977 458
9,555 669
6,024 145
56,897 1,025 9,042
18 3,228
10,388 3,692 7,280
209 7,776 8,997
446' 6,769 1,284
61, 137 13,082
107,023 1,620 6,334 4,394
12,568 20,971
2,271 24,953 3,276 2,640
11,488 53,747 4, 103 4,291
356,436 157,360
11,294 33,248 4,974 6,085 1,966
15,582 4,880
22,875 838
93, 175 4, 174
30,274 3,418
58.177 32,311 14,886 48,242
3,697 61,258 23,526
691 7,240 6,956
231,774 41,268
350,878 64,406
234,624 106,601
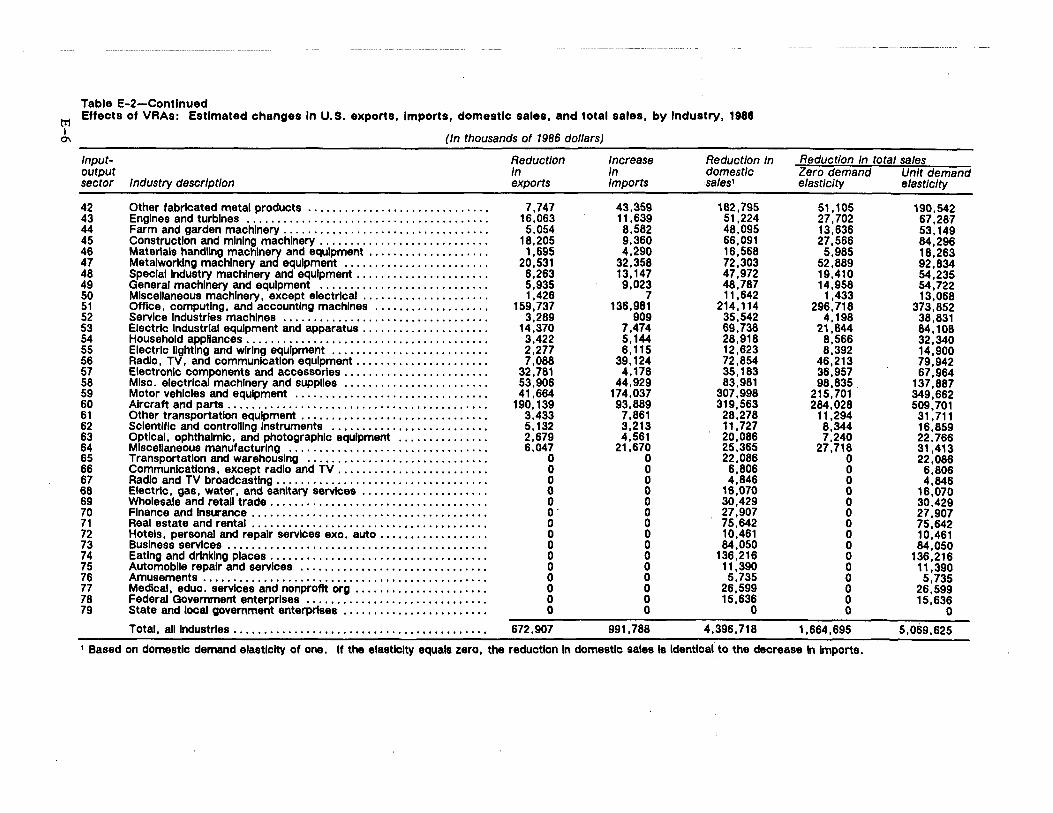
Table E-2-Contlnued trl Effects of VRAs: Estimated changes In U.S. exports, Imports, domestic sales, and total sales, by Industry, 1988 I 0\
Input-output sector
42 43 44 45 46 47 48 49 50 51 52 53 54 55 56 57 58 59 60 61 62 63 64 65 66 67 68 69 70 71 72 73 74 75 76 77 78 79
(In thousands of 1986 dollars)
Reduction In
Industry description exports
Other fabricated metal products .............................. 7,747 Engines and turbines ........................................ 16,063 Farm and garden machinery .................................. 5,054 Construction and mining machinery ............................ 18,205 Materials handllng machined and equipment .................... 1,695 Metalworklng machinery an equipment ........................ 20,531 Special Industry machinery and equipment ...................... 6,263 General machinery and equipment ............................ 5,935 Miscellaneous machinery, except electrical ..................... 1,426 Office, computing, and accounting machines ................... 159,737 Service Industries machines .................................. 3,289 Electric Industrial equipment and apparatus ..................... 14,370 Household appliances ........................................ 3,422 Electric llghtlng and wiring equipment .......................... 2,277 Radio, TV, and communication equipment ...................... 7,088 Electronic components and accessories ........................ 32,781 Misc. electrical machinery and supplies ........................ 53,906 Motor vehicles and equipment ................................ 41,664 Aircraft and parts ........................................... 190, 139 Other transportation equipment ............................... 3,433 Scientific and controlllng Instruments .......................... 5, 132 O~tlcal. ophthalmic, and photographic equipment ............... 2,679 M scellaneous manufacturing ................................. 6,047 Transportation and warehousing .............................. 0 Communications, except radio and TV ......................... 0 Radio and TV broadcasting ................................... 0 Electric, gas, water, and sanitary services ..................... 0 Wholesale and retall trade .................................... 0 Finance and Insurance ....................................... 0 Real estate and rental .....................................•. 0 Hotels. personal and repair services exc. auto .................. 0 Business services ........................................... 0 Eating and drinking places .................................... 0 Automobile repair and services ...................•.........•• 0 Amusements ............................................... 0 Medical, educ. services and nonprofit org ...................... 0 Federal Government enterprises ............................•. 0 State and local government enterprises ........................ 0
Total, all Industries .......................................... 672,907
Increase Reduction In In domestic Imports sales1
43,359 182,795 11,639 51,224 8,582 48,095 9,360 66,091 4.290 16,568
32,358 72,303 13, 147 47,972 9,023 48,787
7 11,642 136,981 214.114
909 35,542 7,474 69,738 5,144 28,918 6, 115 12,623
39.124 72,854 4.176 35, 183
44,929 83,981 174,037 307,998 93,889 319,563 7,861 28,278 3,213 11,727 4,561 20,086
21,670 25,365 0 22,086 0 6,806 0 4,846 0 16,070 0 30,429 0 27,907 0 75,642 0 10,461 0 84,050 0 136,216 0 11,390 0 5,735 0 26,599 0 15,636 0 0
991,788 4,396,718
Reduction In total sales Zero demand Unit demand elasticity elasticity
51'105 190,542 27,702 67,287 13,636 53, 149 27,566 84,296 5,985 18,263
52,889 92,834 19,410 54,235 14,958 54,722
1,433 13,068 296,718 373,852
4, 198 38,831 21,844 84, 108 8,566 32,340 8,392 14,900
46,213 79,942 36,957 67,964 98,835. 137,887
215,701 349,662 284,028 509,701
11,294 31, 711 8,344 16,859 7,240 22,766
27,718 31,413 0 22,086 0 6,806 0 4,846 0 16,070 0 30,429 0 27,907 0 75,642 0 10,461 0 84,050 0 136,216 0 11,390 0 5,735 0 26,599 0 15,636 0 0
1,664,695 5,069,625 1 Based on domestic demand elasticity of one. If the elasticity equals zero, the reduction In domestic sales Is Identical to the decrease In Imports.
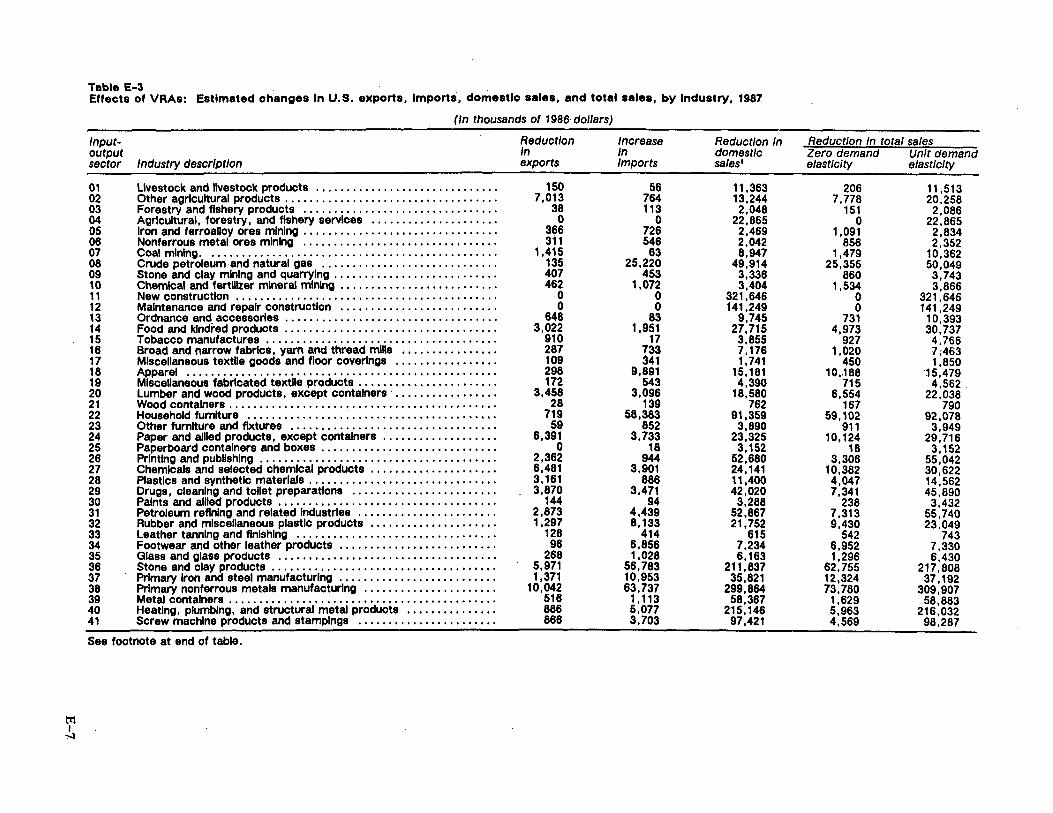
tI1 I
-,.-1
Table E-3 . . . Effects of VRAs: Estimated changes In U.S. exports, Imports, domestic sales, and total sales, by Industry, 1987
(In thousands of 1986 dollars)
Input- Reduction Increase Reduction In output In In domestic sector Industry description exports Imports sates1
01 Livestock and livestock products .............................. 150 56 11,363 02 Other agricultural products ................................... 7,013 764 13,244 03 Forestry and fishery products ................................ 38 113 2,048 04 Agricultural, forestry, and fishery services ..................... 0 0 22,865 05 Iron and ferroalloy ores mining ................................ 366 726 2,469 06 Nonferrous metal ores mining .....................•..•.•..•.. 311 546 2,042 07 Coal mining. . ...................................•.......... 1,415 63 8,947 08 Crude petroleum· and natural gas ............................. 135 25,220 49,914 09 Stone and clay mining and quarrying ........................... 407 453 3,336 10 Chemical and fertlllzer mlneral mining .........•................ 462 1,072 3,404 11 New construction ..................................•..•..... 0 0 321,646 12 Maintenance and repair construction .......................... 0 0 141,249 13 Ordnance and accessories ................................... 648 83 9,745 14 Food and kindred products ................................... 3,022 1,951 27,715 15 Tobacco manufactures .......•..................•........... 910 17 3,855 16 Broad and narrow fabrics, yarn and thread mllls ................ 287 733 7,176 17 Miscellaneous textile goods and floor coverings ••.........•..... 109 341 1, 741 18 Apparel ................................................... 298 9,891 15, 181 19 Miscellaneous fabricated textile products •.•...•••..•........... 172 543 4,390 20 Lumber and wood products, except containers · ................. 3,458 3,096 18,580 21 Wood containers ......................................•..... 28 139 762 22 Household furniture ................ : .........•..••......•••• 719 58,383 91,359 23 Other furniture and fixtures .................................. 59 852 3,890 24 Paper and allled products, except containers ................... 6,391 3,733 23,325 25 Paperboard containers and boxes ............................. 0 18 3,152 26 Printing and publlshlng ....................................... 2,362 944 52,680 27 Chemicals and selected chemical products ............•.•...... 6,481 3,901 24, 141 28 Plastics and synthetic materials ......................•........ 3, 161 886 11,400 29 Drugs, cleaning and tollet preparations ........................ 3,870 3,471 42,020 30 Paints and allled products ................•.........•......... 144 94 3,288 31 Petroleum refining and related Industries ................•....•. 2,873 4,439 52,867 32 Rubber and miscellaneous plastlc products .........•........... 1,297 8, 133 21,752 33 Leather tanning and finishing ................•................ 128 414 615 34 Footwear and other leather products ..........•.....•...•••... 96 6,856 7,234 35 Glass and glass products ......................•.•........... 268 1,028 6, 163 36 Stone and clay products .........................•••••••..••. 5,971 56,783 211,837 37 Primary Iron and steel manufacturing .......................... 1,371 10,953 35,821 38 Primary nonferrous metals manufacturing ..................•... 10,042 63,737 299,864 39 Metal containers ....................... ; .........•.......... 516 1.113 58,367 40 Heating, plumbing, and structural metal products .........•....• 886 5,077 215, 146 41 Screw machine products and stampings ...................•... 866 3,703 97,421
See footnote at end of table.
Reduction In total sales Zero demand Unit demand elasticity elasticity
206 11,513 7,778 20,258
151 2,086 0 22,865
1,091 2,834 856 2,352
1,479 10,362 25,355 50,049
860 3,743 1,534 3,866
0 321,646 0 141,249
731 10,393 4,973 30,737
927 4,766 1,020 7;463
450 1,850 10,.188 15,479
715 4,562 6,554 22,038
167 790 59, 102 92,078
911 3,949 10, 124 29,716
16 3, 152 3,306 55,042
10,382 30,622 4,047 14,562 7,341 45,890
238 3,432 7,313 55,740 9,430 23,049
542 743 6,952 7,330 1,296 6,430
62,755 217,808 12,324 37, 192 73,780 309,907
1,629 58,883 5,963 216,032 4,569 98,287
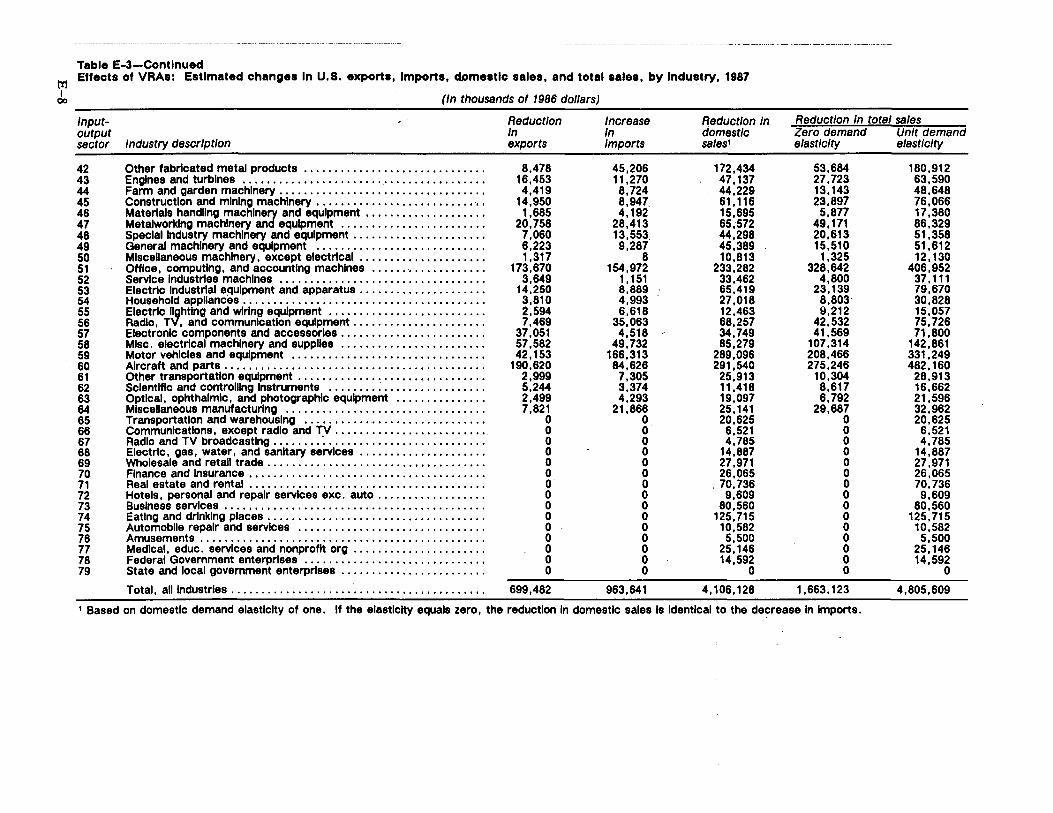
Table E-3-Contlnued tt:I Effects of VRAa: Estimated changes In U.S. exports, Imports, dQmeatlc sales, and total sales, by Industry, 1987 I (In thousands of 1986 dollars) 00
Input- - Reduction Increase Reduction In Reduction In total sales output In In domestic Zero demand Unit demand sector Industry description exports Imports sales1 elasticity elasticity
42 Other fabricated metal products .......•...................... 8,478 45,206 172,434 53,684 180,912 43 Engines and turbines ................................•....... 16,453 11,270 47,137 27,723 63,590 44 Farm and garden machinery .................................. 4,419 8,724 44,229 13, 143 48,648 45 Construction and mining machinery ............................. 14,950 8,947. 61, 116 23,897 76,066 46 Materials handling machlne'J' and equipment .................... 1,685 4, 192 15,695 5,877 17,380 47 Metalworking machinery an equipment ........................ 20,758 28,413 65,572 49, 171 86,329 48 Special Industry machinery and equipment ...................... 7,060 13,553 44,298 20,613 51,358 49 General machinery and equipment ............................ 6,223 9,287 45,389 15,510 51,612 50 Mlscellaneous machinery, except electrical ..................... 1,317 8 10,813 1,325 12, 130 51 Office, computing, and accounting machines ................... 173,670 154,972 233,282 328,642 406,952 52 Service Industries machines .................................. 3,649 1, 151 33,462 4,800 37. 111 53 Electric Industrial equipment and apparatus ...............•..... 14,250 8,889 65,419 23, 139 79,670 54 Household appliances ........................................ 3,810 4,993 27,018 8,803· 30,828 55 Electric l~htlng and wiring equipment .......................... 2,594 6,618 12,463 9,212 15,057 56 Radio, T , and communication equipment ...................... 7,469 35,063 68,257 42,532 75,726 57 Electronic components and accessories ........................ 37,051 4,518 34,749 41,569 71,800 58 Misc. electrical machinery and supplies ................•....... 57,582 49,732 85,279 107,314 142,861 59 Motor vehicles and equipment ................................ 42, 153 166,313 289,096 208,466 331,249 60 Aircraft and parts ........................................... 190,620 84,626 291,540 275,246 482, 160 61 Other transportation equipment ............................... 2,999 7,305 25,913 10,304 28,913 62 Scientific and controlling Instruments ........ ; .............•... 5,244. 3,374 11,416 8,617 16,662 63 Optical, ophthalmlc, and photographic equipment ............... 2,499 4,293 19,097 6,792 21,596 64 Miscellaneous manufacturing .......................•......... 7,821 21,866 25, 141 29,687 32,962 65 Transportation and warehousing .............................. 0 0 20,625 0 20,625 66 Communications, except radio and TV .......................... 0 0 6,521 0 6,521 67 Radio and TV broadcasting ........ '. .......................... 0 0 4,785 0 4,785 68 Electric, gas, water, and sanitary services ..................... 0 0 14,887 0 14,887 69 Wholesale and retail trade .................................... 0 0 27,971 0 27,971 70 Finance and Insurance ....................................... 0 0 26,065 0 26,065 71 Real estate and rental ....................................... 0 0 . 70,736 0 70,736 72 Hotels, personal and repair services exc. auto .................. 0 0 9,609 0 9,609 73 Business services ........................................... 0 0 80,560 0 80,560 74 Eating and drinking places .................................... 0 0 125,715 0 125,715 75 Automobile repair and services ............................... 0 0 10,582 0 10,582 76 Amusements ............................................... 0 0 5,500 0 5,500 77 Medical, educ. services and nonprofit org ...................... 0 0 25, 146 0 25, 146 78 Federal Government enterprises ...... · ........................ 0 0 14,592 0 14,592 79 State and local government enterprises ........................ 0 0 0 0 0
Total, all Industries .......................................... 699,482 963,641 4, 106, 128 1,663, 123 4,805,609
1 Based on domestic demand elastlclty of one. If the elastlclty equals zero, the reduction In domestic sales Is Identical to the decrease In Imports.
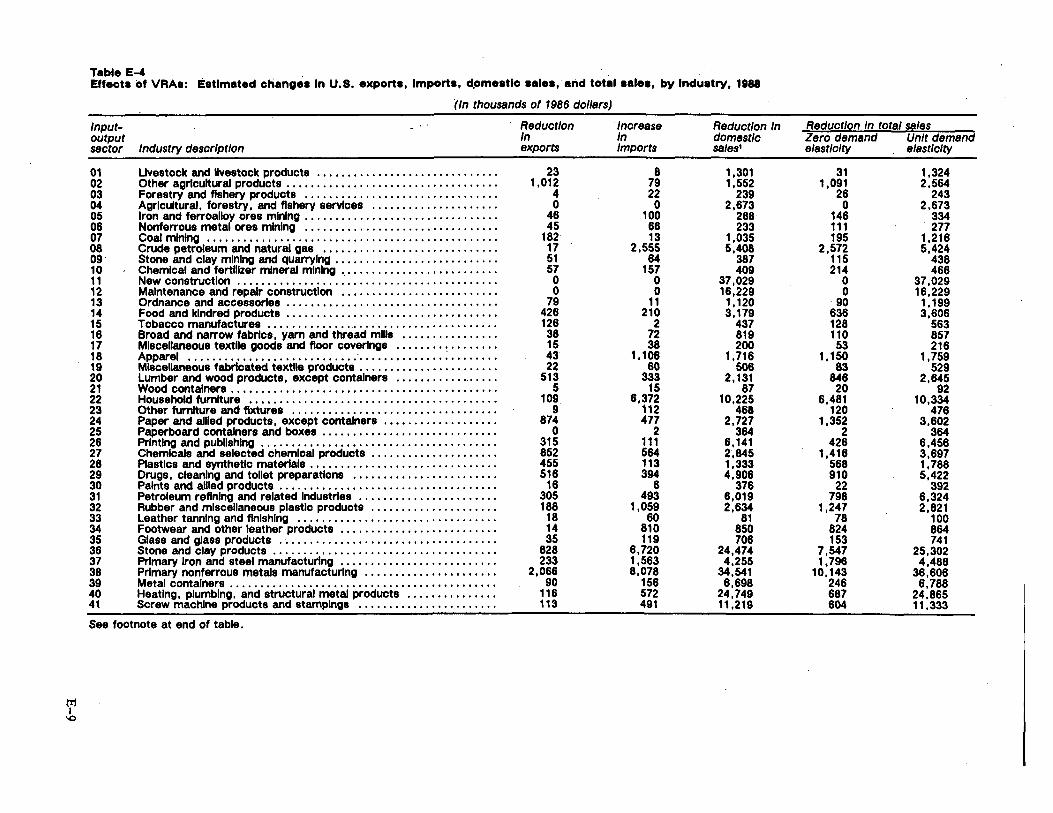
tr1 I
\Q
Table E-4 . . Effect• of VRAs: Estimated changes In U.S. exports, Imports, d,omestlo aalea, alid total aalea, by Industry, 1988
(In thousands of 1986 dollars)
Inputoutput sector Industry description
01 Uvestock and livestock products ............................. . 02 Other agrlcultural products ....................•..........•... 03 Forestry and fishery products ............................... . 04 Agrlcultural, forestry, and fishery services ..........•....•..•.. 05 Iron and ferroalloy ores mining ............................... . 06 Nonferrous metal ores mining ............................... . 07 Coal mining ............................................•... 08 Crude petroleum and natural gas ............................ . 09 · Stone and clay mining and quarrying .............•............. 1 O Chemical and fertlllzer mineral mining .......................... . 11 New construction .......................................... . 12 Maintenance and repair construction ......................... . 13 Ordnance and accessories ...................•............... 14 Food and kindred products .....................•..........••. 15 Tobacco manufactures ..................................... . 16 Broad and narrow fabrics, yarn and thread mills ............... . 17 Miscellaneous textile goods and floor coverings ........ ~ ....... . 18 Apparel .........................•. : . .....•.•.•............ 19 Miscellaneous fabricated textile products ...................... . 20 Lumber and wood products, except containers •.......•........ 21 Wood containers ..••..•.............................•...••.. 22 Household furniture •........................................ 23 Other furniture and fixtures .............................•.... 24 Paper and allled products, except containers .•••..........••... 25 Paperboard containers and boxes ............................ . 26 Printing and publlshlng ...............•...........•........... 27 Chemicals and selected chemical products ...•......•.....••... 28 Plastics and synthetic materials ....•.......................... 29 Drugs, cleaning and tollet preparations ...•......••.....•...... 30 Paints and allled products ......................•..•.......... 31 Petroleum refining and related Industries ...................•... 32 Rubber and miscellaneous plastic products .................... . 33 Leather tanning and finishing ................................ . 34 Footwear and other leather products ................•......... 35 Glass and glass products ................................... . 36 Stone and clay products .................................... . 37 Primary Iron and steel manufacturing ......................... . 38 Primary nonferrous metals manufacturing ...•.........••....... 39 Metal containers ................................•........... 40 Heating, plumbing, and structural metal products .....•.....•... 41 Screw machine products and stampings ...................... .
See footnote at end of table.
Reduction In exports
23 1,012
4 0
46 45
182 17 51 57
0 0
79 426 126 38 15 43 22
513 5
109 9
874 0
315 852 455 516
16 305 188 18 14 35
828 233
2,066 90
116 113
Increase In Imports
8 79 22 0
100 66 13
2,555 64
157 0 0
11 210
2 72 38
1, 106 60
333 15
6,372 112 477
2 111 564 113 394
6 493
1,059 60
810 119
6,720 1,563 8,078
156 572 491
Reduction In domestic sales'
1,301 1,552
239 2,673
288 233
1,035 5,408
387 409
37,029 16,229 1, 120 3,179
437 819 200
1,716 506
2, 131 87
10,225 468
2,727 364
6, 141 2,845 1,333 4,906
376 6,019 2,634
81 850 706
24,474 4,255
34,541 6,698
24,749 11,219
Reduction In total sales Zero demand Unit demand elasticity . elasticity
31 1,091
26 0
146 111 195
2,572 115 214
0 0
90 636 128 110 53
1, 150 83
846 20
6,481 120
1,352 2
426 1,416
568 910
22 798
1,247 78
824 153
7,547 1,796
10, 143 246 687 604
1,324 2,564
243 2,673
334 277
1,216 5,424
438 466
37,029 16,229 1, 199 3,606
563 857 216
1,759 529
2,645 92
10,334 476
3,602 364
6,456 3,697 1,788 5,422
392 6,324 2,821
100 864 741
25,302 4,488
36,606 6,788
24,865 11,333
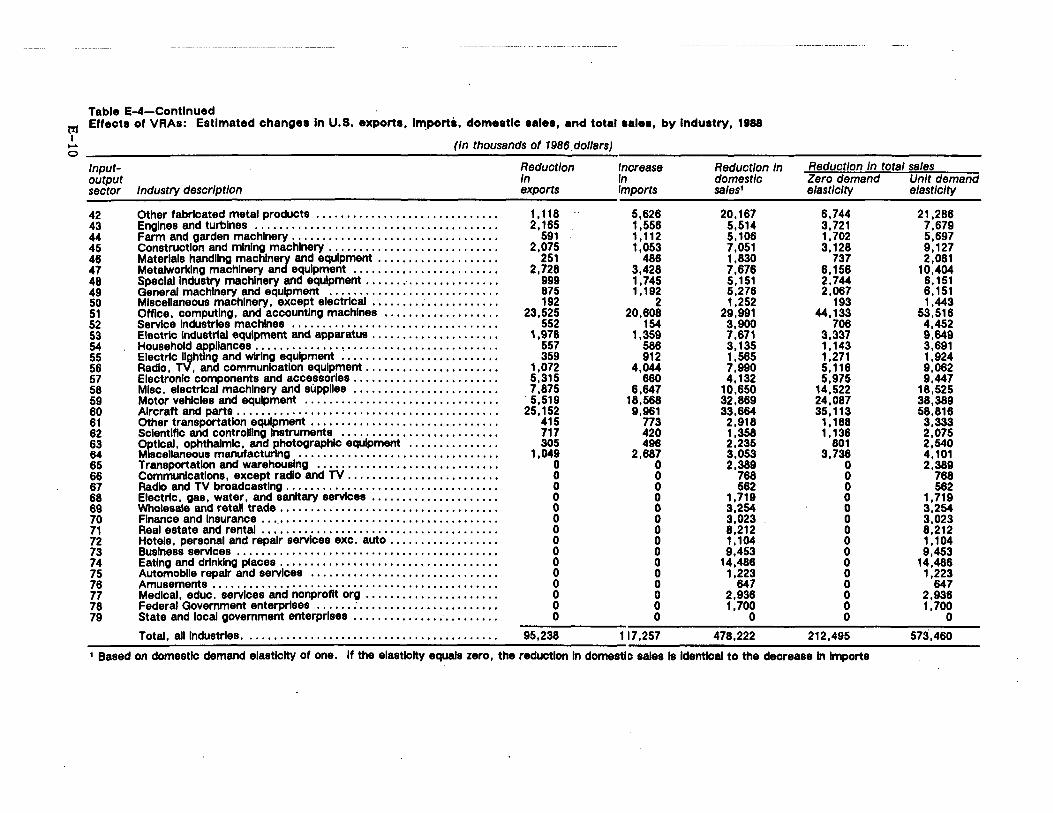
Table E-4-Contlnued l'!1 Effects of VRAs: Estimated changes In U.S. exports, lm_porta, domestic sales, and total sales, by Industry, 1188 I ~
0
Input-output sector
42 43 44 45 46 47 48 49 50 51 52 53 54 55 56 57 58 59 60 61 62 63 64 65 66 67 68 69 70 71 72 73 74 75 78 77 78 79
(In thousands of 1986 dollars)
Reduction In
Industry description exports
Other fabricated metal products .............................. 1, 118 Engines and turbines ...............................•........ 2,165 Farm and garden machinery .................................. 591 Construction and mining machinery ............................ 2,075 Materlals handling machine~ and equipment ..............•..... 251 Metalworking machinery an equipment ....••.......•••......•• 2,728 Special Industry machinery and equipment ...•.................. 999 General machinery and equipment ............................ 875 Mlscellaneous machinery, except electrlcal . · ............•....... 192 Office, computing, and accounting machines .........•......... 23,525 Service Industries machines .................................• 552 Electric Industrial equipment and apparatus ...........•......... 1,978 Household appliances .............. , ......................... 557 Electric l~htlng and wiring equipment ....................•..... 359 Radio, T , and communication equipment .................•...• 1,072 Electronic components and accessories ........................ 5,315 Misc. electrlcal machinery and supplies ........•.............•• 7,875 Motor vehicles and equipment ............................•... . 5,519 Aircraft and parts ............................•.............. 25, 152 Other transportation equipment ....................•.......... 415 Scientific and controlllng Instruments ...••..••.......•....•..•. 717 oetlcal. ophthalmic. and photographic equipment ............... 305 M scenaneous manufacturing ................•................ 1,049 Transportation and warehousing •.....•••.•...•...•...•....... 0 Communications, except radio and TV .........••..•....•••...• 0 Radio and TV broadcasting ...•.............•......••...•.•... 0 Electric, gas, water, and sanitary services ...........•.... ; .... 0 Wholesale and retail trade ......•........•..•• , .......•....... 0 Finance and Insurance ..•.•.....•.............•...•....••..... 0 Real estate and rental ...••..•.•............................. 0 Hotels, personal and repair services exc. auto ........•......... 0 Business services ................................••......... 0 Eating and drinking places .........•........•.....••..•....... 0 Automobile repair and services ............................... 0 Amusements ...........................................•... 0 Medical, educ. services and nonprofit org ...................... 0 Federal Government enterprises ........•......•..•........•.. 0 State and local government enterprises ..•.........•........... 0
Total, all Industries .......................................... 95,238
Increase Reduction In In domestic Imports sa/es1
5,626 20, 167 1,556 5,514 1, 112 5, 106 1,053 7,051
486 1,830 3,428 7,676 1,745 5, 151 1, 192 5,276
2 1,252 20,608 29,991
154 3,900 1,359 7,671
586 3,135 912 1,565
4,044 7,990 660 4, 132
6,647 10,650 18,568 32,869 9,961 33,664
773 2,918 420 1,358 496 2,235
2,687 3,053 0 2,389 0 768 0 582 0 1,719 0 3,254 0 3,023 0 8,212 0 1, 104 0 9,453 0 14,488 0 1,223 0 647 0 2,938 0 1,700 0 0
117,257 478,222
Reduction In total sales Zero demand Unit demand elasticity elasticity
6,744 21,286 3,721 7,679 1,702 5,697 3, 128 9, 127
737 2,081 6, 156 10,404 2,744 6, 151 2,067 6, 151
193 1,443 44, 133 53,516
706 4,452 3,337 9,649 1, 143 3,691 1,271 1,924 5, 116 9,062 5,975 9,447
14,522 18,525 24,087 38,389 35, 113 58,818
1, 188 3,333 1, 138 2,075
801 2,540 3,736 4, 101
0 2,389 0 788 0 582 0 1,719 0 3,254 0 3,023 0 8,212 0 1, 104 0 9,453 0 14,488 0 1,223 0 647 0 2,936 0 1,700 0 0
212,495 573,460
1 Based on domestic demand elasticity of one. If the elastlclty equals zero, the reduction In domestl o sales 18 Identical to the decrease In Imports

t?1 I --
Table E-5 Effects of VRAs: Estimated percentage changes In U.S. exports, Imports, domestic sales, and total sales, by l11dustry, 1985
Inputoutput sector Industry description
01 Livestock and llvestock products ....................... . 02 Other agrlcultural products ............................ . 03 Forestry and fishery products ......................... . 04 Agricultural, forestry, and fishery services .............. . 05 Iron and ferroalloy ores mining ........................ .. 06 Nonferrous metal ores mining ......................... . 07 Coal mining ......................................... . 08 Crude petroleum and natural gas ...................... . 09 Stone and clay mining and quarrying .................... . 1 O Chemlcal and fertlllzer mineral mining .•...........•.....• 11 New construction .................................... . 12 Maintenance and repair construction ................... . 13 Ordnance and accessories ............................ . 14 Food and kindred products ............................ . 15 Tobacco manufactures ............................... . 16 Broad and narrow fabrics, yarn and thread mllls ......... . 17 Miscellaneous textlle goods and floor coverings .......... . 18 Apparel .........•................................... 19 Miscellaneous fabricated textlle products .........•.•.••.. 20 Lumber and wood products, except containers .......... . 21 Wood containers ..................................... . 22 Household furniture ............................•...... 23 Other furniture and fixtures .....................•...... 24 Paper and allled products, except containers .........•... 25 Paperboard containers and boxes .........••..••.......• 26 Printing and publlshlng ...............................•• 27 Chemicals and selected chemical products .•............. 28 Plastics and synthetic materials ............•............ 29 Drugs, cleaning and toilet preparations ................. . 30 Paints and allled products ..................•........... 31 Petroleum refining and related Industries ................ . 32 Rubber and miscellaneous plastic products .....•......... 33 Leather tanning and finishing ..............•............ 34 Footwear and other leather products ................... . 35 Glass and glass products ............................. . 36 Stone and clay products ..........................••... 37 Primary Iron and steel manufacturing .............•...... 38 Primary nonferrous metals manufacturing ............... . 39 Metal containers ..................................... . 40 Heating, plumbing, and structural metal products ..••..•.. 41 Screw machine products and stampings ................• 42 Other fabricated metal products ••.••......•.....•...... 43 Engines and turbines ..........................••••.•.. 44 Farm and garden machinery .................• · ......... . 45 Construction and mining machinery ............•......... 46 Materials handling machinery and equipment .......•....•.
Reduction In exports
0.013 0.019 0.008
0 0.053 0.027 0.016 0.028 0.026 0.053
0 0
0.018 0.010 0.017 0.010 0.006 0.011 0.017 0.021 0.043 0.103 0.008 0.047
0 0.066 0.019 0.024 0.043 0.023 0.029 0.016 0.014 0.013 0.013 0.255 0.027 0.074 0.188 0.046 0. 131 0.189 0.141 0.173 0.142 0.094
Increase In Imports
0.003 0.004 0.005 0.000 0.053 0.027 0.016 0 .. 028 0.026 0.053
0 0.000 0.009 0.004 0.008 0.010 0.006 0.020 0.017 0.022 0.047 0.614 0.047 0.017 0.007 0.025 0.019 0.022 0.043 0.021 0.029 0.050 0.031 0.030 0.027 0.563 0.046 0.273 0.282 0.227 0.131 0.299 0.141 0.173 0.142 0.094
Reduction In domestic sales Zero demand elasticity
0.000 0.000 0.000 0.000 0.016 0.006 0.000 0.009 0.003 0.018 0.000 0.000 0.000 0.000 0.000 0.001 0.001 0.006 0.001 0.002 0.005 0.116 0.002 0.002 0.000 0.000 0.002 0.001 0.002 0.000 0.002 0.004 0.008 0.035 0.003 0.048 0.008 0.057 0.007 0.005 0.004 0.036 0.026 0.027 0.017 0.019
Unit demand elasticity
0.006 0.009 0.006 0.040 0.049 0.024 0.013 0.027 0.022 0.051 0.035 0.039 0.015 0.004 0.007 0.008 0.005 0.010 0.014 0.014 0.035 0.202 0.010 0.013 0.005 0.018 0.012 0.013 0.027 0.013 0.019 0.012 0.014 0.039 0.018 0.205 0.028 0.262 0.191 0.228 0.131 0.163 0.140 0.170 0.138 0.093
Reduction In total sales Zero demand elasticity
0.000 0.005 0.000 0.000 0.026 0.007 0.003 0.009 0.005 0.026 0.000 0.000 0.001 0.001 0.001 0.001 0.001 0.006 0.002 0.004 0.006 0.118 0.002 0.005 0.000
. 0.001 0.005 0.004 0.004 0.001 0.002 0.005 0.010 0.036 0.003 0.053 0.009 0.064 0.008 0.006 0.005 0.043 0.069 0.047 0.061 0.029
Unit demand elasticity
0.006 0.013 0.007 0.040 0.060 0.026 0.016 0.027 0.024 0.059 0.035 0.039 0.016 0.004 0.007 0.008 0.005 0.010 0.014 0.016 0.036 0.204 0.010 0.016 0.005 0.018 0.015 0.017 0.029 0.013 0.019 0.012 0.016 0.039 0.019 0.210 0.029 0.269 0.192 0.229 0.132 0.170 0.183 0.190 0.181 0.103
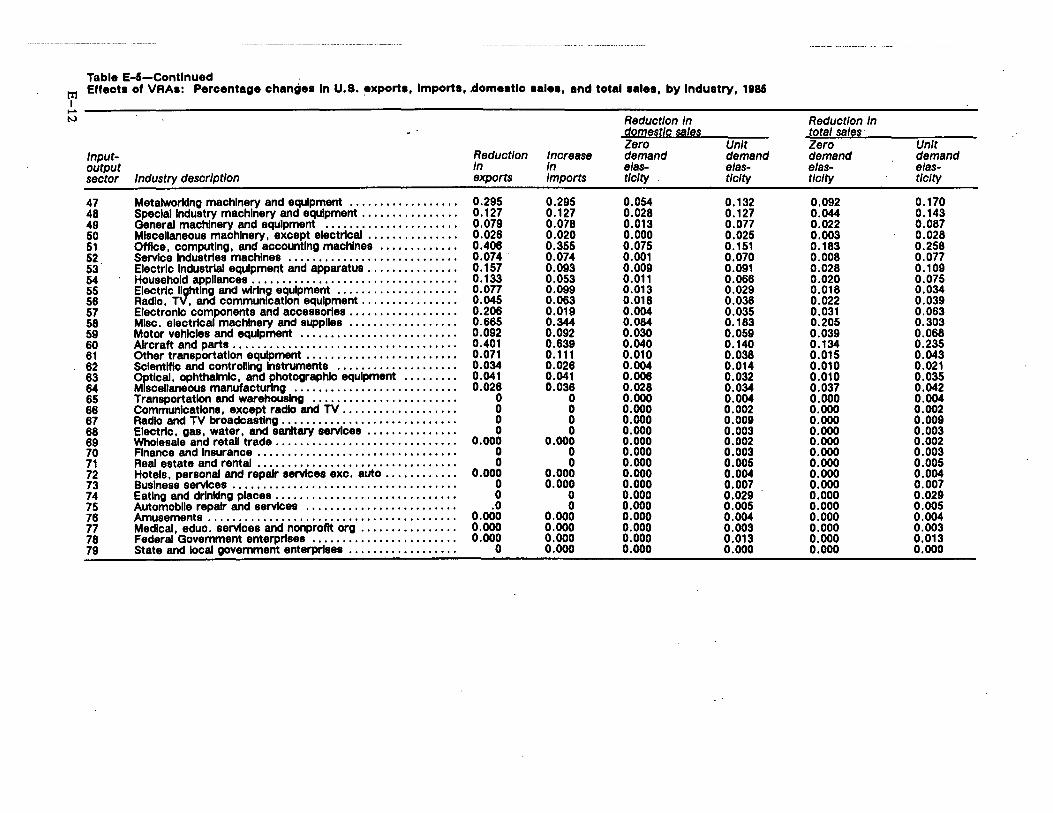
Table E-5-Contlnued tt1 Effect• of VRAa: Percentage changee In U.S. exports, Imports, .domestic sales, and total sales, by Industry, 1985 I
....... t-.) Reduction In Reduction In
domestlQ sales total sales · Zero Unit Zero Unit
Input- Reduction Increase demand demand demand demand output In In elas- elas- elas- elas-sector Industry description exports Imports tlclty tlclty ti city tlclty
47 Metalworklng machinery and equipment ....•............. 0.295 0.295 0.054 0.132 0.092 0.170 48 Special Industry machinery and equipment .•.•............ 0.127 0.127 0.028 0.127 0.044 0.143 49 General machinery and equipment ...................... 0.079 0.078 0.013 0.077 0.022 0.087 50 Mlscellaneous machinery, except electrical .........•...•. 0.026 0.020 0.000 0.025 0.003 0.028 51 Office, computing, and accounting machines ••........... 0.408 0.355 0.075 0.151 0.183 0.258 52 Service Industries machines .•..........•.....••..•....• 0.074 0.074 0.001 0.070 0.008 0.077 53 Electric Industrial equipment and apparatus ....•••....•.•. 0.157 0.093 0.009 0.091 0.028 0.109 54 Household :frpllances .....................•............ 0.133 0.053 0.011 0.066 0.020 0.075 55 Electric l~ht ng and wiring equipment .................... 0.077 0.099 0.013 0.029 0.018 0.034 56 Radio, T , and communication equipment ....••.......•.. 0.045 0.063 0.018 0.036 0.022 0.039 57 Electronic components and accessories •....•.....••..... 0.206 0.019 0.004 0.035 0.031 0.063 58 Misc. electrical machinery and supplles .................. 0.665 0.344 0.084 0.183 0.205 0.303 59 Motor vehicles and equipment .......................... 0.092 0.092 0.030 0.059 0.039 0.068 60 Aircraft and parts ..................................•.. 0.401 0.639 0.040 0.140 0.134 0.235 61 Other transportation equipment ..•............••.•..••.• 0.071 0.111 0.010 0.038 0.015 0.043 62 Scientific and controlllng Instruments .........•......••.. 0.034 0.026 0.004 0.014 0.010 0.021 63 octlcal, ophthalmic, and photographic equipment ......... 0.041 0.041 0.006 0.032 0.010 0.035 64 M scellaneous manufacturing ......•.................•.. 0.026 0.036 0.028 0.034 0.037 0.042 65 Transportation and warehousing ..............•......•.. 0 0 0.000 0.004 0.000 0.004 66 Communications, except radio and TV .......•...•....... 0 0 0.000 0.002 0.000 0.002 67 Radio and TV broadcasting ............•....••...•...•.. 0 0 0.000 0.009 0.000 0.009 68 Electric, gas, water, and sanitary services ...••.••....... 0 0 0.000 0.003 0.000 0.003 69 Wholesale and retail trade ......................••...... 0.000 0.000 0.000 0.002 0.000 0.002 70 Finance and Insurance ...............•.•....•.••..••••. 0 0 0.000 0.003 0.000 0.003 71 Real estate and rental .•.................••....••...... 0 0 0.000 0.005 0.000 0.005 72 Hotels, personal and repair services exc. auto ••.......... 0.000 0.000 0.000 0.004 0.000 0.004 73 Business services ..•......................•...•..•.... 0 0.000 0.000 0.007 0.000 0.007 74 Eating and drinking places ............•....••......•..•• 0 0 0.000 0.029 0.000 0.029 75 Automobile repair and services ................•.•...•.. .0 0 0.000 0.005 0.000 0.005 76 Amusements .................................•..•.... 0.000 0.000 0.000 0.004 0.000 0.004 77 Medical, educ. services and nonprofit org ..•........•.... 0.000 0.000 0.000 0.003 0.000 0.003 78 Federal Government enterprises ...••.....••....•••....• 0.000 0.000 0.000 0.013 0.000 0.013 79 State and local government enterprtsee ....•.•.••.•.•.••. 0 0.000 0.000 0.000 0.000 0.000

Table E-8 Effect• of VRA•: Eatlmated percen1age change• In U.S. export•, Import•, domeatlc 11alea, and total aalea, by Industry, 1881
Reduction In Reduction In domestic §1!/e~ tot§!/ sal~~ Zero Unit Zero Unit
Input- Reduction Increase demand demand demand demand output In In etas- etas- etas- etas-sector Industry description exports Imports tlclty tlclty tlclty tlclty
01 Livestock and llvestock products ........................ 0.033 0.006 0.000 0.016 0.000 0.016 02 Other agrlcultural products ..........................••. 0.048 0.010 0.002 0.021 0.012 0.032 03 Forestry and fishery products .......................... 0.020 0.012 0.001 0.016 0.001 0.017 04 Agrlcultural, forestry, and fishery services ............... 0 0.000 0.000 0.102 0.000 0.102 05 Iron and ferroalloy ores mining .......................... 0.134 0.134 0.039 0.125 0.060 0.146 06 Nonferrous metal ores mining .......................... 0.069 0.069 0.018 0.063 0.027 0.072 07 Coal mining .......................................... 0.041 0.041 0.000 0.034 0.007 0.041 08 Crude petroleum and natural gas ....................... 0.071 0.071 0.031 0.072 0.032 0.072 09 Stone and clay mining and quarrying ..................... 0.066 0.065 0.011 0.057 0.017 0.063 10 Chemical and fertlllzer mineral mining ..................•. 0.136 0.135 0.039 0.126 0.059 0.146 11 New construction ..................................... 0 0 0.000 0.088 0.000 0.088 12 Maintenance and repair construction .................... 0 0.000 0.000 0.100 0.000 0.100 13 Ordnance and accessories ............................. 0.047 0.023 0.000 0.039 0.003 0.041 14 Food and kindred products ............................. 0:026 0.011 0.001 0.010 0.002 0.011 15 Tobacco manufactures •••......•...................... 0.044 0.020 0.000 0.017 0.003 0.019 16 Broad and narrow fabrics, yam and thread mllls .......... 0.025 0.025 0.002 0.020 0.002 0.020 17 Miscellaneous textlle goods and floor coverings ...••...... 0.015 0.015 0.002 0.013 0.003 0.013 18 Apparel ............................................. 0.028 0.052 0.016 0.027 0.017 0.027 19 Miscellaneous fabricated textlle products ................. 0.044 0.044 0.004 0.035 0.005 0.036 20 Lumber and wood products, except containers ........... 0.054 0.055 0.005 0.035 0.011 0.040 21 Wood containers ....•............•.................... 0.117 0.121 0.013 0.089 0.016 0.092 22 Household furniture ................................... 0.260 1.561 0.332 0.547 0.337 0.551 23 Other furniture and fixtures ..................•......... 0.020 0.120 0.006 0.025 0.006 0.025 24 Paper and allled products, except containers ....•........ 0.118 0.044 0.005 0.033 0.012 0.040 25 Paperboard containers and boxes .....................•. 0 0.019 0.000 0.013 0.000 0.013 26 Printing and publlshlng ................................. 0.168 0.063 0.001 0.045 0.003 0.047 27 Chemicals and selected chemical products ............... 0.047 0.047 0.005 0.031 0.012 0.038 28 Plastics and synthetic materials ......................... 0.061 0.055 0.003 0.034 0.010 0.042 29 Drugs, cleaning and tollet preparations .................. 0.109 0.109 0.005 0.068 0.011 0.075 30 Paints and allled products .............................. 0.059 0.053 0.001 0.032 0.002 0.033 31 Petroleum refining and related Industries ................. 0.075 0.075 0.004 0.047 0.006 0.049 32 Rubber and miscellaneous plastic products ............... 0.040 0.128 0.011 0.030 0.012 0.032 33 Leather tanning and finishing ........................... 0.036 0.018 0.021 0.036 0.028 0.043 34 Footwear and other leather products .................... 0.035 0.076 0.110 0.117 0.111 0.119 35 Glass and glass products .....•........................ 0.034 0.068 0.007 0.046 0.009 0.047 36 Stone and clay products ............................... 0.649 1.433 0.129 0.527 0.142 0.539 37 Primary Iron and steel manufacturing ••.................. 0.069 0.118 0.021 0.071 0.023 0.073 38 Primary nonferrous metals manufacturing ••..•••......... 0.189 0.694 0.197 0.688 0.216 0.707 39 Metal containers ....................................•. 0.478 0.718 0.008 0.481 0.012 0.488 40 Heating, plumbing, and structural metal products ......... 0.116 0.579 0.014 0.579 0.016 0.581 41 Screw machine products and stampings ................. 0.334 0.333 0.011 0.334 0.014 0.337 42 Other fabricated metal products ........................ 0.481 0.760 0.099 0.419 0.117 0.437 43 Engines and turbines ..............................•.•. 0.359 0.359 0.082 0.361 0.195 0.474 44 Farm and garden machinery ............................ 0.441 0.441 0.078 0.435 0.123 0.480 45 Construction and mining machinery ...................... 0.361 0.361 0.050 0.352 0.147 0.448 46 Materials handllng machinery and equipment .............. 0.238 0.238 0.063 0.242 0.088 0.267
tr1 I
....... w
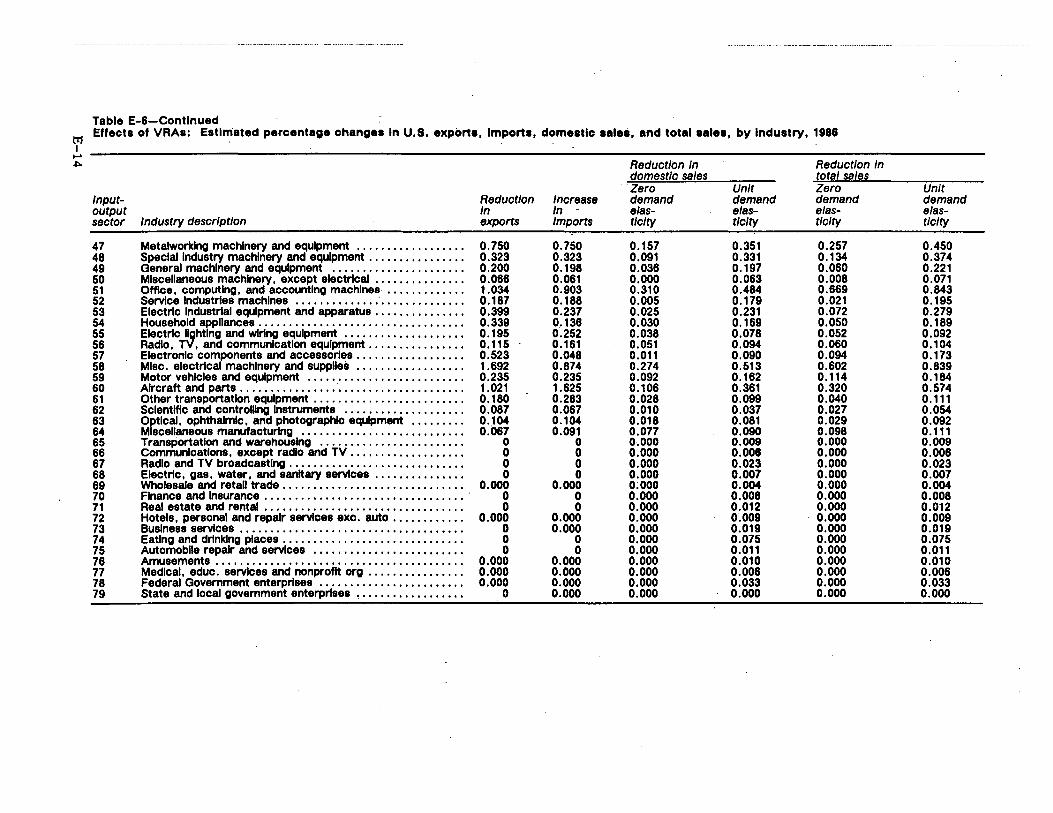
Table E-6-Contlnued t?1 Effects of VRAa: Estimated percentage changes In U.S. export•, Imports, domestic aalea, and total aalea, by Industry, 1986 I ......
""' Reduction In Reduction In domestic sales total sales
·zero Unit Zero Unit Input- Reduction Increase demand demand demand demand output In In - elas- etas- elas- etas-sector Industry description exports Imports tlclty tlclty ti city ti city
47 Metalworklng machinery and equipment ..........•....... 0.750 0.750 0.157 0.351 0.257 0.450 48 Speclal Industry machinery and equipment ................ 0.323 0.323 0.091 0.331 0.134 0.374 49 General machinery and equipment ...................... 0.200 0.198 0.036 0.197 0.060 0.221 50 Miscellaneous machinery, except electrical .......•....... 0.066 0.061 0.000 0.063 0.008 0.071 51 Office, computing, and accounting machines .....•....... 1.034 0.903 0.310 0.484 0.669 0.843 52 Service Industries machines ............. : .........••... 0.187 0.188 0.005 0.179 0.021 0.195 53 Electric Industrial equipment and apparatus ...........•... 0.399 0.237 0.025 0.231 0.072 0.279 54 Household appliances ............................•..... 0.339 0 .. 136 0.030 0.169 0.050 0.189 55 Electrlc l~htlng and wiring equipment .................... 0.195 0.252 0.038 0.078 0.052 0.092 56 Radio. T , and communication equipment ...•........•... 0.115 0.161 0.051 0.094 0.060 0.104 57 Electronlc components and accessories .............•.... 0.523 0.048 0.011 0.090 0.094 0.173 58 Misc. electrical machinery and supplies .................. 1.692 0.874 0.274 0.513 0.602 0.839 59 Motor vehicles and equipment ....................••...• 0.235 0.235 0.092 0.162 0.114 0.184 60 Aircraft and parts ................ · ..........••........• 1.021 1.625 0.106 0.361 0.320 0.574 61 Other transportation equipment ...............•......... 0.180 0.283 0.028 0.099 0.040 0.111 62 Scientific and controlUng Instruments .................... 0.087 0.067 0.010 0.037 0.027 0.054 63 octlcal. ophthalmic. and photographic equipment ......... O.HM 0.104 0.018 0.081 0.029 0.092 64 M scellaneous manufacturing ..........•.....•.....•.... 0.067 0.091 0.077 0.090 0.098 0.111 65 Transportation and warehousing ........................ 0 0 0.000 0.009 0.000 0.009 66 Communications, except radio and TV •.•....... , ...••... 0 0 0.000 0.008 0.000 0.008 67 Radio and TV broadcasting ............................. 0 0 0.000 0.023 0.000 0.023 68 Electric, gas, water, and sanitary services ....••....••... 0 0 0.000 0.007 0.000 0.007 69 Wholesale and retaU trade .............................. 0.000 0.000 O;OOO 0.004 0.000 0.004 70 Finance and Insurance ...........•••.•....••.••...•..•. · 0 0 0.000 0.008 0.000 0.008 71 Real estate and rental ...........•.•......•..........•. 0 0 0.000 0.012 0.000 0.012 72 Hotels, personal and repair services exc. auto ..•....••••. 0.000 0.000 0.000 0.009 0.000 0.009 73 Business services .............................•...•••. 0 0.000 0.000 0.019 0.000 0.019 74 Eating and drinking places .........•....••....•••....•.• 0 0 0.000 0.075 0.000 0.075 75 Automobile repair and services ..........•....•• , •.••... 0 0 0.000 0.011 0.000 0.011 76 Amusements ............•..................••••...... 0.000 0.000 0.000 0.010 0.000 0.010 77 Medical, educ. services and nonprofit org ......•....••... 0.000 0.000 0.000 0.006 0.000 0.006 78 Federal Government enterprises ..............•.•..•••.. 0.000 0.000 0.000 0.033 0.000 0.033 79 State and local government enterprises , ........••....•.. 0 0.000 0.000 0.000 0.000 0.000
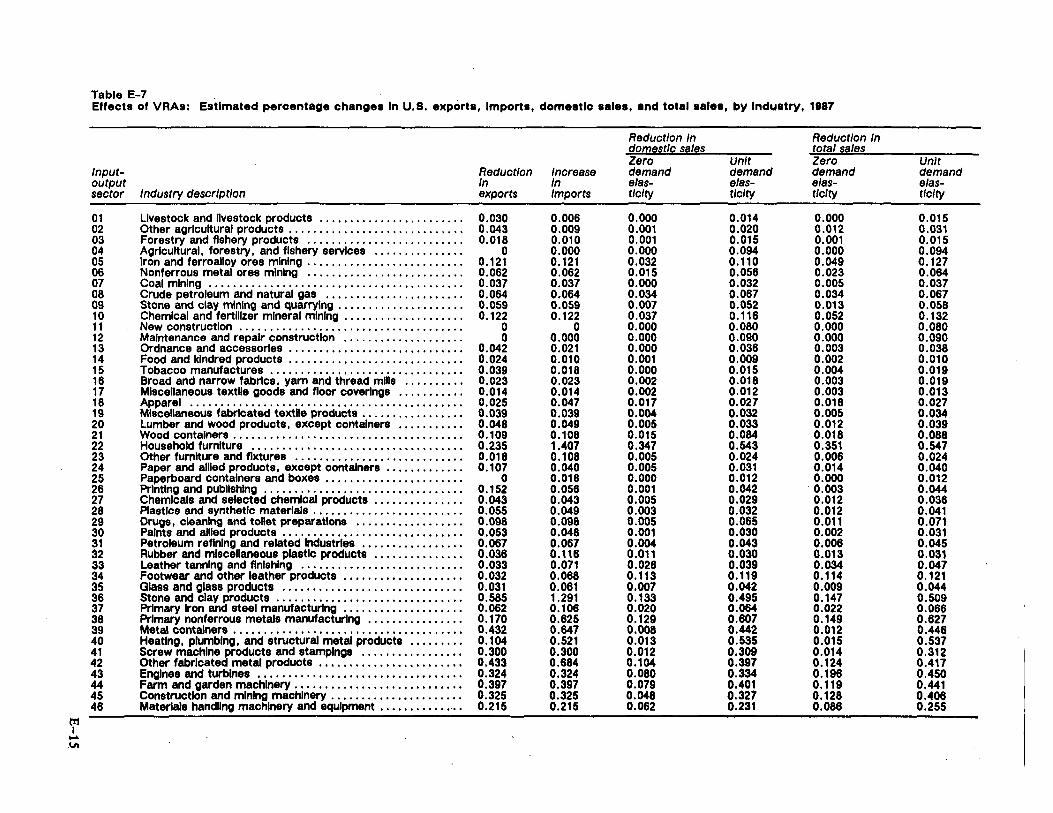
Table E-7 Effects of VRAs: Estimated percentage changes In U.S. export•, Imports, domestic sales, and total sales, by Industry, 1987
Reduction In Reduction In domestic sales total sales Zero Unit Zero Unit
Input- Reduction Increase demand demand demand demand output In In elas- elas- elas- elas-sector Industry description exports Imports ti city tlclty tlclty tlclty
01 Livestock and llvestock products ........................ 0.030 0.006 0.000 0.014 0.000 0.015 02 Other agrlcultural products .........................•... 0.043 0.009 0.001 0.020 0.012 0.031 03 Forestry and fishery products .......................... 0.018 0.010 0.001 0.015 0.001 0.015 04 Agrlcultural, forestry, and fishery services ............... 0 0.000 0.000 0.094 0.000 0.094 05 Iron and ferroalloy ores mining .......................... 0.121 0.121 0.032 0.110 0.049 0.127 06 Nonferrous metal ores mining .......................... 0.062 0.062 0.015 0.058 0.023 0.064 07 Coal mining .......................................... 0.037 0.037 0.000 0.032 0.005 0.037 08 Crude petroleum and natural gas ....................... 0.064 0.064 0.034 0.067 0.034 0.067 09 Stone and clay mining and quarrying ..................... 0.059 0.059 0.007 0.052 0.013 0.058 10 Chemical and fertilizer mineral mining .................... 0.122 0.122 0.037 0.116 0.052 0.132 11 New construction ..................................... 0 0 0.000 0.080 0.000 0.080 12 Maintenance and repair construction .................... 0 0.000 0.000 0.090 0.000 0.090 13 Ordnance and accessories ..................•.........• 0.042 0.021 0.000 0.036 0.003 0.038 14 Food and kindred products ............................. 0.024 0.010 0.001 0.009 0.002 0.010 15 Tobacco manufactures ................................ 0.039 0.018 0.000 0.015 0.004 0.019 16 Broad and narrow fabrics, yam and thread mllls .......... 0.023 0.023 0.002 0.018 0.003 0.019 17 Mlscellaneous textlle goods and floor coverings .....•..... 0.014 0.014 0.002 0.012 0.003 0.013 18 Apparel ...................................•.•..•.... 0.025 0.047 0.017 0.027 0.018 0.027 19 Miscellaneous fabricated textile products ................. 0.039 0.039 0.004 0.032 0.005 0.034 20 Lumber and wood products, except containers ..........• 0.048 0.049 0.005 0.033 0.012 0.039 21 Wood containers ..................•...........•....... 0.109 0.108 0.015 0.084 0.018 0.088 22 Household furniture ...............•....••••.••••••••.. 0.235 1.407 0.347 0.543 0.351 0.547 23 Other furniture and fixtures ............................ 0.018 0.108 0.005 0.024 0.006 0.024 24 Paper and allied products, except containers ............• 0.107 0.040 0.005 0.031 0.014 0.040 25 Paperboard containers and boxes ....•••.........•...... 0 0.018 0.000 0.012 0.000 0.012 26 Printing and publishing .......................•....•.••. 0.152 0.056 0.001 0.042 . 0.003 0.044 27 Chemicals and selected chemical products ...........••.. 0.043 0.043 0.005 0.029 0.012 0.038 28 Plastics and synthetic materials ......................... 0.055 0.049 0.003 0.032 0.012 0.041 29 Drugs, cleaning and tollet preparations .................. 0.098 0.098 0.005 0.065 0.011 0.071 30 Paints and allied products ••••....•••...•••...••.••••... 0.053 0.048 0.001 0.030 0.002 0.031 31 Petroleum refining and related Industries .••....•....•.... 0.067 0.067 0.004 0.043 0.008 0.045 32 Rubber and mlscellaneous plastic products •......••••.... 0.036 0.116 0.011 0.030 0.013 0.031 33 Leather tanning and finishing ........................... 0.033 0.071 0.028 0.039 0.034 0.047 34 Footwear and other leather products .••••..•.••.•.•.•.•• 0.032 0.068 0.113 0.119 0.114 0.121 35 Glass and glass products .............................. 0.031 0.061 0.007 0.042 0.009 0.044 36 Stone and clay products ...................•.......•..• 0.585 1.291 0.133 0.495 0.147 0.509 37 Primary Iron and steel manufacturing ............•••....• 0.062 0.108 0.020 0.064 0.022 0.066 38 Primary nonferrous metals manufacturing ........•••..... 0.170 0.625 0.129 0.607 0.149 0.627 39 Metal containers .••••.....•............••..•••.....•.. 0.432 0.647 0.008 0.442 0.012 0.446 40 Heating, plumbing, and structural metal products .....••.. 0.104 0.521 0.013 0.535 0.015 0.537 41 Screw machine products and stampings ........••.....•. 0.300 0.300 0.012 0.309 0.014 0.312 42 Other fabricated metal products ........................ 0.433 0.684 0.104 0.397 0.124 0.417 43 Engines and turbines •.....•...•....•...•.••....••.••.. 0.324 0.324 0.080 0.334 0.196 0.450 44 Farm and garden machinery ..............•.........••.• 0.397 0.397 0.079 0.401 0.119 0.441 45 Construction and mining machinery ..•.........•...••.... 0.325 0.325 0.048 0.327 0.128 0.406 46 Materials handllng machinery and equipment ..•.....••••.• 0.215 0.215 0.062 0.231 0.088 0.255
l:ll I .....
. v.
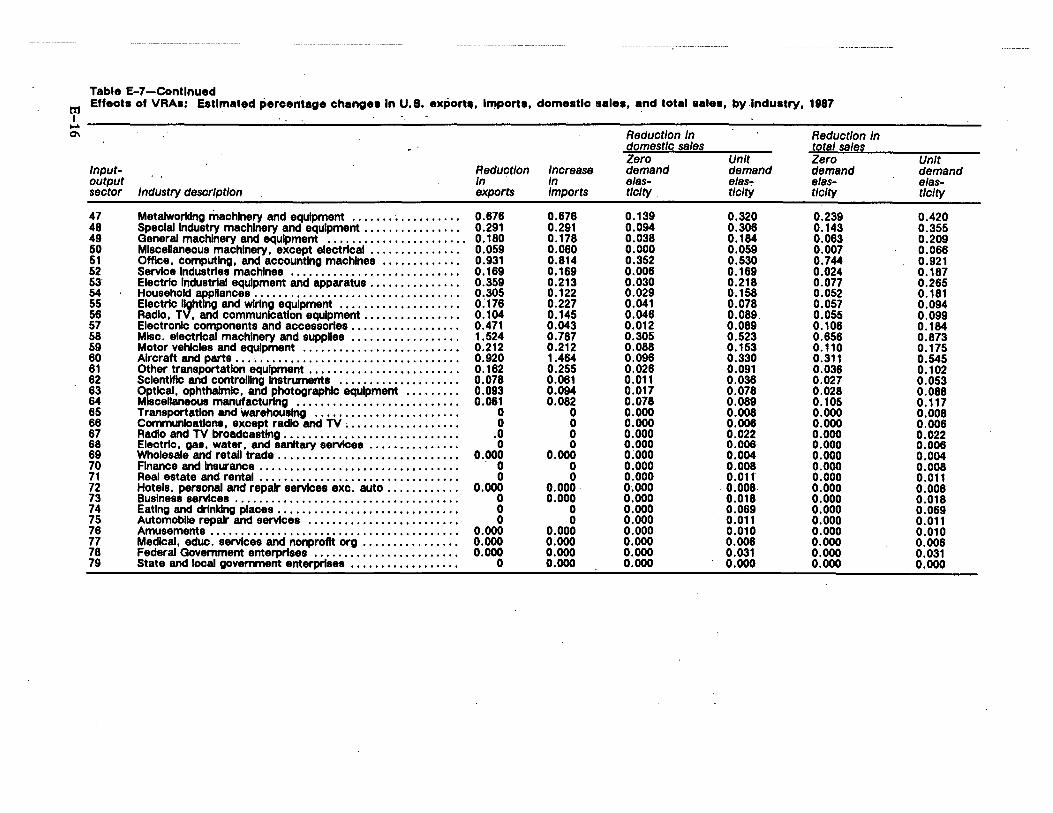
Table E-7-Contlnued tt1 Effects of VRAa: Estimated percentage changes In U.S. export~. Imports, domestic sales, and total sales, by.Industry, 1987 I ...... 0\ Reduction In Reduction In
domestic sales tg_tal sales Zero Unit Zero Unit
Input- . ' Reduction Increase demand demand demand demand
output In In elas- alas":' e/as- elas-sector Industry description exports Imports tlclty . tlclty tlclty ti city
47 Metalwortclng machinery and equipment ....... ~.......... 0.676 0.676 0.139 0.320 0.239 0.420 48 Speclal Industry machinery and equipment • • . . . . . • • . . . • . • . 0.291 0.291 0.094 0.306 0.143 0.355 49 General machinery and equipment . . . • . . . . . . . . . . . . . . . . . . . 0. 180 0.178 0.038 0.184 0.063 0.209 50 Mlscellaneous machinery, except electrlcal . . . . . . . . . . . . . . . O. 059 0.060 0.000 0.059 0.007 0.066 51 Office, computing, and accounting machines . . . . . . . . . . . . . 0.931 0.814 0.352 0.530 0.744 0.921 52 Service Industries machines . . . . • . . . • . . . . . . • . . . . . . . . • . . • 0. 169 0.169 0.006 0.169 0.024 0.187 53· Electrlc Industrial equipment and apparatus ..•............ 0.359 0.213 0.030 0.218 0.077 0.265 54 Household :,pnances .....................•....•...•... 0.305 0.122 0.029 0.158 0.052 0.181 55 Electrlc~ ng and wiring equipment .••.....•..•........ 0:116 0.227 0.041 0.078 0.057 0.094 56 Radio, , and communication equipment ..•....•....•... 0.104 0.145 0.046 0.089. 0.055 0.099 57 Electronic components and accessories .........•........ 0.471 0.043 0.012 0.089 0.106 0.184 58 Misc. electrical machinery and supplles ........••........ 1.524 0.787 0.305 0.523 0.656 0.873 59 Motor vehlcles and equipment ......•.........•....•...• 0.212 0.212 0.088 0.153 0.110 0.175 60 Aircraft and parts ... ·, ...........•.....•......•...••..• 0.920 1.464 0.096 0.330 0.311 0.545 61 Other transportation equipment ..••...........••...•..•. 0.162 0.255 0.026 0.091 0.036 0.102 62 Scientific and controlllng Instruments .•.......•...•.•.... 0.078 0.061 0.011 0.036 0.027 0.053 63 octlcal, ophthalmic, and photographic equipment ......... 0.093 0.094 0.017 0.078 0.028 0.088 64 M sceHaneous manufacturing ........•...•....••...••... 0.061 0.082 0.078 0.089 0.105 0.117 65 Transportation and warehousing ..........•...••........ 0 0 0.000 0.008 0.000 0.008 68 Communications, except radio and TV ~ ............•..••• 0 0 0.000 0.006 0.000 0.006 67 Radio and TV broadcasting ............................. .0 0 0.000 0.022 0.000 0.022 68 Electric, gas, water, and sanitary services .........•...•. 0 0 0.000 0.008 0.000 0.006 69 Wholesale and retall trade ...............•.•.••..•.•..•• 0.000 0.000 0.000 0.004 0.000 0.004 70 Finance and Insurance .......•.••.•....•••..••...•..••. 0 0 0.000 0.008 0.000 0.008 71 Real estate and rental ....•............••....•...•..••. 0 0 0.000 0.011 0.000 0.011 72 Hotels. personal and repair services exc. auto ..••...•.... 0.000 0.000. 0.000 0.009. 0.000 0.008 73 Business services ...........•.•.......•....••..•...•.. 0 0.000 0.000 0.018 0.000 0.018 74 Eating and drinking places .....•..•.....•.•..••..••..••• 0 0 0.000 0.069 0.000 0.069 75 Automoblle repair and services ......••.••...•••....•••• 0 0 0.000 0.011 0.000 0.011 76 Amusements .........•....................•...•...... 0.000 0.000 0.000 0.010 0.000 0.010 77 Medical, educ. services and nonprofit org ....••..••....•. 0.000 0.000 0.000 0.006 0.000 0.006 78 Federal Government enterprises ............•...••...... 0.000 0.000 0.000 0.031 0.000 0.031 79 State and local government enterprises ••..••••..•..••... 0 0.000 0.000 0.000 0.000 0.000
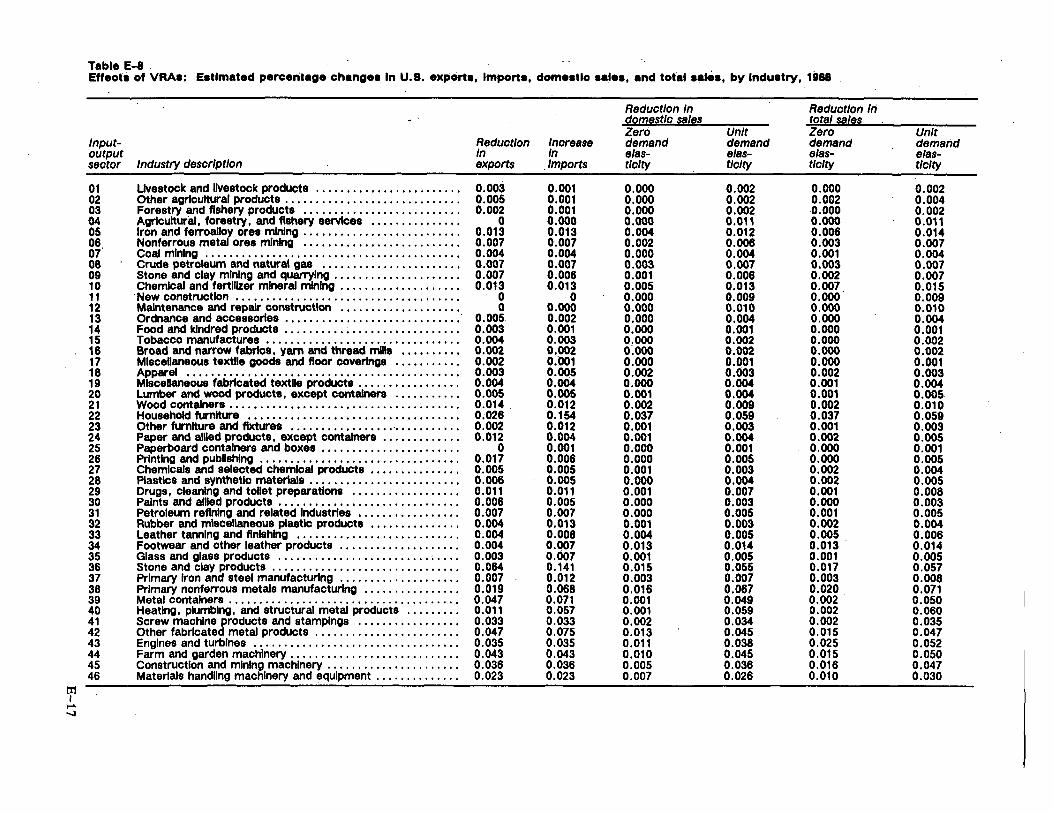
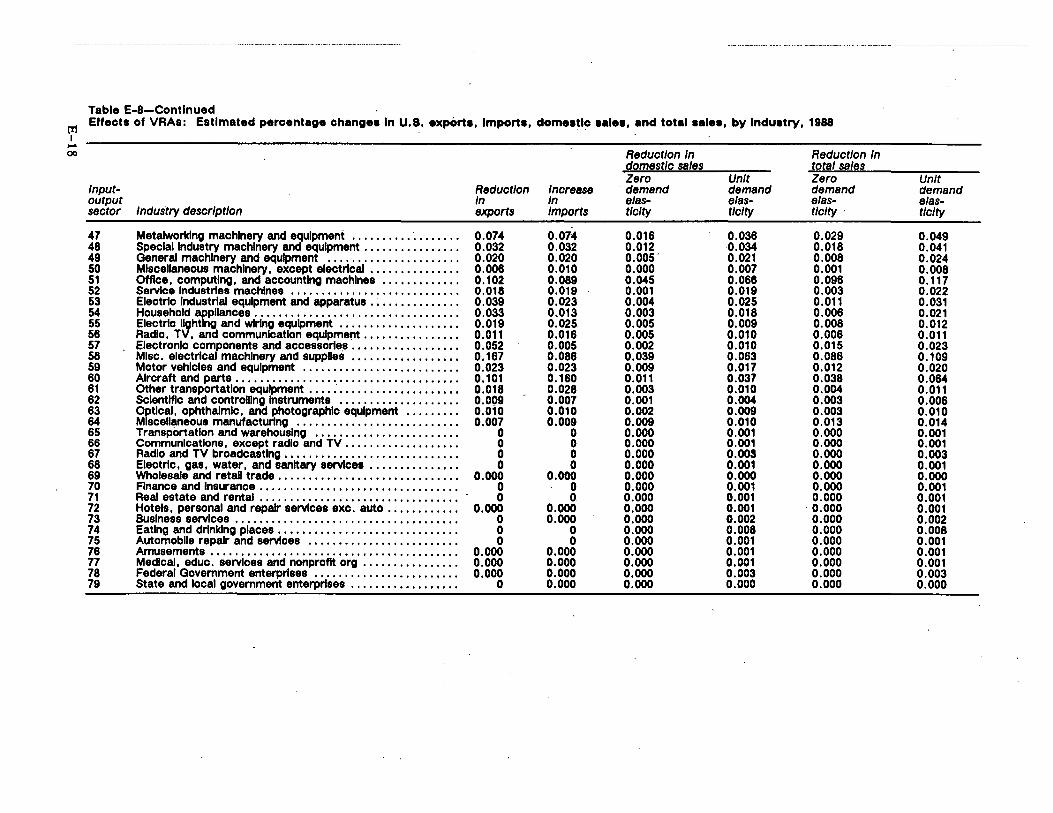
Table E-8-Contlnued
tr1 Effects of VRAs: Estimated percentage changes In U.S. exports, Imports, domestic sates, •nd tot•I aates, by Industry, 1988
I .... 00 Reduction In Reduction In
domestic yles total sales Zero Unit Zero Unit
Input- Reduction Increase demand demand demand demand output In In elas- elas- elas- etas-sector Industry description exports Imports tlclty tlclty tlclty · ti city
47 Metatworklng machinery and equipment ..•...•.....•••..• 0.074 0.074 0.016 0.036 0.029 0.049 48 Speclal Industry machinery and equipment •....•.......... 0.032 0.032 0.012 0.034 0.018 0.041 49 General machinery and equipment ...................... 0.020 0.020 0.005- 0.021 0.008 0.024 50 Mlscellaneous machinery. except electrical ...•......•••.. 0.006 0.010 0.000 0.007 0.001 0.008 51 Office, computing. and accounting machines .......•..... 0.102 0.089 0.045 0.0615 0.096 0.117 52 Service Industries machines ............................ 0.018 0.019 0.001 0.019 0.003 0.022 53 Electric Industrial equipment and apparatus . : .......•..... 0.039 0.023 0.004 0.025 0.011 0.031 54 Household =llancee ......................•...•....... 0.033 0.013 0.003 0.018 0.006 0.021 55 Electric ~ht g and wiring equipment .•.................. 0.019 0.025 0.005 0.009 0.008 0.012 56 Radio, T , and communication equipment ..••....•......• 0.011 0.016 0.005 0.010 0.006 0.011 57 Electronic components and accessorle~ ..•..•......•..... 0.052 0.005 0.002 0.010 0.015 0.023 58 Misc. electrical machinery and supplies .•.......•....•••• 0.167 0.086 0.039 0.063 0.086 0.109 59 Motor vehlcles and equipment .......................•.• 0.023 0.023 0.009 0.017 0.012 0.020 60 Aircraft and parts ...•......•......•.......... , ••••.... 0.101 0.160 0.011 0.037 0.038 0.064 61 Other transportation equipment ......••.....•......•.... 0.018 0.028 0.003 0.010 0.004 0.011 62 Scientific and controlling Instruments .................•.. 0.009 0.007 0.001 0.004 0.003 0.006 63 octtcal, ophthalmic, and photographic equipment ......... 0.010 0.010 0.002 0.009 0.003 0.010 64 M scellaneous manufacturing ...............•.•.....•••. 0.007 0.009 0.009 0.010 0.013 0.014 65 Transportation and warehousing ....................•••• 0 0 0.000 0.001 0.000 0.001 66 Communications, except radio and TV ....•....•.....••.. 0 0 0.000 0.001 0.000 0.001 67 Radio and TV broadcasting .........•...••.•..••......•• 0 0 0.000 0.003 0.000 0.003 68 Electric, gas, water, and sanitary services •...•••....•.•. 0 0 0.000 0.001 0.000 0.001 69 Wholesale and retall trade ..•....••.......•....•.•....•• 0.000 0.000 0.000 0.000 0.000 0.000 70 Finance and Insurance ••.•.....•.•••..•..•..•..••.... , . 0 0 0.000 0.001 0.000 0.001 71 Real estate and rental ..•..•.....•..... , .••.. , ..•.•.... 0 0 0.000 0.001 0.000 0.001 72 Hotels, personal and repair services exc. auto .•...••..... 0.000 0.000 0.000 0.001 . 0.000 0.001 73 Business services .•........•..............•......•••.. 0 0.000 0.000 0.002 0.000 0.002 74 Eating and drinking places ..••......•.......••.. , .•.••.. 0 0 0.000 0.008 0.000 0.008 75 Automobile repair and services ................ , ....••.. 0 0 0.000 0.001 0.000 0.001 76 Amusements ..........•.•.....•..••...............••• 0.000 0.000 0.000 0.001 0.000 0.001 77 Medical, educ. services and nonprofit org .......••..••.•. 0.000 0.000 0.000 0.001 0.000 0.001 78 Federal Government enterprises ................••..•... 0.000 0.000 0.000 0.003 0.000 0.003 79 State and local government enterprises .......•••••••• , .• 0 0.000 0.000 0.000 0.000 0.000
APPENDIX F U.S. APPARENT CONSUMPTION, PRODUCERS' SHIPMENTS, EXPORTS, AND IMPORTS: OF CERTAIN STEEL MILL AND. FABRICATED STEEL PRODUCTS

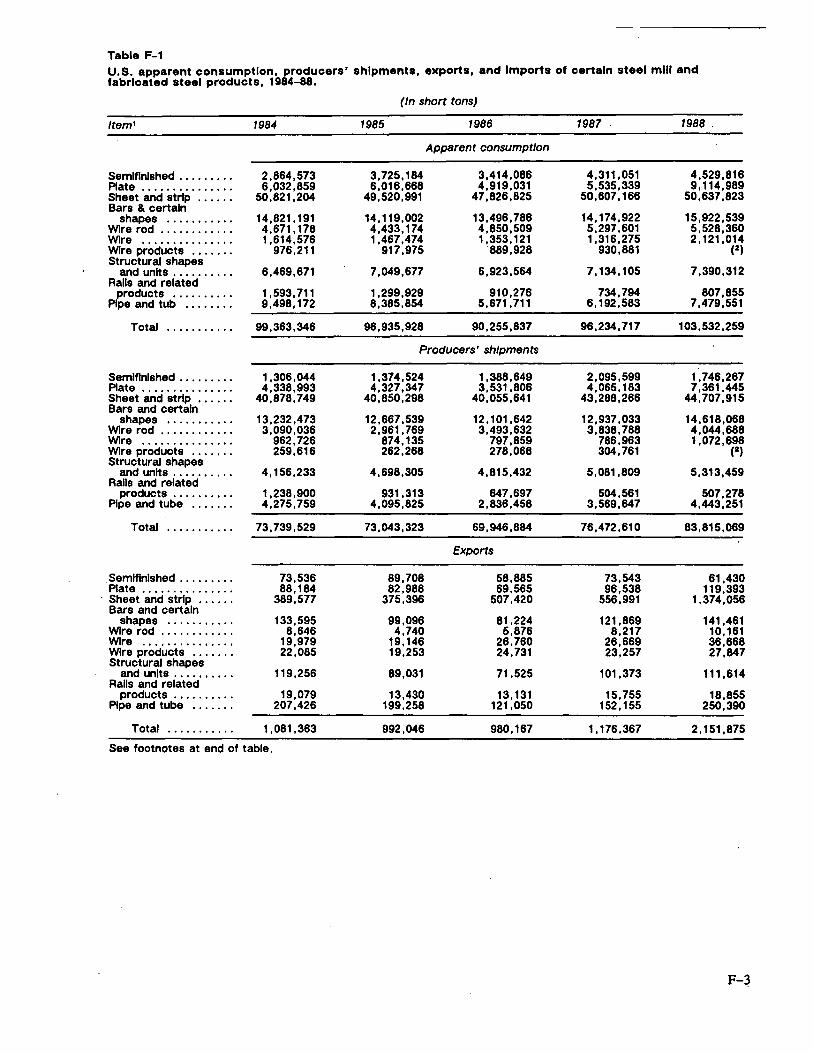
Table F-1 U.S. apparent consumption, producers' shipments, exports, and Imports of certain steel mlll and fabricated steel products, 1984-88.
(In short tons)
Item' 1984 1985 1986 1987 1988 .
Apparent consumption
Semlflnlshed ......... 2,864,573 3,725, 184 3,414,086 4,311,051 4,529,816 Plate ...•........... 6,032,859 6,016,668 4,919,031 5,535,339 9, 114,989 Sheet and strip ...... 50,821,204 49,520,991 47,826,825 50,607, 166 50,637,823 Bars & certain
shapes ........... 14,821, 191 14, 119,002 13,496,786 14, 174,922 15,922,539 Wire rod ............ 4,671, 178 4,433, 174 4,850,509 5,297,601 5,528,360 Wire o o 0 o 0 0 o o o o 0 0 0 I 0 1,614,576 1,467,474 1,353, 121 1,316,275 2,121,014 Wire products ....... 976,211 917,975 ·889,928 930,881 (2) Structural shapes
and units .......... 6,469,671 7,049,677 6,923,564 7, 134.105 7,390,312 Ralls and related
products .......... 1,593, 711 1,299,929 910,276 734,794 807,855 Pipe and tub ........ 9,498, 172 8,385,854 5,671,711 6, 192,583 7,479,551
Total o o o o o o I 0 o 0 0 99,363,346 96,935,928 90,255,837 96,234,717 103,532,259
Producers' shipments
Semlflnlshed ......... 1,306,044 1,374,524 1,388,649 2,095,599 1,746,267 Plate ............... 4,338,993 4,327,347 3,531,806 4,065, 183 7,361,445 Sheet and strip ...... 40,878,749 40,850,298 40,055,641 43,288,266 44,707,915 Bars and certain
shapes ........... 13,232,473 12,667,539 12, 101,642 12,937,033 14,618,068 Wire rod ............ 3,090,036 2,961,769 3,493,632 3,838,788 4,044,688 Wire ............... 962,726 874, 135 797,859 786,963 1,072,698 Wire products ....... 259,616 262,268 278,068 304,761 (2) Structural shapes
and units .......... 4, 156,233 4,698,305 4,815,432 5,081,809 5,313,459 Ralls and related
products .......... 1,238,900 931,313 647,697 504,561 507,278 Pipe and tube ....... 4,275,759 4,095,825 2,836,458 3,569,647 4,443,251
Total ........... 73,739,529 73,043,323 69,946,884 76,472,610 83,815,069
Exports
Semlflnlshed ......... 73,536 89,708 58,885 73,543 61,430 Plate ............... 88, 184 82,988 69,565 96,538 119,393
· Sheet and strip ...... 389,577 375,396 507,420 556,991 1,374,056 Bars and certain
shapes ........... 133,595 99,096 81,224 121,869 141,461 Wire rod ............ 8,646 4,740 5,876 8,217 10, 161 Wire ............... 19,979 19, 146 26,760 26,669 36,668 Wire products ....... 22,085 19,253 24,731 23,257 27,847 Structural shapes
and units .......... 119,256 89,031 71.525 101,373 111,614 Ralls and related
products .......... 19,079 13,430 13.131 15,755 18,855 Pipe and tube ....... 207,426 199,258 121,050 152, 155 250,390
Total ........... 1,081,363 992,046 980, 167 1, 176,367 2, 151,875
See footnotes at end of table.
F-3
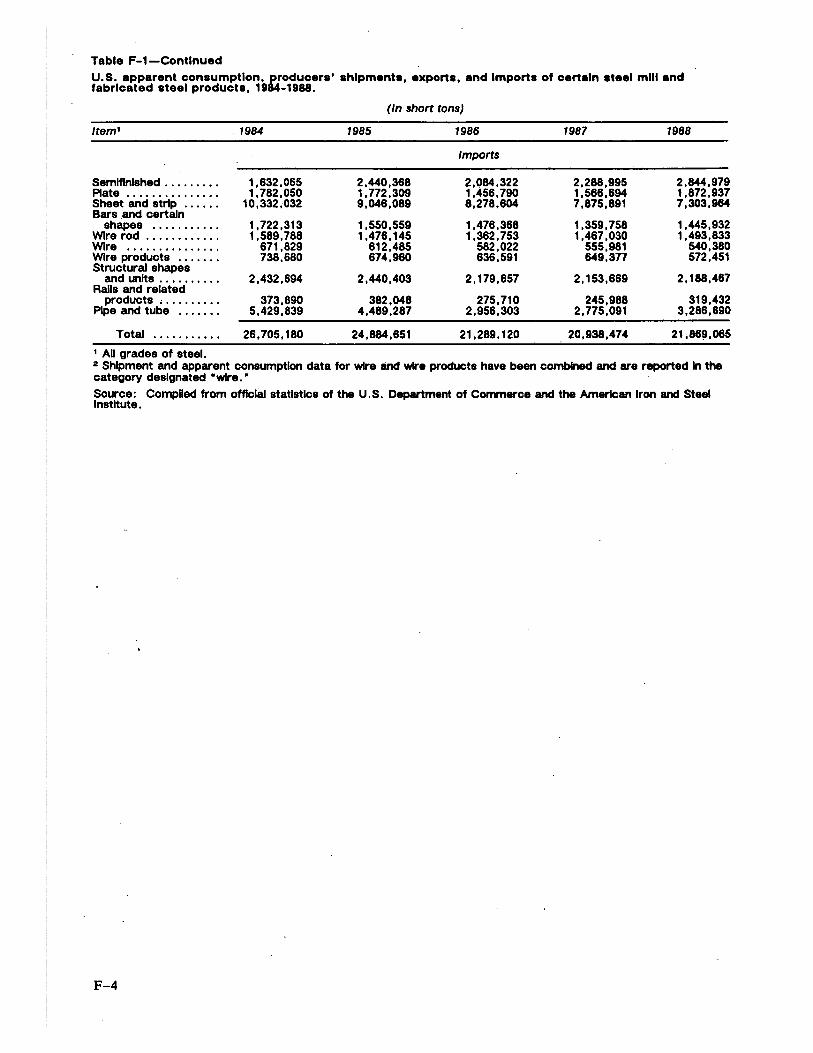
Table F-1-Contlnued
U.S. apparent consumption, producers' shipment•, exports, and Imports of certain •teel mlll and fabricated steel product•, 1984-1988.
ltem1
Semlflnlshed ........ . Plate .............. . Sheet and strip ..... . Bars and certain
shapes .••..•..... Wire rod ........... . Wire ............. .. Wire products ....•.. Structural shapes
and units ..••...... Ralls and related
products , ........ . Pipe and tube .....•.
Total ........••. 1 All grades of steel.
. 1984
1,632,065 1,782,050
10,332,032
1,722,313 1,589,788
671,829 738,680
2,432,694
373,890 5,429,839
26,705, 180
(In short tons)
1985
2,440,368 1,772,309 9,046,089
1,550,559 1,476.145
612,485 674,960
2,440,403
382,048 4,489,287
24,884,651
1986
Imports
2,084,322 1,456,790 8,278.604
1,476,368 1,362,753
582,022 636,591
2, 179,657
275,710 2,956,303
21,289, 120
1987 1988
2,288,995 2,844,979 1,566,694 1,872,937 7,875,891 7,303,964
1,359,758 1,445,932 1,467,030 1,493,833
555,981 540,380 649,377 572,451
2, 153,669 2, 188,467
245,988 319,432 2,775,091 3,286,690
20,938,474 21,86~.065
2 Shipment and apparent consumption data for wire and wire products have been combined and are reported In the category designated "wire.•
Source: Complied from offlclal statistics of the U.S. Department of Commerce and the American Iron and Steel Institute.
F-4
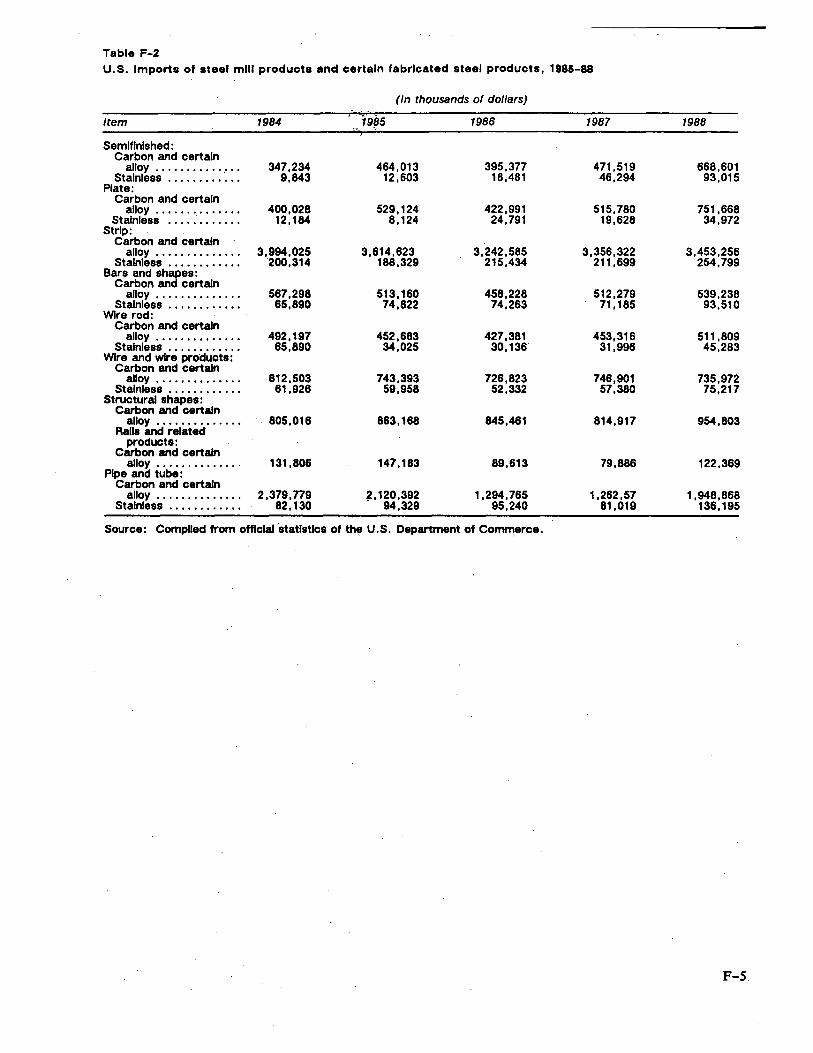
Table F-2 U.S. Imports of steel mlll products and certain fabricated steel products, 1985-88
(In thousands of dollars)
Item 1984 19~5 1986 1987 1988
Semlflnlshed: Carbon and certain
alloy ............... 347,234 464,013 395,377 471,519 668,601 Stainless .•..••••••.• 9,843 12,603 18,481 46,294 93,015
Plate: Carbon and certain
alloy .............. 400,028 529, 124 422,991 515,780 751,668 Stainless ....•••.•••• 12, 184 8, 124 24,791 19,628 34,972
Strip: Carbon and certain
alloy •••••••.••.•••• 3,994,025 3,614,623 3,242,585 3,356,322 3,453,256 Stainless ••••.••••••• 200,314 188,329 215,434 211,699 254,799
Bars and shapes: Carbon and certain
alloy .............. 567,298 513, 160 458,228 512,279 539,238 Stainless ••.••.•..••• 65,890 74,822 74,263 71, 185 93,510
Wire rod: Carbon and certain
alloy .............. 492, 197 452,683 427,381 453,316 511,809 Stainless ••••••.••..• 65,890 34,025 30, 136 31,996 45,283
Wire and wire products: Carbon and certain
alloy .............. 812,503 743,393 726,823 746,901 735,972 Stainless .•••••••••.• 61,926 59,958 52,332 57,380 75,217
Structural shapes: Carbon and certain
alloy .............. Ralls and related
805,016 863,168 845,461 814,917 954,803
products: Carbon and certain
alloy .............. Pipe and tube:
131,806 147,183 89,613 79,886 122,369
Carbon and certain alloy .............. 2,379,779 2, 120,392 1,294,765 1,262,57 1,948,868
Stainless .••••••••••• 82, 130 . 94,329 95,240 81,019 136, 195
Source: Complied from official statistics of the U.S. Department of C°"'"'erce ..
F-5.

APPENDIX G STEEL EXPORTS AND EXPORT CEILINGS NEGOTIATED UNDER THE VRAs

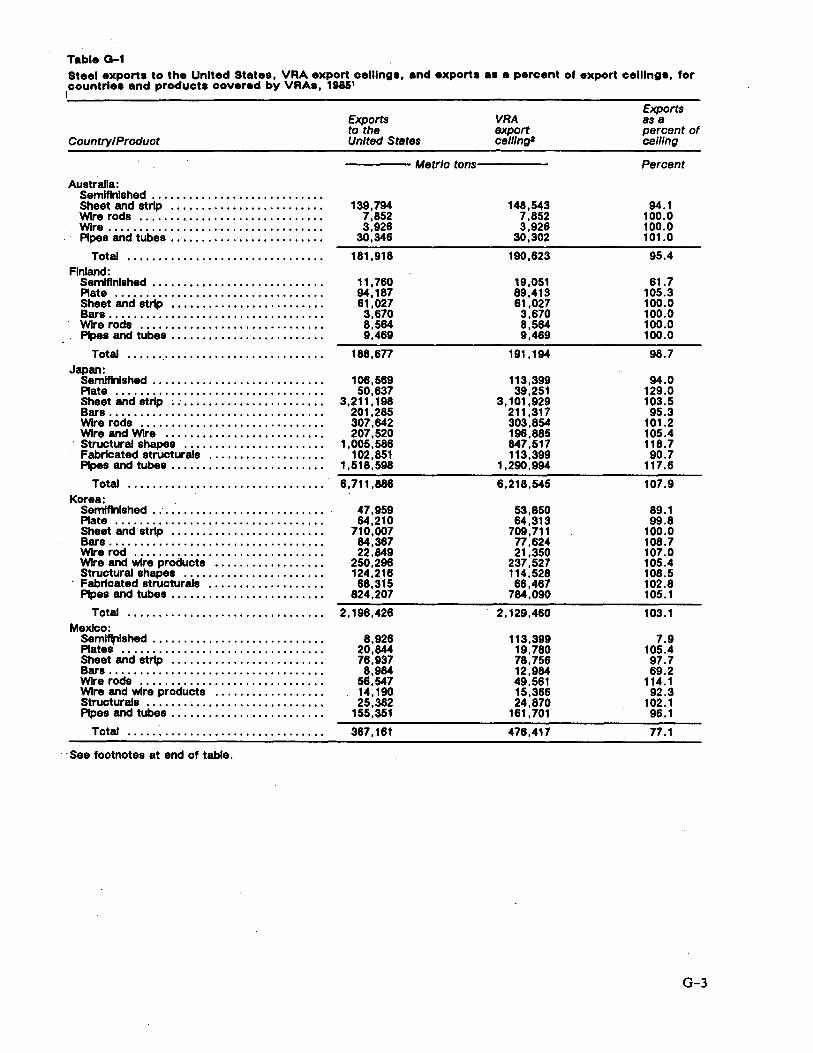
Table Q-1 Steel exports to the United States, VRA export oelllng•, and export• H a percent of export celllng•, for
1countrle• and product• covered by VRA•, 18151
Country/Product
Australia: Semlflnlshed .•..•....................... Sheet and strip .•........•..........•... Wire rods •.....•.....•.................. Wire ....•..............•..........•..... Pipes and tubes •.•..........•...•.......
Total .....•..........•..............• Flnland:
Semlflnlshed .•....•.•................... Plate ..••........•...•......•...•..•... Sheet and strip ...•......•.......•..•.•. Bars ...•....•....•.................•... Wire rods .....•.••.....•..............• Pipes and tubes ..•......•..............•
Total .........•........•....•.......•. Japan:
Sernlflnlshed ....•.•..........•......•... Plate .....•.•............•..•........•• Sheet and strip . : .•...•...•............• Bars .•...........•....................• Wire rods ...•........•.•............... Wire and Wire ....•...............•....•
: Structural shapes ..•.•......•........... Fabricated structurals ..•................ Pipes and tubes .•.........•.............
Total .....•....•..................... Korea: .
Semfflnlshed .• · ..........•.............•. Plate .................................• Sheet and strip .............•.•.......•. Bars .................•.....•.......•... Wire rod ....•....•...•.............•.• , Wire and wire products ................. . Structural shapes ...........•..........•
· Fabricated structurals ..................• Pipes and tubes .•.•.......•...........•.
Total ........•.....•................. Mexico:
Semlfl/11shed .•••...••.•••.•••••...•••••. Plates ..•.......................•....•. Sheet and strip .......•...•......•..•.•. Bars .............•...•........•.....•.. Wire rods ............................. . Wire and wire products ................. . Structurals ....... ; ............•.•..•.•. Pipes and tubes ...•...•..••.........•.•.
Total •......................•........
· ·See footnotes at end of table.
Exports to the United States
VRA export celllng2
----Metric tons-----
139,794 7,852 3,926
30,346
181,918
11,760 94, 187 61,027
3,670 8,564 9,469
188,677
108,569 50,837
3,211, 198 201,285 307,642 207,520
1,005,586 102,851
1,518,598
6,711.886
47,959 64,210
710,007 84,367 22,849
250,296 124,216
68,315 824,207
2, 196,426
8,926 20,844 76,937 8,984
56,547 14.190 25,382
155,351
367,161
148,543 7,852 3,926
30,302
190,623
19,051 89,413 61,027
3,670 8,564 9,469
191,194
113,399 39,251
3, 101,929 211,317 303,854 196,885 847,517 113,399
1,290,994
6,218,545
53,850 64,313
709,711 77,624 21,350
237,527 114,528 66,467
784,090
2, 129,460
113,399 19,780 78,756 12,984 49,561 15,366 24,870
161, 701
476,417
Exports as a percent of eel/Ing
Percent
94.1 100.0 100.0 101.0
95.4
61.7 105.3 100.0 100.0 100.0 100.0
98.7
94.0 129.0 103.5 95.3
101.2 105.4 118.7 90.7
117.6
107.9
89.1 99.8
100.0 108.7 107.0 105.4 108.5 102.8 105.1
103.1
7.9 105.4 97.7 69.2
114.1 92.3
102.1 96.1
77.1
G-3
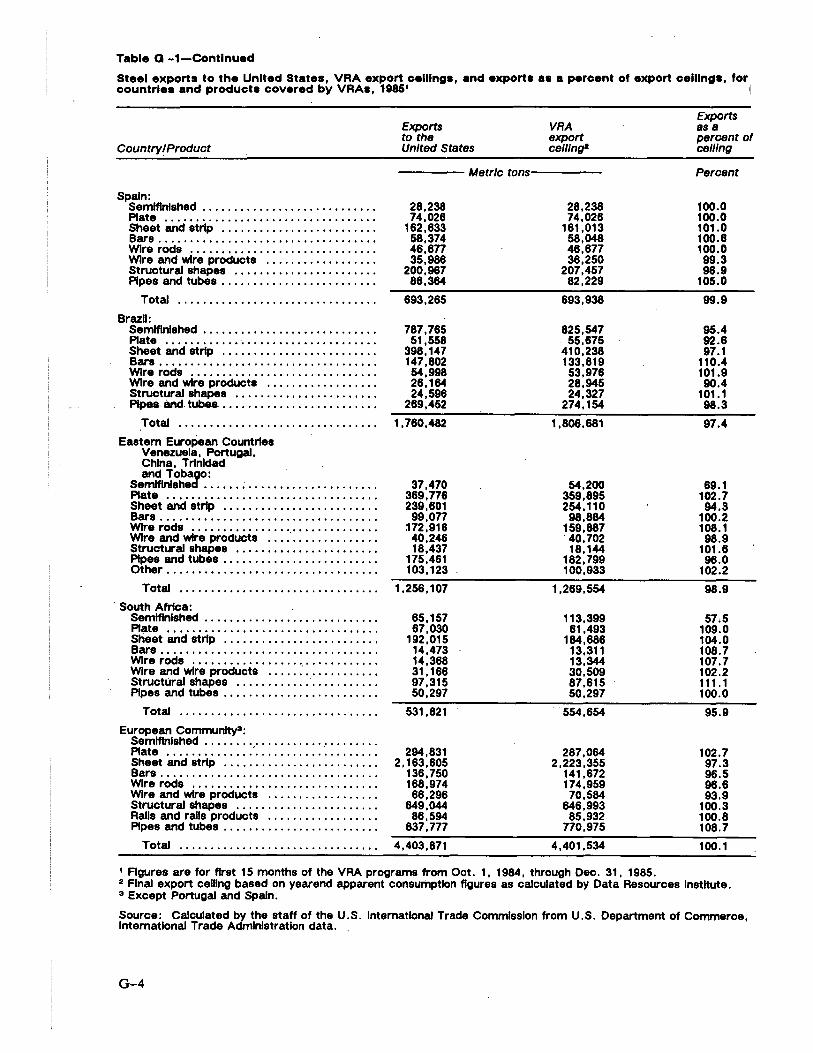
Table Q -1-Contlnued
Steel exports to the United States, VRA export celllng•, and export• as a percent of export celllng•, for countries and products covered by VRA•, 19851 I
Country/Product
Spain: Semfflnlshed ...................•......•. Plate ................................. . Sheet and strip ........................ . Bars ............•.....•.......•........ Wire rods .......•.............•...•.... Wire and wire products ......•..•......•. Structural shapes ...........•..•........ Pipes and tubes ..•..........•...........
Total ...•............................
BrazU: Semlflnlshed .....•..........•........... Plate .....•...•••......•...•........ · · · Sheet and strip .....•.... , ..•..•......•. Bars .................................. . Wire rods ...•....................•..... Wire and wire product• ................. . Structural shapes ...................... . Pipes. and- tubes ......................... .
Total ...•.•..........•...•...........
Eastern European Countries Venezuela, Portugal, China, Trinidad
se~:::3~= ..... : ...... · .............. . Plate ......••......•................... Sheet and strip ........................ . Bars ....•..••......••. ·.- ......•......... Wire rods .•••......•................... Wire and wire products ................. . Structural shapes ........ -.........•..... Pipes and tubes ........•.... ; .......... . Other •......•......•...................
Total ..........................•.....
· South Africa: Semlflnlshed ........•................... Plate ......••......•................... Sheet and strip ........................ . Bars ...•............................... Wire rods ..............•............... Wire and wire products ..... : ........... . Structural shapes ...................... . Pipes and tubes ........................ .
Total ........................... -.... .
European Communfty3 :
Semfflnlshed ........................... . Plate ..•.......... : . .......... · ........ . Sheet and strip ........................ . Bars .................................. . Wire rods ..•........................... Wire and wire products ................. . Structural shapes ...................... . Ralls and rails products ................. . Pipes and tubes ........................ .
Total ............................... .
Exports to the United States
Metric tons
28,238 74,028
182,833 58,374 48,877 35,988
200,987 88,364
893,285
787,785 51 ,558
398, 147 147,802 54,998 28, 164 24,598
289,452
1,780,482
37,470 389,778 239,801 99,077
.172,918 40,248 18,437
175,481 103, 123
1,258, 107
85, 157 87,030
192,015 14,473 14,388 31, 168 97,315 50,297
531,821
294,831 2, 163,805
138,750 188,974 88,298
649,044 88,594
837,777
4,403,871
VRA export ce//lng2
28,238 74,028
181,013 58,048 48,877 38,250
207,457 82,229
693,938
825,547 55,875
410,238 133,819 53,978 28,945 24,327
274, 154
1,808,881
54,200 359,895 254, 110 98,864
159,887 40,702 18, 144
182,799 100,933
1,289,554
113,399 81,493
184,888 13,311 13,344 30,509 87,815 50,297
"554,654
287,084 2,223,355
141,872 174,959 70,584
646,993 85,932
770,975
4,401,534
1 Figures are for first 1 5 months of the VRA programs from Oct. 1 , 1984, through Dec. 31 , 1985.
Exports asa percent of eel/Ing
Percent
100.0 100.0 101.0 100.8 100.0 99.3 98.9
105.0
99.9
95.4 92.8 97.1
110.4 101.9 90.4
101.1 98.3
97.4
89.1 102.7 94.3
100.2 108.1 98.9
101.8 98.0
102.2
98.9
57,5 109.0 104.0 108.7 107.7 102.2 111. 1 100.0
95.9
102.7 97.3 98.5 98.8 93.9
100.3 100.8 108.7
100.1
2 Final export celllng based on yearend apparent consumption figures as calculated by Data Resources Institute. 3 Except Portugal and Spain.
Source: Calculated by the staff of the U.S. International Trade Commission from U.S. Department of Commerce, International Trade Administration data. .
G-4
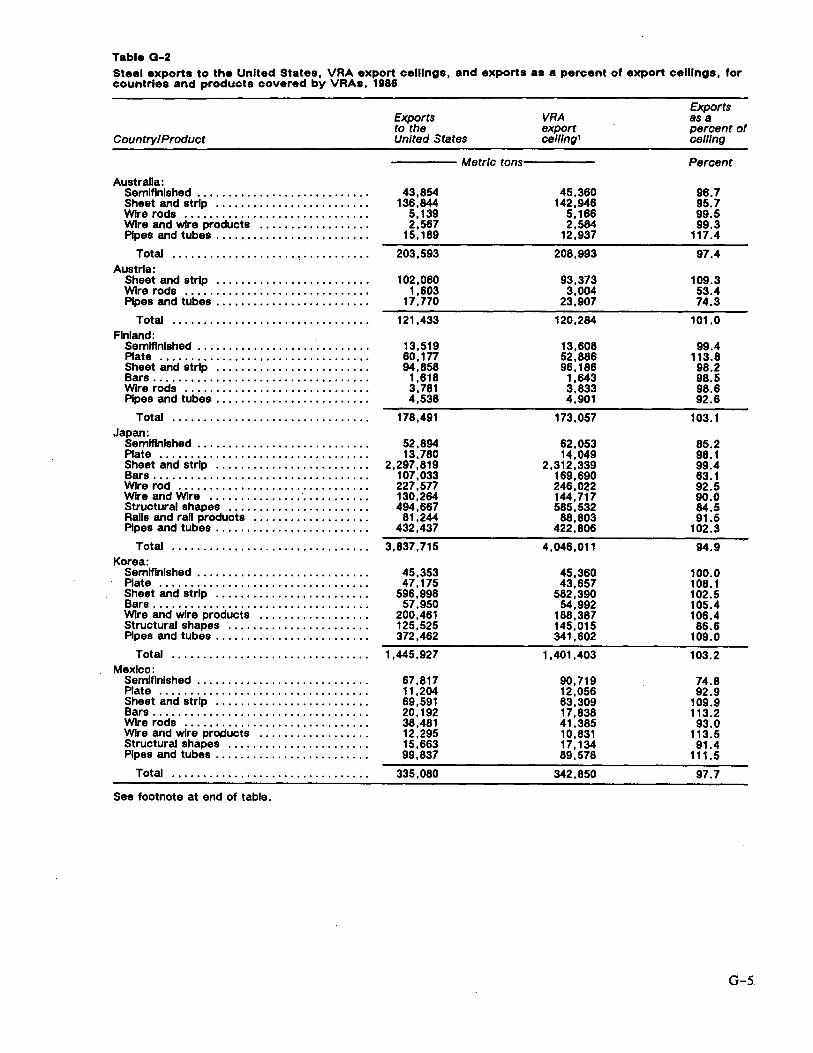
Table G-2 Steel exports to the United States, VRA export celllngs, and exports as a percent of export celllngs, for countries and products covered by VRAs, 1986
Country/Product
Australia: Semlflnlshed .•.......................... Sheet and strip ........................ . Wire rods ............................•. Wire and wire products ................. . Pipes and tubes ........................ .
Total .................... , .......... . Austria:
Sheet and strip ........................ . Wire rods ............................. . Pipes and tubes ........................ .
Total ............................... . Finland:
Semlflnlshed ................... ~ ....... . Plate ......•........................... Sheet and strip ........................ . Bars .................................. . Wire rods ............................. . Pipes and tubes ............•......•....•
Total ..........................•..... Japan:
Semlflnlshed ........................... . Plate ................................. . Sheet and strip ........................ . Bars .................................. . Wire rod ...•........................... Wire and Wire ............... · .......... . Structural shapes ...................... . Ralls and rall products .................. . Pipes and tubes ........................ .
Total ............................... . Korea:
Semlflnlshed ........................... . Plate ................................. . Sheet and strip ........................ . Bars .................................. . Wire and wire products ................. . Structural shapes ...................... . Pipes and tubes ........................ .
Total ............................... . Mexico:
Semlflnlshed ........................... . Plate ................................. . Sheet and strip ........................ . Bars .................................. . Wire rods ............................. . Wire and wire products ................. . Structural shapes ...................... . Pipes and tubes ........................ .
Total ............................... .
See footnote at end of table.
Exports to the United States
VRA export celllng1
----Metric tons-----
43,854 136,844
5, 139 2,567
15.189
203,593
102,060 1,603
17,770
121,433
13,519 60, 177 94,858
1,618 3,781 4,538
178,491
52,894 13,780
2,297,819 107,033 227,577 130,264 494,667
81,244 432,437
3,837,715
45,353 47, 175
596,998 57,950
200,461 125,525 372,462
1,445,927
67,817 11,204 69,591 20, 192 38,481 12,295 15,663 99,837
335,080
45,360 142,946
5, 166 2,584
12,937
208,993
93,373 3,004
23,907
120,284
13,608 52,886 96, 186 1,643 3,833 4,901
173,057
62,053 14,049
2,312,339 169,690 246,022 144,717 585,532
88,803 422,806
4,046,011
45,360 43,657
582,390 54,992
188,387 145,015 341,602
1,401,403
90,719 12,056 63,309 17,838 41,385 10,831 17,134 89,578
342,850
Exports as a percent of celllng
Percent
96.7 95.7 99.5 99.3
117.4
97.4
109.3 53.4 74.3
101.0
99.4 113.8 98.2 98.5 98.6 92.6
103.1
85.2 98.1 99.4 63.1 92.5 90.0 84.5 91.5
102.3
94.9
100.0 108.1 102.5 105.4 106.4 86.6
109.0
103.2
74.8 92.9
109.9 113.2 93.0
113.5 91.4
111.5
97.7
G-5.

Table Q-2-Contlnued Steel exports to the United States, VRA export oelllngs, and exports as a percent of export celllngs, for countries and products covered by VRAs, 1981
Country/Product
Spain: Semlflnlshed ............•............... Plates .....••.....•......•............. Sheet and strip .....•.............•..... Bars ...••........•••................•.. Wire rods .....•...•...•..•............. Wire and wire products ................. . Structural shapes .....•......•....•..... Pipes and tubes ........................ .
Total ....•..•...............•........ Brazn:
Semlflnlshed ....•..•.•...•....•......... Plates ••..........•.................... Sheet and strip .......••...........•.... Bars •...•..•...•...•.•.............•... Wire rods ........••.................... Wire and wire products •................. Structural shapes ........•....•......•.. Pipes and tubes ......•..............•...
Total ....•..•........................ Eastern European Countries,
Venezuela, Portugal, China, Trinidad and Tobago:
Semlflnlshed •.••.•..•.•..........•••.... Plates ..•.•............................ Sheet and strip ...••.....••...•......... Bars ••••......•..•........•........•... Wire rods ..•••..•....•................. Wire and wire products ................ .. Structural shapes ...................... . Pipes and tubes .•...•.•••............... Other ...•••••..•...•.••................
Total .•••....•.•.•........•.......... European Community•:
Semlflnlshed .............••...........•. Plates ...•••...•.•..•.................. Sheet and strip ........................ . Bars ..•...••.....•......•.............. Wire rods .•.......•...... ; ............. . Wire anct wire products .•................ Structural shapes .•......•.............. Rans and rall products •.................. Pipes and tubes ..........••.............
Total .......•........................
Exports to the United States
Metric tons
37,852 55,424
146,690 22,997 41,552 26,659
180,408 31,660
543,242
627,416 42.179
275,015 44,742 37,896 21,808 14,637
119, 748
1, 183,441
20,310 81 ,726
184,556 15,203 31,339 23,219 14,996 60,992 40,995
453,336
264, 152 246,527
2,349,106 224,471 196,260 206,207 690,460
52,642 335, 118
4,564,943
VRA export cel//ng1
45,360 53,657
150,006 38,823 42,547 31,227
184,619 35,964
582,203
641,066 40,044
292,676 58,654 41, 130 24,983 24,627
115,767
1,238,947
37,562 88,442
180,044 15,048 32,035 23, 194 17,589 62,370 61,610
498,843
544,316 227,894
2, 196,041 247,322 207,530 228,397 698,824
57,239 305,786
4,713,349
1 Final export celling based on yearend apparent consumption as calculated by Data Resource Institute. a Except Portugal and Spain .
Exports as a percent of eel/Ing
Percent
83.5 103.3 97.8 59.2 97.7 85.4 97.7 88,0
93.3
97.9 105.3 94.0 76.3 92.1 87.3 59.4
103.4
95.5
54.0 92.4 91.4
101.0 97.8
100.1 85.3 97.8 66.5
90.9
48.5 108.2 107.0 90.8 94.6 90.3 98.8 92.0
109.6
96.9
. _Source: Calculated by the staff of the U.S. International Trade Commission from U.S. Department of Commerce, International Trade Administration data.
G-6
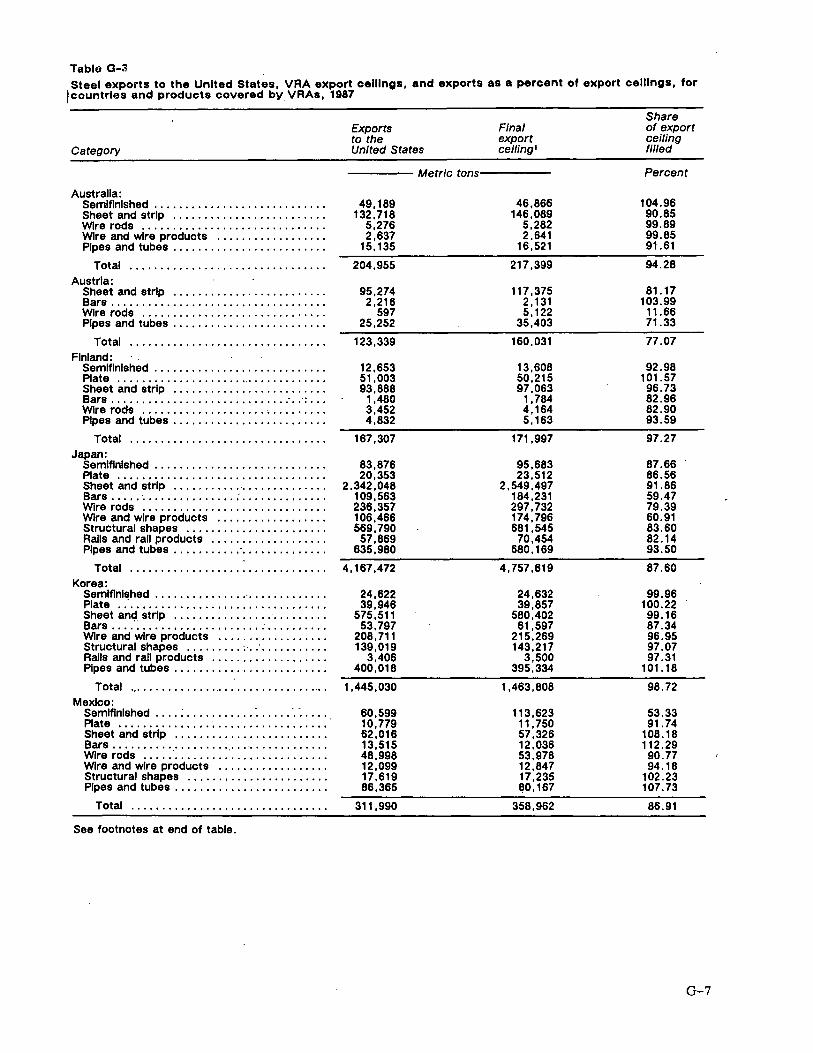
Tablo G-3 Steel exports to the United States, VRA export celllngs, and exports as a percent of export ceilings, for
!countries and products covered by VRAs, 1987
Category
Australia: Semlflnlshed .•.......................... Sheet and strip ........................ . Wire rods ...•..•....................... Wire and wire products ................. . Pipes and tubes .....•............•......
Total •.....•.....................•... Austria:
Sheet and strip .•....................... Bars .................................. . Wire rods .........•.......... · ......... . Pipes and tubes ........................ .
Total ............................... . Finland:
Semlflnlshed ........................... . Plate ................................. . Sheet and strip ..................•...... Bars ............................. -.. ·:; .. Wire rods .................•..•......... Pipes and tubes ........................ .
Total .•••.......•.....•.......•••.... Japan:
Semlflnlshed ........................... . Plate ..•.•................•.....•...... Sheet and strip .............•............ Bars ..... · .•..........•.. : .....•........ Wire rods .•.•.....•.......•.......•.... Wire and wire products ................. . Structural shapes .••.............•.•.... Ralls and rall products ......•.•.......••. Pipes and tubes ....••..... · ••••..........
Total ...•.•.....•.................... Korea:
Semlflnlt!hed ..•.•..•..•.... · ••.•..•.•.... Plate ...•.........•...........•...•.... Sheet and strip .•..•..•......• ,: •...•.... Bars ... : •......•..........•. ; ......... . Wire and wire products .............•.... Structural shapes ......... , ·. : .......... . Ralls and ran products .................. . Pipes and tubes .•.......................
Total ............•........•.......•..... Mexico:
Semlflnlshed .... : ..•.......• · ...... ·. -.... . Plate ••..•........•. ; .....•.......•...• · Sheet and strip ....•.......•.......•...• Bars .....•....•...•............•........ Wire rods ..... · ........ .' ...•............ Wire and wire products .....•..........•. Structural shapes ..........•...........• Pipes and tubes ........................ .
Total ....•...........................
See footnotes at end of table.
Exports to the United States
Final export celling'
---- Metric tons·-----
49, 189 132,718
5,276 2,637
15, 135
204,955
95,274 2,216
597 25,252
123,339
12,653 51,003 93,888
1,480 3,452 4,832
167 ,307
83,876 20,353
2,342,048 109,563 236,357 106,466 569,790 57,869
635,980
4,167,472
24,622 39,946
575,511 53,797
208,711 139,019
3,406 400,018
1,445,030
60,599 10,779 62,016 13,515 48,998 12,099 17,619 86,365
311,990
46,866 146,089
5,282 2,641
16,521
217,399
117 ,375 2, 131 5, 122
35,403
160,031
13,608 50,215 97,063
1,784 4, 164 5, 163
171,997
95,683 23,512
2,549,497 184,231 297,732 174,796 681,545 70,454
680, 169
4,757,619
24,632 39,857
580,402 61,597
215,269 143,217
3,500 395,334
1,463,808
113,623 11, 750 57,326 12,036 53,978 12,847 17,235 f!0, 167
358,962
Share of export ceiling filled
Percent
104.96 90.85 99.89 99.85 91.61
94.28
81.17 103.99
11.66 71.33
77.07
92.98 101.57 96.73 82.96 82.90 93.59
97.27
87.66 86.56 91.86 59.47 79.39 60.91 83.60 82.14 93.50
87.60
99.96 100.22 99.16 87.34 96.95 97.07 97.31
101. 18
98.72
53.33 91.74
108.18 112 .29 90.77 94.18
102.23 107. 73
86.91
G-7
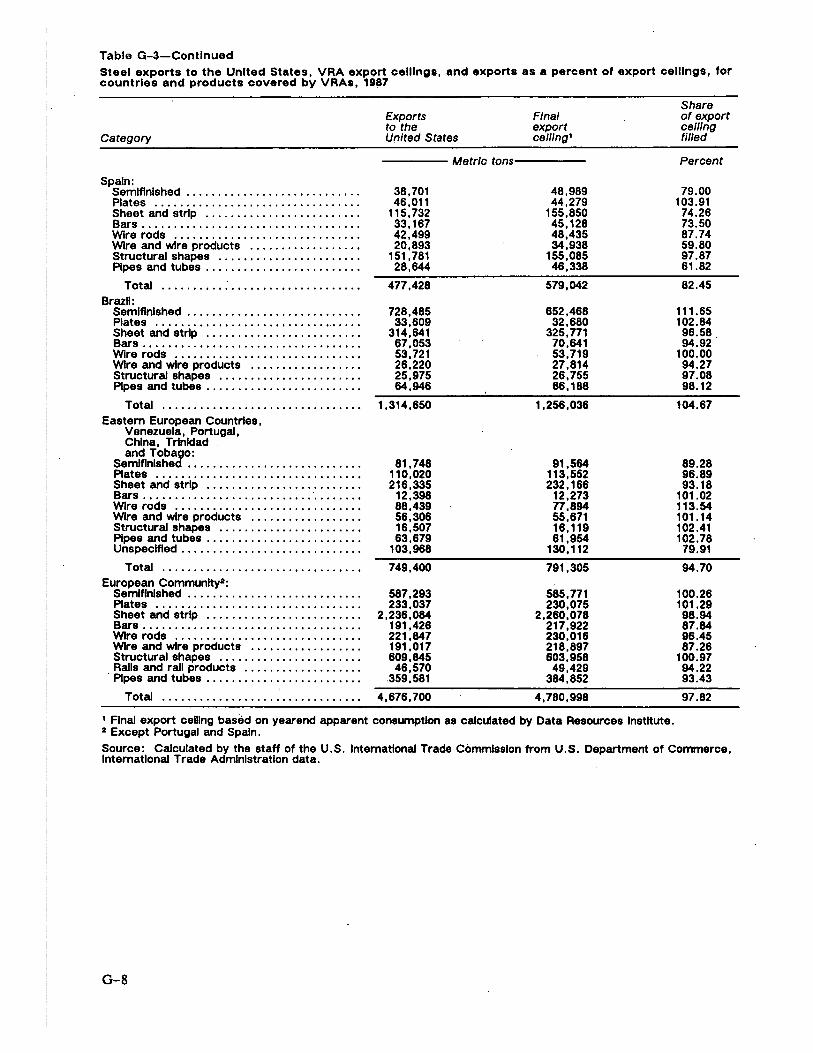
Tabla G-3-Contlnued Steel exports to the United States, VRA export ceilings, and exports as a percent of export ceilings, for countries and products covered by VRAa, 1987
Category
Spain: Semlflnlshed ........................... . Plates ................................ . Sheet and strip ........................ . Bars .................................. . Wire rods ............................. . Wire and wire products ................. . Structural shapes ...................... . Pipes and tubes ........................ .
Total ...............................• Brazll:
Semlflnlshed ............ · ............... . Plates .......•.......................... Sheet and strip ........................• Bars .................................. . Wire rods .•............................ Wire and wire products ................. . Structural shapes ...................... . Pipes and tubes ........................ .
Total ............................... . Eastern European Countries,
Venezuela, Portugal, China, Trinidad . and Tobago: ·
Semlflnlshed ........................... . Plates ................................ . Sheet and strip ........................ . Bars .............. , ............ · .......• Wire rods ... .' ......................... . Wire and wire products ................. . Structural shapes ...................... . Pipes and tubes ........................ . Unspecified ............................ .
Total ............................... . European Communttya:
Semlflnlshed ........................... . Plates ................................ . Sheet and strip .•....................... Bars .................................. . Wire rods ......•....................... Wire and wire products ................. . Structural shapes ...................... . Ralls and rall products .................. .
· Pipes and tubes ........................ .
Total ............................... .
Exports to the United States
Metric tons
38,701 46,011
115,732 33, 167 42,499 20,893
151,781 28,644
477,428
728,485 33,609
314,641 67,053 53, 721 26,220 25,975 64,946
1,314,650
81,748 110,020 216,335
12,398 88,439 56,306 16,507 63,679
103,968
749,400
567,293 233,037
2,236,064 191,426 221,847 191,017 609,845 46,570
.359,581
4,676,700
Final export celllng1
48,989 44,279
155,850 45, 128 48,435 34,938
155,085 46,338
579,042
652,468 32,680
325, 771 70,641 53,719 27 ,814 26,755 66, 188
1,256,036
91,564 113,552 232.166
12.273 77,894 55,671 16,119 61,954
130,112
791,305
585,771 230,075
2,260,078 217,922 230,016 218,897 603,958
49,429 384,852
4,780,998
1 Final export celling based on yearend apparent consumption as calculated by Data Resources Institute. 2 Except Portugal and Spain.
Share of export celling fl/led
Percent
79.00 103.91
74.26 73.50 87.74 59.80 97.87 61.82
82.45
111.65 102.84 96.58 94.92
100.00 94.27 97.08 98.12
104.67
89.28 96.89 93.18
101.02 113.54 101.14 102.41 102.78
79.91
94.70
100.26 101.29 98.94 87.84 96.45 87.26
100.97 94.22 93.43
97.82
Source: Calculated by the staff of the U.S. International Trade Commission from U.S. Department of Commerce, International Trade Administration data.
G-8

APPENDIX H THE STEEL MARKET DURING 1984-88

THE STEEL MARKET DURING 1984-88
The steel market underwent a number of changes during 1984-88 which influenced the extent to which the steel VRAs affected consuming industries, as follows:
In the initial years of the program (1984-85), the value of the dollar in international markets was relatively strong, so much so that the U.S. steel market appears to have been one of the highest price, and therefore one of the most lucrative, steel markets in the world. Reflecting these conditions, imports rose significantly from their early 1980s levels, increasing their share of the U.S. market from 16-22 percent in the early 1980s, to a peak of 26 percent in 1984.
In terms of the strength of the U.S. market, demand was relatively weak during the mid-1980s, which had a pronounced effect on steel industry operations. Capacity utilization did not exceed 70 percent, for example, until 1987; the fact that it did in 1987 reflects the fact that substantial capacity had been closed.
Conditions changed during the latter part of the VRA period, as demand for steel in the U.S. market in 1987 and 1988 increased substantially. By 1988, the industry was operating at close to 90 percent of its capability.
Growth in demand was not, however, restricted to the U.S. market; world steel production reached a record high in 1988, resulting in a global tightening of market conditions in all regions.
. The increase in world production and the corresponding increases in capacity utilization had a predictable effect on prices, which rose internationally. The upward price pressures in the U.S. market were accentuated by declines in the value of the dollar relative to countries from whom the United States imports steel. By the second quarter of 1988, the real value of the dollar had declined by a steel-trade-weighted average of 35 percent against VRA countries and by 15 percent against non-VRA countries from their respective highs in the first and second quarters in 19 8 5. 1
The decline in the value of the dollar, combined with the effects of an increase in steel demand internationally, resulted in a reduction in foreign sales activity in the U.S. market, as evidenced by the apparent failure of most foreign producers to fill their quotas in 1988. In this regard, available information suggests that approximately 75 percent of quota tonnage was used during 1988, as opposed to 94 percent in 1987 and close to 100 percent in 1985 and 1986. The reduction in sales activity, however, varied among countries and product lines. Certain countries, such as Mexico, Brazil, and Eastern European countries, filled a much higher percentage of their allotted tonnage in 1987-88 than other countries. In terms of the effect of the restraints in product areas, virtually all the quotas for semifinished steel and steel plate were filled in 1987; moreover, these product lines apparently had the highest quota utilization rates in 1988.
In summary, it would appear that demand for imports was at its highest during 1985 and 1986. During these years, however, the U.S. industry's operating rates were relatively low, a factor that should have minimized any supply problems, though there were instances in which problems in particular product areas developed.
In contrast to 1985 and 1986, the U.S. industry was not in a position to accommodate an increased level of steel demand during 1987 and 1988 without extending lead times. By 1988, most exporters were similarly unwilling to supply additional steel to the less profitable U.S. market in light of strong demand in their respective home markets and other export markets.
1 See USITC, The Western U.S. Steel Market: Analysis of Market Conditions and Assessment of the Effects of Voluntary Restraint Agreements on Steel-Producing and Steel-Consuming Industries, March 1989, p. 7-8n.
H-3