the effects of the internet on real estate
TRANSCRIPT

The Effects of the Internet on Real Estate
Based on a study of Mecklenburg County
Residential Real Estate Consumers and Real Estate Brokers
During April, May and June of 1999.
In Partial Fulfillment Of the Requirements for the degree of Masters of Business Administration
By
Robert J. Cassam Jr. Jeff Parker
Daniel Elmaleh Deborah Kershaw
Montreat College Charlotte, North Carolina
2000

The Effects of the Internet on Real Estate
By
Robert J. Cassam Jr. Daniel Elmaleh
Jeff Parker Denise Kershaw
Montreat College
Problem
The purpose of this research is to determine the extent to which the Internet has impacted
the residential real estate market in Mecklenburg County.
Method
To obtain the necessary data to perform this research, a survey tool was developed that
asked the respondents questions regarding their usage of the Internet in relation to residential real
estate transactions. The scope of the study was confined to Mecklenburg County, North
Carolina, during April, May and June of 1999. This place and period of time was used as a
sample for the larger residential real estate market. The survey instruments used eight questions
for real estate consumers and nine questions for the real estate brokers. Surveys were sent out
using direct mail and a self-address stamped return mailer.
Results
The Internet has already altered the way that residential real estate transactions are
conducted. As the technology that powers the Internet improves, the tools available to both
consumers and brokers will continue to develop and improve. Today, many consumers make
use of the tools already available on the Internet. As the tools to conduct residential real estate

ii
transactions on-line improve, consumers will grow increasingly comfortable with these tools,
changing the role of the real estate agent. Our analysis shows that a large percentage of
consumers and real estate brokers believe that the consumer’s need for a traditional real estate
agent will be diminished or eliminated by the use of the Internet. Prudent consumers would be
wise to make better use of the technology available today so they can take better advantage of
the opportunities the new tools will present tomorrow. Brokers would be smart to exercise
foresight in adapting to the changing world, market and profession of which they are a part.
The growth of the internet means more information will be available in the public
domain. Real estate professionals will no longer be the gatekeepers of real estate information in
the future. With more information available to the general consumer, real estate professionals
will act in more of a consulting role to validate the fees and commissions for their services.

iii
The Effects of the Internet on Real Estate
Based on a study of Mecklenburg County
Residential Real Estate Consumers and Real Estate Brokers
During April, May and June of 1999.
In Partial Fulfillment Of the Requirements for the degree of Masters of Business Administration
By
Robert J. Cassam Jr. Jeff Parker
Daniel Elmaleh Denise Kershaw
Montreat College Charlotte, North Carolina
2000

iv
2000
Robert J. Cassam Jr. Jeff Parker
Daniel Elmaleh Denise Kershaw
ALL RIGHTS RESERVED

v
DEDICATION
This research paper is dedicated to our family, friends and other loved ones whose love
and support while completing this work helped us through this project. Their support, advice,
dedication and cups of coffee were instrumental in getting this project completed in a timely
fashion.
This paper was truly a group effort and this paper is also dedicated by each member of
the group to each of the other members as all of our hard work, analysis and insights have led us
to the conclusions presented here.

vi
ACKNOWLEDGEMENTS
We would like to acknowledge the Montreat College faculty for their guidance
throughout this Masters program.

vii
TABLE OF CONTENTS
ABSTRACT ....................................................................................................................... Page i
DEDICATION............................................................................................................................ v
ACKNOWLEDGEMENTS .......................................................................................................vi
TABLE OF CONTENTS..........................................................................................................vii
LIST OF FIGURES .................................................................................................................... x
LIST OF TABLES.....................................................................................................................xi
CHAPTER ONE................................................................................................................ Page 1
THE RESEARCH PROBLEM ........................................................................................1
DELINEATION..............................................................................................................2
BACKGROUND.............................................................................................................9
SUMMARY.................................................................................................................. 14
CHAPTER TWO ...................................................................................................................... 16
REVIEW OF SELECTED LITERATURE .................................................................... 16
THE INTERNET AND THE RETAIL INDUSTRY...................................................... 21
THE INTERNET AND THE RESIDENTIAL REAL ESTATE CONSUMERS ............ 27
THE IMPLICATIONS OF THE INTERNET ON REAL ESTATE PRACTITIONERS 30
THE IMPLICATIONS OF THE INTERNET ON THE RESIDENTIAL CONSUMERS
IN MECKLENBURG COUNTY .................................................................................. 34

viii
CHAPTER THREE .................................................................................................................. 36
METHOD ..................................................................................................................... 36
COLLECTION OF DATA............................................................................................ 36
ANALYSIS OF DATA................................................................................................. 45
RESEARCH ASSUMPTIONS AND DELIMITATIONS.............................................. 49
SUMMARY.................................................................................................................. 50
CHAPTER FOUR .................................................................................................................... 51
FINDINGS.................................................................................................................... 51
DEMOGRAPHICS ....................................................................................................... 51
CONSUMER AND REAL ESTATE FIRM QUESTIONNAIRE RESPONSES ............ 59
HYPOTHESIS TESTING ............................................................................................. 76
SUMMARY FOR CHAPTER 4: FINDINGS................................................................ 82
CHAPTER FIVE ...................................................................................................................... 84
SUMMARY.................................................................................................................. 84
CONCLUSION........................................................................................................... 104
FINDINGS RELATED TO THE CONTEXT AND LITERATURE............................ 111
FINDINGS: IMPLICATIONS AND APPLICATIONS............................................... 112
EVALUATION OF THE RESERARCH..................................................................... 113
REFERENCES LISITNG ....................................................................................................... 116
APPENDIX A: Internet Timeline............................................................................................ 118
APPENDIX B: Real Estate Firm Letter................................................................................... 135
APPENDIX C: Real Estate Consumer Letter .......................................................................... 136
APPENDIX D: Real Estate Firm Survey................................................................................. 137

ix
APPENDIX E: Real Estate Consumer Survey......................................................................... 138
APPENDIX F: Real Estate Firm Survey Data Tabulations ...................................................... 139
APPENDIX G: Real Estate Consumer Survey Data Tabulations ............................................. 148
APPENDIX H: Real Estate Firm Survey Data Tables ............................................................. 155
APPENDIX I: Real Estate Consumer Survey Data Tables...................................................... 156

x
LIST OF FIGURES
Figure 1 – Internet Growth Since Mosaic (sites)........................................................................ 11
Figure 2 – Tax Real Estate Information..................................................................................... 35
Figure 3–Geographical Data ..................................................................................................... 37
Figure 4– Departmental Makeup of Mecklenburg County (GIS) Geographical Data ................. 38
Figure 5– GIS Entry Form ........................................................................................................ 44

xi
LIST OF TABLES
Table 1 – Internet Growth (Hosts, Networks, Domains, etc. ...................................................... 12
Table 2 – Surveys Sent, Calculated, etc. .................................................................................... 45
Table 3 – Age-Consumers......................................................................................................... 52
Table 4 – Income-Consumers.................................................................................................... 52
Table 5 – Race-Consumers ....................................................................................................... 53
Table 6 – Gender-Consumers.................................................................................................... 53
Table 7 – Cross Tabulation of Age by Income........................................................................... 54
Table 8 – Cross Tabulation of Race by Income ......................................................................... 55
Table 9 – Cross Tabulation of Gender by Income ..................................................................... 55
Table 10 – Cross Tabulation of Age by Race ............................................................................ 56
Table 11 – Cross Tabulation of Gender by Age......................................................................... 56
Table 12 – Age-Brokers............................................................................................................ 57
Table 13 – Income-Brokers....................................................................................................... 58
Table 14 – Ethnicity-Brokers .................................................................................................... 58
Table 15 – Gender-Brokers ....................................................................................................... 59
Table 16 – 1. How comfortable would you feel using the Internet to shop for a house? ............. 60
Table 17 – 2. To what extent are you aware of the Internet services available to you as a
residential real estate consumer? ............................................................................................... 61
Table 18 – 3. To what extent did you use the available information via the Internet to complete a
portion of your real estate transaction? ...................................................................................... 62
Table 19 – 4. Did you consider buying or selling a house using the Internet? ............................ 62

xii
Table 20 – 5. To what extent are you aware of the availability of residential real estate
information via Internet?........................................................................................................... 63
Table 21 – 6. To what extent do you believe the information on the Internet will replace the need
for the services of a traditional residential real estate broker?.................................................... 64
Table 22 – 8. I used the following resources on the Internet to help complete my transaction: ... 65
Table 23 – 1. To what extent do you estimate (in terms of percentage of prospects) the Internet
has directly increased the total number of prospects obtained for your company?...................... 67
Table 24 – 2. To what extent do you believe the information on the Internet will replace your
need for the services of a traditional residential real estate broker?............................................ 68
Table 25 –4. To what extent (in terms of percentage of prospects obtained, where a prospect is
the person interested in buying or selling a property) has the Internet directly increased the
prospects obtained for your company? ...................................................................................... 69
Table 26–5. To what extent do you use the Internet to provide your customer with information
on listings or offerings? ............................................................................................................ 70
Table 27 – 6. To what extent do you recommend to clients that they use the Internet as a research
tool for gathering information about the city, demographics or crime? ...................................... 70
Table 28 – 7. To what extent do you recommend to clients that they use the Internet
as a research tool for gathering information about a specific property?...................................... 71
Table 29 –8. To what extent do you recommend that clients use the Internet as a research as a
tool for gathering information about ancillary real estate services such as attorneys, lenders,
appraisers, or contractors?......................................................................................................... 72
Table 30 – 9. Based on your knowledge, to what extent did your clients use the Internet for any
phase of the transaction? ........................................................................................................... 73

xiii
Table 31 – Does your firm have a web site? .............................................................................. 74
Table 32 – How long has it (web site) been up and running?..................................................... 74
Table 33 – How many full-time agents do you retain?............................................................... 74
Table 34 – How long have you been in business?...................................................................... 75
Table 35 – Do you have an Internet Marketing Plan? & Do you have plans for future Internet
usage?....................................................................................................................................... 75
Table 36 – Hypothesis Test for Null Hypothesis 1A Consumer Question 1 ............................... 77
Table 37 – Hypothesis Test for Null Hypothesis 2 Consumer Question 8 .................................. 78
Table 38 – Hypothesis Test for Null Hypothesis 4A Real Estate Broker Question 6 .................. 80
Table 39 – Hypothesis Test for Null Hypothesis 4B Consumer Question 6 ............................... 81
Table 40 – Hypothesis Test for Null Hypothesis 4C Real Estate Broker Question 2 .................. 82
Table 41 – General Research Questions .................................................................................... 97
Table 42– Broad Research Questions ........................................................................................ 98
Table 43 – Hypothesis as related to the research questions ........................................................ 99

1
Chapter 1
THE RESEARCH PROBLEM
The objective of this study is to assess the impact of the Internet on the residential real
estate market. The scope of this study includes the attitudes and behaviors of consumers and real
estate firms in Mecklenburg County during April, May and June of 1999.
In an attempt to increase productivity and profitability, brokerage firms are using the
Internet to deliver market information to consumers about the residential real estate market. This
study examines to what extent has this phenomenon affected the attitudes and behaviors of the
residential real estate brokerage firms.
Both buyers and sellers in the consumer area have opportunities to access real estate
information using the Internet, which can be crucial to the entire transaction process. This has
created an opportunity for consumers to increase their market knowledge in order to save time,
money and reduce the risks associated with real estate transactions. This study also examines if
real estate consumers in Mecklenburg County believe that these changes have affected their
market transactions.
According to a survey conducted by the National Association of REALTORS®,
consumer demand for more knowledgeable and professional agents was the number one
consumer trend in 1995 (the most recent year of their study). According to that study, consumers
want agents to have the answers to their entire home buying needs. This means REALTORS®
should be aware of the myriad of choices in the industry as well as both brick and mortar and on-
line consumer ancillary services. (Dooley, T., Swanepoel S., & Abelson, M. (1998). p. 111.)

2
Today there are increasingly educated consumers who want to apply their knowledge of
newly learned Internet technology and who personally get involved in the typical real estate
transaction. How the real estate professional can help these consumers throughout the
transaction is the crucial test of quality service. To the consumer, this is the test of the value the
real estate professional can add. Real estate professionals in the future will have to give advice
to consumers on how they can maximize the benefits of the Internet in order to help prepare
them for the home selling or home buying process. This will demonstrate that the agent does add
value to the transaction process, at least during the short-run.
In the future, the consumer will be increasingly demanding and more knowledgeable
about the process of a real estate transaction. The consumer will also have direct access to more
market information. As a result, the added value of the real estate professionals will not be
apparent and both buyers and sellers will negotiate to decrease the commission rate in the long
run. (Dooley, T., Swanepoel S., & Abelson, M. (1998). p. 128.)
Delineation
This study attempts to examine the extent to which the Internet affected the residential real
estate market in Mecklenburg County during April, May and June of 1999. The purpose of the
research will be to answer the following questions:
1. To what extent is the Mecklenburg County consumer informed of pertinent information on
the Internet in relation to residential real estate?
2. To what extent do consumers use the Internet to gather real estate information in
Mecklenburg County?

3
3. To what extent does the use of the Internet generate names and contact information for
residential real estate firms in Mecklenburg County?
4. To what extent does the use of the Internet change the market relationship between the
consumers and the real estate brokerage firms in Mecklenburg County?
This study will also provide insight into the following broad-based questions:
1. To what extent has the use of this technology caused residential real estate firms to change
their traditional methods of doing business in order to remain competitive?
2. To what extent has the community been informed by the available information obtainable
from the Internet concerning residential real estate transactions in Mecklenburg County?
3. To what extent do demographic factors such as age, race and education influence consumer
choice to use the Internet in their residential real estate transactions?
The approach used was based upon a series of hypotheses regarding the effects of the
Internet on the residential real estate market in Mecklenburg County during April, May and June
of 1999. The data needed for analyzing the hypotheses was gathered directly from consumers
and real estate professionals. The choice for this topic can be attributed to the personal
experiences that members of the research team have with the Internet and real estate transactions
both personally and professionally. With the rapid changes in technology and increase in
availability of information, it is appropriate to examine the effects of the Internet on the local
residential real estate market. The recommendations that are presented in this research are based
on the answers to the general questions and the testing of the hypotheses.

4
Variables and Their Relationships
The focus of this study is on two sets of queries: general questions and broad questions.
The general questions deal directly with the data being obtained and the research being done.
These questions will be answered by our survey information. The broad questions relate more to
the larger issues around our research, using all of the real estate market as their base, not just the
microcosm as addressed here in the general questions. These questions are addressed by our
secondary data.
The variables for the general questions and their definitions are as follows:
Awareness of Internet Resources relates to what degree the consumer was aware of the tools
on the Internet available to help with or aid in residential real estate transactions or finding and
using ancillary real estate services. Resources are tools that can help the consumer research or
conduct parts of the transaction.
Broker-In-Charge refers to the designated broker responsible for each office of legally licensed
real estate firms. The North Carolina Real Estate Commission controls licensure and broker
operations.
Broker Services Required—Broker looks at the degree to which brokers believe the
consumer’s need for their services will or won’t change in the future.
Broker Services Required—Consumer looks at the degree to which consumers believe they
will need or not need the services of a traditional real estate broker.
Broker(s) or Real Estate Broker(s) is/are individuals licensed by the state to conduct residential
real estate transactions.

5
Changed Business Procedure refers to how a brokerage firm may have changed their
procedures due to the use of the Internet.
Consumers are individuals who have made a residential real estate transaction during April,
May or June of 1999.
Distinct Web Resources are sites where a consumer can obtain information on available
properties, information on buying or selling properties, or use any of the available real estate
services including, but not limited to: searching for a real estate broker, searching for a lending
source, searching for property tax values, searching for past sales information, searching for a
closing attorney, searching for area statistics, searching for information on neighborhood
schools, churches and shopping, or searching for ancillary real estate services such as loans or
insurance.
North Carolina Real Estate Commission licensed residential real estate firms. These real
estate firms are licensed to do business in North Carolina including Mecklenburg County.
Percentage of Prospects represents a set portion (x% more than the normal) of prospects that a
real estate firm garnered by using the Internet.
Percentage of Respondents represents a set portion (x out of 100 respondents) of respondents
who were part of the survey.
Prospects are individuals interested in making residential real estate transactions.
Residential Real Estate Transactions are purchases of homes, condominiums or town-homes
(property zoned residential) during April, May or June of 1999. Residential refers to the zoning

6
and transactions refers to the actual sale or exchange during that time frame. Commercial
property, land, or industrial property is not considered, as only residential real estate is part of the
analysis.
Relatively Aware is a term used to define a respondent’s level of awareness regarding the usage
of the Internet with respect to real estate. Awareness, though a subjective term, demonstrates the
knowledge that one thinks they have regarding a certain subject.
Transaction is a property where there has been a deed transfer from one party to another.
Use of Internet is defined as connecting to the World Wide Web, FTP, GOPHER, etc. using any
protocol or connection means (http – hyper text transfer protocol -- being the most common).
Connection means include dial-up modems, DSL or Cable modems, T1 or T3 lines or Wireless
Web among many.
The above variables and definitions all have one commonality, they relate to how the
residential real estate firm and the consumer utilized the tools available on the Internet to aid in
their transaction. These relationships are vital for the answers to the hypotheses. A firm that is
on-line and utilizing the Internet is going to understand the mechanics of using the Internet far
more than a firm that does not even utilize e-mail. A web-savvy consumer or a consumer with
the knowledge to utilize a personal computer (PC) and search for information on the Internet is
going to have much more familiarity with the tools available than a lower-income person who
may not have access to the Internet does. It is also more likely that people born after 1955 will
have more knowledge and use of the Internet than those born before 1955. All of our variables
rely on age, income and experience Internet usage.

7
The criteria for establishing the basis percentages for each of the hypotheses presented
below were based on analysis and observation of the growth and development trends of the
Internet in recent years. Analysis of these factors determined the percentage threshold for each of
the hypotheses. (See Appendix A)
Question 1
This question asks: “To what extent was the Mecklenburg County Consumer informed of
pertinent information on the Internet in relation to residential real estate in April, May and June
of 1999?” This question will be answered by Hypothesis 1-A and 1-B.
Null Hypothesis 1-A: Of the consumers making residential real estate transactions, less
than or equal to 50 percent were relatively aware of the resources available on the Internet.
Alternate Hypothesis 1-A: Of the consumers making residential real estate transactions,
More than 50 percent were aware of the resources available on the Internet.
Null Hypothesis 1-B: Of the residential real estate consumers on the Internet, more than
40 percent used less than three distinct resources on the web in completing their transaction.
Alternate Hypothesis 1-B: Of the residential real estate consumers on the Internet, 40
percent or more used at least three distinct resources on the web in completing their transaction.
Question 2
Question 2 asks: “To what extent do consumers use the Internet to gather real estate
information in Mecklenburg County during April, May, and June of 1999?” This question is
addressed by Hypothesis 2.

8
Null Hypothesis 2: Less than or equal to 50 percent of all residential real estate
consumers use the Internet to gather real estate information.
Alternative Hypothesis 2: More than 50 percent of all residential real estate consumers
use the Internet to gather real estate information.
Question 3
Question 3 asks: “To what extent has using the Internet generated prospects for
residential real estate firms in Mecklenburg County during April, May, and June of 1999?” This
question is ultimately addressed by Hypothesis 3.
Null Hypothesis 3: The Internet provided less than or equal to 20 percent of residential
real estate firms’ prospects during April, May and June of 1999.
Alternate Hypothesis 3: The Internet provides 20 percent or more of residential real
estate firm's prospects in Mecklenburg County during April, May and June of 1999.
Question 4
Question 4 asks: “To what extent has the use of the Internet changed the market
relationship between the consumers and the brokerage firms in Mecklenburg County during
April, May, and June of 1999?” This question is addressed by Hypothesis 4-A, 4-B and 4-C.
Null Hypothesis 4-A: Less than or equal to 50 percent of residential real estate brokers
believe they have changed the way they do business due to consumers’ use of the Internet.
Alternate Hypothesis 4-A: More than 50 percent of residential real estate brokers
believe they have changed the way they do business due to consumer’s use of the Internet.

9
Null Hypothesis 4-B: Less than or equal to 25 percent of the consumers believe their
need for the services of a real estate broker will be reduced due to their use of the Internet.
Alternate Hypothesis 4-B: More than 25 percent of consumers believe their need for the
services of a real estate broker will be reduced due to their use of the Internet.
Null Hypothesis 4-C: Less than or equal to 20% of real estate brokers do not believe the
consumers’ need for the services of a real estate broker will be reduced due to the consumers’
use of the Internet.
Alternate Hypothesis 4-C: More than 20 percent of real estate brokers do not believe the
consumers’ need for the services of a real estate broker will be reduced due to the consumers’
use of the Internet.
Background
This analysis attempts to measure the extent to which the Internet affected the real estate
industry in Mecklenburg County during April, May and June of 1999. However, it is important
to first understand this is part of a much larger issue – the issue of how the Internet is impacting
commerce in our society. The Internet is still seen as a fairly new tool by many people. With
respect to the current graphic-intensive state of the media (multi-media presentations) and
encrypted e-commerce (secure on-line purchasing) used on the Internet, this technology is very
new. However, the backbone of the Internet has roots going all the way back to the Soviet
Union’s launching of Sputnik in 1957. “In response (to Sputnik), US forms the Advanced
Research Projects Agency (ARPA), the following year, within the Department of Defense
(DOD) to establish America's lead in science and technology applicable to the military” [for a
complete timeline of the Internet’s history, see Appendix A] (Leiner 2000).

10
Since the founding of ARPA, the Internet moved to become more a part of American
Society. The Internet was slow in developing and was originally used as a government and
educational based research network. By the early 1980s, most major colleges and universities in
the United States of America were linked together and by the mid eighties many foreign powers
(Korea, Japan, etc.) joined the net. During this time, usage of the Internet grew at a rapid rate.
As Table 1 demonstrates, the number of hosts and domains on the Internet was growing
exponentially throughout 70s and 80s (Leiner 2000).
By the early 1990s, the Internet boom was starting to gear up. People were realizing
there was more to the Internet than college students doing research and corporations sending
messages back and fourth. There was money to be made out there. One researcher notes the
following:
…both public domain and commercial implementations of the roughly 100 protocols of
TCP/IP protocol suite became available in the 1980s. During the early 1990s, OSI
protocol implementations also became available and, by the end of 1991, the Internet has
grown to include some 5,000 networks in over three dozen countries, serving over
700,000 host computers used by over 4,000,000 people (Leiner 2000).
By the mid 90s, the Internet was growing rapidly. The release of the graphical-based
browsers in 1993 was probably the biggest milestone in the growth of the Internet. In 1993
Mosaic took the Internet by storm. During this year alone, World Wide Web traffic “proliferates
at a 341,634 percent annual growth rate.” The growth rate for the old Gopher servers during this
time was 997 percent. The growth did not stop there. Over the coming years, the Internet
continued to grow rapidly. By mid 2000, the total number of Internet sites increased to over

11
130,000 times the number of sites registered on the World Wide Web. Figure 1 shows a
representation of the phenomenal growth of the Internet since Mosaic (Leiner 2000).
Table 1
Internet Growth (Hosts, Networks, Domains, etc.)
Date Hosts Date Hosts Networks Domains Dec-69 4 Jul-89 130,000 650 3,900Jun-70 9 Oct-89 159,000 837 Oct-70 11 Oct-90 313,000 2,063 9,300Dec-70 13 Jan-91 376,000 2,338 Apr-71 23 Jul-91 535,000 3,086 16,000Oct-72 31 Oct-91 617,000 3,556 18,000Jan-73 35 Jan-92 727,000 4,526 Jun-74 62 Apr-92 890,000 5,291 20,000
Mar-77 111 Jul-92 992,000 6,569 16,300Dec-79 188 Oct-92 1,136,000 7,505 18,100Aug-81 213 Jan-93 1,313,000 8,258 21,000May-82 235 Apr-93 1,486,000 9,722 22,000Aug-83 562 Jul-93 1,776,000 13,767 26,000Oct-84 1,024 Oct-93 2,056,000 16,533 28,000Oct-85 1,961 Jan-94 2,217,000 20,539 30,000Feb-86 2,308 Jul-94 3,212,000 25,210 46,000Nov-86 5,089 Oct-94 3,864,000 37,022 56,000Dec-87 28,174 Jan-95 4,852,000 39,410 71,000Jul-88 33,000 Jul-95 6,642,000 61,538 120,000
Oct-88 56,000 Jan-96 9,472,000 93,671 240,000Jan-89 80,000 Jul-96 12,881,000 134,365 488,000
Jan-97 16,146,000 828,000 Jul-97 19,540,000 1,301,000 Jan-98 29,670,000 Jul-98 36,739,000 Jan-99 43,230,000 Jul-99 56,218,000 Jan-00 72,398,092 Hosts = a computer system with registered internet protocol address (an A record) Networks = registered class A/B/C addresses Domains = registered domain name (with name server record)

12
Figure 1
Internet Growth Since Mosaic (sites)
Since the early days of the Internet’s mass availability, products could almost always be
bought and sold on-line. Some of the first businesses to make their mark were the software and
pornography industries. Software was distributed as “shareware” over early Gopher Servers.
The user could download the software and, on an honor system, pay for the software if they liked
how it worked. While not true e-commerce, people were starting to reap the benefits of the web
and starting to see what a great tool was out there. Pornography was also distributed online with
sites selling “memberships” to eager users who would ante-up funds to participate in the cyber
version of “the worlds oldest profession” (Zakon, 2000).
One of the first true e-commerce sites was Pizza Hut in 1994 allowing consumers to
order Pizzas on-line. This was an interesting concept that presented a unique series of obstacles

13
to the pizza giant. In many ways, this site was the gateway for others like it. Many companies
were soon to follow suit and enter the e-commerce game (Zakon, 2000).
By the start of second quarter in 1997 there were over one million unique web sites with
many business being represented. This number doubled for the next two years with over four
million sites being represented by start of second quarter 1999. This number would triple in the
following year (Leiner, 2000).
Real estate listings were part of the fabric of the Internet. Originally, entire Usenet
message boards were reserved for listing homes, with eager homeowners looking to cut out the
real estate commission. When the Internet started to boom, real estate practitioners got in on the
game as well, adding their listings on their own sites. Real estate services also started
developing Internet platforms. In 1996 LendingTree.com introduced their marketplace concept.
This was the first service offered for real estate that existed only in cyberspace. Many other
banks offering on-line loans already existed, but this showed the unique power of the Internet.
Today, sites such as www.homespace.com, www.realtor.com, www.progressive.com,
www.homeadvisor.com, www.century21.com and www.charlotte.com, to name a just a few from
each genre, offer a myriad of real estate services in an online environment. While some of them
have traditional brick and mortar operations, many of these new companies exist only over
TCPIP (Transmission Control Protocol over Internet Protocol).
The services offered by these companies range from obtaining homeowners insurance to
finding a realtor to finding a home. Some sites, such as www.charlotte.com allow you to
research neighborhood and crime statistics. Even city and county governments have put services
and information on-line. The Mecklenburg County Geographical Information System (GIS)
system allows users to research property and the history of the property. Consumers can find out

14
the owners, previous sale prices and deed information on any lot in Mecklenburg County. This
information has always been on public record, but this new technology saves the busy consumer
a trip to the courthouse and search though mucky and dingy record rooms.
Many groups have done studies on the effects of e-commerce on the real estate market.
The National Association of Realtors issued a report in which they showed that REALTORS®
that utilized the Internet made 8 percent more money than those who did not ($4,000 per year)
(The Economic Research Group of the National Association of Realtors®, 1999). However, this
study does not take into account the effect on consumers or the effect on the future of the
profession and how it might need to adapt.
This study should provide us with a microcosm of the state of e-commerce in the real
estate market. It should however be noted that since the research for this began, the number of
active sites has tripled – going from 4 million active web sites to 13 million active web sites.
Many of these new sites, registered in the last 12 months do offer real estate service from
searching for homes to finding loans to obtaining insurance. The domain name “Loans.com”
sold for $3 million this year (2000) to BankAmerica on eBay, an online auction house.
Summary
This chapter outlined the basis for our research, our hypothesis and questions. Variables
have been identified and their relationships are defined. This study will help to determine how
the Internet has grown and what effect it has had on the consumers and real estate firms who
have made use of this new technology. The following chapters will outline the effects of the
Internet, the methods of our research, the results of our research and finally determine the extent
to which the Internet has impacted the residential real estate market in Mecklenburg County.

15
Chapter 2 will review the secondary sources used in the research. The research variables
will be further defined as well as key terms. This chapter will help the reader understand some
of the literature important to the research.
Chapter 3 will show the methods used for this research. The identification of our target
population and sample selection will also be discussed. The survey instruments used will be
presented. Descriptions of the data sources used and procedures followed for gathering and
analyzing that data will be examined. A summation of the process will also be given.
Chapter 4 will provide a complete description and summary of the data obtained, the
sources and statistics derived from the surveys. Measures of data significance and measures of
data association will also be discussed. Finally, a summation and interpretation of the data
analysis will also be made.
Chapter 5 is the final chapter of this study. Here, the findings of our research will be
discussed. This chapter will reexamine the hypothesis and determine if the results and analysis
of the data collected accurately tested these hypotheses. A summation of the effects of the
Internet on the residential real estate market in Mecklenburg County during April, May and June
of 1999 will be presented. This chapter will also summarize all of the information presented in
the first four chapters. A detailed conclusion will also be drawn and presented here. Finally,
recommendations will be outlined for consumers and real estate practitioners who wish to utilize
the Internet for some part of a real estate transaction.

16
Chapter 2
REVIEW OF SELECTED LITERATURE
With the nature of the research introduced, some pertinent background information about
how real estate transactions are conducted in North Carolina needs to be given. In this chapter,
relevant selected literature will be used to discuss the topic of the effects of the Internet on the
residential real estate market. A synopsis of important terms and definitional material that will
assist in understanding the research presented will also be introduced. The review of the
literature will help answer the broad questions.
It is required in North Carolina, that any real estate practitioner be licensed. In order for
one to represent another person's interest in a real estate transaction for any type of
compensation, the North Carolina Real Estate Commission must license that person to practice
real estate. As such, there are two levels of licensure; agent status and broker status. The
differentiation is mandated by the state. The requirements for agent status are 42 hours of
classroom instruction, a minimum score of 75% on the state administered examination, and an
acceptance of their application from the North Carolina Real Estate Commission. The
requirements for brokerage status are an agent’s license in good standing, 30 hours of classroom
instruction, a minimum score of 75% on the state administered examination, and an acceptance
of their application from the North Carolina Real Estate Commission.
In order to operate a real estate firm in North Carolina, at least one member of that firm
must hold the status of an active broker’s license in good standing and be designated as the
active broker in charge of the firm (North Carolina Real Estate Commission, 1997). Each firm
must be registered and in good standing with the North Carolina Real Estate Commission.

17
Agents and brokers must complete eight hours of continuing education every year. Half of these
hours are contained in a state designed update course focusing on issues and updates that the
state feels important. The balance of these hours can be taken in the form of an elective credit of
a state authorized subject administered by a state authorized real estate school. In order for a
licensee to have an active status license, the aforementioned requirements must be completed and
real estate brokerage firm must accept the license. Only agents and brokers with active status
licenses can practice in North Carolina.
Most real estate brokerage firms operate on an agency or subcontractor basis as opposed
to an employee status. This means that agents, although required to work under a broker in
charge, are classified as independent contractors. These agents do not receive a salary; instead
they are paid on a commission basis. The real estate firm typically splits the agent's commission.
These splits arrangements vary greatly.
The word REALTOR® is a trademark owned by the National Association of
REALTORS® (U.S.) and licensed for use by national associations, and their members, including
among others The Canadian Real Estate Association. Most real estate boards and associations
and licensed real estate brokers, agents and salespersons who are members of those boards and
associations are licensed to use the marks REALTOR®, REALTORS®, and the REALTOR®
logo in connection with or in reference to themselves as individuals, but not as part of their
corporate name. Brokers, agents or salespeople may use these marks, as the marks refer to
membership in licensed real estate boards and associations. A non-member of a licensed real
estate boards and associations is not authorized to use the REALTOR® marks or logo in
connection with his or her name. The rules for use define "real estate business" to include: real
estate brokerage, property management, mortgage financing, real estate appraising, real estate

18
counseling, real estate syndication, land development and building. Members are not authorized
to use the marks in connection with activities that do not fall within one or more of these
recognized areas. Members are authorized to use the REALTOR® marks and logo within the
territory of their member board. Outside the territory, the marks must be accompanied by the
business name and address within one's board's jurisdiction. The terms REALTOR®,
REALTORS® and the Block "R" logo do not describe the job real estate licensees perform.
When a real estate sales person or broker is asked what they do for a living, they should describe
their profession before they use the term REALTOR®, because technically the term
REALTOR® refers only to the fact that an individual is a member of a local board committed to
code of ethics of his or her board. Nearly all-active residential practitioners are members of the
National Association of REALTORS®.
The Carolina Multiple Listing Service (CMLS) is a subscription-based database used by
real estate practitioners. Membership is fee based. The member practitioners of the CMLS
consist of member firms together with their real estate sales agents and brokers. It is not a
requirement for membership to the CMLS that one is a REALTOR®. It is, however, highly
unusual that a member is not a REALTOR®. Members of the CMLS list the active properties
for which they have listings. The categories are single-family homes, multifamily property, land,
and commercial properties. Members of the CMLS who have authorizations from prospective
buyers to act as their agent and find them property use the multiple listing database to search for
property that will fit the needs of the individual buyer. The residential real estate consumer
wishing to search for property listed in this database can use the Internet to go to the
REALTOR.COM® website. The information on listings in the CMLS is automatically
downloaded to the REALTOR.COM® website. This website is sponsored, maintained and

19
administered by the National Association of REALTORS®. This allows an individual seeking
property information to search the REALTOR.COM® website. In an effort to protect the listing
real estate professional, all pertinent data regarding the property listing is given with the
exception of the street address. Contact information for the real estate practitioner who listed the
property is provided in the search.
The Charlotte Regional REALTORS® Association (CRRA) is a trade association serving
more than 3000 Realtors® and over 4000 CMLS member participants in a six-county area for
more than 75 years. These members participate in over 15,000 real estate transactions every year.
CRRA members receive reduced rates on continuing education classes and a variety of other
professional development opportunities. The Carolina Multiple Listing Services Inc. (CMLS) is
a division of CRRA and has members in over eight counties surrounding Mecklenburg County.
CMLS is the oldest and most extensive database of real estate information in North and South
Carolina (Charlotte Regional REALTORS® Association, 1999). As the largest local association
in North and South Carolina, CRRA integrates the residential listings onto their website. The
website features allow its users to run searches using criteria such as location, price, and the
number of bedrooms. A user has access to all residential real estate listings using this website.
However, the search results will only give the user the general property data and photo without
the street address. The user does see the listing agent's name and contact information. This
structure is meant to allow the listing agent to retain control over the listing and assist prospects
interested in that particular listing.
The first section of this chapter will focus on the use of the Internet and the implications
for the retail industry. The Internet has had some important implications on retail selling in
general. There has been heavy investment by retailers trying to develop the Internet as an

20
important sales channel for their products. Examining what these implications are and how they
are shaping the future is vital to understanding the current and potential power of the Internet.
The second section of this chapter will focus on trends in the use of the Internet and the
implications for residential real estate consumers in a general sense. It is important to explore
trends and changes within the residential real estate industry as a whole given the expansion of
the Internet. Looking at how other consumers in other communities use the Internet for their
residential real estate transaction can help us understand the effects on the residential real estate
market in Mecklenburg country. The third section of this chapter will focus on trends in the use
of the Internet and the implications for the real estate practitioner. It is important to explore
trends and changes within the residential real estate brokerage industry as a whole given the
expansion of the Internet. Examining how consumers and real estate practitioners are using the
information provided on Internet for their residential real estate business can help us understand
the effects on the residential real estate practitioners in Mecklenburg Country. This relates to
what consumers have or will have available to them in order to assist in completing residential
real estate transactions. Finally, in the fourth section we will discuss the information available to
the residential real estate consumers in Mecklenburg County. Since there have been no relevant
studies conducted on this sub-market, we can only review selected literature of a general nature.
This information can be used to predict the awareness of information to the Mecklenburg
consumer in completing residential real estate transactions. This complete review should
provide an important foundation on which to review the findings discussed in Chapter Four.

21
The Internet and the Retail Industry
There are many differing points regarding the actual success of the Internet on retailing.
Some call it a revolution while others call it a boon. Many argue that the concepts are valid but
the technology has yet to deliver the results as planned. Karlgaard provides us with the opinion
that the Internet is overrated by giving us a personal example of his online shopping experience
for slippers (Karlgaard, 2000). He details his experience on three major Internet retail sites. He
points out problems with the websites operational functions and the confusing output the sites
produce.
This type of experience is what makes Internet retail second rate for customers according
to Karlgaard. He goes on to surmise that the reason for this general failure occurs because of
two reasons. The first is that investor sentiment towards Internet retailing is euphoric. Now that
many of these Internet businesses have failed to generate the anticipated returns, investors are
scrutinizing their original sentiments. The second reason is that the technology underpinning the
websites is in a state of constant change. Until the technological advances stabilize, the Internet
will fail to deliver the volume of electronic commerce that has been promised (Karlgaard, 2000).
Not everyone using the Internet has access to the same software and hardware. These
differences deliver different results to customers. He goes onto predict that the true benefits of
Internet commerce will not be realized until the third or fourth generation of Internet platforms.
The result will be a platform where all users have access to the same equipment thus delivering a
predictable service platform, finally living up to the returns touted from the Internet retailers.
Karlgaard does not predict in what time period this evolution will take place.
Gunderson supports Karlgaard's theory by pointing out that in July of 2000, seven
Internet retailers (including CDnow, Kbkids.com and Toysrus.com) agreed to pay civil penalties

22
totaling $1.5 million for variously failing to provide customers notice of delayed deliveries and
continuing to promise shipping despite backlogs (Gunderson, 2000). She goes on to cite
statistics gathered from an online study surveying the 50 largest online shopping websites. The
study found that representatives at 25% of the customer-service centers were not able to
sufficiently answer questions from consumers and that only 58% of the sites had a search
function that actually worked (Gunderson, 2000). In some cases, it took nearly two days to
receive an e-mail response rather than the 24 hours the company promised. She also pointed out
that a high ranking from this survey did not guarantee company financial success. She also
points out that there is no correlation between the health of the company and the customer
experience. These findings demonstrate that even the most adequately capitalized Internet
retailers are still struggling to deliver the ideal shopping experience.
Despite negative views toward the Internet on retailing from more critics, there remains
strong evidence that online sales are a threat and are continuing to increase as a very viable retail
venue. According to Hof, this is due to the cannibalization of retail store sales by the Internet.
Hof uses a rule of thumb that sales losses equaling 10%-15% will kill "bricks and mortar" store
profits (Hof, 2000). Hof states that the online sale of books will top 11% of overall sales, CD's
and videos will be 10% and online personal computers 18% of sales. Importantly, these figures
represent nearly doubling online sales from the previous year (Hof, 2000). This suggests that
the bricks and mortar retail stores should consider either downscaling size or shift some of their
customers to online buyers. Hof cites that 94% of online buying is a shift from bricks and mortar
stores to the Internet. Clearly, the bricks and mortar retail stores will need to provide more
information services and perhaps shift their sales strategy to accommodate the shift in Internet

23
based sales. This could mean that in the future these retail stores will act more as a show room or
a service center according to Hof.
Neuborne makes three distinctions between retailers and Internet retailers. First, she
states that Internet retailers focus on the speed of access, the speed of the transaction and the
speed of delivery. The quick and simple transaction can be a reality using the Internet. The
second distinction is that Internet retailers care about the customer's sense of community. This
can be best translated to expanding the retailer's brand by providing value added features on the
Internet website such as rich-content information and chat rooms allowing the user to expand the
buying experience from simply a purchase transaction. The third distinction is that the Internet
retailers are constantly changing. The Internet retailer has the luxury of changing everything
about the online store very rapidly and cost effectively. Such changes are highly unlikely in the
traditional retail venue give the cost and time associated. This gives the Internet retailer the
ability to meet the pace of market change and meet new challenges very fast (Neuborne, 2000a).
Each week the Chainstore.com research firm polls the retail community. During the
period of Jun 26, 2000 to July 4, 2000, when the researchers asked their respondents, “In light of
the recent problems with Internet-based retailing trends, what is the primary purpose of their
Internet strategy?” 21% responded to increase overall corporate sales, 31% said to provide
another sales channel, 13% to improve customer service, 3% to cut selling costs, 28% to build
brand awareness/loyalty and 4% did not have an Internet strategy (Chain Store Age, 2000). The
results of this poll suggest that most companies are simply trying to use the Internet as just
another sales channel rather than trying to reinvent their sales and marketing strategy altogether.
This also implies that sales expansion is the most likely category for the use of the Internet for
these retailers. The implications for a complete change in sales and marketing venue to the

24
Internet does not seem likely for a majority of retailers. This could signal that any paradigm shift
that has taken place has ended and that Internet users will become a niche market for retailers.
Duff offers some great strategies to combat this phenomenon of Internet retailing. He
recommends that successful Internet retailers need a very solid online marketing and sales
strategy so they can consistently delivery a satisfying experience for the customer. He reminds
us that the company must have not only the order capture capability but also the order
fulfillment capability. This is where most Internet retailers struggle. All of this must take place
with complete control of the communication with the customer from beginning to end. Duff
writes that a company's Internet development has to address its core business need no matter if
that need is making the customer money or saving the customer money. Perhaps the most
poignant statement relative to the Internet retailing is that the Internet makes every market a
commodity. Price competition can become fierce so whoever gets the order taken, processed and
shipped most efficiently is going to prevail and those retailers who don't have everything in place
will go out of business (Duff, 2000). Zbar points out that in retailing, a successful Internet
marketer must first be a great merchant. Well-designed Internet retail platforms give visitors
what they want and are constantly updated with new products, information and design to reflect
the customer's changing needs (Zbar, 2000). The right mix of products, content and marketing
message is the key to Internet retail success. Knowing the customer translates into providing
personalized shopping experience according to Zbar. A good Internet retail site remembers
customers buying habits and awards them for shopping in the future. It also provides customers
with useful information regarding its products, markets or industry. Providing the customer with
an easily navigable website is also important according to Zbar. Not everyone has access to
high-speed Internet connections. So an Internet site packed with lots of graphics and scripts can

25
take too long to load on the user's computer -- especially when using a dial up connection.
Adequately categorizing products in a logical fashion that lets the user easily find the item that is
of greatest importance on an Internet retail site with a great number of items for sale. Zbar says
that using customer service to build brand loyalty is also fundamental to success. This means
having great customer service cab be an effective a branding strategy. Such a commitment to
customer service must be a core commitment in order to be successful. Good Internet retailers
like Amazon.com keep this as a focus in their business strategy (Zbar, 2000). Learning the
lessons of customer interaction from the Internet retailers will be of high importance for service-
based industries seeking to use the Internet as a major venue for delivering service.
No one disputes that the Internet has opened up a whole new method of conducting
business. It has expanded the concept of mail-order to the next level. Anyone with access to the
Internet can shop using a credit card and take delivery of the goods in a variety of ways. Certain
products, such as books, music and videos, are a natural fit for Internet retail.
The expansion of options in package shipping has resulted in many affordable choices in
taking delivery of goods purchased on the Internet in a timely fashion. Many firms believe in the
Internet potential so much that they are investing heavily in designing retail websites to meet
these customers. General Motors announced its plans for a joint venture with its dealers to start a
website to compete against Internet automobile buying services such as Autobytel.com and
Greenlight.com (Miller, 2000). According to Miller, General Motors dealers would be able to
put their entire vehicle inventory on the website including brands other than General Motors.
Customers using the site would be able to complete a sales transaction online with the General
Motors dealer. General Motors does not believe that this approach will deter customers from the
main website since its visitors do not actually shop on the corporate website. This website is

26
mainly used for information purposes (Miller, 2000). This represents a very aggressive push
towards Internet retail by General Motors who is willing to assist its dealers in increasing sales.
The contact lens industry is another example of how an Internet retail-based partnership
is responding to the new Internet distribution systems that sell product direct from the
manufacturer to the customer. Rutledge gives us a good example in contact lens sales, where
Direct has been capturing sales from the traditional ophthalmologist. Until recently, about 60%
of the contact lens sales were made through ophthalmologists (Rutledge. 2000). The direct
sellers have started to take market share. The response by the ophthalmologists was to form an
Internet based partnership whereby each ophthalmologist is provided a custom website complete
with online contact lens ordering capability. Using such creativity will force a level playing field
for many small businesses that are now threatened by Internet retail commerce.
For items that do not lend themselves to this type of practical retail transaction, the
Internet allows users to conduct valuable research on items that typically do not take place
without a great deal of effort such as real estate. Real estate transactions differ from many
traditional purchases because they usually are conducted with the use of sizeable loans or
mortgages. Another unique aspect of the transaction is complexity that usually requires the
assistance of a licensed attorney to conduct a real estate title search to protect the interest of the
buyer and lender. Such logic follows the path of luxury item sales using the Internet. Neuborne
reminds us that the sales of luxury items will not work in the Internet because the human touch is
integral (Neuborne, 2000b). This matching principle may be true with real estate. No matter if
the transaction can be accomplished using the Internet, human trust must be generated in order to
make such a purchase, solely based on online information. Even if the user can see 360-degree
property tours, it is unlikely that that person would not want to physically look at the property

27
prior to purchase. However, the Internet could be used to gather pertinent data and cull property
listings prior to personally examining the inventory. This may considerably reduce the actual
time spent in the decision making process for the buyer. Care should be taken to remember that
not everyone has access to the Internet and not every with access wants to use the Internet to
make purchases. Some consumers like the traditional venues for purchasing where the consumer
relied solely upon the real estate agent to perform the preliminary search function for the buyer
based upon a buyer's needs analysis.
The Internet and Residential Real Estate Consumers
Use if the Internet appears to be changing the way information is released and business is
conducted in the real estate industry. It is crucial to remember that the real estate brokerage is a
service industry. Providing a service using the Internet as the delivery platform must employ
concepts drawn for the Internet retail industries experiences with success and failures. Recently,
the Economic Research Group of the National Association of REALTORS® conducted a series
of surveys to measure the degree to which the Internet has impacted the industry. The
conclusions that follow reflect major changes in the industry (The Economic Research Group of
the National Association of Realtors®, 1999).
The findings of REALTOR.COM® user and general conventional homebuyer surveys
showed that twenty-three percent of all conventional homebuyers have searched for a home on-
line. Seventy-six percent of REALTOR.COM® users are seriously searching for a home
compared to 60 percent for all conventional homebuyers. Yet, REALTOR.COM® users are
earlier in the home search process compared to many conventional homebuyers. Thirty-one
percent of REALTOR.COM® users are at least six months away from buying a home, compared

28
to 20 percent for conventional homebuyers. Forty-seven percent of REALTOR.COM® users
have been searching for a home for no more than a month, compared to 36 percent of all
conventional homebuyers.
Users of on-line services are just as likely to use REALTORS® as are other potential
homebuyers. REALTOR.COM® users are more likely to use newspapers, yard signs, open
houses, and home books/magazines than are other conventional homebuyers are.
REALTOR.COM® users have more experience in the home buying process than other
conventional homebuyers. There is little age or gender difference between the
REALTOR.COM® user and the conventional homebuyers. However, “only” 68 percent of
REALTOR.COM® users live in a household that consists of a married couple, compared to 76
percent of all conventional homebuyers. REALTOR.COM® users are more likely to have
higher household income than other conventional homebuyers are, with a median household
income of $63,300, nearly $17,000 above the typical potential homebuyer.
More than two-thirds of REALTOR.COM® users find on-line searching for homes to be
at least “very valuable.” Fifty-eight percent of all conventional homebuyers responded similarly.
The vast majority of real estate Web site users are looking for home listings and not for real
estate agents or companies. Consumers typically contact REALTORS® after using a real estate
Web site. Sixty-three percent of REALTOR.COM® users and 39 percent of all conventional
homebuyers find that it is at least “very important” for their REALTOR® to be “Internet-savvy.”
The results of this survey suggest that real estate consumers are and will increasingly use
the Internet as an important tool in their real estate transactions. Almost twenty-five percent of
residential consumers searching for property are using on-line services, such as
REALTOR.COM®, in their home search. Those consumers searching for a home expect their

29
real estate practitioner to be familiar with the resources available on the Internet. However, it
does not appear that on-line services are replacing the real estate practitioner in the home search.
REALTOR.COM® users are just as likely to use a real estate practitioner, as are other potential
homebuyers. On-line searchers are simply performing the early stage of their home search
conveniently on-line. Yet, once they find a set of homes in which they are interested and/or they
become more serious in their home search, users of on-line services contact a local real estate
practitioner to assist them in searching for their final purchase (The Economic Research Group
of the National Association of Realtors®, 1999).
For the time being, many consumers are using the Internet for initiating only some basic
pre-requisites for purchasing real estate. Kim gives consumers examples and instructions on
how they can use the Internet to assist them to a greater degree with their next home sale or
purchase (Kim, 1998). For instance, Kim recommends obtaining qualification for financing prior
to property searching, considering where to find the perfect home and how to select a real estate
agent. Kim also discusses negotiating the price and closing the transaction. Kim makes the point
to the consumer that there exists detailed and valuable information for buyers and sellers that
will help them with this transaction. This provides us with an example of how the industry is
changing and to what extent the Internet can effect both real estate practitioners and consumers.
Having access to pertinent information, no matter who provides that information, is a key
element behind providing an excellence in customer service that is crucial for Internet success.
Harney examines an interesting analysis of a new trend in selling residential real estate (Harney,
1999). Harney details work by the Appraisal Institute (AI), a national trade organization
representing 20,000 appraisers, toward developing a website that will offer results of appraisals
on-line. A seller choosing to purchase a pre-listing appraisal would be able to offer the results of

30
the final appraisal on the AI website. Such a website could allow potential buyers obtain more
information on the subject property than is currently given on any multiple-listing-based website.
For instance, some AI homes may not be offered by real estate brokers for sale but may be sold
directly by the owners. This could cut the buyer's acquisition costs and provide buyer's with
much more information about the property prior to the contracting process.
Providing quality information in a logical and meaningful fashion to the customer on a
consistent basis will be the model that will succeed in the Internet service-retailing arena just as
it is in Internet product retailing. In the long run, the customer will not care who provides this
service to them, just as long as it is delivered in a valuable fashion. Some information needed to
make real estate purchasing decisions is already available online in some geographic areas
through a variety of sources, it appears that a many consumers who have access to that
information still need help or guidance in interpreting this information or compiling the
information into something meaningful.
The Implications of the Internet on Real Estate Practitioners
According to the Economic Research Group of the National Association of
REALTORS® survey to measure the degree to which the Internet has impacted the industry, 65
percent of REALTORS® access the Internet for real estate business purposes (The Economic
Research Group of the National Association of Realtors®, 1999). Nearly nine out of ten
REALTORS® who access the Internet report that they generate at least one percent of their
business on-line. Two-thirds of contacts that REALTORS® receive on-line are interested in a
specific home found on-line. Seventy-five percent of REALTORS® who access the Internet
make Internet marketing an important feature of their listing presentations. The vast majority of

31
REALTORS® feel that the Internet represents a new opportunity for business with just ten
percent of REALTORS® believing that the Web will be a threat to their business. There are few
demographic differences between customers accessing REALTORS® and those who do not;
however, the typical REALTOR® customer who does access the Internet earns $4,000 higher
gross income than does the typical REALTOR® customer who does not.
Today’s REALTOR® is responding to the call of the Internet, with nearly four out of five
REALTORS® believing that the Internet represents an opportunity to their business. Two-thirds
of REALTORS® currently access the Internet for business purposes and most list their
properties on-line. Nine out of ten REALTORS® who access the Internet report that they
generate at least one percent of the business from on-line services (The Economic Research
Group of the National Association of Realtors®, 1999).
Many consumers feel that the real estate practitioner is simply a "middle-man". In Saffo's
article illustrating how technology has lead to the disappearance of some intermediary based
companies in service-based industries, a detailed illustration is given concerning the airline
industry and SABRE, the airline flight-ticketing giant (Saffo, 1998). The conclusion drawn is
that computer enabled innovation does make the commercial environment more complex and
these new information systems create new niches. Saffo states that the first mover has a huge
advantage for those recognizing these opportunities. The article details some major implications
of disintermediation. These are: form value webs not value chains, do not get too close to your
customer and advantages can go to small players (Saffo, 1998). A value web is a term used to
describe a larger customer network than is the term value chain. The value web infers that
customer interaction occurs on a much broader level than the value chain philosophy. Getting
too close the customer means that a firm must not concentrate its resources solely on this task. If

32
this occurs, customer prospecting may suffer, for example. Clearly, with the availability of
technology today, small firms can take advantages of many resources afforded to only wealthy
established firms in the past. Saffo discusses the sharing of information as a way to prosper in
these information networks. These implications simply state that industry has changed
considerable due to the Internet as an information network. We can infer that the residential real
estate industry may be one of these industries facing the potential devaluation of the real estate
broker. Since the residential real estate market is primarily an intermediary based market,
technology will have a huge impact on its future. This supports the hypothesis that the Internet
will impact the residential real estate market in Mecklenburg County.
Rafter discusses the changes that real estate agents face given the advancing Internet
technology (Rafter, 1999). Rafter also discusses how some Internet start up companies could
change how house are purchased and sold. It gives examples of three of these sites, the platform
each company uses and how it could change the industry if successful. Rafter also points out
that the real estate industry is based on people and that people are sometimes notorious for being
slow to take advantage of change. The point of the first mover advantage coupled with a
paradigm shift in customer preference is inferred throughout the article. This provides more
evidence about how the Internet is currently changing the market and what might lie ahead in the
future for real estate practitioners and consumers.
There is no doubt that the industry is changing and will continue to do so. Dooley et al
provides an excellent source for examining the effect of technology in the real estate industry in
the United States. The authors make an excellent summarizing point by stating that the real
estate industry is at the vortex of three large revolutions. These are the technology revolution,
the communication revolution and the consumer revolution (Dooley, Swanepoel, & Abelson,

33
1998). The authors repeatedly make the point that traditional real estate brokerage is dead.
Detailed information about the changing tastes and preferences of many different demographic
groups are discussed. The book discusses the changes that face the real estate brokerage industry
and its professionals. The movement from bundled brokerage services to menu services is a big
change predicted for the real estate broker. The authors point out that the real estate broker is
here to stay at least for the short term. However, changes in technology leading to paradigm
shifts in consumer thinking will radically change the real estate practitioner's role.
Technology is predicted to produce a more professional real estate practitioner and those
lacking this professionalism will be driven from the field. Globalization in real estate is
predicted to take the form of strategic relationships for the most part. The most significant
changes or developments that will be apparent in the real estate brokerage industry by the period
of 2000 to 2005 are: demographic segmentation -- entry of a customer types accompanying the
Internet paradigm shift, a shift in thinking among real estate brokers by adding valuable services
that their customers are willing to use and the restructuring of the traditional multiple listing
services and its accessibility to the consumer (Dooley, Swanepoel, & Abelson, 1998). This
publication gives us an insightful opinion regarding the future of in industry for both real estate
practitioners and consumers. There can be little doubt that the days of traditional brokerage are
over and the consumer will ultimately benefit by having more and better information from which
to make purchasing decisions. It also appears that the Internet will be the venue for delivering
this information to consumers. What remains to be seen is how much consumers will take
advantage of the information available to them. Real Estate information has been available to
consumers at most local municipalities for years and the consumer has demonstrated little
motivation to search for this information without the assistance of a real estate broker.

34
The Implications of the Internet on the Residential Consumer in Mecklenburg County
While little, if any, direct research has been done regarding the implications of the
Internet in the residential real estate consumer in Mecklenburg County, it is important to
emphasize the tools increasingly available to consumers and residents in Mecklenburg County.
The Graphical Information System (GIS) is a database of geographic information that can
perform dynamic queries and display all forms of geographical data and real estate data for
Mecklenburg County. This system allows users to research any parcel of property in
Mecklenburg County and obtain instant information regarding the property. (See Figure 2)
This system also allows users to run sales price market comparisons based on sales prices
recorded on the property at the time of deed transfer. The system will be discussed in more
detail in Chapter 3, Research Methods. This is the single most important tool available to
anyone online who wishes to use it. Couple this with the availability of residential real estate
listings available to the consumer using the CRRA's website, and anyone wishing to retrieve
relevant, timely, and valuable information needed for a real estate transaction can easily do so.
This saves the consumer time in circumventing the need to travel to the local courthouse, zoning
board utility department and tax assessor’s office. Reports on general awareness of such
information will be tested in Chapter 4 and discussed in Chapter 5.
Many local builders are using the Internet to help support their customer service efforts.
Boyd makes a brief but poignant statement regarding the usefulness of the Internet with respect
to house hunting (Boyd, 2000). Boyd features examples and comments of three Charlotte area
residential builders and how they have utilized the Internet to their advantage (Boyd, 2000).

35
The point made is that the Internet does not allow local builders to present some of the softer
emotion provoking elements consumers use to make purchasing decisions.
Boyd gives an excellent example on how consumers are using the Internet to their
advantage in Mecklenburg County. The customer has access to a password protected area of the
website where they can get weekly construction updates, view photos of their home in various
stages and download spreadsheets with individual cost information. This provides us with
insight on how consumers in the Charlotte market are working directly with the suppliers and not
involving a real estate agent. This is made possible using the Internet.
Figure 2
Real Estate Tax Information
Tax Real Estate Information*
Parcel-Id#: GIS Map#: Account Type: Owner: Add. Owner: Mailing: Address: City: State: NC ZIP: Location: Municipality
Legal Desc: Deed Book/Page: Date: Sales Price Sales Date: Qualified Sale: Neighborhood Code: Historic Desig.: Farm Desig.: Deeded Acreage: Assessed Acreage: Assessed Land Value: Total Assessed Value:
Site Location Information
Zoning from Tax: Fire District: Voter District: School District: Watershed Class:
Parks Within 3 Miles: FEMA Flood Panel#: FEMA Flood Zone: FEMA Flood Map Date: Census Tract Number: 1
Major Improvement Information
Parcel-Id# & Card#: Land Use Type: Building Type: Approximate Square Footage: Actual Year Built: Number of Stories: Bedrooms: Bathrooms: Restrooms:
Situs Location: Ext. Type: Heating Type: AC Type: Fireplace: Garage: Basement: Assessed Net Bldg Value: Total Assessed Bldg Value:
*Mecklenburg County. “GIS Real Estate System: Market Analysis Search Menu.” http://maps.co.mecklenburg.nc.us/taxgis/salessearch.htm (September 4, 2000).

36
Chapter 3
METHOD
The research conducted as a part of this study helps explain the effects of the Internet on
the real estate industry. The objectives are to sample the target population, to collect the data and
to analyze the data. This data will be used to provide recommendations for our research.
Collection of Data
Based on our objectives, the first step taken was to determine whom to include in the
population to survey. The population was confined to two groups: consumers who had
residential real estate transaction in Mecklenburg County during April, May and June 1999 and
real estate brokers in charge of their office who participated in brokering real estate transactions.
The reason for the constraint on population was to obtain current data, allow enough time for
analysis of returned data and to maintain a minimum cost for data collection. From experience in
determining whether or not this research was feasible, two sources were found to determine the
population to survey. The elected data sources were the Mecklenburg County Geographical
Information System (GIS) and BellSouth’s The Real Yellow Pages (Yellow Pages). The
Mecklenburg County GIS contained approximately 4500 consumers who transacted real estate
during April, May, and June 1999. The Yellow Pages contained approximately 950 real estate
firms. Due to the enormous size of the population in each database, a systematic sampling of the
population was performed to minimize data collection expense. Once the survey population was
assembled, a mail survey was developed as the collection method for primary data. Following
the determination of the survey method, we listed the procedures for collection of the sample
population from the two data sources. Finally, under data analysis, the format for the surveys,
assumptions and delimitation are explained. This chapter is concluded with a summary.

37
Data Sources
There were two sources used to determine the population to survey. One source, Yellow
Pages, was used to obtain a list of Mecklenburg County real estate firms. The other source,
Mecklenburg County GIS, was used to acquire the consumers who had residential real estate
transactions for April, May and June of 1999.
The Mecklenburg County GIS is a database of geographic information that can also be
used to perform dynamic queries and display all forms of geographical data (See Figure 3 for the
detail of levels).
Figure 3
Geographical Data
Mecklenburg County. “What is GIS?”
http://www.co.mecklenburg.nc.us/cogis/overview.htm (September 4, 2000)

38
The City of Charlotte manages the GIS system and they use it as a tool to answer six
questions: location, condition, trend, routing, pattern and modeling. (Figure 4 shows the
departmental makeup of the Mecklenburg County GIS).
Figure 4
Departmental Makeup of Mecklenburg County (GIS)
Mecklenburg County. “What is GIS?” http://www.co.mecklenburg.nc.us/cogis/overview.htm (September 4, 2000)
The first query is location. Location refers to actual position. By using the location
question, you are asking what is at an address. This question will reveal the type of structure and
information concerning the owner. If you use the condition question, you are inquiring
information based on criteria. For instance, list all properties valued under $100,000. The GIS
will display all structures under $100,000. The trend question will run an analysis over a specific
period of time. The trend question can be used to find information such as the number of housing
structures built in the University area during April of 1998. Routing gives calculation for routes.
It has the capability of finding the quickest, shortest or easiest routes to and from the desired

39
destination. The pattern question is used to explore distributions and explain conditions. For
example, if a painting company was negligent by using paint with lead, the pattern question
could be used to find the structures where this company performed painting services. Modeling
asks questions like, what if another lane was add to interstate 85 or what if population grows by
10 percent, how much more waste will be added to the landfill? Any combination of these
questions can be used to find the information relevant to the search.
Instrumentation
In order to get the most accurate and up-to-date survey information; the decision was
made to design survey cards and sheets to be mailed to the target audience. Mail surveys have
several advantages over other type of data collection method such as door-to-door, high-traffic
location and telephone interviews. Some of these advantages are: the benefits of low cost, ability
to survey a vast demographic area, respondent anonymity and convenience, standardization of
questions, and the absence of pressure from an interviewer.
The survey cards and letters were designed to either support or provide no support for our
six hypotheses. Null Hypothesis 1-A states of the consumers making residential real estate
transactions, 50 percent or less were relatively unaware of the resources available on the Internet.
On the consumer survey, question number 1, 2 and 5 were designed to corroborate this
hypothesis. These questions asked consumer about their awareness of Internet services available
to them, their comfort using the Internet and their knowledge of how the Internet could be used
to perform real estate transactions.
Null Hypothesis 1-B asserts of the residential real estate consumer on the Internet, 40
percent or more used at least three distinct resources on the web in completing their transaction.
Question 8 on the consumer’s survey, contained eleven boxes for consumer to check to

40
acknowledge their use of various types of real estate transactions that can be performed on the
Internet. Question 3 on the consumer’s survey seeks to find the extent consumer used the
available information on the Internet to complete a portion of their real estate transaction.
Null Hypothesis 2 declares that 50 percent or less of the residential real estate consumers
use the Internet to gather real estate information. Again, question 8 was used to test this
hypothesis. The results from consumers, who checked any box for question 8 on the consumer’s
survey, will be used to accept or reject Null Hypothesis 2. This will be determined by using the
percentage of the consumers who used these Internet tools.
Null Hypothesis 3 states that the Internet generated 20 percent or less of the residential
real estate prospects in Mecklenburg County during April, May and June of 1999. Questions 1
and 4 on the firm survey asks the broker to estimate the increase in prospects obtain for their
company from Internet usage.
Null Hypothesis 4-A shows that 50 percent or less of residential real estate brokers
believe they have changed the way they do business due to consumer’s use of the Internet.
Questions 6, 7 and 8 on the firm survey asks the brokers to rate how much they suggest to the
client to use the Internet as a research tool for real estate transactions. Question 9 asks the broker
to rate their knowledge of consumers using of the Internet for real estate transactions.
Null Hypothesis 4-B states that less than or equal to 25 percent of the consumers believe
their need for the services of a real estate broker will be reduced due to their use of the Internet.
Question 6 on the consumer survey asks them to give a rating for the future need of services
from residential real estate brokers.
Null Hypothesis 4-C states that At least 20% or less of real estate brokers do not believe
the consumers’ need for the services of a real estate broker will be reduced due to the consumers’

41
use of the Internet. Question 2 on the firm survey asks brokers to rate their belief for that
consumers will be less likely to need their services in the future.
In order to persuade respondents to fill out and return the surveys, surveys, two cover
letters and two surveys were designed. A cover letter and a survey card were sent to consumers.
Another cover letter and a survey sheet were sent to the broker.
The cover letter to the real estate firms was addressed to the broker-in-charge of the firm.
The cover letter to the consumers was addressed to the family who purchased the home. Both
cover letters explained the purpose of the survey, the objectives and the need of a returned filled-
out survey card. Both cover letters emphasized that the researchers were students doing research
and were incurring the cost of the survey as individuals. (See Appendix B for the consumer’s
cover letter and Appendix C for broker-in-charge’s cover letter.) As a measure to ensure
returned surveys, it was made clear that none of the information being taken was not for
commercial use but for research purposes. It was stated that the results of our work and the
survey may be published later and that the researchers reserved the rights to do so at our
discretion. It was made clear to the respondents that the information they provided was
anonymous. Both letters thanked the respondents in advance for their cooperation.
The surveys were designed as an easy questionnaire. Survey sheets were sent to the
broker-in-charge at real estate firms. (Refer to Appendix D for a of sample of the survey sheet.)
Survey cards were sent to consumer who had a real estate transaction in April, May or June of
1999. (See Appendix E for the detailed questionnaire card.) The surveys were formatted so that
the respondents would only need to check or circle answers. There was only one area for written
comments on the survey cards. Expecting that consumers would not want to reveal too much

42
personal information about them, only general questions were asked relating to use of the
Internet and demographics.
Two measures were taken to increase the chance of obtaining a returned and completed
survey card. A return postage was attached to each survey card or sheet. The address was also
pre-affixed so that the consumer only had to complete and mail the card. Contact information
was given in the cover letter in case the respondent had questions about the survey. Only four
respondents took advantage of this service. These respondents did say they would not have filled
out the information had they not been able to contact someone first.
The first style of survey tool, the survey sheets, was sent to real estate firms. This survey
had nine questions with a scale range from >-30 to 100, 1 to 9 and yes or no. The first scale, >-30
to 100, was used as a percentage for question relating to prospects obtained from Internet usage.
The second scale, 1 to 9, indicated usage and confidence level of the broker-in-charge
concerning the usage of the Internet for resources. A score of 9 reflected a high usage or always.
The last scale was company-related questions ranging from future Internet usage, Internet
marketing plans to how many full time agents. Most of these questions required a yes or no
answer. Some of these questions required a numeric answer.
The second style of survey tool, the survey cards, was sent to consumers. These surveys
had three main sections. Section one had six questions that required an answer to be circled.
Most of these questions had a scale from 1 to 9 with only one question asking for a yes or no
answer. Nine represented the strongest response while 1 represented the weakest response. One
of these questions, Question 4, was a yes/no question. Section two contained a statement and
depending on the consumer’s usage of the Internet, the consumer would check the appropriate
answer(s) relating to them. This area contained a list of ancillary services for the consumer to

43
select from. The consumer was asked to select which services they utilized during their
transaction process. All seven of these questions related to our six research questions. Section
three had four areas for responses relating to age, income, gender and ethnic background.
Procedures for Data Collection
Based on our six research questions, we established the input criteria for the GIS system.
Three pieces of criteria were utilized on the Mecklenburg County GIS:
Question 1. Location equaled Mecklenburg County
Question 2. Trend equaled the time period of April, May and June of 1999
Question 3. Condition equaled residential.
The Mecklenburg County GIS was researched for any individual that had any type of
residential real estate transaction during the month of April, May or June of 1999 for
Mecklenburg County. (See Figure 5 for a copy of the form used to enter criteria.)
The database contained approximately 4,560 consumers who had some form of
residential real estate transaction in Mecklenburg County in during April, May and June of 1999.
In order to generate a list of consumers while minimizing our survey costs, we used a computer
to generate a random number. This number was chosen using a Visual Basic program script that
calculated a random number between 1 and 11. The result of this script gave us the number 7.
So, the seventh person was our starting point and we chose every eleventh person thereafter. The
surveys were sent out to 453 consumers. 106 surveys were returned with no forwarding address
or due to people not living at the address of the home they had purchased (many homes are
purchase as rental property). Of the remaining 347, 113 completed responses were received.

44
Figure 5
Mecklenburg County Geographical Information System Entry Form
Search by one of the following: Choose a Sales Month and Year
APR 99 Or Street Direction: * Street Name: Street
Type: ALL Suffix Dir. * (Optional) (Example: Hawthorne Ln, N Tryon St or E 4th St ) (Note: The asterisk (*) in the first field should be used for non-directional streets.) Or 5-Digit Neighbrhood Code #:
Municipality: CHARLOTTE (Required if Sales Month and
Year are used) Sales Price Range: ALL (Required if
Searching Residential Sales by Month and Year) Qualified Sale: N/A Sort
Records by: Descending Sales Price Land-Use Type:
SINGLE FAMILY (Required) Building Type:
ALL (Optional) OPTIONAL SEARCH FIELDS
Acreage Range: ALL Total Assessed Value Range:
ALL Assessed Land Value Range:
ALL Sales Date Range:Month ALL Year
ALL to Month ALL Year ALL Year Built Range:
ALL to ALL Exterior Frame: ALL Square
Feet Range: ALL Number of Stories:
ALL Bedrooms: ALL Bathrooms: ALL
Restrooms: ALL Basement: ALL Garage: ALL

45
For the real estate firm surveys, names were obtained from the Yellow Pages. The list
totaled 472 real estate firms. A Visual Basic program script was then used to calculate a random
number between 1 and 9. This script generated the number 4. Using the same process as for the
consumer’s survey, selection commenced with the fourth real estate firm listed in the Yellow
Pages and every ninth firm thereafter. The broker survey was sent to 89 broker with 28 returned
unanswered and 27 completed responses. For a complete breakdown of both surveys sent,
returned and calculated, see Table 2.
Table 2
Surveys Sent, Calculated, etc.
Sent Returned Not answered No address
Sub Total Received back Completed
Percentage
Consumers 453 106 347 113 32.57%
Broker-in-charge 89 28 61 27 44.26%
Analysis of Data
On the consumer survey cards, there were four types of responses. The first type of
response required the consumer to use a sliding scale ranging from 1 to 9. Question 1, ‘How
comfortable would you be using the Internet to shop for a house?’ Above this scale, it was noted
that a response of 1 would be interpreted as extremely negative and a response of 9 was
extremely positive. An answer of 5 or more indicated the consumer would feel comfortable using
the Internet to shop for a house. Question 2; ‘To what extent are you aware of the Internet
services available to you as a residential real estate consumer?’ Above this scale, it was noted
that a response of 1 would be interpreted as extremely unaware and a response of 9 was

46
extremely aware. An answer of five or more indicated that the consumer were aware of Internet
service available to them as a residential real estate consumer. Question 3 asked ‘To what extent
did you use the available information via the Internet to complete a portion of your real estate
transaction?’ Above this scale, it was noted that a response of 1 would be interpreted as none, an
answer of 5 meant some and a response of 9 was many. An answer of five or more indicated that
the consumer used some of the information via the Internet to complete a portion of their real
estate transaction. Question 5; ‘To what extent are you aware of the availability of residential
real estate information via Internet?’ Above this scale, it was noted that response of 1 would be
interpreted as none, an answer of 5 meant some and a response of 9 was very. An answer with a
five or more indicated that the consumer was aware of the availability of residential real estate
information via the Internet. Question 6, ‘To what extent do you believe the information on the
Internet will replace your need for the services of a traditional residential real estate broker?’
Above this scale, it was noted that response of 1 would be interpreted as negative, an answer of 5
meant some and a response of 9 was positive. An answer of five or more indicated that the
consumer believed that the information on the Internet would replace their need for the services
of a traditional residential real estate broker.
The second type of response asked the consumer to answer with a ‘yes’ or ‘no’. Question
4, ‘Did you consider buying or selling a house using the Internet?’ A reply of ‘yes’ indicated that
the consumer consider buying or selling a house using the Internet.
The third type of response required the consumer to check boxes to indicate usage.
Question 8, ‘I used the following resources on the Internet to help complete my transaction.’
There are 11 boxes. Each box represents a particular resource. The resources listed were:
1) Search for property

47
2) Search for a REALTOR®
3) Search for lending source
4) Applied for a loan
5) Search for property tax values
6) Search for past sales information
7) Search for Closing attorney
8) Search for area/neighborhood statistics such as crime and demographics
9) Search for area/neighborhood schools and churches
10) Search for ancillary real estate services such as appraisers, inspectors, and contractors
11) Other
The eleventh area was a box labeled other. This area was left blank so that the consumer
could list any resources they felt were omitted.
The last type of response required the consumer to check boxes to indicate demographics.
Question 9, ‘Please complete the following:’ this question asked the consumer to check boxes
under four categories: age, gender, income and ethnic background. Based upon the consumer,
they would select the appropriate box under each category.
On the broker-in-charge sheets, there were also four types of responses. The first type of
response was a percentage scale ranging from less than –30 to 100. Question 1, ‘To what extent
do you estimate (in terms of percentage of prospects) the Internet has directly increased the total
number of prospects obtained for you company?’ Question 4, ‘To what extent (in terms of
percentage of prospects obtained where a prospect person interested in buying or selling a
property) has the Internet directly increased the prospects obtained for your company?’ In

48
questions 1 & 4, the respondent was asked the percentage of growth or decline in prospects due
to the Internet.
The second type of response required the brokers to use a sliding scale ranging from 1 to
9. Question 2, ‘To what extent do you believe the information on the Internet will replace your
need for the services of a traditional residential real estate broker?’ Above this scale, it was noted
that response of 1 would be interpreted as don’t believe a response of 5 as some and a response
of 9 as believe. An answer of 5 or more indicated that the broker believes the information on the
Internet will replace their need for the services of a traditional residential real estate broker.
Question 5, ‘To what extent do you use the Internet to provide your customer with information
on listings or offerings?’ Above this scale, it was noted that response of 1 would be interpreted as
didn’t use a response of 5 as some and a response of 9 as heavily used. A response of 5 indicated
that the broker used the Internet to provide their customer with information on listings or
offerings. Question 6, ‘To what extent do you recommend to clients that they use the Internet as
a research tool for gathering information about the city, demographics or crime? Question 8, ‘To
what extent do you recommend that clients use the Internet as a research as a tool for gathering
information about ancillary real estate services such as attorneys, lenders, appraisers, or
contractors? Above questions 6 & 8 scale, we noted that response of 1 would be interpreted as
none, a response of 5 as some and a response of 9 as many. A response of 5 indicated that the
broker recommended to clients that they use the Internet as a research for gathering information
relating to each question.
The third type of response required the brokers to check boxes to indicate demographics.
Question 3, ‘Please complete the following:’ this question asked the broker to check boxes under

49
four categories: age, gender, income and ethnic background. According to the broker’s
demographic; he or she would select the appropriate box under each category.
The last type of response asked the broker questions relating to company resources and
employment. The question are listed:
1) Does your firm have a web site?
2) If yes, how long has it been up and running?
3) How many full-time agents do you retain?
4) How long have you been in business?
5) Do you have an Internet Marketing Plan?
6) Do you have plans for future Internet usage?
Question 1, 5, and 6 required only a ‘yes’ or ‘no’ answer. The other question asked for actual
figures.
The responses from the surveys and sheets ere collected and stored in an Access
database. The data was analyzed using Microsoft Excel. Further explanation of the analysis will
be discussed in the following Chapter 4.
Research Assumptions and Delimitations
Research requires certain assumptions and limitations. As with our research, it is not
improbable that there are other assumptions or limitations. These assumptions were based on the
researchers’ focus on the objectives of the research.
Research Assumptions
These assumptions made were the bases for the research:

50
1. The Mecklenburg County Geographical Information System contained the most
comprehensive database of consumers who recently transacted real estate to use for
the research.
2. Our time period was realistic enough to gain data to form conclusions for the
research.
3. The consumer accurately answered the survey responses.
4. The research base on the study of Mecklenburg County data can be applied to other
similar counties.
Delimitation
The data obtained from Mecklenburg County Geographical Information System was the
data collected and recorded by Mecklenburg County employees at the courthouse by the Register
of Deeds. Mecklenburg County Government structured the completeness of the data collected.
All deed transfers are recorded at the county register of deed’s office. Future representations of
this research may provide other data not available for the time frame of this study.
Summary
The topic of this research deals with the effects of the Internet on residential real estate
transactions. In order to learn the effect on today’s world, historical data is necessary. A survey
of actual participants was the best way to obtain this data. The surveys narrowed the scope of the
research to the residential real estate transaction. The surveys were sent to consumers and
brokers-in-charge who had some type of residential real estate transaction during the month of
April, May and June of 1999. The survey responses were collected, tabulated and analyzed to
draw conclusions. In Chapter 5, recommendations are given based on the six hypotheses and
tabulation of data. This methodology will adequately assist us in analyzing our hypothesis.

51
Chapter 4
FINDINGS
In this chapter, the results of the data collected in the Consumer Questionnaire and the
Firm Questionnaire are presented. First, to be addressed are the demographics for each survey in
tabulated and cross-tabulated form. Then, the results of the questions on each survey will be
described in tabulated form with the percentages for each category plus the mean and standard
deviation for the answers of each question. Calculated is the mean to show the central tendency
of the results, and the standard deviation to show the dispersion of the results. Finally, the seven
null hypotheses and their alternative hypotheses for the study were tested
Demographics
Demographics of the Respondents on the Consumer Questionnaire
Tables in this section present the demographic information for the 113 respondents of the
Consumer Questionnaire. This section shows the age, income, gender and race in tables and
cross-tabulated tables.
Age-Consumers
The age of the Respondents on the Consumer Questionnaire varied. Of the respondents,
82.3 percent (Table 3), were between ages 22 and 50.
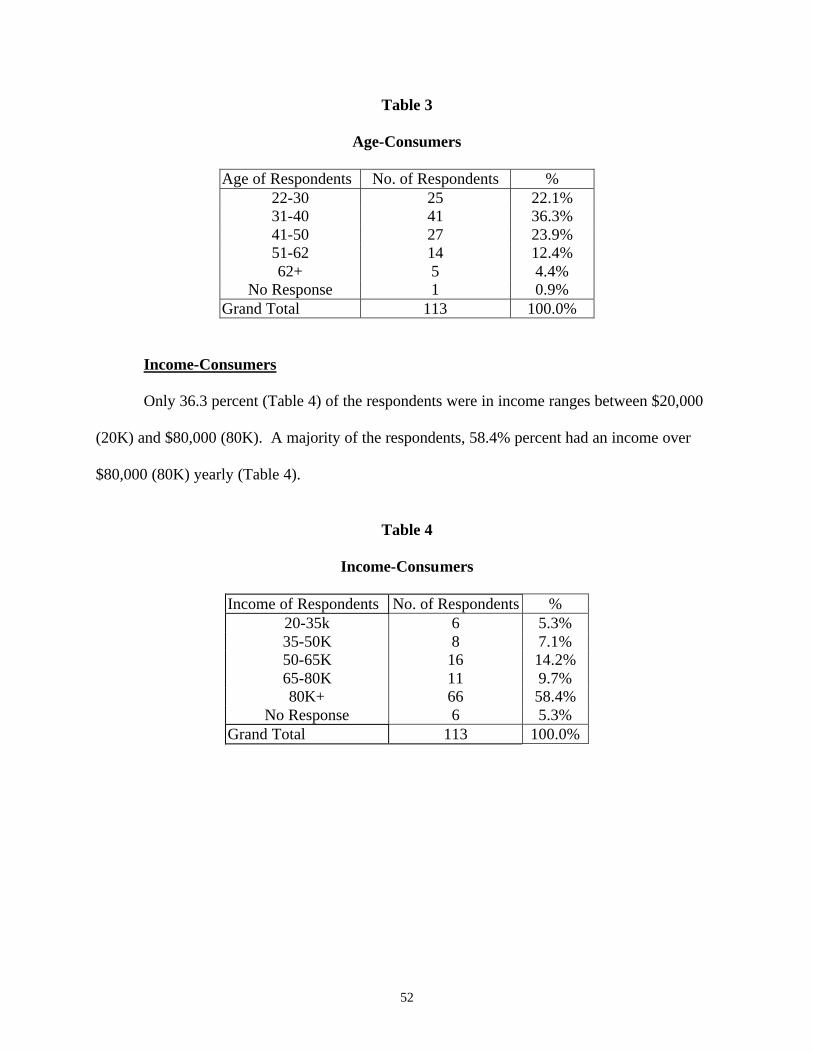
52
Table 3
Age-Consumers
Age of Respondents No. of Respondents % 22-30 25 22.1% 31-40 41 36.3% 41-50 27 23.9% 51-62 14 12.4% 62+ 5 4.4%
No Response 1 0.9% Grand Total 113 100.0%
Income-Consumers
Only 36.3 percent (Table 4) of the respondents were in income ranges between $20,000
(20K) and $80,000 (80K). A majority of the respondents, 58.4% percent had an income over
$80,000 (80K) yearly (Table 4).
Table 4
Income-Consumers
Income of Respondents No. of Respondents % 20-35k 6 5.3% 35-50K 8 7.1% 50-65K 16 14.2% 65-80K 11 9.7% 80K+ 66 58.4%
No Response 6 5.3% Grand Total 113 100.0%

53
Race-Consumers
The respondents to the Consumer Questionnaire were predominately white. As shown in
Table 5, 98 of the 113 respondents, 86.7 percent were white.
Table 5
Race-Consumers
Race of Respondents No. of Respondents % Asian 5 4.4% Black 7 6.2% White 98 86.7% Other 2 1.8%
No Response 1 0.9% Grand Total 113 100.0%
Gender-Consumers
From the Consumer Questionnaire, the male and female respondents were close to being
equal with 53 female respondents and 58 male respondents (Table 6).
Table 6
Gender-Consumers
Gender of Respondents No. of Respondents % Female 53 46.9% Male 58 51.3%
No Response 2 1.8% Grand Total 113 100.0%
Several cross tabulations between variables show demographically the characteristics of
the 113 respondents in more detail. Cross tabulations show income by age, income by race and
income by gender. These cross tabulations are as shown below.

54
Age versus Income-Consumer
Shown in Table 7 one can see that 42.4 percent of the respondents were between the ages
of 31 and 50 and had an income of greater than $80,000 (80K).
Table 7
Cross Tabulation of Age by Income
INCOME AGE 20-35K 35-50K 50-65K 65-80K 80K+ No
Response Grand Total
22-30 4.4% 3.5% 5.3% 0.9% 4.4% 22.1% 31-40 0.9% 1.8% 2.7% 4.4% 26.5% 3.5% 36.3% 41-50 1.8% 4.4% 15.9% 23.9% 51-62 0.9% 3.5% 8.0% 1.8% 12.4% 62+ 0.9% 0.9% 2.7% 4.4% No Response 0.9% 0.9% Grand Total 5.3% 7.1% 14.2% 9.7% 58.4% 5.3% 100.0%
Race versus Income-Consumer
From Table 8, one can see that the majority of the respondents at 55.8 percent was white
and had an income of greater than $80,000 (80K).

55
Table 8
Cross Tabulation of Race by Income
INCOME RACE 20-35K 35-50K 50-65K 65-80K 80K+ No
Response Grand Total
Asian 1.8% 0.9% 0.9% 0.9% 4.4% Black 2.7% 0.9% 0.9% 0.9% 0.9% 6.2% Other 0.9% 0.9% 1.8% White 2.7% 6.2% 10.6% 8.0% 55.8% 3.5% 86.7% No Response 0.9% 0.9%
Grand Total 5.3% 7.1% 14.2% 9.7% 58.4% 5.3% 100.0%
Gender versus Income-Consumer
One can see from Table 9, that 57.5 percent had an income of greater than $80,000
(80K). Of that, 57.5 percent male and female were almost equal with 28.3 percent female
respondents and 29.2 percent male respondents.
Table 9
Cross Tabulation of Gender by Income
INCOME GENDER 20-35K 35-50K 50-65K 65-80K 80K+ No
Response Grand Total
Female 3.5% 2.7% 4.4% 5.3% 28.3% 2.7% 46.9% Male 1.8% 4.4% 9.7% 4.4% 29.2% 1.8% 51.3%
No Response 0.9% 0.9% 1.8% Grand Total 5.3% 7.1% 14.2% 9.7% 58.4% 5.3% 100.0%

56
Age versus Race-Consumer
Looking at a cross-tabulation of age by race in Table 10 shows that 56.6 percent of the
respondents between the ages of 31 and 50 were white.
Table 10
Cross Tabulation of Age by Race
AGE RACE 22-30 31-40 41-50 51-62 62+ No
Response Grand Total
Asian 1.8% 0.9% 1.8% 4.4% Black 4.4% 1.8% 6.2% Other 0.9% 0.9% 1.8% White 14.2% 33.6% 23.0% 10.6% 4.4% 0.9% 86.7% No Response 0.9% 0.9% Grand Total 22.1% 36.3% 23.9% 12.4% 4.4% 0.9% 100.0%
Gender versus Age -Consumer
A cross-tabulation of age by gender in Table 11 shows that 60.2 percent of the
respondents were between the ages of 31 and 50 and of that 60.2 percent, 28.3 percent were
female and 31.9 percent were male.
Table 11
Cross Tabulation of Gender by Age
AGE GENDER 22-30 31-40 41-50 51-62 62+ No
Response Grand Total
Female 14 12.4% 15.9% 12.4% 5.3% 0.9% 46.9% Male 10 8.8% 20.4% 11.5% 7.1% 3.5% 51.3% No Response 1 0.9% 0.0% 0.0% 0.0% 0.0% 0.9% 1.8% Grand Total 25 22.1% 36.3% 23.9% 12.4% 4.4% 0.9% 100.0%

57
Demographics of the Broker’s on the Real Estate Firm’s Questionnaire
The demographics for the data taken from 27 brokers on the Real Estate Firm’s
Questionnaire are as shown below. The person who answered the questionnaire as broker in
charge for the firm gave the response for gender, age, ethnicity and salary
.
Age-Brokers
Demographics of the brokers on the Real Estate Firm’s Questionnaire show that that 77.8 percent
of the 27 brokers were over age 51 (Table 12).
Table 12
Age-Brokers
Age of Brokers No. of Brokers % 31-40 3 11.1% 41-50 3 11.1% 51-62 12 44.4% 62+ 9 33.4%
Grand Total 27 100.0%
Income-Brokers
Of the 27 brokers on the Real Estate Firm Questionnaire 55.6% (Table 13) of the brokers
reported that their incomes are over $80,000 (80K).

58
Table 13
Income-Brokers
Income of Brokers No. of Brokers % 35-50K 12 44.4% 80K+ 15 55.6%
Grand Total 27 100.0%
Ethnicity -Brokers
Of the 27 brokers on the Real Estate Firm Questionnaire, 21 brokers or 77.8 percent
reported they were Caucasian (Table 14)
Table 14
Ethnicity-Brokers
Ethnicity of Brokers No. of Brokers % Asian & African 3 11.1%
Caucasian 21 77.8% No Response 3 11.1%
Grand Total 27 100.0%
Gender-Brokers
Shown in Table 15 is the gender of the brokers in the Real Estate Firms Questionnaire.
Of the 27 brokers, 12 were female and 15 were male.

59
Table 15
Gender-Brokers
Gender of Brokers No. of Brokers % Female 12 44.4% Male 15 55.6%
Grand Total 27 100.0%
Consumer and Real Estate Firm Questionnaire Responses
Consumer Questionnaire Responses
The following tables will show a summary and tabulation of the responses from the
questions on the Consumer Questionnaire. Each table will include the survey values (Response
Values), the percent of total for each response value, the average response for all responses
(Mean), and the standard deviation for the responses (Standard Deviation). The percentages, the
mean, and the standard deviation will be used to help validate the information in our hypotheses
in a later section. A summary table shows the data for each of the Questions 1, 2, 3, 4, 5, 6, and
8 from the Consumer Questionnaire.
Consumer Question 1
Of the 113 respondents on the Consumer Questionnaire, 60.18 percent answered with a
value greater than 5 indicating that they would feel comfortable in using the Internet to shop for
a house (Table 16)

60
Table 16
1. How comfortable would you feel using the Internet to shop for a house?
Summary for Question 1 Response
Value Response
% Mean Standard
Deviation 1 6.19% 6.0442 2.3844 2 4.42% 3 6.19% 4 6.19% 5 16.81% 6 10.62% 7 16.81% 8 14.16% 9 18.58%
Consumer Question 2
Responses for Question 2 in Table 17show that of the 113 respondents 58.41 percent
answered in a positive manner. By responding at a level greater than 5, they show that they were
aware of the available Internet services that could help in their search for information about
residential real estate.

61
Table 17
2. To what extent are you aware of the Internet services available
to you as a residential real estate consumer?
Summary for Question 2 Response
Value Response
% Mean Standard
Deviation 1 4.42% 5.8053 2.4233 2 5.31% 3 13.27% 4 9.73% 5 8.85% 6 14.16% 7 14.16% 8 12.39% 9 17.70%
Consumer Question 3
For consumer Question 3, there was a very negative response as shown in Table 18. Of
the 113 respondents, 83.19 percent answered question 3 with a response of 4 or less. These
responses indicated very strongly that most of the consumers did not use any of the services on
the Internet to complete a part of their real estate transaction.

62
Table 18
3. To what extent did you use the available information via the
Internet to complete a portion of your real estate transaction?
Summary for Question 3 Response
Value Response
% Mean Standard
Deviation 1 51.33% 2.4602 2.0790 2 15.93% 3 9.73% 4 6.19% 5 4.42% 6 5.31% 7 3.54% 8 1.77% 9 1.77%
Consumer Question 4
In Question 4, which was a polling of the 113 respondents, 93 responded with an answer
of “No” (Table 19) to the fact that they did not consider buying a home using the services on the
Internet.
Table 19
4. Did you consider buying or selling a house using the Internet?
Summary for Question 4 Number of Responses % YES 20 17.70% NO 93 82.30%
TOTAL 113 100%

63
Consumer Question 5
In Question 5, awareness of real estate information on the Internet for the consumer was
the issue. By responding at a level of 5 or greater, 71.68 percent of the respondents (Table 20)
indicated that they at least had some awareness of the real estate information provided by the
Internet.
Table 20
5. To what extent are you aware of the availability of
residential real estate information via Internet?
Summary for Question 5 Response
Value Response
% Mean Standard
Deviation 1 3.54% 5.9204 2.4790 2 8.85% 3 9.73% 4 6.19% 5 12.39% 6 15.93% 7 9.73% 8 11.50% 9 22.12%
Consumer Question 6
By responding to Question 6, respondents indicated whether or not they believed that the
services provided by the real estate broker were more important than the services provided by the
Internet. In their response, 35.39 percent responded with a value of 5 or greater (Table 21), this
shows that generally consumers had at least some belief that the need for a broker could be
replaced by services provided on the Internet.

64
Table 21
6. To what extent do you believe the information on the Internet will replace the need for
the services of a traditional residential real estate broker?
Summary for Question 6
Response Value
Response %
Mean Standard Deviation
1 21.24% 3.5135 1.9599 2 15.93% 3 13.27% 4 14.16% 5 21.24% 6 6.19% 7 5.31% 8 2.65%
Consumer Question 8
In Question 8, the consumers were able to pick the services that helped them in their
search to retrieve real estate information on the Internet. Listed below are the services that the
respondents could chose from with the number of respondents that indicated they used each
service with the percentage of respondents out of 113 total respondents.
• Search for property – 49 respondents – 43.4%
• Search for a Realtor – 8 respondents – 7.1%
• Search for lending source – 18 respondents – 15.9%
• Applied for a loan – 3 respondents – 2.7%
• Search for property tax values – 29 respondents – 25.7%
• Search for past sales information – 14 respondents – 12.4%
• Search for closing attorney – 0 respondents – 0%

65
• Search for area/neighborhood statistics such as crime and demographics – 19
respondents – 16.8%
• Search area/neighborhood schools and churches – 25 respondents – 22.1%
• Search for ancillary real estate services such as appraisers, inspectors, and
contractors– 7 respondents – 6.2%
• Other: _______________________________– 0 respondents – 0%
Of the 113 respondents, 60.18 percent (Table 22) responded that they used at least one of
these services. However, only 27.43 percent of the respondents used three or more of these
Internet services.
Table 22
8. I used the following resources on the Internet
to help complete my transaction:
Summary for Question 8
Number of Services Used
Response %
Mean Standard Deviation
0 39.82% 1.5221 1.6480 1 17.70% 2 15.04% 3 14.16% 4 6.19% 5 5.31% 6 1.77%
7or more 0.00%

66
Real Estate Broker Questionnaire Responses
The following tables will show a summary and tabulation of the responses of the Brokers
from the questions on the Real Estate Broker Questionnaire. Each table will include the
respondents survey values (Response Values), the percent of total for each response value
(percentage), the average response for all responses (Mean), and the standard deviation for the
responses (Standard Deviation). The percentages, the mean, and the standard deviation will be
used to help validate the information in our hypotheses in a later section. A summary table
shows the data for Questions 1, 2, 4, 5, 6, 7, 8, and 9 from the Real Estate Broker Questionnaire.
Shown at the end of this section is data for Question 10 with its four tables of summarized
information about the real estate firms longevity, employment, and web site usage. Data from
Question 3 on the Firm Questionnaire was used in the demographic section for the brokers.
Real Estate Broker Question 1
In Question 1 on the Real Estate Broker Questionnaire, 44.44 percent of the respondents
(Table 23) indicated that their firms had no gain or in fact a loss of prospects due to the Internet

67
Table 23
1. To what extent do you estimate (in terms of percentage of
prospects) the Internet has directly increased the
total number of prospects obtained for your company?
Summary for Question 1 Response
Value Response
% Mean Standard
Deviation -30 25.93% 8.8889 36.7249 -20 3.70% -10 3.70% 0 11.11%
10 25.93% 20 7.41% 30 11.11% 90 7.41% 100 3.70%
Real Estate Broker Question 2
A significant percentage of the real estate brokers believed that the information on the
Internet would replace the need for the real estate broker. Of the brokers, 33.33 percent that
indicated a value of 5 or greater on the questionnaire (Table 24) believed the services provided
on the Internet could replace at least some the services they provide. .

68
Table 24
2. To what extent do you believe the information on the Internet
will replace your need for the services of a traditional
residential real estate broker?
Summary for Question 2
Response Value
Response %
Mean Standard Deviation
1 18.52% 3.5185 1.6955 2 11.11% 3 14.81% 4 22.22% 5 25.93% 6 3.70% 7 3.70%
Real Estate Broker Question 4
Question 4 received an almost the identical response from the respondents as Question 1.
For this Question 4, 44.44 percent of the respondents (Table 25) indicated that their firms had no
gain or in fact a loss of prospects due to the Internet

69
Table 25
4. To what extent (in terms of percentage of prospects obtained, where a
prospect is the person interested in buying or selling a property) has the
Internet directly increased the prospects obtained for your company?
Summary for Question 4 Response
Value Response
% Mean Standard
Deviation -30 25.93% 7.0370 33.0285 -20 3.70% -10 3.70% 0 11.11%
10 25.93% 20 7.41% 30 11.11% 50 3.70% 90 7.41%
Real Estate Broker Question 5
The real estate broker gave mixed responses on Question 5, however 55.56 percent of
respondents (Table 26) indicated a response of 5 or greater. This indicates that the real estate
brokers are using at least some of the services provided on the Internet for gathering property
information on listings for clients.

70
Table 26
5. To what extent do you use the Internet to provide your
customer with information on listings or offerings?
Summary for Question 5 Response
Value Response
% Mean Standard
Deviation 2 7.41% 4.9630 1.5059 3 3.70% 4 33.33% 5 18.52% 6 14.81% 7 22.22%
Real Estate Broker Question 6
For Question 6, 66.67 percent of the respondents answered this question at a value of 5 or
greater (Table 27). This shows that most of the real estate brokers were somewhat likely to
recommend that their clients use some of the services provided by the Internet for gathering
general information about the city, certain demographics, and crime statistics.
Table 27
6. To what extent do you recommend to clients that they use the Internet as a
research tool for gathering information about the city, demographics or crime?
Summary for Question 6
Response Value
Response %
Mean Standard Deviation
1 11.11% 4.8889 2.2758 2 11.11% 3 11.11% 5 22.22% 7 44.44%

71
Real Estate Broker Question 7
Question 7 was more specific than the previous question. This question asks to what
extent did brokers recommend using the Internet to search for information on a specific property.
Response to this question was negative. Of the respondents 85.19 percent answered with a value
of 5 or less (Table 28). This shows that brokers were at least somewhat reluctant to recommend
that clients use the Internet for finding specific information on properties.
Table 28
7. To what extent do you recommend to clients that they use the Internet
as a research tool for gathering information about a specific property?
Summary for Question 7 Response
Value Response
% Mean Standard
Deviation 1 11.11% 3.6667 1.9612 2 33.33% 3 3.70% 4 7.41% 5 29.63% 6 3.70% 7 11.11%
Real Estate Broker Question 8
Question 8 drew a similar response to Question 7. Response shows that 88.89 percent
indicated a level 5 answer or fewer (Table 29). Real estate brokers are at least somewhat
reluctant to suggest to consumers that they should use the Internet to search for professional
services. This response showed a greater negative percentage than Question 7.

72
Table 29
8. To what extent do you recommend that clients use the Internet as a
research tool for gathering information about ancillary real estate
services such as attorneys, lenders, appraisers, or contractors?
Summary for Question 8
Response Value
Response %
Mean Standard Deviation
1 37.04% 2.6296 1.8218 2 29.63% 4 11.11% 5 11.11% 6 11.11%
Real Estate Broker Question 9
Question 9 is subjective in its phrasing of the question, to what extent, based on your
knowledge, did your clients use the Internet for any phase of the transaction. From the brokers,
55.56 percent answered at a level of 5 or greater (Table 30). This shows that real estate brokers
believe that their clients are using the Internet for at least some portion of their real estate
transaction.

73
Table 30
9. Based on your knowledge, to what extent did your clients
use the Internet for any phase of the transaction?
Summary for Question 9
Response Value
% Mean Standard Deviation
1 11.11% 4.5556 2.5012 2 22.22% 4 11.11% 5 22.22% 6 11.11% 7 11.11% 9 11.11%
Real Estate Broker Question 10
Question 10 shown as “Demographics” was a series of questions used to find information
about real estate firms. Question 10 is used to solicit information about the firm’s use of the
internet, the number of agents the firm employs, and how long the firm has been in business.
Listed below are the questions used in Question 10.
• Does your firm have a web site? ___ yes ___ no
• If yes, how long has it been up and running? ______
• How many full-time agents do you retain? ______
• How long have you been in business? ____
• Do you have an Internet Marketing Plan? ___ yes ___ no
• Do you have plans for future Internet usage? ___ yes ___ no
From the number of brokers responding on the Real Estate Firm Questionnaire, Table 31
shows that 14 out of 27 respondents indicated their firms had a web site.
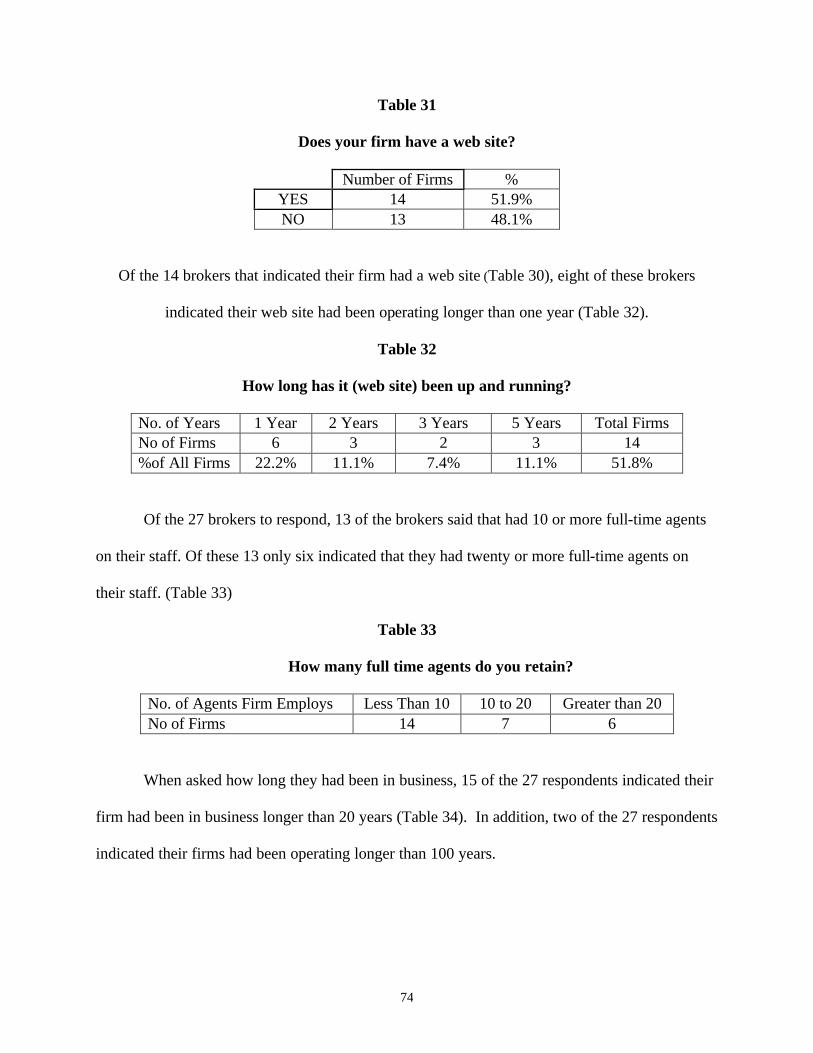
74
Table 31
Does your firm have a web site?
Number of Firms % YES 14 51.9% NO 13 48.1%
Of the 14 brokers that indicated their firm had a web site (Table 30), eight of these brokers
indicated their web site had been operating longer than one year (Table 32).
Table 32
How long has it (web site) been up and running?
No. of Years 1 Year 2 Years 3 Years 5 Years Total Firms No of Firms 6 3 2 3 14 %of All Firms 22.2% 11.1% 7.4% 11.1% 51.8%
Of the 27 brokers to respond, 13 of the brokers said that had 10 or more full-time agents
on their staff. Of these 13 only six indicated that they had twenty or more full-time agents on
their staff. (Table 33)
Table 33
How many full time agents do you retain?
No. of Agents Firm Employs Less Than 10 10 to 20 Greater than 20 No of Firms 14 7 6
When asked how long they had been in business, 15 of the 27 respondents indicated their
firm had been in business longer than 20 years (Table 34). In addition, two of the 27 respondents
indicated their firms had been operating longer than 100 years.

75
Table 34
How long have you been in business?
No. of Years 10 years or less
10 to 20 years
20 to 50 years
50 to 100 years
Over 100 years
No of Firms 6 6 10 3 2
The answers to the last two Questions in this section are presented in a cross tabulated.
Table (Table 35). Of the 27 respondents, only 12 of these indicated yes to both questions
indicating that they had an Internet Marketing Plan and that their firm had plans to use the
Internet in the future.
Table 35
Do you have an Internet Marketing Plan? &
Do you have plans for future Internet usage?
(The Answers for the Questions Above are in the Cross-Tabulated Table below)
Does Your Firm have Plans for future Internet Usage?
YES % NO % TOTAL % YES 12 firms 44.5% 3 firms 11.1% 15 firms 55.6%
Does Your Firm have an Internet Marketing Plan?
NO 9 firms 33.3% 3 firms 11.1% 12 firms 44.4%
TOTAL 21 firms 77.8% 6 firms 22.2% 27 firms 100%
Now, having presented the data that was gathered from the Consumer and Broker
Questionnaires with its tabulations and statistics, our research hypothesis will be tested by using
this data.
.

76
Hypothesis Testing
Null Hypothesis 1A: Of the consumers making residential real estate transactions, less
than or equal to 50% were aware of the resources available on the Internet.
The data collected in the Consumer Questionnaire for Question1 proves this Null
Hypothesis 1A to be false. For Question 1 (How comfortable would you feel using the Internet
to shop for a house?), 60.18 percent of the respondents answered greater than 5 to show that they
would feel comfortable using the Internet to shop for a house. The average (Mean) response for
Question 1 was 6.044. This shows that most of the consumer respondents by indicating a
response greater than 5 would feel comfortable using the Internet to shop for a house. The
percentages given show Null Hypothesis 1A to be false.
Shown below is the Hypothesis test statistics for Null Hypothesis 1A. Calculated were
the relevant statistics by using the statistical program PHStat®. The statistical evidence shown
below rejects Null Hypothesis 1A.

77
Table 36
Hypothesis Test for Null Hypothesis 1A Consumer Question 1
Null Hypothesis µµ= 5 Level of Significance 0.05 Population Standard Deviation 2.3844 Sample Size 113 Sample Mean 6.044247788 Standard Error of the Mean 0.224305484 Z Test Statistic 4.655471501
Upper-Tail Test
Upper Critical Value 1.644853 p-Value 1.61798E-06
Reject the null hypothesis
Null Hypothesis 1B: Of the residential real estate consumers using the Internet to gather
information, more than 40% of these consumers used less than three distinct resources in
completing their real estate transaction.
From the data collected in Question 8 on the Consumer Questionnaire, the Null
Hypothesis 1B is true. Question 8 on the Consumer Questionnaire lists ten services a consumer
might use on the Internet to find information pertaining to real estate. The questions ask the
respondents if they used the Internet to find information other than these. (For Question 8 see
Table 22) From the Consumer Questionnaire, only 27.43 percent of the respondents answered
that they used 3 or more of these Internet services to help them complete their real estate
transaction. The average (Mean) use of services from this list was only 1.5221. Based on these
percentages and statistics Null Hypothesis 1B is true

78
Null Hypothesis 2: Less than or equal 50% of the residential real estate consumers use
the Internet to gather real estate information.
Null Hypothesis 2 is False. To get a supporting answer to this hypothesis Question 8 had
to be investigated (See Table 22). Consumer Question 8 shows that 60.18 percent of the
respondents used at least one or more of the available resources to help them to complete their
real estate transactions. The average (Mean) for Question 8 was 1.5221. This shows that there is
a high probability that 50 percent or more of the residential real estate consumers use the
Internet. By finding that over 50 percent of our respondents used the Internet, this disproves
Null Hypothesis 2.
Shown below is the Hypothesis test statistics for Null Hypothesis 2. Calculated were the
relevant statistics by using the statistical program PHStat®. The statistical evidence shown
below rejects Null Hypothesis 2.
Table 37
Hypothesis Test for Null Hypothesis 2 Consumer Question 8
Null Hypothesis µµ= 0 Level of Significance 0.05 Population Standard Deviation 1.648 Sample Size 113 Sample Mean 1.522123894 Standard Error of the Mean 0.155030799 Z Test Statistic 9.818203238
Upper-Tail Test
Upper Critical Value 1.644853 p-Value 0
Reject the null hypothesis

79
Null Hypothesis 3: The Internet did not provide 20 percent or more of residential real
estate firms prospects during April, May and June of 1999.
Null Hypothesis 3 is proved true by information gathered on the Real Estate Firm
Questionnaire from Question 1-(To what extent do you estimate, in terms of percentage of
prospects, the Internet has directly increased the total number of prospects obtained for your
company?). Brokers on the Real Estate Firm Questionnaire responded with the percentage of
increase of prospects for their firms. Question 1 shows 70.37 percent of the responding firms
indicated less than or equal to a 20 percent gain in prospects. By showing a majority of the firms
had less than or equal to a 20 percent increase in prospects, Null Hypothesis 3 is true.
Null Hypothesis 4A: Less than or equal to 50% of residential real estate brokers believe
they have changed the way they do business due to consumers use of the internet.
Null Hypothesis 4A is false as supported by Question 6 from the Real Estate Firm
Questionnaire. Question 6 (To what extent do you recommend to clients that they use the
Internet as a research tool for gathering information about the city, demographics or crime?)
provides data to disprove this hypothesis. Question 6 shows that 66.66 percent of the real estate
firm respondents answered with a 5 or greater. This shows that real estate firms were likely to
recommend at least some use of the Internet for demographics and background information
searches to their clients. Questions 6 shows that real estate firms have become accustomed to
their client’s broader use of the Internet. This data proves Null Hypothesis 4A to be false.

80
Shown below is the Hypothesis test statistics for Null Hypothesis 4A. The mean of
4.8889 and standard deviation of 2.2758 are the results from the Real Estate Broker Question 6.
The test shows that our data is not statistically significant and that we cannot reject the Null
Hypothesis 4A based on the data collected (See Table 38).
Table 38
Hypothesis Test for Null Hypothesis 4A
Real Estate Broker Question 6
Null Hypothesis µµ= 5 Level of Significance 0.05 Sample Size 27 Sample Mean 4.888888889 Sample Standard Deviation 2.275848672 Standard Error of the Mean 0.437987281 Degrees of Freedom 26 t Test Statistic -0.253685702
Upper-Tail Test
Upper Critical Value 1.705616341 p-Value 0.599133123
Do not reject the null hypothesis
Null Hypothesis 4B: Less than or equal to 25 percent of the consumers believe their need
for the services of a real estate broker will be reduced due to their use of the Internet.
The answer to Null Hypothesis 4B is false. Using the Consumer Questionnaire responses
to Question 6, (To what extent do you believe the information on the Internet will replace your
need for the services of a traditional residential real estate broker?), this illustrates how the
consumer’s need for a broker has been influenced by the Internet. Of the consumer, respondents
answering Question 6, 35.39 percent answered at 5 or greater. This shows that the use of the

81
Internet by consumers has at least some effect on the consumer’s need for a real estate broker.
The data for Question 6 proves Null Hypothesis 4B to be false.
Table 39 details the Hypothesis test statistics for Null Hypothesis 4B. This results in a
mean of 3.5135 and standard deviation of 1.9599 from the Consumer Question 6. The test shows
that our data is not statistically significant and that we cannot reject the Null Hypothesis 4B
based on the data that we collected.
Table 39
Hypothesis Test for Null Hypothesis 4B Consumer Question 6
Null Hypothesis µµ= 5 Level of Significance 0.05 Population Standard Deviation 1.9599 Sample Size 113 Sample Mean 3.513274336 Standard Error of the Mean 0.184371883 Z Test Statistic -8.063733144
Upper-Tail Test
Upper Critical Value 1.644853 p-Value 1
Do not reject the null hypothesis
Null Hypothesis 4C: At least 20% or less of Real Estate Brokers do not believe the
consumers’ need for the services of a Real Estate Broker will be reduced due to the consumers’
use of the Internet.
Null Hypothesis 4C is false. Question 2 on the Real Estate Firm Questionnaire (To what
extent do you believe the information on the Internet will replace your need for the services of a
traditional residential real estate broker?), presents information needed to answer this hypothesis.

82
For the responding real estate brokers, 33.33 percent answered with a 5 or greater. The result
supports the fact that brokers believe the Internet would somewhat replace the services of the
real estate broker. This shows that the Null Hypothesis 4C would be false as supported by the
response to Question 2.
Shown in Table 40 is the Hypothesis test statistics for Null Hypothesis 4C. This is the
mean of 3.5185 and standard deviation of 1.6955 from the Real Estate Broker Question 2. The
test shows that our data is not statistically significant and that we cannot reject the Null
Hypothesis 4C based on the data that we collected.
Table 40
Hypothesis Test for Null Hypothesis 4C
Real Estate Broker Question 2
Null Hypothesis µµ= 5 Level of Significance 0.05 Sample Size 27 Sample Mean 3.518518519 Sample Standard Deviation 1.695477477 Standard Error of the Mean 0.326294793 Degrees of Freedom 26 t Test Statistic -4.540316043
Upper-Tail Test
Upper Critical Value 1.705616341 p-Value 0.999943446
Do not reject the null hypothesis
Summary for Chapter 4: Findings
The results of the data collected in the Consumer Questionnaire and the Firm
Questionnaire will be presented in this chapter. Tabulated and cross-tabulated forms illustrated

83
the demographics for both the Consumer and Real Estate Firm Questionnaires. The results of the
questions on each survey were presented in tabulated form with the results for each category, the
percentages for each category, the cumulative percentages, and the mean and standard deviation
for the answers of each question. Seven hypotheses and their null hypotheses for the study and
the results of the question with their percentages and statistics that supported the hypothesis were
illustrated. Chapter 5 will report the conclusions and recommendations for these hypotheses.

84
Chapter 5
SUMMARY, CONCLUSIONS AND RECOMMENDATIONS
Summary
The Research Problem
The objective of this study is to assess the impact of the Internet on the residential real
estate market. The scope of this study includes the attitudes and behaviors of consumers and real
estate firms in Mecklenburg County during April, May and June of 1999.
In an attempt to increase productivity and profitability, brokerage firms are using the
Internet to deliver market information to consumers about the residential real estate market. This
study examines the extent that this phenomenon has affected the attitudes and behaviors of the
residential real estate brokerage firms.
Both buyers and sellers in the consumer area have opportunities to access real estate
information using the Internet, which can be crucial to the entire transaction process. This has
created an opportunity for consumers to increase their market knowledge in order to save time,
money and reduce the risks associated with real estate transactions. This study also examines if
real estate consumers in Mecklenburg County believe that these changes have affected their
market transactions.
This study attempts to examine the extent that the Internet has affected residential real
estate sales in Mecklenburg County during April, May and June of 1999. The purpose of the
study is to answer the following questions, prove or disprove the following hypothesis:

85
Question 1
This question asks: “To what extent was the Mecklenburg County Consumer informed of
pertinent information on the Internet in relation to residential real estate in April, May and June
of 1999?” This question will be answered by Hypothesis 1-A and 1-B.
Null Hypothesis 1-A: Of the consumers making residential real estate transactions, less
than 50 percent were relatively aware of the resources available on the Internet.
Alternate Hypothesis 1-A: Of the consumers making residential real estate transactions,
50 percent or more were aware of the resources available on the Internet.
Null Hypothesis 1-B: Of the residential real estate consumers on the Internet, more than
40 percent used less than three distinct resources on the web in completing their transaction.
Alternate Hypothesis 1-B: Of the residential real estate consumers on the Internet, 40
percent or more used at least three distinct resources on the web in completing their transaction.
Question 2
Question 2 asks: “To what extent do consumers use the Internet to gather real estate
information in Mecklenburg County during April, May, and June of 1999?” This question is
addressed by Hypothesis 2.
Null Hypothesis 2: Less than 50 percent of all residential real estate consumers use the
Internet to gather real estate information.
Alternative Hypothesis 2: 50 percent or more of all residential real estate consumers use
the Internet to gather real estate information.

86
Question 3
Question 3 asks: “To what extent has using the Internet generated prospects for
residential real estate firms in Mecklenburg County during April, May, and June of 1999?” This
question is ultimately addressed by Hypothesis 3.
Null Hypothesis 3: The Internet provided less than 20 percent or more of residential real
estate firms’ prospects during April, May and June of 1999.
Alternate Hypothesis 3: The Internet provides 20 percent or more of residential real
estate firm's prospects in Mecklenburg County during April, May and June of 1999.
Question 4
Question 4 asks: “To what extent has the use of the Internet changed the market
relationship between the consumers and the brokerage firms in Mecklenburg County during
April, May, and June of 1999?” This question is addressed by Hypothesis 4-A, 4-B and 4-C.
Null Hypothesis 4-A: Less than 50 percent of residential real estate brokers believe they
have changed the way they do business due to consumers use of the Internet.
Alternate Hypothesis 4-A: At least 50 percent of residential real estate brokers believe
they have changed the way they do business due to consumer’s use of the Internet.
Null Hypothesis 4-B: Less than or equal to 25 percent of the consumers believe their
need for the services of a real estate broker will be reduced due to their use of the Internet.
Alternate Hypothesis 4-B: More than 25 percent of consumers believe their need for the
services of a real estate broker will be reduced due to their use of the Internet.

87
Null Hypothesis 4-C: At least 20% or less of real estate brokers do not believe the
consumers’ need for the services of a real estate broker will be reduced due to the consumers’
use of the Internet.
Alternate Hypothesis 4-C More than 20 percent of real estate brokers do not believe the
consumers’ need for the services of a real estate broker will be reduced due to the consumers’
use of the Internet.
The Research Approach
The approach used was based on the above hypotheses regarding the effects of the
Internet on the residential real estate market in Mecklenburg County during April, May and June
of 1999. The data needed for analyzing our hypothesis was gathered directly from consumers
and real estate professionals. The choice for this topic can be attributed to the personal
experiences that members of the research team have with the Internet and real estate transactions
both personally and professionally. This study is intended to identify cause and effect as well as
identify future trends that might exist. This research will possibly provide the framework for
additional study beyond our findings and recommendations that are presented in this research.
Criteria for Data Source
Many variables were considered in selecting our criteria for data collection. These
variables included population, sample size, method of sample selection, locality and availability
of data.
The population of interest in this study includes:

88
• Consumers who transacted residential real estate in Mecklenburg County during
April, May, and June 1999.
• Residential real estate firms in Mecklenburg County, licensed by the state of North
Carolina. Those holding a valid license during April, May, and June 1999.
Those qualified to give information were the consumers who bought or sold residential
real estate from April to June 1999 in Mecklenburg County and the real estate brokerage firms
that conducted residential real estate transactions from April to June 1999.
A random systematic sample was used. The sample size was taken over a period of time
that would represented all classes of consumers who transacted residential real estate in
Mecklenburg County during April, May and June 1999. The sample of real estate firms was
chosen randomly from those firms doing business in Mecklenburg County during April, May,
and June 1999.To confirm the availability of the data, public records were used that are available
from residential real estate transactions. There were two sources used to determine the
population to survey. One source, Yellow Pages, was used to obtain a list of Mecklenburg
County real estate firms. The other source, Mecklenburg County GIS, was used to acquire the
consumers who had residential real estate transactions for April, May and June of 1999. The
Mecklenburg County GIS is a database of geographic information that can also be used to
perform dynamic queries and display all forms of geographical data
Choosing the sample size was very important in this study. During April, May and June
1999 approximately 5,000 residential properties were sold in Mecklenburg County. 9 percent of
the consumers who transacted residential real estate property during the stated time frame were
sampled. This turned out to be approximately 450 consumers. One hundred of the surveys were
expected to be returned due to buyers not living at the property they purchased as well as

89
consumers who may have bought and then immediately sold the property. This would yield a
true sample size of about 350 consumers. To be statistically significant, 30 percent of consumers
needed to respond. At least 107 consumers needed to respond
These numbers were chosen because 450 represented a significant portion (9 percent) of
consumers who purchased homes in Mecklenburg County during the stated time frame. An
assumed loss rate of 20-25 percent of the sample group was assumed attributed to external
factors. Of the remaining consumers a 30 percent to return their surveys was desired. This
yields a true statistical sample of over 2 percent of the total number of homebuyers in
Mecklenburg County during this time frame.
There are 950 residential real estate firms who are REALTORS and subscribers to the
Carolina Multiple Listing Service (CMLS). We will survey 10% of those firms or 95 firms. In
selecting the real estate firms, we used the Yellow Pages, which contains a compilation of the
residential real estate firms in Mecklenburg County. A random number generator was used to
choose the firms to survey. About 20 of these letters were expected to be returned due to poor
addressing at the CMLS or agencies which may have closed between the time of the list’s
printing and the time the survey was sent. This will give a true sample size of 65 firms. For this
sample to be statistically significant, a result was needed of no less than 30% or 22 firms to
respond.
These numbers were chosen because 95 brokers of the firms represent a significant
sample of real estate firms. A response rate of over 2% was expected. This statistical group
makes up a good cross-section of the residential real estate broker community.

90
In selecting the consumers to be part of our sample selection, every 11th transaction or
approximately 500 consumers were to be surveyed. This is a systematic random sample
selection chosen from the Mecklenburg County GIS system that is defined in Chapter 3.
Review of Selected Literature
The literature search accomplishes three objectives. First, pertinent background
information about how real estate transactions are conducted in North Carolina is given with
respect to real estate firms, agents, brokers and REALTORS®. Second, relevant selected
literature discussing the topic of the effects of the Internet on the residential real estate market is
examined. Finally, a synopsis of important terms and definitional material that will assist in
understanding the research is presented.
In giving information about how real estate transactions are conducted in North Carolina,
two groups are defined: real estate agents and the multiple listing service members. It is required
in North Carolina, that any real estate practitioner be licensed. In order for one to represent
another person's interest in a real estate transaction for any type of compensation, the North
Carolina Real Estate Commission must license that person to practice real estate. As such, there
are two levels of licensure; agent status and broker status. The differentiation is mandated by the
state. The requirements for agent status are 42 hours of classroom instruction, a minimum score
of 75% on the state administered examination, and an acceptance of their application from the
North Carolina Real Estate Commission. The requirements for brokerage status are an agent’s
license in good standing, 30 hours of classroom instruction, a minimum score of 75% on the state
administered examination, and an acceptance of their application from the North Carolina Real
Estate Commission.

91
In order to operate a real estate firm in North Carolina, at least one member of that firm
must hold the status of an active broker’s license in good standing and be designated as the
active broker in charge of the firm (North Carolina Real Estate Commission, 1997). Each firm
must be registered and in good standing with the North Carolina Real Estate Commission.
Agents and brokers must complete eight hours of continuing education every year. Half of these
hours are contained in a state designed update course focusing on issues and updates that the
state feels important. The balance of these hours can be taken in the form of an elective credit of
a state authorized subject administered by a state authorized real estate school. In order for a
licensee to have an active status license, the aforementioned requirements must be completed and
real estate brokerage firm must accept the license. Only agents and brokers with active status
licenses can practice in North Carolina.
The Carolina Multiple Listing Service (CMLS) is a subscription-based database used by
real estate practitioners. Nearly all-active residential practitioners are members are members of
the National Association of REALTORS®. It is not a requirement of membership to the CMLS
that one is a REALTOR®. It is highly unusual that a member is not a REALTOR®.
In looking at the relevant literature to our study, the literature can be divided into three
categories. The first of these categories is the Internet and the retail industry. Literature that
relates to the Internet and residential real estate consumers is explored. Finally, literature that
looks at the implications of the Internet on real estate practitioners is examined.
Method
The research conducted as a part of this study helps explain the effects of the
Internet on the real estate industry. The objectives are to sample the target

92
population, to collect the data and to analyze the data. This data will be used to
provide recommendations for our research.
Collection of Data
Based on our objectives, the first step taken was to determine whom to include in the
population to survey. The population was confined to two groups: consumers who had
residential real estate transaction in Mecklenburg County during April, May and June 1999 and
real estate brokers in charge of their office who participated in brokering real estate transactions.
The reason for the constraint on population was to obtain current data, allow enough time for
analysis of returned data and to maintain a minimum cost for data collection. From experience in
determining whether or not this research was feasible, two sources were found to determine the
population to survey. The elected data sources were the Mecklenburg County Geographical
Information System (GIS) and BellSouth’s The Real Yellow Pages (Yellow Pages). The
Mecklenburg County GIS contained approximately 4500 consumers who transacted real estate
during April, May, and June 1999. The Yellow Pages contained approximately 950 real estate
firms. Due to the enormous size of the population in each database, a systematic sampling of the
population was performed to minimize data collection expense. Once the survey population was
assembled, a mail survey was developed as the collection method for primary data. Following
the determination of the survey method, we listed the procedures for collection of the sample
population from the two data sources. Finally, under data analysis, the format for the surveys,
assumptions and delimitation are explained. This chapter is concluded with a summary.
Analysis of Data

93
There were four types of responses using the consumer survey cards. The first type of
response required the consumer to use a sliding scale ranging from 1 to 9. Question 1, ‘How
comfortable would you be using the Internet to shop for a house?’ Above this scale, it was noted
that a response of 1 would be interpreted as extremely negative and a response of 9 was
extremely positive. An answer of 5 or more indicated the consumer would feel comfortable using
the Internet to shop for a house. Question 2; ‘To what extent are you aware of the Internet
services available to you as a residential real estate consumer?’ Above this scale, it was noted
that a response of 1 would be interpreted as extremely unaware and a response of 9 was
extremely aware. An answer of five or more indicated that the consumer were aware of Internet
service available to them as a residential real estate consumer. Question 3 asked ‘To what extent
did you use the available information via the Internet to complete a portion of your real estate
transaction?’ Above this scale, it was noted that a response of 1 would be interpreted as none, an
answer of 5 meant some and a response of 9 was many. An answer of five or more indicated that
the consumer used some of the information via the Internet to complete a portion of their real
estate transaction. Question 5; ‘To what extent are you aware of the availability of residential
real estate information via Internet?’ Above this scale, it was noted that response of 1 would be
interpreted as none, an answer of 5 meant some and a response of 9 was very. An answer with a
five or more indicated that the consumer was aware of the availability of residential real estate
information via the Internet. Question 6, ‘To what extent do you believe the information on the
Internet will replace your need for the services of a traditional residential real estate broker?’
Above this scale, it was noted that response of 1 would be interpreted as negative, an answer of 5
meant some and a response of 9 was positive. An answer of five or more indicated that the

94
consumer believed that the information on the Internet would replace their need for the services
of a traditional residential real estate broker.
The second type of response asked the consumer to answer with a ‘yes’ or ‘no’. Question
4, ‘Did you consider buying or selling a house using the Internet?’ A reply of ‘yes’ indicated that
the consumer consider buying or selling a house using the Internet.
The third type of response required the consumer to check boxes to indicate usage, there
were 11 in total. Question 8, ‘I used the following resources on the Internet to help complete my
transaction.’ Each box represents a particular resource. The resources listed were:
1. Search for property
2. Search for a REALTOR®
3. Search for lending source
4. Applied for a loan
5. Search for property tax values
6. Search for past sales information
7. Search for Closing attorney
8. Search for area/neighborhood statistics such as crime and demographics
9. Search for area/neighborhood schools and churches
10. Search for ancillary real estate services such as appraisers, inspectors, and contractors
11. Other (The eleventh area was a box labeled other. This area was left blank so that the
consumer could list any resources they felt were omitted.)
The last type of response required the consumer to check boxes to indicate demographics.
Question 9, ‘Please complete the following:’ this question asked the consumer to check boxes

95
under four categories: age, gender, income and ethnic background. Based upon the consumer,
they would select the appropriate box under each category.
On the broker-in-charge sheets, there were also four types of responses. The first type of
response was a percentage scale ranging from less than –30 to 100. Question 1, ‘To what extent
do you estimate (in terms of percentage of prospects) the Internet has directly increased the total
number of prospects obtained for you company?’ Question 4, ‘To what extent (in terms of
percentage of prospects obtained where a prospect person interested in buying or selling a
property) has the Internet directly increased the prospects obtained for your company?’ In
questions 1 & 4, the respondent was asked the percentage of growth or decline in prospects due
to the Internet.
The second type of response required the brokers to use a sliding scale ranging from 1 to
9. Question 2, ‘To what extent do you believe the information on the Internet will replace your
need for the services of a traditional residential real estate broker?’ Above this scale, it was noted
that response of 1 would be interpreted as don’t believe a response of 5 as some and a response
of 9 as believe. An answer of 5 or more indicated that the broker believes the information on the
Internet will replace their need for the services of a traditional residential real estate broker.
Question 5, ‘To what extent do you use the Internet to provide your customer with information
on listings or offerings?’ Above this scale, it was noted that response of 1 would be interpreted as
didn’t use a response of 5 as some and a response of 9 as heavily used. A response of 5 indicated
that the broker used the Internet to provide their customer with information on listings or
offerings. Question 6, ‘To what extent do you recommend to clients that they use the Internet as
a research tool for gathering information about the city, demographics or crime? Question 8, ‘To
what extent do you recommend that clients use the Internet as a research as a tool for gathering

96
information about ancillary real estate services such as attorneys, lenders, appraisers, or
contractors? Above questions 6 & 8 scale, we noted that response of 1 would be interpreted as
none, a response of 5 as some and a response of 9 as many. A response of 5 indicated that the
broker recommended to clients that they use the Internet as a research for gathering information
relating to each question.
The third type of response required the brokers to check boxes to indicate demographics.
Question 3, ‘Please complete the following:’ this question asked the broker to check boxes under
four categories: age, gender, income and ethnic background. According to the broker’s
demographic; he or she would select the appropriate box under each category.
The last type of response asked the broker questions relating to company resources and
employment. The question are listed:
1. Does your firm have a web site?
2. If yes, how long has it been up and running?
3. How many full-time agents do you retain?
4. How long have you been in business?
5. Do you have an Internet Marketing Plan?
6. Do you have plans for future Internet usage?
Question 1, 5, and 6 required only a ‘yes’ or ‘no’ answer. The other question asked for actual
figures.
The responses from the surveys and sheets were collected and stored in an Access
database. The data was analyzed using Microsoft Excel.

97
Findings
A review of the initial research questions and hypothesis is useful in presenting the
findings of this study. Some questions have multiple hypotheses and some questions only have
one hypothesis. This series of questions and their answers should lead to a conclusion of the
effectiveness of this study. These findings will show relevance to modern society and will prove
the accuracy of the initial hypotheses.
From Chapter 2, four main research questions will be addressed. (See Table 41) as noted
in Chapter 3 and 4, there are 6 hypotheses that address these questions. (See Table 42) These
questions and hypotheses will be addressed to expose the findings.
Table 41
General Research Questions
GENERAL QUESTIONS
1 To what extent was the Mecklenburg County Consumer informed of pertinent information on the Internet in relation to residential real estate in April, May and June of 1999?
2 To what extent do consumers use the Internet to gather real estate information in Mecklenburg County during April, May, and June of 1999?
3 To what extent has using the Internet generated prospects for residential real estate firms in Mecklenburg County during April, May, and June of 1999?
4 To what extent has the use of the Internet changed the market relationship between the consumers and the brokerage firms in Mecklenburg County during April, May, and June of 1999?

98
Table 42
Broad Research Questions
BROAD QUESTIONS
1 To what extent has the use of this technology caused residential real estate firms to change their traditional methods of doing business in order to remain competitive?
2 To what extent has the community been informed by the available information obtainable from the Internet concerning residential real estate transactions in Mecklenburg County?
3 To what extent do demographic factors such as age, race and education factor into if consumers choice to use the Internet in their residential real estate transactions?
Table 43
Hypothesis as related to the research questions
Hypothesis I Null Hypothesis 1A Of the consumers making residential real estate transactions, less than 50 were relatively aware of the resources available on the Internet.
Alternate Hypothesis 1A Of the consumers making residential real estate transactions, 50 percent or less were relatively unaware of the resources available on the Internet.
Null Hypothesis 1B Of the residential real estate consumers on the Internet, more than 40 percent used less than three distinct resources on the web in completing their transaction.
Alternate Hypothesis 1B Of the residential real estate consumers on the Internet, 40 percent or more used at least three distinct resources on the web in completing their transaction.
Hypothesis II Null Hypothesis 2 Less than 50 percent of residential real estate
consumers use the Internet to gather real estate information.
Alternate Hypothesis 2 50 percent or more of residential real estate consumers use the Internet to gather real estate information.

99
Hypothesis III
Null Hypothesis 3 The Internet did not provide 20 percent or more of residential real estate firms prospects during April, May and June of 1999.
Alternate Hypothesis 3 The Internet generated 20 percent or more of residential real estate firms prospects in Mecklenburg County during April, May and June of 1999.
Hypothesis IV
Null Hypothesis 4-A Less than 50 percent of residential real estate brokers believe they have changed the way they do business due to consumers use of the Internet.
Alternate Hypothesis 4-A At least 50 percent of residential real estate brokers believe they have changed the way they do business due to consumer’s use of the Internet.
Null Hypothesis 4-B Less than or equal to 25 percent of the consumers believe their need for the services of a real estate broker will be reduced due to their use of the Internet.
Alternate Hypothesis 4-B More than 25 percent of consumers believe their need for the services of a real estate broker will be reduced due to their use of the Internet.
Null Hypothesis 4-C At least 20% or less of real estate brokers do not believe the consumers’ need for the services of a real estate broker will be reduced due to the consumers’ use of the Internet.
Alternate Hypothesis 4-C More than 20 percent of real estate brokers do not believe the consumers’ need for the services of a real estate broker will be reduced due to the consumers’ use of the Internet.
In Research Question 1 (See Table 43 for complete list of research questions) asked, “To
what extent was the Mecklenburg County Consumer informed of pertinent information on the
Internet in relation to residential real estate in April, May and June of 1999?” This question was
addressed by the hypotheses 1A and 1B (see Table 38 for complete list of hypothesis). Null
Hypothesis 1A would then read: “Of the consumers making residential real estate transactions,
less than 50 were relatively aware of the resources available on the Internet.” Alternate

100
Hypothesis 1A states that “Of the consumers making residential real estate transactions, 50
percent or less were relatively unaware of the resources available on the Internet.”
The alternate hypothesis for this question is true. The average respondent to the
consumer survey conducted based on sales in April, May and June of 2000 answered that they
were at least relatively aware of the services available on the Internet as those services relate to
residential real estate. Ninety of the 113 respondents answered “5” (relatively aware) or better
on this question. This shows that most people were aware of the tools available on the Internet
and made efforts to harness those tools.
Question 1 was also addressed by Hypothesis 1-B. The null hypothesis for this question
would then follow as: “Of the residential real estate consumers on the Internet, less than 40
percent used less than three distinct resources on the web in completing their transaction.”
Alternate Hypothesis One-B states that “Of the residential real estate consumers on the Internet,
40 percent or more used at least three distinct resources on the web in completing their
transaction.”
It was expected that 40 percent of the consumers who purchased residential real estate
during April, May or June of 1999 in Mecklenburg County used three distinct Internet resources.
While the top 40 percent of respondents used at least 2 distinct resources, only the top 25 percent
of respondents met the assigned criteria of three or more unique resources. Thus, the alternate
hypothesis is proven False and the Null Hypothesis is taken as true.
This does not necessarily mean that people were not utilizing the Internet as much as they
could have been at the time. It should be noted that by the time these survey questions were
created, the number of active web sites had more than doubled (almost tripled – they had tripled
by the time the results were returned).

101
Research question two asks: “To what extent do consumers use the Internet to gather real
estate information in Mecklenburg County during April, May, and June of 1999?” This question
is addressed by null hypothesis that claims, “Less than 50 percent of residential real estate
consumers use the Internet to gather real estate information." The alternate hypothesis for this
question states, “50 percent or more of residential real estate consumers use the Internet to gather
real estate information.”
The survey results obtained from the research questionnaire determined the alternate
hypothesis to be true. This is a surprising statistic that shows the power the Internet has in
modern society. The fact that over 50 percent of consumers from second quarter of 1999 utilized
the Internet to gather real estate information is a testament to the power and omnipresence of the
Internet. The fact that this includes all age groups, income brackets and racial segmentations is
a demonstration of how ubiquitous the Internet truly has become.
Research Question Three asks, “To what extent has using the Internet generated
prospects for residential real estate firms in Mecklenburg County during April, May and June of
1999?” This question is addressed by Null Hypothesis three that states “The Internet did not
provide 20 percent or more of residential real estate firms prospects during April, May and June
of 1999.” The alternate hypothesis for this question states, “The Internet generated 20 percent or
more of residential real estate firms prospects in Mecklenburg County during April, May and
June of 1999.”
Some real estate brokers said that the Internet had generated over 100 new prospects.
However some real estate brokers also said that the Internet had caused them lose prospects. In
the formulation of our thesis, no attention was given to the fact that the Internet may have had
the power to draw consumers away from real estate brokers. It might be possible that there is a

102
much larger percentage of small real estate firms as opposed to larger operations many of these
smaller companies were less likely to have the manpower to harness the marketing ability of the
Internet. A study if these variables and relationships not addressed in this research should be
conducted in order to determine these effects and outcome. The number of new leads/lost leads
due to the Internet varies widely based on size of real estate firm. The null hypothesis was
accepted.
Question 4-A states, “To what extent has the use of the Internet changed the market
relationship between the consumers and the brokerage firms in Mecklenburg County during
April, May, and June of 1999?” This question deals with both the current relationship and future
expectations between consumers and their real estate broker. This question is critical to our
study and is addressed by hypothesis 4-A, 4-B and 4-C.
Null hypothesis 4-A states “Less than 50 percent of residential real estate brokers believe
they have changed the way they do business due to consumers use of the Internet.” Alternate
Hypothesis 4-A states that “At least 50 percent of residential real estate brokers believe they
have changed the way they do business due to consumers use of the Internet.”
The analysis of this question showed that 50 percent of brokers are changing the way
they do business due to the Internet. This is surprising that the Internet, something that has been
in existence for less than a decade, has this large of an effect on commerce. More astounding is
that almost every real estate broker surveyed, admitted to using the Internet in some way as a
part of his or her business. This data and makes alternate hypothesis 4-A correct.
Due to the large sampling of real estate brokers that admitted to using the Internet in
some way, it is important to explain the disparity between this and our threshold for this question
of 50 percent. Note that the number of active web sites tripled between the time of the target

103
period for consumers and the time the real estate brokers filled out their surveys. However, the
research survey sent to firms did instruct brokers that they were to look at a snapshot of April,
May and June of 1999 in their answers. It is important to note that real estate industry was one
of the first and most prominent industries effected by the Internet – both by sellers listing homes
and buyers looking for homes as well as real estate brokers and ancillary services. The
proliferation of on-line newspapers that present classified sections listing home sold by real
estate brokers and for sale by owner homes is another possibility for the large percentage of
realtors which have some entanglement with the Internet.
Null hypothesis 4-B asserts “Consumers do not believe they will be 25% less likely to
need the services of a real estate broker due to their use of the Internet.” Alternate Hypothesis 4-
B states that “Consumers believe they will be 25% less likely to need the services of a real estate
broker due to their use of the Internet.” This hypothesis relates to both current and future
situations in regards to the relationship between consumers, real estate brokers, the Internet, and
ancillary services.
Consumers believe there is a fairly significant possibility (28 percent) that their needs for
a traditional real estate broker will be alleviated by the advent of the Internet. This astounding
number can again be attributed to the countless real estate based web sites available on the
Internet. Due to these tools, today’s real estate consumer is more aware, more educated and
more knowledgeable than ever before. Since buying a home is the largest decision most people
will ever make in their lives it is no wonder why they would be happy to research the options and
do more of the work themselves. This means that Alternate Hypothesis 4-B is true and the null
hypothesis 4-B is rejected.

104
Null hypothesis 4-B for states “less than or equal to 25 percent of the consumers believe
their need for the services of a real estate broker will be reduced due to their use of the Internet.”
Alternate Hypothesis 4-C states that “More than 20 percent of real estate brokers do not believe
the consumers’ need for the services of a real estate broker will be reduced due to the consumers’
use of the Internet.” This hypothesis relates to both current and future situations in regards to the
relationship between consumers, realtors, the Internet and ancillary services.
More astounding than the consumer results would be the answers real estate brokers gave
to this question. Many real estate brokers believe there is a fairly significant possibility (26
percent) that the consumer’s needs for a traditional real estate broker will be alleviated by the
advent of the Internet. This means that Alternate Hypothesis 4-B is true. These astounding
statistics can again be attributed to the countless real estate based web sites available on the
Internet. Due to these tools, today’s real estate broker is working harder to justify their services
to the increasingly more-knowledgeable consumer. They are trying to find ways to introduce
more value to the consumer and repackage the services they offer in such a manner to make them
more useful to the educated consumer. Consumers are starting to find their own answers more
and more which has left real estate brokers wondering what is going to happen down the road.
How much will their services be needed?
Conclusions
The objective of this study was to assess the impact of the Internet on the residential real
estate market. The scope of this study included the attitudes and behaviors of consumers and
real estate firms in Mecklenburg County during April, May and June of 1999. Using the results
of the data analysis and hypothesis testing, several general and broad research questions can be
answered.

105
In Research Question 1 we asked, “To what extent was the Mecklenburg County
Consumer informed of pertinent information on the Internet in relation to residential real estate
in April, May and June of 1999?” This question was addressed by the hypotheses 1A and 1B
(see Table 38 for complete list of hypotheses). Null Hypothesis 1A states: “Of the consumers
making residential real estate transactions, less than 50 were relatively aware of the resources
available on the Internet.” Alternative Hypothesis 1A states that “Of the consumers making
residential real estate transactions, 50 percent or less were relatively unaware of the resources
available on the Internet.” The alternate hypothesis is true.
Question 1 was also addressed by Hypothesis One-B. The null hypothesis for this
question would then follow as: “Of the residential real estate consumers on the Internet, more
than 40 percent used less than three distinct resources on the web in completing their
transaction.” Alternate Hypothesis One-B states that “Of the residential real estate consumers
on the Internet, 40 percent or more used at least three distinct resources on the web in completing
their transaction.” The null hypothesis for this question could not be disproved and the null
hypothesis was accepted. However, as defined in the findings section, it is important to note the
circumstantial information in regards to Hypothesis 1-B.
Hence, the answer to Question 1, “To what extent was the Mecklenburg County
consumer informed of pertinent information on the Internet in relation to residential real estate in
April, May and June of 1999?” would be to a large extent. During April, May and June of 1999
more than 50 percent of people were relatively aware of goods and services available on the
Internet. This means that over one-half of consumers were aware of available real estate services
on the Internet in April, May and June of 1999. To expound on this, a decent number of
consumers did utilize resources available to them on the Internet. So, not only was the consumer

106
in Mecklenburg County largely aware of the real estate services available on the Internet, they
were using the services as well.
Some people might not interpret these results as the consumer being largely aware. They
would argue that even though a large number of consumers were at least relatively aware of the
services available on the Internet during April, May and June of 1999. The number of
consumers actually utilizing resources is very poor by comparison. Hence, these people would
more argue the validity of this question rather than the supporting data. Some analysts might
suggest that this question would have better been worded, “To what extent was the Mecklenburg
County Consumer informed and utilizing pertinent information from the Internet in relation to
residential real estate transactions in April, May and June of 1999?” This question would have
presented a more interesting outcome in relation to the data for Hypothesis 1-B and would be
more pertinent to answering the question.
It seems odd how anyone in modern society could feel unaware of the resources on the
Internet. The Internet seems omnipresent and the rapid flux of media attention on the Internet
would seem to have made everyone aware of the information superhighway and the tools
available on it. However, this was a broad study that spread though a large demographic group
in all income ranges.
Research question two asks: “To what extent do consumers use the Internet to gather real
estate information in Mecklenburg County during April, May, and June of 1999?” This question
is addressed by hypothesis two which claims “50 percent or more of residential real estate
consumers use the Internet to gather real estate information.” The null hypothesis for this
question states that “Less than 50 percent of residential real estate consumers use the Internet to
gather real estate information." This hypothesis is true.

107
This leads us to the answer for Question 2 stating “Consumers often times used the
Internet to gather real estate information in Mecklenburg County during April, May, and June of
1999.” This is supported by the data for our research and is explained that as consumers have
more and more tools at their disposal they are making use of those tools. Consumers are using
the Internet to gather data that will enhance their buying decision. Some of this information is
information the consumer traditionally relied on the realtor to provide. This newfound power for
the consumer is weakening the relationship between the consumer and the real estate broker.
The real estate broker must actively reinvent his service platform in the face of the information
available to the consumer, once owned and guarded by the real estate broker.
Critics of this analysis might argue that the consumer is simply using the Internet to look
up a few houses, find information they normally would have found independently anyway and
are still relying on the real estate broker for the majority of their transaction needs. These
analyzers would argue that the services provided by the real estate broker could not be provided
by e-commerce. Consumers will always want a face with the transaction so even though they are
utilizing the information available of the Internet, the information is not meaningful enough to
tarnish the relationship between consumer and broker as we assert in our analysis.
Research Question three queries, “To what extent has using the Internet generated
prospects for residential real estate firms in Mecklenburg County during April, May and June of
1999?” This question is addressed by Null Hypothesis 3 which states that: “The Internet did not
provide 20 percent or more of residential real estate firms prospects during April, May and June
of 1999.” Alternate Hypothesis Three asserts “The Internet generated 20 percent or more of
residential real estate firms prospects in Mecklenburg County during April, May and June of

108
1999.” This answer to this question is “The Internet has helped as well as hurt many real estate
firms.”
This question would have been more appropriately worded “To what extent has using the
Internet increased or decreased the number of new prospects (positively or negatively) for
residential real estate firms in Mecklenburg County during April, May and June of 1999?” This
would have been more in line with our results and would have been more open-ended to the
effects of the Internet. Wording the question in this manner would have been more appropriate
to our project because a loss of prospects would show a widening gap in the relationship between
consumers and brokers.
Question 4-A looks to discover, “To what extent has the use of the Internet changed the
market relationship between the consumers and the brokerage firms in Mecklenburg County
during April, May, and June of 1999?” This question deals with both the current relationship
and future expectations between consumers and their realtors. This question is critical to our
study and is addressed by hypothesis 4-A, 4-B and 4-C. Null hypothesis 4-A states, “Less than
50 percent of residential real estate brokers believe they have changed the way they do business
due to consumers use of the Internet.” Alternate Hypothesis 4-A states that “At least 50 percent
of residential real estate brokers believe they have changed the way they do business due to
consumers use of the Internet.” Null hypothesis 4-B states, “Less than or equal to 25 percent of
the consumers believe their need for the services of a real estate broker will be reduced due to
their use of the Internet.” Alternate Hypothesis 4-B states that “More than 25 percent of
consumers believe their need for the services of a real estate broker will be reduced due to their
use of the Internet.” Null hypothesis 4-C asserts, “At least 20% or less of real estate brokers do
not believe the consumers’ need for the services of a real estate broker will be reduced due to the

109
consumers’ use of the Internet.” Alternate Hypothesis 4-C states that “More than 20 percent of
real estate brokers do not believe the consumers’ need for the services of a real estate broker will
be reduced due to the consumers’ use of the Internet.”
Hypotheses 4-A, 4-B and 4-C were all proven correct. This would make the answer to
question 4, “The Internet changed the market relationship between the consumers and the
brokerage firms to a large extent.” have a very positive outcome. This can be seen by the
changed behaviors of the real estate brokers and the fact that both one-fourth of real estate
brokers and consumers surveyed believe that the Internet will make the consumer’s need for a
broker obsolete. This data shows the large effect the Internet has had on commerce in the real
estate market and the expectations consumers and real estate brokers have that this relationship
between the consumer and the Internet will grow.
A reverse analysis of this answer would show that 75 percent of both real estate brokers
and consumers do not believe the Internet will replace the need for a traditional broker. This
might show that there is an element in our society who will shy away from the services of real
estate broker, but these are the same people who would most likely look for homes listed “For
Sale By Owner” anyway and would have traditionally made an attempt to cut the real estate
broker out of the picture. Or, they simply do not find the value in hiring a real estate broker to
help them buy or sell real estate.
The broad questions were not directly addressed by hypotheses, but rather by a
culmination of our data and findings our three broad questions have been redisplayed in Table 42
for easy review. The first of these broad questions, “To what extent has the use of this
technology caused residential real estate firms to change their traditional methods of doing
business in order to remain competitive?” can be addressed by three questions on the real estate

110
brokers’ survey. These questions are: Question 5, “To what extent do you use the Internet to
provide your customer with information on listings or offerings?” Question 6, “To what extent
do you recommend to clients that they use the Internet as a research tool for gathering
information about the city, demographics or crime?” Question 7, “To what extent do you
recommend to clients that they use the Internet as a research tool for gathering information about
a specific property?” Question 8, “To what extent do you recommend that clients use the
Internet as a research as a tool for gathering information about ancillary real estate services such
as attorneys, lenders, appraisers, or contractors?”
The answers to these questions showed that most real estate brokers used the Internet in
some way; hence changing the way they do business in some manner or fashion. For both
questions five and six most real estate brokers noted they use the Internet at least some or
suggest the Internet to their clients at least in some manner (4 or better). Questions 7 and 8 did
not have as strong a response. However, this can be attributed to the fact that the real estate
brokers feel they need to provide services with respect to gathering market data for the home and
finding ancillary services to justify their commission.
Broad Question 2 asks, “To what extent has the community been informed by the
available information obtainable from the Internet concerning residential real estate transactions
in Mecklenburg County?” This question was not directly addressed by our research as
consumers who purchased homes were studied. These consumers are more likely to be aware of
available real estate services on the Internet than the general population because they had a
vested interest in purchasing a home. However, due to the plethora of media and advertising run
by many of the ancillary services and even real estate brokers themselves, many consumers are
quickly becoming aware of the services available.

111
Broad Question 3 asks, “To what extent do demographic factors such as age, race and
education factor into if consumers choice to use the Internet in their residential real estate
transactions?” This question can be analyzed by our demographic information displayed in
Chapter 3. We can note from this information that age was the most influential factor in use of
the Internet, with those under 50 utilizing the Internet the most. Income did not seem to be as
much of an issue as age, perhaps because people of any income group will use whatever tools are
available to them. People over 50 were simply not as aware of the tools available to them. Of
races Caucasians were the most active users of the real estates services on the Internet, though
not by a wide margin. Among this race, females were the most active users of these services.
However, there were still no trends among women of varied income levels.
Findings Related to the Context and Literature
Though all of our findings and conclusions, we can firmly state that the Internet had an
effect on the residential real estate market in Mecklenburg County during April, May and June of
1999. We can further assert that this effect was not static to this time frame or this area, but
rather this study served as a microcosm of the broader real estate picture during this time. It is
also reasonable to claim that this growth has not stagnated and will not stagnate but this growth
is dynamic as the Internet itself.
These findings relate well to the literature and resources we included in our study -- most
notably, the study done by the National Association of Realtors. This study asserted that the
Internet was becoming a viable player in the real estate arena. That brokers had to adapt to these
changes and that consumers were expecting more of the brokers to justify the broker’s
commission. This is exactly what we have found in our literature and we believe to be the case.

112
The relationship between the consumer and the broker is changing and the Internet has created
this change.
Other sources pointed more to the effects of e-commerce on business in general. These
sources also support our findings. Many current articles and books are showing the drastic
effects e-commerce has had on businesses and the development of businesses. Today we have
companies that exist only in cyber space and they are brokering trillions of dollars worth of
transactions. The growth of product sales on the Internet has been so phenomenal that it leaves
the consumer wondering, what is next.
Findings: Implications and Applications
As a result of this study, some of the research questions could have been formatted more
effectively. The implications of our research strongly suggest that the Internet is a major player
in commerce today. Particularly in the real estate market, agents and brokers should take
warning to the fact that the Internet is a major force in their industry.
The wise real estate associate should apply the results from our research to their practices
and find ways to create more value for their customers and new formats for delivering their
service. The shift from information provider to advisor and consultant will be a major trend.
The real estate agent who adapts quickly will be around for the long haul. The one who
stagnates will go the way of the radio star with the advent of television or the stagecoach driver
with the advent of the automobile. These proactive agents and brokers still have time to be the
leaders in this changing industry. However, everyday Internet time moves faster and faster
meaning time is running out for those real estate companies not in the digital age.

113
More important to the real estate agent than being on line is having an awareness of what
is online. The agent can help direct consumers to resources at the same time adapting their own
services to be more customer service orientated. This will add value to what the real estate
broker does as the Internet replaces more and more of the traditional brokerage services.
Meanwhile consumers reading this evaluation can glean an understanding that through
the proper channels they can gain knowledge of real estate process and make better purchasing
decisions. Since buying a home is the largest decision some people will ever make this could
make a great bit of difference in the transaction process. Never before has there been so much
information available to the public in a convenient platform using the Internet. Such information
will result in a more educated consumer.
Evaluation of the Research
The number respondents providing feedback was outstanding given the method of
survey. Questions come up on the wording of some of the initial research questions. It should
be noted that more consumers with higher incomes responded to the survey than consumers with
lower incomes. This observation might suggest that Internet usage correlates directly with
income.
Two of the questions could have been asked more effectively. Question one should have
been worded to ask “To what extend was the Mecklenburg County Consumer informed of and
utilizing pertinent information on the Internet in relation to residential real estate in April, May
and June of 1999?” This question currently asks “To what extent was the Mecklenburg County
Consumer informed of pertinent information on the Internet in relation to residential real estate

114
in April, May and June of 1999?” This revised wording of the question would have been more
appropriate to the two hypotheses where Question 1 relates.
Question three should have been worded to ask, “To what extent has using the Internet
increased or decreased the number of new prospects (positively or negatively) for residential real
estate firms in Mecklenburg County during April, May and June of 1999?” This question
currently reads “To what extent has using the Internet generated prospects for residential real
estate firms in Mecklenburg County during April, May, and June of 1999?” This change in
wording would have been more effective to show the effects both positive and negative that the
Internet has on traditional businesses.
Real estate brokers must change the way they interact with their customer. It is also
important for the real estate consumer to take advantage of the new tools available to them and
make the most possible use of the newfound knowledge they will have. If the resources on the
Internet go untapped, then they are no more valuable than the countless commercials and print
ads that swarm our every day lives. The availability of information increasing at a dramatic rate
due to the proliferation of companies providing services and information over the Internet. The
broker will and is no longer a gatekeeper of information. The broker who will survive into the
future will add valve to their client thought their wisdom and experience. This wisdom must be
channeled in such a way that the client saves money, reduces time spent and reduces the risks
associated with real estate transactions. This dynamic shift of events is part of the e-commerce
revolution going on everywhere in society.
Brokerage and the business of stockbrokerage have changed dramatically due to the
Internet. Is the real estate broker next? To what degree will the Internet continue to infiltrate
this industry? Well, if there is money to be made, this will continue to happen a great deal.

115
Cellular modems and digital, wireless web tools are just a few of the many ways the technology
of the Internet is becoming more available and easier to use for consumers and brokers. With
people being able to access the Internet from digital phones, laptops and hand-held devices it is
getting precariously close to critical mass for many traditional businesses to adapt to the new
environment. How will the real estate environment adapt to this? That remains to be seen.
We recommend that a follow up study be conducted in the fall of 2001 and the results of
that study compared to the results of this study. What we believe will be case will be a larger
percentage of people using a larger amount of resources on the web for their real estate
transaction. This includes, but is not limited to how they find an agent and to what extent they
utilize that agent’s services.

116
REFERENCE LISTING
Boyd, J. (2000, March 3). House Hunting with a 'Net'. The Business Journal-Charlotte,1, p.69.
Charlotte Regional REALTORS® Association. (1999). "Find a Home". http://www.carolinahome.com/crrafindhome.htm.
Chain store age, (2000, August). Retail pulse, Chain Store Age, vol. 76, issue 8, p.28.
Dooley, T., Swanepoel S., & Abelson, M. (1998). Real estate confronts reality. Dearborn Financial Publishing, USA.
Duff, K. (2000, July 21). Ready, set, e-tail: Online strategies key to success, Orlando
Business Journal, 17, p. 77. Gunderson, A. (2000, September 4). Toil and trouble: online shopping is still a muddle.
Fortune, 142, p.374.
Harney, K. (1999, October 16). Appraisals posted online could be boon to home sellers. The Charlotte Observer, p. 23B.
Hof, R. (2000, July 24). Online sales still a threat, Business Week, p. EB114.
Karlgaard, R. (2000, September 18). Ecommerce stinks, Forbes,166, p.51.
Kim, J. (1998). Home on the net. Money.com, 23-34.
Leiner, Barry M.; Cerf, Vinton G.; Clark, David D.; Kahn, Robert E.; Kleinrock ,
Leonard; Lynch, Daniel C.; Postel , Jon; Roberts, Lawrence G.; Wolff, Stephen. “A Brief History of the Internet.” http://www.ISOC.org; (4 Aug. 2000).
Mecklenburg County. “What is GIS?” http://www.co.mecklenburg.nc.us/cogis/overview.htm (September 4, 2000).
Mecklenburg County. “GIS Real Estate System: Market Analysis Search Menu.” http://maps.co.mecklenburg.nc.us/taxgis/salessearch.htm (September 4, 2000). Miller, J. (2000, August 14). GM plans 2nd retail website, Automotive News, 74, p1.
Neuborne, E. (2000, September 18). Online luxury has limits, Business Week, p. EB24. Neuborne, E. (2000, July 24). Why E-tail will click, Business Week, p. EB14.
North Carolina Real Estate Commission. (1997, November). Real Estate Licensing in
North Carolina. Internet. Available: http://www.ncrec.state.nc.us/licensing.htm.
117
Rafter, M.V. (1999, June21). Open House. The Industry Standard, 34-44.
The Economic Research Group of the National Association of Realtors® (1999, July).
Realtors® and the Internet: The Impact of On-line Technologies on the Real Estate Industry, p. 1-15
Rutledge, J. (2000, August 21). Living with the net. Forbes,166, p. 103.
Saffo, P. (1998). DisinteREmediation: longer, not shorter, value chains are coming.
Internet. Available: http://www.saffo.org/disinteremediation.html.
Zakon, R. H. (1993-2000). “Hobbes' Internet Timeline” http://www.isoc.org/guest/zakon/Internet/History/HIT.html.
Zbar, J.D. (2000, September 7). Amid net losses, e-tailers eke out positive results. Advertising Age71, p30.
Zikmund, W. (1994). Business Research Methods. United States of America: Dryden
Press.

118
Appendix A
INTERNET MILESTONES from Hobbes' Internet Timeline Copyright (c)1993-2000 by Robert H Zakon
YEAR MILESTONE
1957
USSR launches Sputnik, first artificial earth satellite. In response, US forms the Advanced Research Projects Agency (ARPA), the following year, within the Department of Defense (DoD) to establish US lead in science and technology applicable to the military (:amk:)
1961First paper on packet-switching (PS) theory
1961Leonard Kleinrock, MIT: "Information Flow in Large Communication Nets" (May 31)
1962Galactic Network concept encompassing distributed social interactions
1962J.C.R. Licklider & W. Clark, MIT: "On-Line Man Computer Communication" (August)
1964Packet-switching networks; no single outage point 1964Paul Baran, RAND: "On Distributed Communications Networks" 1965ARPA sponsors study on "cooperative network of time-sharing computers"
1965
TX-2 at MIT Lincoln Lab and AN/FSQ-32 at System Development Corporation (Santa Monica, CA) are directly linked (without packet switches) via a dedicated 1200bps phone line; Digital Equipment Corporation (DEC) computer at ARPA later added to form "The Experimental Network"
1966First ARPANET plan
1966Lawrence G. Roberts, MIT: "Towards a Cooperative Network of Time-Shared Computers" (October)
1967ACM Symposium on Operating Principles in Gatlinburg, Tennessee (October)
1967ARPANET design discussions held by Larry Roberts at ARPA IPTO PI meeting in Ann Arbor, Michigan (April)
1967First design paper on ARPANET published by Larry Roberts: "Multiple Computer Networks and Intercomputer Communication
1967First meeting of the three independent packet network teams (RAND, NPL, ARPA)
1967
National Physical Laboratory (NPL) in Middlesex, England develops NPL Data Network under Donald Watts Davies who coins the term packet. The NPL network, an experiment in packet-switching, used 768kbps lines
1968Bolt Beranek and Newman, Inc. (BBN) awarded Packet Switch contract to build Interface Message Processors (IMPs)
1968Network Working Group (NWG), headed by Steve Crocker, loosely organized to develop host level protocols for communication over the ARPANET. (:vgc:)
1968PS-network presented to the Advanced Research Projects Agency (ARPA)
1968Request for proposals for ARPANET sent out in August; responses received in September
1968Tymnet built as part of Tymshare service (:vgc:)
1968University of California Los Angeles (UCLA) awarded Network Measurement Center contract in October

119
1968
US Senator Edward Kennedy sends a congratulatory telegram to BBN for its million-dollar ARPA contract to build the "Interfaith" Message Processor, and thanking them for their ecumenical efforts
1969ARPANET commissioned by DoD for research into networking 1969Culler-Fried Interactive Mathematics 1969DEC PDP-10, Tenex 1969Diagram of the 4-node ARPAnet 1969Diagram of the first host to IMP connection 1969Doug Engelbart's project on "Augmentation of Human Intellect"
1969
First packets sent by Charley Kline at UCLA as he tried logging into SRI. The first attempt resulted in the system crashing as the letter G of LOGIN was entered. (October 29) [ Log entry ]
1969First Request for Comment (RFC): "Host Software" by Steve Crocker (7 April) 1969Function: Network Measurement Center 1969Graphics 1969IBM 360/75, OS/MVT 1969Network Information Center (NIC) 1969Node 1: UCLA (30 August, hooked up 2 September) 1969Node 2: Stanford Research Institute (SRI) (1 October) 1969Node 3: University of California Santa Barbara (UCSB) (1 November) 1969Node 4: University of Utah (December)
1969Nodes are stood up as BBN builds each IMP [Honeywell DDP-516 mini computer with 12K of memory]; AT&T provides 50kbps lines
1969RFC 4: Network Timetable 1969SDS940/Genie 1969System,OS: SDS SIGMA 7, SEX
1969Univ of Michigan, Michigan State and Wayne State Univ establish X.25-based Merit network for students, faculty, alumni (:sw1:)
1970ALOHAnet, the first packet radio network, developed by Norman Abramson, Univ of Hawaii, becomes operational (July) (:sk2:)
1970ARPANET hosts start using Network Control Protocol (NCP), first host-to-host protocol
1970connected to the ARPANET in 1972
1970
First cross-country link installed by AT&T between UCLA and BBN at 56kbps. This line is later replaced by another between BBN and RAND. A second line is added between MIT and Utah
1970
First publication of the original ARPANET Host-Host protocol: C.S. Carr, S. Crocker, V.G. Cerf, "HOST-HOST Communication Protocol in the ARPA Network," in AFIPS Proceedings of SJCC (:vgc:)
1970First report on ARPANET at AFIPS: "Computer Network Development to Achieve Resource Sharing" (March)
197115 nodes (23 hosts): UCLA, SRI, UCSB, Univ of Utah, BBN, MIT, RAND, SDC, Harvard, Lincoln Lab, Stanford, UIU(C), CWRU, CMU, NASA/Ames
1971BBN starts building IMPs using the cheaper Honeywell 316. IMPs however are limited to 4 host connections, and so BBN develops a terminal IMP (TIP) that

120
supports up to 64 hosts (September)
1971
Ray Tomlinson of BBN invents email program to send messages across a distributed network. The original program was derived from two others: an intra-machine email program (SENDMSG) and an experimental file transfer program (CPYNET) (:amk:irh:)
1972
First computer-to-computer chat takes place at UCLA, and is repeated during ICCC, as psychotic PARRY (at Stanford) discusses its problems with the Doctor (at BBN).
1972
International Conference on Computer Communications (ICCC) at the Washington D.C. Hilton with demonstration of ARPANET between 40 machines and the Terminal Interface Processor (TIP) organized by Bob Kahn. (October)
1972
International Network Working Group (INWG) formed in October as a result of a meeting at ICCC identifying the need for a combined effort in advancing networking technologies. Vint Cerf appointed first Chair. By 1974, INWG became IFIP WG 6.1 (:vgc:)
1972Larry Roberts writes first email management program (RD) to list, selectively read, file, forward, and respond to messages (July)
1972Louis Pouzin leads the French effort to build its own ARPANET - CYCLADES
1972
Ray Tomlinson (BBN) modifies email program for ARPANET where it becomes a quick hit. The @ sign was chosen from the punctuation keys on Tomlinson's Model 33 Teletype for its "at" meaning (March)
1972RFC 318: Telnet specification 1973ARPA study shows email composing 75% of all ARPANET traffic
1973
Bob Kahn poses Internet problem, starts Internetting research program at ARPA. Vinton Cerf sketches gateway architecture in March on back of envelope in a San Francisco hotel lobby (:vgc:)
1973
Bob Metcalfe's Harvard PhD Thesis outlines idea for Ethernet. The concept was tested on Xerox PARC's Alto computers, and the first Ethernet network called the Alto Aloha System (May) (:amk:)
1973Cerf and Kahn present basic Internet ideas at INWG in September at Univ. of Sussex, Brighton, UK (:vgc:)
1973
Christmas Day Lockup - Harvard IMP hardware problem leads it to broadcast zero-length hops to any ARPANET destination, causing all other IMPs to send their traffic to Harvard (25 December)
1973First international connections to the ARPANET: University College of London (England) via NORSAR (Norway)
1973Network Voice Protocol (NVP) specification (RFC 741) and implementation enabling conference calls over ARPAnet. (:bb1:)
1973RFC 454: File Transfer specification 1973RFC 527: ARPAWOCKY 1973RFC 602: The Stockings Were Hung by the Chimney with Care

121
1973SRI (NIC) begins publishing ARPANET News in March; number of ARPANET users estimated at 2,000
1974BBN opens Telenet, the first public packet data service (a commercial version of ARPANET) (:sk2:)
1974
Vint Cerf and Bob Kahn publish "A Protocol for Packet Network Interconnection" which specified in detail the design of a Transmission Control Program (TCP). [IEEE Trans Comm] (:amk:)
1975"Jargon File", by Raphael Finkel at SAIL, first released (:esr:)
1975
First ARPANET mailing list, MsgGroup, is created by Steve Walker. Einar Stefferud soon took over as moderator as the list was not automated at first. A science fiction list, SF-Lovers, was to become the most popular unofficial list in the early days
1975John Vittal develops MSG, the first all-inclusive email program providing replying, forwarding, and filing capabilities.
1975Operational management of Internet transferred to DCA (now DISA)
1975Satellite links cross two oceans (to Hawaii and UK) as the first TCP tests are run over them by Stanford, BBN, and UCL
1975Shockwave Rider by John Brunner (:pds:)
1976Elizabeth II, Queen of the United Kingdom sends out an email on 26 March from the Royal Signals and Radar Establishment (RSRE) in Malvern
1976Multiprocessing Pluribus IMPs are deployed
1976UUCP (Unix-to-Unix CoPy) developed at AT&T Bell Labs and distributed with UNIX one year later.
1977First demonstration of ARPANET/SF Bay Packet Radio Net/Atlantic SATNET operation of Internet protocols with BBN-supplied gateways in July (:vgc:)
1977RFC 733: Mail specification
1977
THEORYNET created by Larry Landweber at Univ of Wisconsin providing electronic mail to over 100 researchers in computer science (using a locally developed email system over TELENET)
1977Tymshare spins out Tymnet under pressure from TELENET. Both go on to develop X.25 protocol standard for virtual circuit style packet switching (:vgc:)
1978RFC 748: TELNET RANDOMLY-LOSE Option 1978TCP split into TCP and IP (March) 1979ARPA establishes the Internet Configuration Control Board (ICCB) 1979First MUD, MUD1, by Richard Bartle and Roy Trubshaw at U of Essex
1979
Meeting between Univ of Wisconsin, DARPA, National Science Foundation (NSF), and computer scientists from many universities to establish a Computer Science Department research computer network (organized by Larry Landweber).
1979
On April 12, Kevin MacKenzie emails the MsgGroup a suggestion of adding some emotion back into the dry text medium of email, such as -) for indicating a sentence was tongue-in-cheek. Though flamed by many at the time, emoticons became widely used
1979
Packet Radio Network (PRNET) experiment starts with DARPA funding. Most communications take place between mobile vans. ARPANET connection via SRI.

122
1979USENET established using UUCP between Duke and UNC by Tom Truscott, Jim Ellis, and Steve Bellovin. All original groups were under net.* hierarchy.
1980ARPANET grinds to a complete halt on 27 October because of an accidentally-propagated status-message virus
1980First C/30-based IMP at BBN 1981BITNET, the "Because It's Time NETwork" 1981C/30 IMPs predominate the network; first C/30 TIP at SAC
1981
CSNET (Computer Science NETwork) built by a collaboration of computer scientists and Univ of Delaware, Purdue Univ, Univ of Wisconsin, RAND Corporation and BBN through seed money granted by NSF to provide networking services (especially email) to university scientists with no access to ARPANET. CSNET later becomes known as the Computer and Science Network. (:amk,lhl:)
1981Minitel (Teletel) is deployed across France by France Telecom.
1981Original acronym stood for 'There' instead of 'Time' in reference to the free NJE protocols provided with the IBM systems
1981Provides electronic mail and listserv servers to distribute information, as well as file transfers
1981RFC 801: NCP/TCP Transition Plan
1981Started as a cooperative network at the City University of New York, with the first connection to Yale (:feg:)
1981True Names by Vernor Vinge (:pds:)
1982
DCA and ARPA establish the Transmission Control Protocol (TCP) and Internet Protocol (IP), as the protocol suite, commonly known as TCP/IP, for ARPANET. (:vgc:)
1982DoD declares TCP/IP suite to be standard for DoD (:vgc:)
1982EUnet (European UNIX Network) is created by EUUG to provide email and USENET services. (:glg:)
1982Exterior Gateway Protocol (RFC 827) specification. EGP is used for gateways between networks.
1982Norway leaves network to become an Internet connection via TCP/IP over SATNET; UCL does the same
1982original connections between the Netherlands, Denmark, Sweden, and UK
1982
This leads to one of the first definitions of an "Internet" as a connected set of networks, specifically those using TCP/IP, and "Internet" as connected TCP/IP Internets.
1983
ARPANET split into ARPANET and MILNET; the latter became integrated with the Defense Data Network created the previous year. 68 of the 113 existing nodes went to MILNET
1983CSNET / ARPANET gateway put in place 1983Cutover from NCP to TCP/IP (1 January)
1983Desktop workstations come into being, many with Berkeley UNIX (4.2 BSD) which includes IP networking software (:mpc:)
1983EARN (European Academic and Research Network) established. Very similar to the way BITNET works with a gateway funded by IBM
1983FidoNet developed by Tom Jennings

123
1983Internet Activities Board (IAB) established, replacing ICCB
1983Movement Information Net (MINET) started early in the year in Europe, connected to Internet in Sept
1983Name server developed at Univ of Wisconsin, no longer requiring users to know the exact path to other systems
1983
Networking needs switch from having a single, large time sharing computer connected to the Internet at each site, to instead connecting entire local networks
1983No more Honeywell or Pluribus IMPs; TIPs replaced by TACs (terminal access controller)
1983Stuttgart and Korea get connected
1984Canada begins a one-year effort to network its universities. The NetNorth Network is connected to BITNET in Ithaca from Toronto (:kf1:)
1984Domain Name System (DNS) introduced
1984JANET (Joint Academic Network) established in the UK using the Coloured Book protocols; previously SERCnet
1984JUNET (Japan Unix Network) established using UUCP 1984Kremvax message announcing USSR connectivity to USENET 1984Moderated newsgroups introduced on USENET (mod.*) 1984Neuromancer by William Gibson 1984Number of hosts breaks 1,000
1985
100 years to the day of the last spike being driven on the cross-Canada railroad, the last Canadian university is connected to NetNorth in a one year effort to have coast-to-coast connectivity. (:kf1:)
1985Information Sciences Institute (ISI) at USC is given responsibility for DNS root management by DCA, and SRI for DNS NIC registrations
1985RFC 968: 'Twas the Night Before Start-up
1985
Symbolics.com is assigned on 15 March to become the first registered domain. Other firsts: cmu.edu, purdue.edu, rice.edu, ucla.edu (April); css.gov (June); mitre.org, .uk (July)
1985Whole Earth 'Lectronic Link (WELL) started
1986BARRNET (Bay Area Regional Research Network) established using high speed links. Operational in 1987.
1986
Internet Engineering Task Force (IETF) and Internet Research Task Force (IRTF) comes into existence under the IAB. First IETF meeting held in January at Linkabit in San Diego
1986Mail Exchanger (MX) records developed by Craig Partridge allow non-IP network hosts to have domain addresses.
1986Network News Transfer Protocol (NNTP) designed to enhance Usenet news performance over TCP/IP.
1986
New England gets cut off from the Net as AT&T suffers a fiber optics cable break between Newark/NJ and White Plains/NY. Yes, all seven New England ARPANET trunk lines were in the one severed cable. Outage took place between 1:11 and 12:11 EST on 12 December

124
1986
NSF establishes 5 super-computing centers to provide high-computing power for all (JVNC@Princeton, PSC@Pittsburgh, SDSC@UCSD, NCSA@UIUC, Theory Center@Cornell).
1986NSF-funded SDSCNET, JVNCNET, SURANET, and NYSERNET operational (:sw1:)
1986NSFNET created (backbone speed of 56Kbps)
1986
The first Freenet (Cleveland) comes on-line 16 July under the auspices of the Society for Public Access Computing (SoPAC). Later Freenet program management assumed by the National Public Telecomputing Network (NPTN) in 1989 (:sk2,rab:)
1986The great USENET name change; moderated newsgroups changed in 1987. 1986This allows an explosion of connections, especially from universities. 19871000th RFC: "Request For Comments reference guide"
1987Email link established between Germany and China using CSNET protocols, with the first message from China sent on 20 September. (:wz1:)
1987First TCP/IP Interoperability Conference (March), name changed in 1988 to INTEROP
1987
NSF signs a cooperative agreement to manage the NSFNET backbone with Merit Network, Inc. (IBM and MCI involvement was through an agreement with Merit). Merit, IBM, and MCI later founded ANS.
1987Number of BITNET hosts breaks 1,000 1987Number of hosts breaks 10,000
1987UUNET is founded with Usenix funds to provide commercial UUCP and Usenet access. Originally an experiment by Rick Adams and Mike O'Dell
19882 November - Internet worm burrows through the Net, affecting ~6,000 of the 60,000 hosts on the Internet (:ph1:)
1988CERFnet (California Education and Research Federation network) founded by Susan Estrada.
1988
CERT (Computer Emergency Response Team) formed by DARPA in response to the needs exhibited during the Morris worm incident. The worm is the only advisory issued this year.
1988Countries connecting to NSFNET: Canada (CA), Denmark (DK), Finland (FI), France (FR), Iceland (IS), Norway (NO), Sweden (SE)
1988
DoD chooses to adopt OSI and sees use of TCP/IP as an interim. US Government OSI Profile (GOSIP) defines the set of protocols to be supported by Government purchased products (:gck:)
1988FidoNet gets connected to the Net, enabling the exchange of email and news (:tp1:)
1988First Canadian regionals join NSFNET: ONet via Cornell, RISQ via Princeton, BCnet via Univ of Washington (:ec1:)
1988
Internet Assigned Numbers Authority (IANA) established in December with Jon Postel as its Director. Postel was also the RFC Editor and US Domain registrar for many years.
1988Internet Relay Chat (IRC) developed by Jarkko Oikarinen (:zby:)
1988Los Nettos network created with no federal funding, instead supported by regional members (founding: Caltech, TIS, UCLA, USC, ISI).

125
1988NSFNET backbone upgraded to T1 (1.544Mbps)
1988The first multicast tunnel is established between Stanford and BBN in the Summer of 1988.
1989AARNET - Australian Academic Research Network - set up by AVCC and CSIRO; introduced into service the following year (:gmc:)
1989Corporation for Research and Education Networking (CREN) is formed by merging CSNET into BITNET (August)
1989
Countries connecting to NSFNET: Australia (AU), Germany (DE), Israel (IL), Italy (IT), Japan (JP), Mexico (MX), Netherlands (NL), New Zealand (NZ), Puerto Rico (PR), United Kingdom (UK)
1989Cuckoo's Egg by Clifford Stoll tells the real-life tale of a German cracker group who infiltrated numerous US facilities
1989First link between Australia and NSFNET via Hawaii on 23 June
1989
First relays between a commercial electronic mail carrier and the Internet: MCI Mail through the Corporation for the National Research Initiative (CNRI), and Compuserve through Ohio State Univ (:jg1,ph1:)
1989Number of hosts breaks 100,000 1989RFC 1097: TELNET SUBLIMINAL-MESSAGE Option 1989RFC 1121: Act One - The Poems
1989
RIPE (Reseaux IP Europeens) formed (by European service providers) to ensure the necessary administrative and technical coordination to allow the operation of the pan-European IP Network. (:glg:)
1989UCLA sponsors the Act One symposium to celebrate ARPANET's 20th anniversary and its decomissioning (August)
1990Archie released by Peter Deutsch, Alan Emtage, and Bill Heelan at McGill 1990ARPANET ceases to exist
1990CA*net formed by 10 regional networks as national Canadian backbone with direct connection to NSFNET (:ec1:)
1990
Countries connecting to NSFNET: Argentina (AR), Austria (AT), Belgium (BE), Brazil (BR), Chile (CL), Greece (GR), India (IN), Ireland (IE), Korea (KR), Spain (ES), Switzerland (CH)
1990Electronic Frontier Foundation (EFF) is founded by Mitch Kapor 1990Hytelnet released by Peter Scott (Univ of Saskatchewan)
1990
ISO Development Environment (ISODE) developed to provide an approach for OSI migration for the DoD. ISODE software allows OSI application to operate over TCP/IP (:gck:)
1990RFC 1149: A Standard for the Transmission of IP Datagrams on Avian Carriers 1990RFC 1178: Choosing a Name for Your Computer
1990
The first remotely operated machine to be hooked up to the Internet, the Internet Toaster by John Romkey, (controlled via SNMP) makes its debut at Interop. Pictures: Internode, Invisible
1990The World comes on-line (world.std.com), becoming the first commercial provider of Internet dial-up access

126
1991
Commercial Internet eXchange (CIX) Association, Inc. formed by General Atomics (CERFnet), Performance Systems International, Inc. (PSInet), and UUNET Technologies, Inc. (AlterNet), after NSF lifts restrictions on the commercial use of the Net (March) (:glg:)
1991
Countries connecting to NSFNET: Croatia (HR), Czech Republic (CZ), Hong Kong (HK), Hungary (HU), Poland (PL), Portugal (PT), Singapore (SG), South Africa (ZA), Taiwan (TW), Tunisia (TN)
1991Defense Data Network NIC contract awarded by DISA to Government Systems Inc. who takes over from SRI in May
1991First connection takes place between Brazil, by Fapesp, and the Internet at 9600 baud.
1991Gopher released by Paul Lindner and Mark P. McCahill from the Univ of Minnesota
1991NSFNET backbone upgraded to T3 (44.736Mbps) 1991NSFNET traffic passes 1 trillion bytes/month and 10 billion packets/month 1991PGP (Pretty Good Privacy) released by Philip Zimmerman (:ad1:) 1991RFC 1216: Gigabit Network Economics and Paradigm Shifts
1991RFC 1217: Memo from the Consortium for Slow Commotion Research (CSCR)
1991
Start of JANET IP Service (JIPS) which signalled the changeover from Coloured Book software to TCP/IP within the UK academic network. IP was initially 'tunneled' within X.25. (:gst:)
1991US High Performance Computing Act (Gore 1) establishes the National Research and Education Network (NREN)
1991Wide Area Information Servers (WAIS), invented by Brewster Kahle, released by Thinking Machines Corporation
1991World-Wide Web (WWW) released by CERN; Tim Berners-Lee developer (:pb1:)
1992
Countries connecting to NSFNET: Antarctica (AQ), Cameroon (CM), Cyprus (CY), Ecuador (EC), Estonia (EE), Kuwait (KW), Latvia (LV), Luxembourg (LU), Malaysia (MY), Slovakia (SK), Slovenia (SI), Thailand (TH), Venezuela (VE)
1992First MBONE audio multicast (March) and video multicast (November)
1992IAB reconstituted as the Internet Architecture Board and becomes part of the Internet Society
1992Internet Hunt started by Rick Gates 1992Internet Society (ISOC) is chartered (January) 1992Number of hosts breaks 1,000,000 1992RFC 1300: Remembrances of Things Past 1992RFC 1313: Today's Programming for KRFC AM 1313 - Internet Talk Radio
1992
RIPE Network Coordination Center (NCC) created in April to provide address registration and coordination services to the European Internet community (:dk1:)
1992The term "surfing the Internet" is coined by Jean Armour Polly (:jap:) 1992Veronica, a gopherspace search tool, is released by Univ of Nevada 1992World Bank comes on-line

127
1992Zen and the Art of the Internet is published by Brendan Kehoe (:jap:) 1993Businesses and media begin taking notice of the Internet
1993
Countries connecting to NSFNET: Bulgaria (BG), Costa Rica (CR), Egypt (EG), Fiji (FJ), Ghana (GH), Guam (GU), Indonesia (ID), Kazakhstan (KZ), Kenya (KE), Liechtenstein (LI), Peru (PE), Romania (RO), Russian Federation (RU), Turkey (TR), Ukraine (UA), UAE (AE), US Virgin Islands (VI)
1993directory and database services (AT&T) 1993information services (General Atomics/CERFnet)
1993
InterCon International KK (IIKK) provides Japan's first commercial Internet connection in September. TWICS, though an IIKK leased line, begins offering dial-up accounts the following month (:tb1:)
1993Internet Talk Radio begins broadcasting (:sk2:) 1993InterNIC created by NSF to provide specific Internet services: (:sc1:)
1993Mosaic takes the Internet by storm; WWW proliferates at a 341,634% annual growth rate of service traffic. Gopher's growth is 997%.
1993President Bill Clinton: [email protected] 1993registration services (Network Solutions Inc.) 1993RFC 1437: The Extension of MIME Content-Types to a New Medium 1993RFC 1438: IETF Statements of Boredom (SOBs) 1993United Nations (UN) comes on-line (:vgc:) 1993US National Information Infrastructure Act 1993US White House comes on-line (http://www.whitehouse.gov/): 1993Vice-President Al Gore: [email protected]
1993Worms of a new kind find their way around the Net - WWW Worms (W4), joined by Spiders, Wanderers, Crawlers, and Snakes ...
1994
After noticing that many network software vendors used domain.com in their documentation examples, Bill Woodcock and Jon Postel register the domain. Sure enough, after looking at the domain access logs, it was evident that many users were using the example domain in configuring their applications.
1994Arizona law firm of Canter & Siegel "spams" the Internet with email advertising green card lottery services; Net citizens flame back
1994ARPANET/Internet celebrates 25th anniversary
1994Communities begin to be wired up directly to the Internet (Lexington and Cambridge, Mass., USA)
1994
Countries connecting to NSFNET: Algeria (DZ), Armenia (AM), Bermuda (BM), Burkina Faso (BF), China (CN), Colombia (CO), Jamaica (JM), Jordan (JO), Lebanon (LB), Lithuania (LT), Macao (MO), Morocco (MA), New Caledonia (NC), Nicaragua (NI), Niger (NE), Panama (PA), Philippines (PH), Senegal (SN), Sri Lanka (LK), Swaziland (SZ), Uruguay (UY), Uzbekistan (UZ)
1994First cyberstation, RT-FM, broadcasts from Interop in Las Vegas 1994First Virtual, the first cyberbank, open up for business 1994Japanese Prime Minister on-line (http://www.kantei.go.jp/) 1994New Zealand's Info Tech Prime Minister on-line (http://www.govt.nz/) 1994NSFNET traffic passes 10 trillion bytes/month

128
1994Radio stations start rockin' (rebroadcasting) round the clock on the Net: WXYC at Univ of NC, KJHK at Univ of KS-Lawrence, KUGS at Western WA Univ
1994RFC 1605: SONET to Sonnet Translation 1994RFC 1606: A Historical Perspective On The Usage Of IP Version 9 1994RFC 1607: A VIEW FROM THE 21ST CENTURY 1994Shopping malls arrive on the Internet
1994The National Institute for Standards and Technology (NIST) suggests that GOSIP should incorporate TCP/IP and drop the "OSI-only" requirement (:gck:)
1994Top 10 Domains by Host #: com, edu, uk, gov, de, ca, mil, au, org, net
1994
Trans-European Research and Education Network Association (TERENA) is formed by the merger of RARE and EARN, with representatives from 38 countries as well as CERN and ECMWF. TERENA's aim is to "promote and participate in the development of a high quality international information and telecommunications infrastructure for the benefit of research and education" (October)
1994UK's HM Treasury on-line (http://www.hm-treasury.gov.uk/) 1994US Senate and House provide information servers
1994WWW edges out telnet to become 2nd most popular service on the Net (behind ftp-data) based on % of packets and bytes traffic distribution on NSFNET
1994Yes, it's true - you can now order pizza from the Hut online
1995A number of Net related companies go public, with Netscape leading the pack with the 3rd largest ever NASDAQ IPO share value (9 August)
1995
Country domains registered: Ethiopia (ET), Cote d'Ivoire (CI), Cook Islands (CK) Cayman Islands (KY), Anguilla (AI), Gibraltar (GI), Vatican (VA), Kiribati (KI), Kyrgyzstan (KG), Madagascar (MG), Mauritius (MU), Micronesia (FM), Monaco (MC), Mongolia (MN), Nepal (NP), Nigeria (NG), Western Samoa (WS), San Marino (SM), Tanzania (TZ), Tonga (TO), Uganda (UG), Vanuatu (VU)
1995Emerging Technologies: Mobile code (JAVA, JAVAscript), Virtual environments (VRML), Collaborative tools
1995Hacks of the Year: The Spot (Jun 12), Hackers Movie Page (12 Aug)
1995Hong Kong police disconnect all but 1 of the colony's Internet providers in search of a hacker. 10,000 people are left without Net access. (:api:)
1995Neda Rayaneh Institute (NRI), Iran's first commercial provider, comes online, connecting via satellite to Cadvision, a Canadian provider (:rm1:)
1995NSFNET reverts back to a research network. Main US backbone traffic now routed through interconnected network providers
1995Operation Home Front connects, for the first time, soldiers in the field with their families back home via the Internet.
1995Radio HK, the first commercial 24 hr., Internet-only radio station starts broadcasting
1995RealAudio, an audio streaming technology, lets the Net hear in near real-time
1995
Registration of domain names is no longer free. Beginning 14 September, a $50 annual fee has been imposed, which up until now was subsidized by NSF. NSF continues to pay for .edu registration, and on an interim basis for .gov
1995RFC 1882: The 12-Days of Technology Before Christmas

129
1995
Richard White becomes the first person to be declared a munition, under the USA's arms export control laws, because of an RSA file security encryption program tattooed on his arm (:wired496:)
1995Sun launches JAVA on May 23 1995Technologies of the Year: WWW, Search engines 1995The Canadian Government comes on-line (http://canada.gc.ca/)
1995
The first official Internet wiretap was successful in helping the Secret Service and Drug Enforcement Agency (DEA) apprehend three individuals who were illegally manufacturing and selling cell phone cloning equipment and electronic devices
1995
The new NSFNET is born as NSF establishes the very high speed Backbone Network Service (vBNS) linking super-computing centers: NCAR, NCSA, SDSC, CTC, PSC
1995The Vatican comes on-line (http://www.vatican.va/)
1995
Thousands in Minneapolis-St. Paul (USA) lose Net access after transients start a bonfire under a bridge at the Univ of MN causing fiber-optic cables to melt (30 July)
1995Top 10 Domains by Host #: com, edu, net, gov, mil, org, de, uk, ca, au
1995Traditional online dial-up systems (Compuserve, America Online, Prodigy) begin to provide Internet access
1995WWW surpasses ftp-data in March as the service with greatest traffic on NSFNet based on packet count, and in April based on byte count
19969,272 organizations find themselves unlisted after the InterNIC drops their name service as a result of not having paid their domain name fee
1996A malicious cancelbot is released on USENET wiping out more than 25,000 messages
1996China: requires users and ISPs to register with the police
1996
Country domains registered: Qatar (QA), Central frican Republic (CF), Oman (OM), Norfolk Island (NF), Tuvalu (TV), French Polynesia (PF), Syria (SY), Aruba (AW), Cambodia (KH), French Guiana (GF), Eritrea (ER), Cape Verde (CV), Burundi (BI), Benin (BJ) Bosnia-Herzegovina (BA), Andorra (AD), Guadeloupe (GP), Guernsey (GG), Isle of Man (IM), Jersey (JE), Lao (LA), Maldives (MV), Marshall Islands (MH), Mauritania (MR), Northern Mariana Islands (MP), Rwanda (RW), Togo (TG), Yemen (YE), Zaire (ZR)
1996Domain name tv.com sold to CNET for US$15,000
1996Emerging Technologies: Virtual environments (VRML), Collaborative tools, Internet appliance (Network Computer)
1996Germany: cuts off access to some newsgroups carried on Compuserve
1996
Hacks of the Year: US Dept of Justice (17 Aug), CIA (19 Sep), Air Force (29 Dec), UK Labour Party (6 Dec), NASA DDCSOL - USAFE - US Air Force (30 Dec)
1996Internet phones catch the attention of US telecommunication companies who ask the US Congress to ban the technology (which has been around for years)
1996
Malaysian Prime Minister Mahathir Mohamad, PLO Leader Yasser Arafat, and Phillipine President Fidel Ramos meet for ten minutes in an online interactive chat session on 17 January.
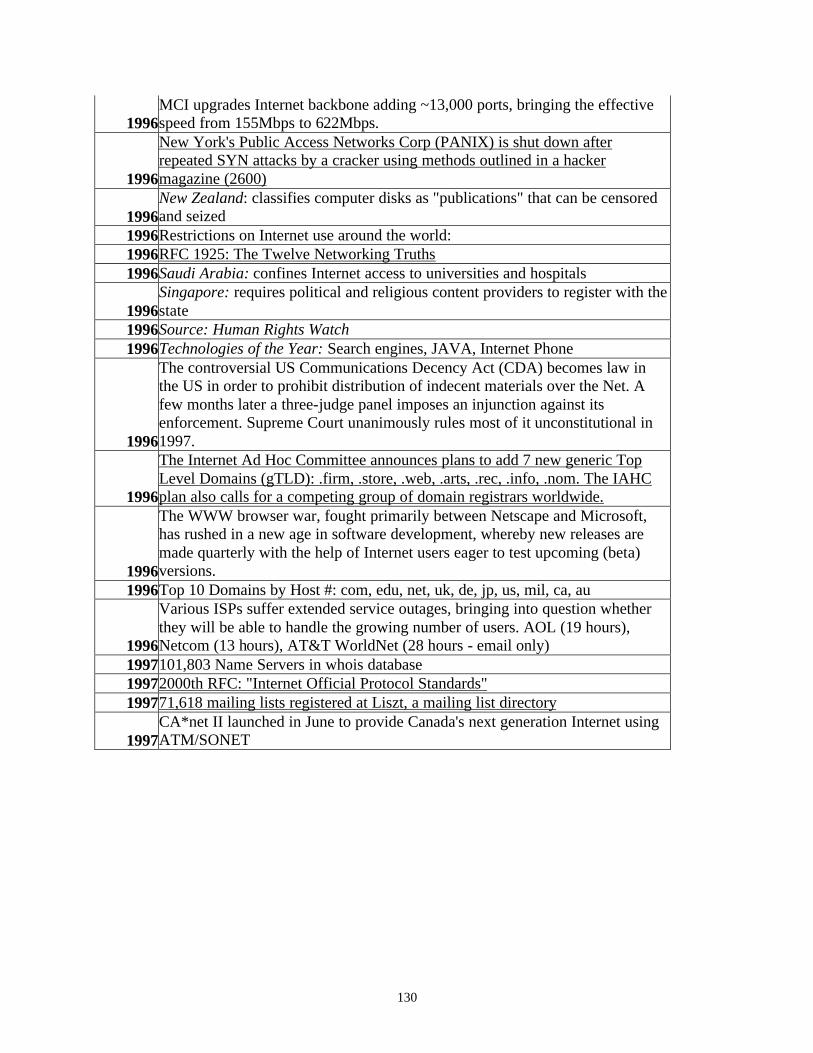
130
1996MCI upgrades Internet backbone adding ~13,000 ports, bringing the effective speed from 155Mbps to 622Mbps.
1996
New York's Public Access Networks Corp (PANIX) is shut down after repeated SYN attacks by a cracker using methods outlined in a hacker magazine (2600)
1996New Zealand: classifies computer disks as "publications" that can be censored and seized
1996Restrictions on Internet use around the world: 1996RFC 1925: The Twelve Networking Truths 1996Saudi Arabia: confines Internet access to universities and hospitals
1996Singapore: requires political and religious content providers to register with the state
1996Source: Human Rights Watch 1996Technologies of the Year: Search engines, JAVA, Internet Phone
1996
The controversial US Communications Decency Act (CDA) becomes law in the US in order to prohibit distribution of indecent materials over the Net. A few months later a three-judge panel imposes an injunction against its enforcement. Supreme Court unanimously rules most of it unconstitutional in 1997.
1996
The Internet Ad Hoc Committee announces plans to add 7 new generic Top Level Domains (gTLD): .firm, .store, .web, .arts, .rec, .info, .nom. The IAHC plan also calls for a competing group of domain registrars worldwide.
1996
The WWW browser war, fought primarily between Netscape and Microsoft, has rushed in a new age in software development, whereby new releases are made quarterly with the help of Internet users eager to test upcoming (beta) versions.
1996Top 10 Domains by Host #: com, edu, net, uk, de, jp, us, mil, ca, au
1996
Various ISPs suffer extended service outages, bringing into question whether they will be able to handle the growing number of users. AOL (19 hours), Netcom (13 hours), AT&T WorldNet (28 hours - email only)
1997101,803 Name Servers in whois database 19972000th RFC: "Internet Official Protocol Standards" 199771,618 mailing lists registered at Liszt, a mailing list directory
1997CA*net II launched in June to provide Canada's next generation Internet using ATM/SONET

131
1997
Country domains registered: Falkland Islands (FK), East Timor (TP), R of Congo (CG), Christmas Island (CX), Gambia (GM), Guinea-Bissau (GW), Haiti (HT), Iraq (IQ), Libya (LY), Malawi (MW), Martinique (MQ), Montserrat (MS), Myanmar (MM), French Reunion Island (RE), Seychelles (SC), Sierra Leone (SL), Somalia (SO), Sudan (SD), Tajikistan (TJ), Turkmenistan (TM), Turks and Caicos Islands (TC), British Virgin Islands (VG), Heard and McDonald Islands (HM), French Southern Territories (TF), British Indian Ocean Territory (IO), Svalbard and Jan Mayen Islands (SJ), St Pierre and Miquelon (PM), St Helena (SH), South Georgia/Sandwich Islands (GS), Sao Tome and Principe (ST), Ascension Island (AC), US Minor Outlying Islands (UM), Mayotte (YT), Wallis and Futuna Islands (WF), Tokelau Islands (TK), Chad Republic (TD), Afghanistan (AF), Cocos Island (CC), Bouvet Island (BV), Liberia (LR), American Samoa (AS), Niue (NU), Equatorial New Guinea (GQ), Bhutan (BT), Pitcairn Island (PN), Palau (PW), DR of Congo (CD)
1997Domain name business.com sold for US$150,000
1997
Early in the morning of 17 July, human error at Network Solutions causes the DNS table for .com and .net domains to become corrupted, making millions of systems unreachable.
1997Emerging Technologies: Push, Streaming Media [:twc:]
1997Hacks of the Year: Indonesian Govt (19 Jan, 10 Feb, 24 Apr, 30 Jun, 22 Nov), NASA (5 Mar), UK Conservative Party (27 Apr), Spice Girls (14 Nov)
1997In protest of the DNS monopoly, AlterNIC's owner, Eugene Kashpureff, hacks DNS so users going to www.internic.net end up at www.alternic.net
1997Longest hostname registered with InterNIC: CHALLENGER.MED.SYNAPSE.UAH.UALBERTA.CA
1997RFC 2100: The Naming of Hosts 1997Technologies of the Year: Push, Multicasting
1997
The American Registry for Internet Numbers (ARIN) is established to handle administration and registration of IP numbers to the geographical areas currently handled by Network Solutions (InterNIC), starting March 1998.
1997Top 10 Domains by Host #: com, edu, net, jp, uk, de, us, au, ca, mil
1998ABCNews.com accidentally posts test US election returns one day early (2 November)
1998Bandwidth Generators: Winter Olympics (Feb), World Cup (Jun-Jul), Starr Report (11 Sep), Glenn space launch
1998Canada kicks off CA*net 3, the first national optical Internet 1998CDA II and a ban on Net taxes are signed into US law (21 October)
1998
Chinese government puts Lin Hai on trial for "inciting the overthrow of state power" for providing 30,000 email addresses to a US Internet magazine (December) [ He is later sentenced to two years in jail ]
1998Companies flock to the Turkmenistan NIC in order to register their name under the .tm domain, the English abbreviation for trademark
1998Compaq pays US$3.3million for altavista.com 1998Country domains registered: Nauru (NR), Comoros (KM)

132
1998Electronic postal stamps become a reality, with the US Postal Service allowing stamps to be purchased and downloaded for printing from the Web.
1998Emerging Technologies: E-Trade, XML, Intrusion Detection
1998French Internet users give up their access on 13 December to boycott France Telecom's local phone charges (which are in addition to the ISP charge)
1998Hacks of the Year: US Dept of Commerce (20 Feb), New York Times (13 Sep), China Society for Human Rights Studies (26 Oct), UNICEF (7 Jan)
1998Hobbes' Internet Timeline is released as RFC 2235 & FYI 32
1998Indian ISP market is deregulated in November causing a rush for ISP operation licenses
1998
Internet users get to be judges in a performance by 12 world champion ice skaters on 27 March, marking the first time a television sport show's outcome is determined by its viewers.
1998La Fête de l'Internet, a country-wide Internet fest, is held in France 20-21 March
1998Network Solutions registers its 2 millionth domain on 4 May 1998Open source software comes of age 1998RFC 2321: RITA -- The Reliable Internetwork Troubleshooting Agent 1998RFC 2322: Management of IP numbers by peg-dhcp 1998RFC 2323: IETF Identification and Security Guidelines 1998RFC 2324: Hyper Text Coffee Pot Control Protocol (HTCPCP/1.0)
1998San Francisco sites without off-city mirrors go offline as the city blacks out on 8 December
1998Technologies of the Year: E-Commerce, E-Auctions, Portals 1998Top 10 Domains by Host #: com, net, edu, mil, jp, us, uk ,de, ca, au
1998US Depart of Commerce (DoC) releases the Green Paper outlining its plan to privatize DNS on 30 January. This is followed up by a White Paper on June 5
1998
US DoC enters into an agreement with the Internet Corporation for Assigned Numbers (ICANN) to establish a process for transitioning DNS from US Government management to industry (25 November)
1998Web size estimates range between 275 (Digital) and 320 (NEC) million pages for 1Q
1999.ps is registered to Palestine (11 Oct)
1999A forged Web page made to look like a Bloomberg financial news story raised shares of a small technology company by 31% on 7 April.
1999Abilene, the Internet2 network, reaches across the Atlantic and connects to NORDUnet and SURFnet
1999Activists Net-wide target the world's financial centers on 18 June, timed to coincide with the G8 Summit. Little actual impact is reported.
1999business.com is sold for US$7.5million (it was purchased in 1997 for US$150,000 (30 Nov)
1999Emerging Technologies: Net-Cell Phones, Thin Computing, Embedded Computing
1999European Parliament proposes banning the caching of Web pages by ISPs
1999First Internet Bank of Indiana, the first full-service bank available only on the

133
Net, opens for business on 22 February
1999First large-scale Cyberwar takes place simultaneously with the war in Serbia/Kosovo
1999Free computers are all the rage (as long as you sign a long term contract for Net service)
1999
Hacks of the Year: Star Wars (8 Jan), .tp (Jan), USIA (23 Jan), E-Bay (13 Mar), US Senate (27 May), NSI (2 Jul), Paraguay Gov't (20 Jul), AntiOnline (5 Aug), Microsoft (26 Oct), UK Railtrack (31 Dec)
1999IBM becomes the first Corporate partner to be approved for Internet2 access
1999
ICANN announces the five testbed registrars for the competitive Shared Registry System on 21 April: AOL, CORE, France Telecom/Oléane, Melbourne IT, Register.com. 29 additional post-testbed registrars are also selected on 21 April, followed by 8 on 25 May, 15 on 6 July, and so on for a total of 98 by year's end. The testbed, originally scheduled to last until 24 June, is extended until 10 September, and then 30 November. The first registrar to come online is Register.com on 7 June
1999Internet access becomes available to the Saudi Arabian (.sa) public in January
1999ISOC approves the formation of the Internet Societal Task Force (ISTF). Vint Cerf serves as first chair
1999MCI/Worldcom launches vBNS+, a commercialized version of vBNS targeted at smaller educational and research institutions
1999MCI/Worldcom, the vBNS provider for NSF, begins upgrading the US backbone to 2.5GBps
1999RFC 2549: IP over Avian Carriers with Quality of Service 1999RFC 2550: Y10K and Beyond 1999RFC 2551: The Roman Standards Process -- Revision III 1999RFC 2555: 30 Years of RFCs 1999RFC 2626: The Internet and the Millennium Problem (Year 2000) 1999Somalia gets its first ISP - Olympic Computer (Sep) 1999Technologies of the Year: E-Trade, Online Banking, MP3
1999The Internet Fiesta kicks off in March across Europe, building on the success of La Fête de l'Internet held in 1998
1999
The Web becomes the focal point of British politics as a list of MI6 agents is released on a UK Web site. Though forced to remove the list from the site, it was too late as the list had already been replicated across the Net. (15 May)
1999Top 10 TLDs by Host #: com, net, edu, jp, uk, mil, us, de, ca, au 1999US State Court rules that domain names are property that may be garnished 1999vBNS reaches 101 connections
1999vBNS sets up an OC48 link between CalREN South and North using Juniper M40 routers
1999Viruses of the Year: Melissa (March), ExploreZip (June)
2000A massive denial of service attack is launched against major web sites, including Yahoo, Amazon, and eBay in early February
2000Hacks of the Year: RSA Security (Feb), Apache (May), Nike (June)

134
2000ICANN redelegates the .pn domain, returning it to the Pitcairn Island community (February)
2000RFC 2795: The Infinite Monkey Protocol Suite 2000Technologies of the Year: ASP, NAPSTER?, IPV6?
2000The US timekeeper (USNO) and a few other time services around the world report the new year as 19100 on 1 Jan
2000Various domain name hijackings took place in late May and early June, including Internet.com, bali.com, and web.net
2000Viruses of the Year: Love Letter (May) 2000Web size estimates by NEC-RI and Inktomi surpass 1 billion indexable pages

135
Appendix B
REAL ESTATE FIRM LETTER Dear Real Estate Firm Survey Participant:
As part of our Graduate Research Project that is required at Montreat College, you have been chosen at random to participate in a survey that will supply needed information for this project. Your response to this project is crucial to the success of our research project and our graduation.
The name of our research project is “ The Effects of the Internet on Residential Real
Estate in Mecklenburg County ”. Our research sample is being taken from firms who actively engage in the brokering of real estate in Mecklenburg County. The reason for this project is to see to what degree the Internet has effected real estate marketing in Mecklenburg County.
Your firm’s name was selected at random from a list of Mecklenburg County Real Estate
Firms taken from the Internet. Your response is crucial because we must have a required amount of respondents for our survey to be “statistically significant”. As students we must pay for the expense of this study in addition to the cost of our college tuition and fees. If you do not respond then we will have to repeat this mailing and its expense until we get the required percentage of respondents and this would be quite expensive for us as students.
We are not asking that you send your name or your firm’s name with your
response. Therefore you and your firm will remain anonymous to us. Your name will not be listed in the project. Also, in reference to this study, neither we nor anyone else will ever contact you in reference to these results ever again.
Please place your response in the enclosed addressed postage paid envelope and mail it to
us immediately. We state again that your response is important to the success of our research project and our consequent graduation. Please respond at your earliest possible convenience.
Thank you for your time and participation in this endeavor. Sincerely, Montreat College Graduate Program Students Daniel Elmaleh, Jeff Parker,
Rob Cassam, & Denise Simmons P.S.: If you have any questions please respond to:
Daniel Elmaleh 423 Charles Avenue Charlotte, N.C. 28205

136
Appendix C
REAL ESTATE CONSUMER LETTER
Dear Survey Participant:
As part of our Graduate Research Project that is required at Montreat College, you have been chosen at random to participate in a survey that will supply needed information for this project. Your response to this project is crucial to the success of our research project and our graduation.
The name of our research project is “ The Effects of the Internet on Residential Real
Estate in Mecklenburg County ”. Our research sample is being taken from persons who bought or sold homes during April, May, or June of 1999 in Mecklenburg county. The reason for this project is to see to what degree the Internet has effected real estate marketing in Mecklenburg County.
Your name was selected at random from Mecklenburg county courthouse records
because you bought or sold a home during April, May, or June of 1999 in Mecklenburg County. Your response is crucial because we must have a required amount of respondents for our survey to be “statistically significant”. As students we must pay for the expense of this study in addition to the cost of our college tuition and fees. If you do not respond then we will have to repeat this mailing and its expense until we get the required percentage of respondents and this would be quite expensive for us as students.
We are not asking that you send your name with your response. Therefore you can
remain anonymous. Your name will not be listed in the project and in reference to this study not we or anyone else will contact you in reference to these results.
Please place your response in the enclosed addressed postage paid envelope and mail it to
us immediately. We state again that your response is important to the success of our research project and our consequent graduation. Please respond at your earliest possible convenience.
Thank you for your time and participation in this endeavor. Sincerely,
Montreat College Graduate Program Students Daniel Elmaleh, Jeff Parker,
Rob Cassam, & Denise Simmons P.S.: If you have any questions please respond to:
Daniel Elmaleh 423 Charles Avenue Charlotte, N.C. 28205

137
Appendix D
REAL ESTATE FIRM SURVEY (Actual Survey was condensed to one 8.5” by 11” sheet of paper)
1. To what extent do you estimate (in terms of percentage of prospects) the Internet has directly increased the total number of prospects obtained for your company?
___>-30___-30___-20___-10___ 10 ___ 20___ 30___ 40___50___60___70___80___90__100 2. To what extent do you believe the information on the Internet will replace your need for the services of a traditional residential real estate broker?
Don’t Believe Some Believe 1 2 3 4 5 6 7 8 9
3. Please complete the following: Age: ____ 18-21 ____ 22-30 ____31-40 ____41-50 ____51-62 ____ 62+ Gender: ____ Male ____ Female
Income: ____ 0-$20,000 _____$20,001-$35,000 ____ $35,001-$50,000 ___ $50,001-$65,000 ___ $65,000___$80,000 ___ $80,000 + Ethnicity: ___ Caucasian ___ African American ___ Asian ___ Hispanic ___ Other
4. To what extent (in terms of percentage of prospects obtained where a prospect person interested in buying or selling a property) has the Internet directly increased the prospects obtained for your company?
___>-30___-30___-20___-10___ 10 ___ 20___ 30___ 40___50___60___70___80___90__100 5. To what extent do you use the Internet to provide your customer with information on listings or offerings?
Didn’t Use Some Heavily Used 1 2 3 4 5 6 7 8 9
6. To what extent do you recommend to clients that they use the Internet as a research tool for gathering information about the city, demographics or crime?
None Some Many 1 2 3 4 5 6 7 8 9
7. To what extent do you recommend to clients that they use the Internet as a research tool for gathering information about a specific property?
Few Some Many 1 2 3 4 5 6 7 8 9
8. To what extent do you recommend that clients use the Internet as a research tool for gathering information about ancillary real estate services such as attorneys, lenders, appraisers, or contractors?
None Some Many 1 2 3 4 5 6 7 8 9
9. Based on your knowledge, to what extent did your clients use the Internet for any phase of the transaction?
Few Some Many 1 2 3 4 5 6 7 8 9
10. Demographics:
Does your firm have a web site? ___ yes ___ no If yes, how long has it been up and running?______ How many full-time agents do you retain?______ How long have you been in business?____ Do you have an Internet Marketing Plan? ___ yes ___ no
Do you have plans for future Internet usage? ___ yes ___ no

138
Appendix E
REAL ESTATE CONSUMER SURVEY (Actual Survey was condensed to one 8.5” by 3.68” sheet of paper)
1. How comfortable would you feel using the Internet to shop for a house? Extremely Negative Extremely Positive
1 2 3 4 5 6 7 8 9 2. To what extent are you aware of the Internet services available to you as a residential real estate consumer?
Extremely Unaware Extremely Aware 1 2 3 4 5 6 7 8 9
3. To what extent did you use the available information via the Internet to complete a portion of your real estate
transaction? None Some Many 1 2 3 4 5 6 7 8 9
4. Did you consider buying or selling a house using the Internet?
___ Yes ___ No 5. To what extent are you aware of the availability of residential real estate information via Internet?
None Some Very 1 2 3 4 5 6 7 8 9
6. To what extent do you believe the information on the Internet will replace your need for the services of a
traditional residential real estate broker? Negative Some Positive 1 2 3 4 5 6 7 8 9
8. I used the following resources on the Internet to help complete my transaction:
q Search for property q Search for a Realtor q Search for lending source q Applied for a loan q Search for property tax values q Search for past sales information q Search for Closing attorney q Search for area/neighborhood statistics such as crime and demographics q Search area/neighborhood schools and churches q Search for ancillary real estate services such as appraisers, inspectors, and contractors q Other:_______________________________________________________________
9. Please complete the following: Age: 18-21 ____: 22-30 ____: 31-40 ____: 41-50 ____: 51-62 ____: 62+____ Gender: Male ____: Female____ Income: 0-$20,000 _____: $20,001-$35,000 ____: $35,001-$50,000 ___:
$50,001-$65,000 ___: $65,000-$80,000___: $80,000 +____ Ethic Background: White ___: Black ___: Asian____: Hispanic ___: Other____

139
Appendix F
REAL ESTATE FIRM SURVEY DATA TABULATIONS
Listed below are the extended tabulated Tables of the Summarized Tables that are
presented throughout Chapter 4 for the data collected from the Real Estate Firm Questionnaire.
Real Estate Firm Question 1
Table F1
Table for the Summary of the Responses to Question 1 on the Real Estate Firm
Questionnaire
1. To what extent do you estimate (in terms of percentage of prospects) the Internet has
directly increased the total number of prospects obtained for your company?
Summary for Question 1 Response
Value Response
Total % Cumulative
% Reverse
Cumulative % Mean Standard
Deviation -30 7 25.93% 25.93% 100.00% 8.8889 36.7249 -20 1 3.70% 29.63% 74.07% -10 1 3.70% 33.33% 70.37% 0 3 11.11% 44.44% 66.67%
10 7 25.93% 70.37% 55.56% 20 2 7.41% 77.78% 29.63% 30 3 11.11% 88.89% 22.22% 90 2 7.41% 96.30% 11.11% 100 1 3.70% 100.00% 3.70%
Grand Total 27 100.00%

140
Real Estate Firm Question 2
Table F2
Table for the Summary of the Responses to Question 2 on the Real Estate Firm
Questionnaire
2. To what extent do you believe the information on the Internet will replace your need for
the services of a traditional residential real estate broker?
Summary for Question 2 Response
Value Response
Total % Cumulative
% Reverse
Cumulative % Mean Standard
Deviation 1 5 18.52% 18.52% 100.00% 3.5185 1.6955 2 3 11.11% 29.63% 81.48% 3 4 14.81% 44.44% 70.37% 4 6 22.22% 66.67% 55.56% 5 7 25.93% 92.59% 33.33% 6 1 3.70% 96.30% 7.41% 7 1 3.70% 100.00% 3.70%
Grand Total 27 100.00%

141
Real Estate Firm Question 4
Table F3
Table for the Summary of the Responses to Question 4 on the Real Estate Firm
Questionnaire
4. To what extent (in terms of percentage of prospects obtained where a prospect is
a person interested in buying or selling a property) has the Internet directly
increased the prospects obtained for your company?
Summary for Question 4 Response
Value Response
Total % Cumulative
% Reverse
Cumulative % Mean Standard
Deviation -30 7 25.93% 25.93% 100.00% 7.0370 33.0285 -20 1 3.70% 29.63% 74.07% -10 1 3.70% 33.33% 70.37% 0 3 11.11% 44.44% 66.67%
10 7 25.93% 70.37% 55.56% 20 2 7.41% 77.78% 29.63% 30 3 11.11% 88.89% 22.22% 50 1 3.70% 92.59% 11.11% 90 2 7.41% 100.00% 7.41%
Grand Total 27 100.00%

142
Real Estate Firm Question 5
Table F5
Table for the Summary of the Responses to Question 5 on the Real Estate Firm
Questionnaire
5. To what extent do you use the Internet to provide your customer
with information on listings or offerings?
Summary for Question 5 Response
Value Response
Total % Cumulative
% Reverse
Cumulative % Mean Standard
Deviation 2 2 7.41% 7.41% 100.00% 4.9630 1.5059 3 1 3.70% 11.11% 92.59% 4 9 33.33% 44.44% 88.89% 5 5 18.52% 62.96% 55.56% 6 4 14.81% 77.78% 37.04% 7 6 22.22% 100.00% 22.22%
Grand Total 27 100.00%
Real Estate Firm Question 6
Table F6
Table for the Summary of the Responses to Question 6 on the Real Estate Firm
Questionnaire
6. To what extent do you recommend to clients that they use the Internet as a research tool
for gathering information about the city, demographics or crime?
Summary for Question 6 Response
Value Response
Total % Cumulative
% Reverse
Cumulative % Mean Standard
Deviation 1 3 11.11% 11.11% 100.00% 4.8889 2.2758 2 3 11.11% 22.22% 88.89% 3 3 11.11% 33.33% 77.78% 5 6 22.22% 55.56% 66.67% 7 12 44.44% 100.00% 44.44%
Grand Total 27 100.00%

143
Real Estate Firm Question 7
Table F7
Table for the Summary of the Responses to Question 7 on the Real Estate Firm
Questionnaire
7. To what extent do you recommend to clients that they use the Internet as a research tool for gathering information about a specific property? Summary for Question 7
Response Value
Response Total
% Cumulative %
Reverse Cumulative %
Mean Standard Deviation
1 3 11.11% 11.11% 100.00% 3.6667 1.9612 2 9 33.33% 44.44% 88.89% 3 1 3.70% 48.15% 55.56% 4 2 7.41% 55.56% 51.85% 5 8 29.63% 85.19% 44.44% 6 1 3.70% 88.89% 14.81% 7 3 11.11% 100.00% 11.11%
Grand Total 27 100.00%

144
Real Estate Firm Question 8
Table F8
Table for the Summary of the Responses to Question 8 on the Real Estate Firm
Questionnaire
8. To what extent do you recommend that clients use the Internet as a research as
a tool for gathering information about ancillary real estate services
such as attorneys, lenders, appraisers, or contractors?
Summary for Question 8 Response
Value Response
Total % Cumulative
% Reverse
Cumulative % Mean Standard
Deviation 1 10 37.04% 37.04% 100.00% 2.6296 1.8218 2 8 29.63% 66.67% 62.96% 4 3 11.11% 77.78% 33.33% 5 3 11.11% 88.89% 22.22% 6 3 11.11% 100.00% 11.11% Grand Total 27 100.00%

145
Real Estate Firm Question 9
Table F9
Table for the Summary of the Responses to Question 9 on the Real Estate Firm
Questionnaire
9. Based on your knowledge, to what extent did your clients use
the Internet for any phase of the transaction?
Summary for Question 9 Response
Value Response
Total % Cumulative
% Reverse
Cumulative % Mean Standard
Deviation 1 3 11.11% 11.11% 100.00% 4.5556 2.5012 2 6 22.22% 33.33% 88.89% 4 3 11.11% 44.44% 66.67% 5 6 22.22% 66.67% 55.56% 6 3 11.11% 77.78% 33.33% 7 3 11.11% 88.89% 22.22% 9 3 11.11% 100.00% 11.11%
Grand Total 27 100.00%
Real Estate Broker Question 10
Table F10
Summary Table for Responses on Real Estate Questionnaire:
Does your firm have a web site?
Number of Firms % YES 14 51.9% NO 13 48.1%

146
How Long has Web-site been running?
Table F11
Summary Table for Responses on Real Estate Questionnaire:
How long has it (web site) been up and running?
No. of Years 1 Year 2 Years 3 Years 5 Years Total Firms No of Firms 6 3 2 3 14 %of All Firms 22.2% 11.1% 7.4% 11.1% 51.8%
Full –time agents-Firm
Table F12
Summary Table for Responses on Real Estate Questionnaire:
How many full time agents do you retain?
No. of Agents Firm Employs Less Than 10 10 to 20 Greater than 20 No of Firms 14 7 6
Length of time in business-Firm
Table F13
Summary Table for Responses on Real Estate Questionnaire:
How long have you been in business?
No. of Years 10 years or less
10 to 20 years
20 to 50 years
50 to 100 years
Over 100 years
No of Firms 6 6 10 3 2

147
Internet Marketing Plan versus Plans for Future Internet Usage-Firm
Table F14
Summary Table for Responses on Real Estate Questionnaire:
Do you have an Internet Marketing Plan? & Do you have plans for future Internet
usage?
(The Two Questions Above are answered in the Cross-Tabulated Table
below)
Does Your Firm have Plans for future Internet Usage?
YES % NO % TOTAL % YES 12 firms 44.5% 3 firms 11.1% 15 firms 55.6%
Does Your Firm have an Internet Marketing Plan?
NO 9 firms 33.3% 3 firms 11.1% 12 firms 44.4%
TOTAL 21 firms 77.8% 6 firms 22.2% 27 firms 100%

148
Appendix G
REAL ESTATE CONSUMER SURVEY DATA TABULATIONS
Listed below are the extended tabulated Tables of the Summarized Tables that are
presented throughout Chapter 4 for the data collected from the Consumer Questionnaire.
Age versus Income-Consumer
Table G1
Cross Tabulation of Age by Income for Respondents on Consumer Questionnaire
INCOME AGE 20-
35K % 35-
50K % 50-
65K % 65-
80K % 80
K+ % No
Rspnse % Grand
Total %
22-30 5 4.4% 4 3.5% 6 5.3% 1 0.9% 5 4.4% 25 22.1% 31-40 1 0.9% 2 1.8% 3 2.7% 5 4.4% 30 26.5% 4 3.5% 41 36.3% 41-50 2 1.8% 5 4.4% 18 15.9% 27 23.9% 51-62 1 0.9% 4 3.5% 9 8.0% 2 1.8% 14 12.4% 62+ 1 0.9% 1 0.9% 3 2.7% 5 4.4% No Response 1 0.9% 1 0.9% Grand Total
6 5.3% 8 7.1% 16 14.2% 11 9.7% 66 58.4% 6 5.3% 113 100.0%
Race versus Income-Consumer
Table G2
Cross Tabulation of Income by Race for Respondents on Consumer Questionnaire
INCOME RACE 20-
35K % 35-
50K % 50-
65K % 65-
80K % 80
K+ % No
Rspns % Grand
Total %
Asian 2 1.8% 1 0.9% 1 0.9% 1 0.9% 5 4.4% Black 3 2.7% 1 0.9% 1 0.9% 1 0.9% 1 0.9% 7 6.2% Other 1 0.9% 1 0.9% 2 1.8% White 3 2.7% 7 6.2% 12 10.6% 9 8.0% 63 55.8% 4 3.5% 98 86.7% No Response 1 0.9% 1 0.9%
Grand Total
6 5.3% 8 7.1% 16 14.2% 11 9.7% 66 58.4% 6 5.3% 113 100.0%

149
Gender versus Income-Consumer
Table G3
Cross Tabulation of Income by Gender for Respondents on Consumer Questionnaire
INCOME GENDER 20-
35K % 35-
50K % 50-
65K % 65-
80K % 80
K+ % No
Rspns % Grand
Total %
Female 4 3.5% 3 2.7% 5 4.4% 6 5.3% 32 28.3% 3 2.7% 53 46.9% Male 2 1.8% 5 4.4% 11 9.7% 5 4.4% 33 29.2% 2 1.8% 58 51.3% No Response 1 0.9% 1 0.9% 2 1.8% Grand Total
6 5.3% 8 7.1% 16 14.2% 11 9.7% 66 58.4% 6 5.3% 113 100.0%
Age versus Race-Consumer
Table G4
Cross Tabulation of Age by Race for Respondents on Consumer Questionnaire
AGE RACE 22-
30 % 31-
40 % 41-
50 % 51-
62 % 62+ % No
Rspns % Grand
Total %
Asian 2 1.8% 1 0.9% 2 1.8% 5 4.4% Black 5 4.4% 2 1.8% 7 6.2% Other 1 0.9% 1 0.9% 2 1.8% White 16 14.2% 38 33.6% 26 23.0% 12 10.6% 5 4.4% 1 0.9% 98 86.7% No Response
1 0.9% 1 0.9%
Grand Total
25 22.1% 41 36.3% 27 23.9% 14 12.4% 5 4.4% 1 0.9% 113 100.0%

150
Age versus Race-Consumer
Table G5
Cross Tabulation of Age by Gender for Respondents on Consumer Questionnaire
AGE GENDER 22-
30 % 31-
40 % 41-
50 % 51-
62 % 62+ % No
Rspns % Grand
Total %
Female 14 12.4% 18 15.9% 14 12.4% 6 5.3% 1 0.9% 53 46.9% Male 10 8.8% 23 20.4% 13 11.5% 8 7.1% 4 3.5% 58 51.3% No Response
1 0.9% 0.0% 0.0% 0.0% 0.0% 1 0.9% 2 1.8%
Grand Total
25 22.1% 41 36.3% 27 23.9% 14 12.4% 5 4.4% 1 0.9% 113 100.0%
Consumer Question 1
Table G6
Table for the Summary of the Responses to Question 1 on the Consumer Questionnaire
1. How comfortable would you feel using the Internet to shop for a house?
Summary for Question 1 Response
Value Response
Total % Cumulative
% Reverse
Cumulative % Mean Standard
Deviation 1 7 6.19% 6.19% 100.00% 6.0442 2.3844 2 5 4.42% 10.62% 93.81% 3 7 6.19% 16.81% 89.38% 4 7 6.19% 23.01% 83.19% 5 19 16.81% 39.82% 76.99% 6 12 10.62% 50.44% 60.18% 7 19 16.81% 67.26% 49.56% 8 16 14.16% 81.42% 32.74% 9 21 18.58% 100.00% 18.58%
Grand Total 113 100.00%

151
Consumer Question 2
Table G7
Table for the Summary of the Responses to Question 2 on the Consumer Questionnaire
2. To what extent are you aware of the Internet services available to you as a residential
real estate consumer?
Summary for Question 2 Response
Value Response
Total % Cumulative
% Reverse
Cumulative % Mean Standard
Deviation 1 5 4.42% 4.42% 100.00% 5.8053 2.4233 2 6 5.31% 9.73% 95.58% 3 15 13.27% 23.01% 90.27% 4 11 9.73% 32.74% 76.99% 5 10 8.85% 41.59% 67.26% 6 16 14.16% 55.75% 58.41% 7 16 14.16% 69.91% 44.25% 8 14 12.39% 82.30% 30.09% 9 20 17.70% 100.00% 17.70%
Grand Total 113 100.00%

152
Consumer Question 3
Table G8
Table for the Summary of the Responses to Question 3 on the Consumer Questionnaire
3. To what extent did you use the available information via the Internet
to complete a portion of your real estate transaction?
Summary for Question 3 Response
Value Response
Total % Cumulative
% Reverse
Cumulative % Mean Standard
Deviation 1 58 51.33% 51.33% 100.00% 2.4602 2.0790 2 18 15.93% 67.26% 48.67% 3 11 9.73% 76.99% 32.74% 4 7 6.19% 83.19% 23.01% 5 5 4.42% 87.61% 16.81% 6 6 5.31% 92.92% 12.39% 7 4 3.54% 96.46% 7.08% 8 2 1.77% 98.23% 3.54% 9 2 1.77% 100.00% 1.77%
Grand Total 113 100.00%
Consumer Question 4
Table G9
Table for the Summary of the Responses to Question 4 on the Consumer Questionnaire
4. Did you consider buying or selling a house using the Internet?
Summary for Question 4 Number of Responses % YES 20 17.70% NO 93 82.30%
TOTAL 113 100%

153
Consumer Question 5
Table G10
Table for the Summary of the Responses to Question 5 on the Consumer Questionnaire
5. To what extent are you aware of the availability of residential
real estate information via Internet?
Summary for Question 5 Response
Value Response
Total % Cumulative
% Reverse
Cumulative % Mean Standard
Deviation 1 4 3.54% 3.54% 100.00% 5.9204 2.4790 2 10 8.85% 12.39% 96.46% 3 11 9.73% 22.12% 87.61% 4 7 6.19% 28.32% 77.88% 5 14 12.39% 40.71% 71.68% 6 18 15.93% 56.64% 59.29% 7 11 9.73% 66.37% 43.36% 8 13 11.50% 77.88% 33.63% 9 25 22.12% 100.00% 22.12%
Grand Total 113 100.00%

154
Consumer Question 6
Table G11
Table for the Summary of the Responses to Question 6 on the Consumer Questionnaire
6. To what extent do you believe the information on the Internet will replace the need for
the services of a traditional residential real estate broker?
Summary for Question 6 Response
Value Response
Total % Cumulative
% Reverse
Cumulative % Mean Standard
Deviation 1 24 21.24% 21.24% 100.00% 3.5135 1.9599 2 18 15.93% 37.17% 78.76% 3 15 13.27% 50.44% 62.83% 4 16 14.16% 64.60% 49.56% 5 24 21.24% 85.84% 35.40% 6 7 6.19% 92.04% 14.16% 7 6 5.31% 97.35% 7.96% 8 3 2.65% 100.00% 2.65%
Grand Total 113 100.00%
Consumer Question 8
Table G12
Table for the Summary of the Responses to Question 8 on the Consumer Questionnaire
8 I used the following resources on the Internet to help complete my transaction:
Summary for Question 8 Number of
Resources Used Response
Total % Cumulative
% Reverse
Cumulative % Mean Standard
Deviation 0 45 39.82% 39.82% 100.00% 1.5221 1.6480 1 20 17.70% 57.52% 60.18% 2 17 15.04% 72.57% 42.48% 3 16 14.16% 86.73% 27.43% 4 7 6.19% 92.92% 13.27% 5 6 5.31% 98.23% 7.08% 6 2 1.77% 100.00% 1.77%
Grand Total 113 100.00%

155
Appendix H
REAL ESTATE BROKER SURVEY DATA TABLES

REAL ESTATE FIRM QUESTIONNAIRE -- Broker in Charge responsesFirm
QuestionnaireFirm
QuestionnaireFirm
QuestionnaireFirm
QuestionnaireFirm
QuestionnaireFirm
QuestionnaireFirm
QuestionnaireFirm
QuestionnaireFirm
QuestionnaireFirm
QuestionnaireFirm
QuestionnaireFirm
QuestionnaireFirm
QuestionnaireFirm
QuestionnaireFirm
QuestionnaireFirm
QuestionnaireFirm
QuestionnaireFirm
QuestionnaireFirm
QuestionnaireResponse # Question 1 Question 2 Question 3 Question 3 Question 3 Question 3 Question 4 Question 5 Question 6 Question 7 Question 8 Question 9 Question 10 Question 10 Question 10 Question 10 Question 10 Question 10
Range of percentages -30 to 100 in
increments of 10
Range of values 1 to 9 in increments of 1
Range of ages31= 31 to 4041= 41 to 5051= 51 to 6262= 62 plus
GenderM= Male
F= Female
EthnicityC= CaucasinA= Asian or African
U= No Response
Salary35= $35K to $50K80= $80K plus
Range of percentages -30 to 100 in
increments of 10
Range of values 1 to 9 in increments of 1
Range of values 1 to 9 in increments of 1
Range of values 1 to 9 in increments of
1
Range of values 1 to 9 in increments
of 1
Range of values 1 to 9 in increments of 1
y="yes"n="no"
Range of values 1 to 9 in increments of 1
Range of numbers
Represents number of
agents firm has working for
thems
Range of numbers
Represents years firm has been business
y="yes"n="no"
y="yes"n="no"
Broker Response #
IncreasedProspects
ReplaceBroker
BrokerAge
BrokerGender
BrokerEthnicity
BrokerSalary
IncreasedProspects
Data forListings
Data forDemographics
Data onSpecific Properties
Information for Ancillary Services
Suggest forAny Phase
Company haveWeb Site Years Running
How ManyAgents
Years InBusiness
Firm's InternetMarketing Plan
Future InternetUsage Plans
1 100 4 51 M C 80 50 5 5 5 1 4 y 5 10 13 y y2 -30 1 62 F C 80 -30 2 2 2 2 2 n 0 26 n n3 0 4 31 F U 35 0 4 7 2 6 6 n 2 4 n y4 10 3 51 M C 35 10 4 1 1 1 2 n 3 50 n y5 10 5 41 F C 35 10 4 7 4 2 9 y 1 9 3 y y6 10 5 51 F C 80 10 7 7 7 1 5 y 1 72 20 n y7 -30 4 51 M C 35 -30 6 5 5 4 7 y 1 70 17 y y8 -30 1 62 M A 80 -30 4 7 2 1 1 n 3 34 y n9 30 3 62 M C 80 30 7 3 5 5 5 n 14 100 y y10 90 5 51 M C 80 90 5 5 5 1 4 y 5 14 13 y y11 -30 2 62 F C 80 -30 2 2 2 2 2 n 6 26 n n12 0 6 31 F U 35 0 4 7 2 6 6 y 1 4 4 n y13 20 3 51 M C 35 20 5 1 1 1 2 n 5 50 n y14 10 5 41 F C 35 10 4 7 4 2 9 y 2 12 3 y y15 10 5 51 F C 80 10 7 7 7 2 5 y 1 69 20 n y16 -10 4 51 M C 35 -10 6 5 5 4 7 y 2 73 17 y y17 -30 1 62 M A 80 -30 4 7 2 1 1 n 3 34 y n18 30 2 62 M C 80 30 7 3 5 5 5 n 12 20 y y19 90 4 51 M C 80 90 5 5 6 1 4 y 5 15 13 y y20 -30 1 62 F C 80 -30 3 2 2 2 2 n 4 26 n n21 0 4 31 F U 35 0 4 7 2 6 6 y 3 2 4 n y22 20 2 51 M C 35 20 5 1 1 1 2 n 3 50 n y23 30 7 41 F C 35 30 6 7 3 2 9 y 2 9 3 y y24 10 5 51 F C 80 10 7 7 7 2 5 y 3 65 20 n y25 -20 5 51 M C 35 -20 6 5 5 4 7 y 1 69 17 y y26 -30 1 62 M A 80 -30 4 7 2 1 1 n 5 34 y n27 10 3 62 M C 80 10 7 3 5 5 5 n 19 100 y y
Question No. 1. To what extent do you estimate (in terms of percentage of prospects) the Internet has directly increased the total number of prospects obtained for your company?
Question No. 2. To what extent do you believe the information on the Internet will replace your need for the services of a traditional residential real estate broker?
Question No. 3. Please complete the following:Age: ____ 18-21 ____ 22-30 ____31-40 ____41-50 ____51-62 ____ 62+
Question No. 3. Please complete the following:Gender: ____ Male ____ Female
Question No. 3. Please complete the following:Ethnicity: ___ Caucasian ___ African American ___ Asian ___ Hispanic ___ Other
Question No. 3. Please complete the following:Income: ____ 0-$20,000 _____$20,001-$35,000 ____ $35,001-$50,000 ___ $50,001-$65,000
Question No. 4. To what extent (in terms of percentage of prospects obtained where a prospect person interested in buying or selling a property) has the Internet directly increased the prospects obtained for your company?
Question No. 5. To what extent do you use the Internet to provide your customer with information on listings or offerings?
Question No. 6. To what extent do you recommend to clients that they use the Internet as a research tool for gathering information about the city, demographics or crime?
Question No. 7. To what extent do you recommend to clients that they use the Internet as a research tool for gathering information about a specific property?
Question No. 8. To what extent do you recommend that clients use the Internet as a research as a tool for gathering information about ancillary real estate services such as attorneys, lenders, appraisers, or contractors?
Question No. 9. Based on your knowledge, to what extent did your clients use the Internet for any phase of the transaction?
Question No. 10. Demographics:Does your firm have a web site? ___ yes ___ no
Question No. 10. Demographics:If yes, how long has it been up and running?______
Question No. 10. Demographics:How many full-time agents do you retain?______
Question No. 10. Demographics:How long have you been in business?____
Question No. 10. Demographics:Do you have an Internet Marketing Plan? ___ yes ___ no
Question No. 10. Demographics:Do you have plans for future Internet usage? ___ yes ___ no
APPENDIX H: REAL ESTATE FIRM SURVEY DATA TABLES
PAGE 152

156
Appendix I
REAL ESTATE CONSUMER SURVEY DATA TABLES

REAL ESTATE CONSUMER QUESTIONNAIRE -- Consumer Questionnaire Responses
Consumer Questionnaire
Consumer Questionnaire
Consumer Questionnaire
Consumer Questionnaire
Consumer Questionnaire
Consumer Questionnaire
Consumer Questionnaire
Consumer Questionnaire
Consumer Questionnaire
Consumer Questionnaire
Consumer Questionnaire
Consumer Questionnaire
Consumer Questionnaire
Consumer Questionnaire
Consumer Questionnaire
Consumer Questionnaire
Consumer Questionnaire
Consumer Questionnaire
Consumer Questionnaire
Consumer Questionnaire
Consumer Questionnaire
Consumer Questionnaire
Response # Question 1 Question 2 Question 3 Question 4 Question 5 Question 6Totals for
Question 8 Question 8a Question 8b Question 8c Question 8d Question 8e Question 8f Question 8g Question 8h Question 8i Question 8jQuestion 9
(age)Question 9(income)
Question 9(gender)
Question 9(race)
Range of values 1 to 9 in increments
of 1
Range of values 1 to 9 in increments
of 1
Range of values 1 to 9 in increments
of 1y="yes"n="no"
Range of values 1 to 9 in increments
of 1
Range of values 1 to 9 in increments
of 1
Range of values 1 to 9 in increments
of 1y="yes"n="no"
y="yes"n="no"
y="yes"n="no"
y="yes"n="no"
y="yes"n="no"
y="yes"n="no"
y="yes"n="no"
y="yes"n="no"
y="yes"n="no"
y="yes"n="no" Range of ages
SalaryRanges
GenderM= Male
F= Female Race
ConsumerResponse #
Internet to shop for home?
Aware of Internet
Services?
Use Internet Information to
complete Transaction?
Consider Buying or
Selling Home using
Internet?
Aware of Real Estate
Information on the Internet?
Internet Replace need
for Broker?
Internet Services used by Consumer searching for Real Estate
� Search for property
� Search for lending source
� Applied for a loan
� Search for property tax
values
� Search for property tax
values
� Search for past sales information
� Search for Closing attorney
� Search for area/neighborhood statistics
� Search area/neighborhood schools and churches
� Search for ancillary real
estate services AGE INCOME GENDER RACE
1 8 8 3 y 8 4 1 n n n n y n n n n n 41-50 80K+ Male White2 6 7 1 n 8 3 0 n n n n n n n n n n 41-50 80K+ Female White3 9 9 4 n 9 5 4 y n y n y n n y n n 22-30 35-50K Female White4 7 3 1 n 4 2 0 n n n n n n n n n n 51-62 80K+ Female White5 5 4 1 n 3 1 0 n n n n n n n n n n 62+ 80K+ Male White6 8 8 4 n 8 5 1 y n n n n n n n n n 31-40 80K+ Female White7 7 4 1 n 2 7 0 n n n n n n n n n n 31-40 80K+ Male White8 2 4 1 n 3 2 0 n n n n n n n n n n 41-50 80K+ Female White9 6 7 6 y 6 2 1 y n n n n n n n n n 22-30 20-35k Male White10 7 3 1 n 5 3 0 n n n n n n n n n n 51-62 80K+ Female White11 1 1 1 n 1 1 0 n n n n n n n n n n 22-30 35-50K Female Black12 1 5 1 n 2 1 1 n n n n n n n n y n 41-50 80K+ Male White13 3 4 1 n 3 1 1 y n n n n n n n n n 22-30 35-50K Female White14 5 9 1 y 9 4 0 n n n n n n n n n n 51-62 80K+ Female White15 9 9 1 n 9 5 0 n n n n n n n n n n 41-50 80K+ Female White16 4 5 4 n 5 1 2 y n n n y n n n n n 31-40 65-80K Male Asian17 7 9 1 n 9 3 1 n n n n n n n n n y 22-30 Female White18 3 4 2 y 2 2 3 n n n y y n n n y n 22-30 50-65K Male Other19 5 6 1 n 6 5 0 n n n n n n n n n n 62+ 50-65K Female White20 7 2 1 n 2 8 1 y n n n n n n n n n 31-40 80K+ Male White21 5 3 1 n 3 2 1 n n n n n n n n y n 41-50 80K+ Female White22 9 9 2 n 9 5 2 y n y n n n n n n n 41-50 80K+ Male White23 7 6 1 n 6 5 0 n n n n n n n n n n 31-40 65-80K Female White24 7 6 7 n 6 5 4 n n n n y y n y y n 62+ 80K+ Male White25 9 9 5 y 9 7 3 n n n n y y n n y n 31-40 80K+ Male White26 8 6 4 n 5 5 5 y n y n y y n y n n 41-50 50-65K Female White27 7 7 1 y 7 4 0 n n n n n n n n n n 41-50 80K+ Male White28 4 6 3 n 7 1 3 y y n n n n n n y n 31-40 80K+ Male White29 3 5 6 n 7 2 5 y n y y n n n y y n 31-40 80K+ Male White30 5 7 1 y 7 5 0 n n n n n n n n n n 31-40 80K+ Female White31 2 3 1 n 3 1 0 n n n n n n n n n n 41-50 80K+ Female White32 8 8 1 n 5 2 0 n n n n n n n n n n 51-62 80K+ Female White33 7 7 1 n 9 6 1 y n n n n n n n n n 31-40 35-50K Male White34 9 9 8 n 7 8 3 y n y y n n n n n n 22-30 80K+ Male White35 7 8 7 n 8 4 3 y n n n y n n y n n 31-40 80K+ Male White36 7 9 5 n 8 5 2 y n n n n y n n n n 51-62 80K+ Male Asian37 1 1 1 n 2 2 0 n n n n n n n n n n 22-30 Female White38 9 8 1 n 8 4 6 y n y n y y n y y n 41-50 Male White39 3 3 1 n 2 4 0 n n n n n n n n n n 31-40 65-80K Male White40 5 7 2 y 8 5 2 y n n n n n n n y n 22-30 20-35k Female White41 8 8 9 y 8 3 3 y n n n n n n y y n 31-40 50-65K Male White42 7 8 6 y 8 8 4 y n n n y y n y n n 31-40 80K+ Female White43 8 3 1 n 3 3 1 n n y n n n n n n n 41-50 80K+ Male White44 5 5 1 n 5 5 0 n n n n n n n n n n 62+ 35-50K Male White45 9 9 9 n 9 3 2 y y n n n n n n n n 51-62 35-50K Male White46 7 4 1 n 3 5 0 n n n n n n n n n n 31-40 80K+ Female White47 3 9 1 n 9 6 2 n n y n n n n n y n 41-50 Male White48 2 9 2 n 9 1 0 n n n n n n n n n n 31-40 80K+ Female White49 9 6 1 y 9 4 5 y n y n y y n n y n 41-50 65-80K Male White50 5 7 2 y 6 4 4 y y n n y n n n y n 22-30 50-65K Female White51 9 7 5 y 6 3 3 y n n n n n n y y n 31-40 80K+ Female White52 1 3 1 n 3 1 0 n n n n n n n n n n 51-62 80K+ Female White53 9 7 1 y 5 3 2 y n n n n n n n y n 41-50 80K+ Female White54 9 9 6 y 9 5 3 y n y n n n n n y n 31-40 80K+ Female White55 5 3 1 n 8 2 0 n n n n n n n n n n 51-62 80K+ Male White56 5 7 2 n 5 3 1 y n n n n n n n n n 31-40 20-35k Male White57 4 4 1 n 4 2 0 n n n n n n n n n n 31-40 80K+ Female White58 6 7 3 n 5 1 3 n n y n n y n n y n 22-30 80K+ Male White59 5 6 1 n 6 1 0 n n n n n n n n n n 22-30 20-35k Female Black60 5 6 1 n 6 1 0 n n n n n n n n n n 22-30 20-35k Female Black61 7 3 1 n 7 6 0 n n n n n n n n n n 31-40 65-80K Male White62 9 3 1 n 1 1 1 n n n n y n n n n n 31-40 35-50K Male White63 4 6 1 n 6 2 0 n n n n n n n n n n 31-40 80K+ Female White64 6 5 7 y 6 5 3 y n n n y n n n n y 22-30 80K+ Female Black65 8 8 5 n 9 5 4 y n n n y y n n y n 31-40 80K+ Male White66 8 4 1 n 4 5 2 y n n n n n n n y n 41-50 65-80K Male White67 9 5 2 n 5 6 0 n n n n n n n n n n 31-40 80K+ Male White68 2 2 1 n 4 1 0 n n n n n n n n n n 22-30 Female Asian69 5 3 1 n 5 5 0 n n n n n n n n n n 51-62 80K+ Male White70 5 8 1 n 7 3 1 n n n n y n n n n n 22-30 20-35k Female Black
APPENDIX I: REAL ESTATE CONSUMER SURVEY DATA TABLES

REAL ESTATE CONSUMER QUESTIONNAIRE -- Consumer Questionnaire Responses
Consumer Questionnaire
Consumer Questionnaire
Consumer Questionnaire
Consumer Questionnaire
Consumer Questionnaire
Consumer Questionnaire
Consumer Questionnaire
Consumer Questionnaire
Consumer Questionnaire
Consumer Questionnaire
Consumer Questionnaire
Consumer Questionnaire
Consumer Questionnaire
Consumer Questionnaire
Consumer Questionnaire
Consumer Questionnaire
Consumer Questionnaire
Consumer Questionnaire
Consumer Questionnaire
Consumer Questionnaire
Consumer Questionnaire
Consumer Questionnaire
Response # Question 1 Question 2 Question 3 Question 4 Question 5 Question 6Totals for
Question 8 Question 8a Question 8b Question 8c Question 8d Question 8e Question 8f Question 8g Question 8h Question 8i Question 8jQuestion 9
(age)Question 9(income)
Question 9(gender)
Question 9(race)
71 7 2 1 y 2 3 1 n n n n n n n y n n 41-50 65-80K Female White72 9 9 7 y 9 4 6 y y n n y y n y y n 41-50 80K+ Female White73 4 5 2 n 5 1 1 y n n n n n n n n n 31-40 80K+ Male White74 6 7 4 n 6 2 2 n n n n y y n n n n 31-40 50-65K Male Black75 4 3 1 n 3 5 0 n n n n n n n n n n 41-50 50-65K Male White76 9 6 2 n 9 6 1 n n y n n n n n n n 31-40 80K+ Male White77 9 6 2 n 9 6 1 n n y n n n n n n n 31-40 80K+ Male White78 9 6 2 n 9 6 1 n n y n n n n n n n 31-40 80K+ Male White79 5 7 3 y 5 7 2 y n n n n n n n n y 22-30 50-65K Male Asian80 6 6 4 n 6 1 0 n n n n n n n n n n 31-40 80K+ Female White81 7 4 1 n 4 1 0 n n n n n n n n n n 31-40 80K+ Female White82 8 4 1 n 6 2 3 y n n n n n n n y y 31-40 80K+ Male White83 6 8 3 y 8 4 3 y n n n y n n y n n 31-40 65-80K Female Black84 6 9 3 n 9 4 4 y n y n y n n y n n 41-50 65-80K Female White85 6 9 3 n 9 4 4 y n y n y n n y n n 41-50 65-80K Female White86 8 8 3 n 6 5 2 y n n n y n n n n n 31-40 80K+ Female White87 3 5 2 n 7 2 0 n n n n n n n n n n 31-40 80K+ Male White88 9 9 3 n 9 1 3 y n n n n n n y y n 22-30 50-65K Male White89 5 7 2 n 7 1 3 y n n n y y n n n n 41-50 80K+ Male Other90 8 5 1 n 9 2 0 n n n n n n n n n n 41-50 80K+ Female White91 8 3 1 n 1 7 0 n n n n n n n n n n 41-50 80K+ Male White92 7 9 1 n 9 5 1 n n n n n n n n y n 41-50 80K+ Female White93 9 6 5 n 6 4 5 y y n n y y n y n n 31-40 50-65K Female White94 7 3 1 n 3 4 0 n n n n n n n n n n 22-3095 6 7 6 n 6 5 5 y y y n n n n y y n 22-30 80K+ Female White96 9 3 1 n 4 3 0 n n n n n n n n n n 31-40 80K+ Male White97 8 4 2 n 4 1 2 y n n n n n n n n y 22-30 35-50K Male White98 5 5 4 n 6 4 1 n n n n n n n n n y 31-40 80K+ Female White99 4 7 2 n 7 2 2 y n n n n n n y n n 22-30 50-65K Male White100 1 9 1 n 9 1 0 n n n n n n n n n n 51-62 50-65K Female White101 6 6 3 n 5 7 3 y n y n y n n n n n 31-40 80K+ Female White102 8 9 8 n 9 3 2 y n n n n y n n n n 41-50 80K+ Female White103 5 1 1 n 3 3 0 n n n n n n n n n n 80K+ White104 9 9 6 n 8 7 3 y y n n y n n n n n 31-40 80K+ Female White105 5 8 1 n 8 1 2 y n n n n n n n n y 51-62 50-65K Male White106 6 8 1 n 6 2 0 n n n n n n n n n n 22-30 80K+ Male White107 3 2 2 n 2 5 0 n n n n n n n n n n 51-62 50-65K Male White108 7 6 2 n 5 3 2 y n n n y n n n n n 22-30 50-65K Male White109 8 2 3 n 7 5 2 y n n n y n n n n n 22-30 65-80K Female White110 8 8 2 n 9 2 5 y y n n y n n y y n 41-50 80K+ Male White111 1 1 1 n 1 1 0 n n n n n n n n n n 62+ 80K+ Male White112 2 1 1 n 2 4 0 n n n n n n n n n n 51-62 50-65K Male Asian113 1 2 1 n 2 1 0 n n n n n n n n n n 51-62 80K+ Male White
Question No. 1. How comfortable would you feel using the Internet to shop for a house?
Question No. 2. To what extent are you aware of the Internet services available to you as a residential real estate consumer?
Question No. 3. To what extent did you use the available information via the Internet to complete a portion of your real estate transaction?
Question No. 4. Did you consider buying or selling a house using the Internet?
Question No. 5. To what extent are you aware of the availability of residential real estate information via Internet?
Question No. 6. To what extent do you believe the information on the Internet will replace your need for the services of a traditional residential real estate broker?
Question No. 8. I used the following resources on the Internet to help complete my transaction:
a. � Search for a Realtorb. � Search for lending sourcec. � Applied for a loand. � Search for property tax valuese. � Search for past sales informationf. � Search for Closing attorneyg. � Search for area/neighborhood statistics such as crime and demographicsh. � Search area/neighborhood schools and churchesI. � Search for ancillary real estate services such as appraisers, inspectors, and contractors
Question No. 9. Please complete the following:Age: 18-21 ____: 22-30 ____: 31-40 ____: 41-50 ____: 51-62 ____: 62+____
Question No. 9. Please complete the following:Gender: Male ____: Female____
Question No. 9. Please complete the following:Income: 0-$20,000 _____: $20,001-$35,000 ____: $35,001-$50,000 ___:
Question No. 9. Please complete the following:$50,001-$65,000 ___: $65,000-$80,000___: $80,000 +____
Question No. 9. Please complete the following:Ethic Background: White ___: Black ___: Asian____: Hispanic ___: Other____