the effects of the electronic auditory stimulation effect … · the effects of the electronic...
TRANSCRIPT
THE EFFECTS OF THE ELECTRONIC AUDITORY STIMULATION EFFECT (EASE)
APPLICATION FOR ADOLESCENTS AND ADULTS 11 TO 22 YEARS WITH SENSORY
PROCESSING DEFICITS
______________________________________
A Thesis Presented to
the Faculty of the School of Occupational Therapy
Brenau University
______________________________________
In Partial Fulfillment
of the Requirements for the
Master of Science in Occupational Therapy
______________________________________
By
Hope Harris
Sherry Miller
Sadie Ricketts
Olivia Stieren
___________________________________________
GAINESVILLE, GEORGIA
APRIL 2013

2
THE EFFECTS OF THE ELECTRONIC AUDITORY STIMULATION EFFECT (EASE)
APPLICATION FOR ADOLESCENTS AND ADULTS 11 TO 22 YEARS WITH SENSORY
PROCESSING DEFICITS
____________________________ Hope Harris, OTS
____________________________
Sherry Miller, OTS
____________________________ Sadie Ricketts, OTS
____________________________
Olivia Stieren, OTS
APPROVED:
_____________________________________ M. Irma Alvarado, PhD OTR Thesis Committee Chairperson Associate Professor and Graduate Coordinator, School of Occupational Therapy _____________________________________ Tamara Mills, PhD, OTR/L, ATP Assistant Professor Committee Member and Methodologist School of Occupational Therapy
_____________________________________ Jennifer Allison, MS OTR/L Committee Member School of Occupational Therapy
______________________________ Gale Starich, Ph.D., M.S Dean, Sidney O. Smith Graduate School and College of Health and Science
3
TABLE OF CONTENTS
Page
List of Tables……………………………………………………………………………………...7
Acknowledgments………………………………………………………………………………...8
Abstract……………………………………………………………………………………………9
Chapter 1: Introduction…………………………………………………….…..………….....…..10
Sensory Processing ………………………………………………………………….....10
Problem Statement ………………………………………………………………………12
Purpose Statement ………………………………………………………………………12
Significance ……………………………………………………………………………...13
Operational Definitions …………………………………………………………………13
Chapter 2: Literature Review………………………….…………..……..………………............15
Sensory Systems ………………………………………………………………………...16
Prevalence ……………………………………………………………………………….17
Sensory Processing Disorder ……………………………………………………………19
Sensory discrimination disorder……………………………………………….19
Sensory-based motor disorder…………………………………………………20
Sensory Modulation…………………………………………………………….20
Dunn’s Model of Sensory Processing………………………………………….21
Effects on Occupational Performance …………………………………………………..22
Roles of Professionals …………………………………………………………………...24
Speech-language pathology………………………………………………….…..24
Audiology…………………………………………………………………..……24

4
Occupational therapy……………………………………………………………24
Assessments ……………………………………………………………………………..25
Sensory Processing Measure……………………………………………………..26
Sensory Integration and Praxis Test…………………………………………….26
Sensory Profile……………………………………………………………….......27
Adolescent/Adult Sensory Profile………………………………………………28
Canadian Occupational Performance Measure………………………………...28
Occupational Therapy Intervention ……………………………………………………..29
Sensory integrative approach…………………………………………………….30
Sensory-based interventions…………………………………………………….31
Auditory interventions…………………………………………………………..32
Tomatis…………………………………………………………………..32
Auditory integration training……………………………………………33
Therapeutic Listening®………………………………………………….34
Electronic Auditory Stimulation effect (EASe)…………………………34
EASe app………………………………………………………………...36
Summary ………………………………………………………………………………...37
Chapter 3: Methodology………………………………………….…..………………….............39
Purpose …………………………………………………………………………………..39
Research Design …………………………………………………………………………39
Participants ………………………………………………………………………………40
Inclusion criteria…………………………………………………………………40
Exclusion criteria………………………………………………………………...40
5
Procedures ……………………………………………………………………………….41
Data Collection Strategies ……………………………………………………………….44
Measures ………………………………………………………………………………...44
Adolescent/Adult Sensory Profile……………………………………………….45
Canadian Occupational Performance Measure…………………………………45
EASe Intensity Quotient…………………………………………………………46
Reliability and Validity of Measures ……………………………………………………47
Data Analysis ……………………………………………………………………………49
Researcher Bias and Assumptions ………………………………………………………50
Timeline and Budget …………………………………………………………………….51
Summary ………………………………………………………………………………...51
Chapter 4: Results… …………………………………………………………………………….53
Participants ………………………………………………………………………………53
Testing Outcomes ……………………………………………………………………….56
Adolescent/Adult Sensory Profile………………………………………………56
Canadian Occupational Performance Measure…………………………………60
EASe app…………………………………………………………………...……62
Individual COPM significance and EASe IQ………………………………….71
Qualitative Data Analysis………………………………………………………………..73
Changes to Protocol ……………………………………………………………………..77
Summary of Results ……………………………………………………………………78
Chapter 5: Discussion …………………………………………………………………………..79
Interpretation of Findings ………………………………………………………………80
Implications ……………………………………………………………………………..84

6
Limitations ………………………………………………………………………………85
Strengths……………………………………………………………………………..…..86
Recommendations for Future Studies ………………………………………………….87
Conclusion ………………………………………………………………………………89
References…………………….………………………………………………………….............91
Appendix A. Letter of Authorization: AAKTS, INC ………………………………………….102
Appendix B. Letter of Authorization: Sai Rehab, Inc. ……………………………………….103
Appendix C. Letter of Authorization: ETS, INC.…………………………………………..….104
Appendix D. Recruitment Flyer………………………………………………………...……...105
Appendix E. Institutional Review Board Letter of Approval Form……………………………106
Appendix F. Participant Informed Consent ……………………………………………………107
Appendix G. EASe Application Training Packet……………………………………………..110
Appendix H. Participant Demographic Form………………………………………………….115
Appendix I. Daily Data Sheet ………………………………………………………………….117
Appendix J. Exit Interview 1…………………………………………………………………...123
Appendix K. Exit Interview 2…………………………………………………………………..124
Appendix L. Procedures ……………………………………………………………………….125
Appendix M. Methodologist Approval Form………………………………………………….127
7
LIST OF TABLES
Table Page
Table 4.1 Participant Demographics ……………………………………………………………53
Table 4.2 Summary of Adolescent/Adult Sensory Profile Quadrant Scores ……………………56
Table 4.3 Summary of Adolescent/Adult Sensory Profile Auditory Processing Questions …….57
Table 4.4 Group Mean Scores of COPM Performance and Satisfaction………...………………58
Table 4.5 COPM Classifications for Occupational Performance Problems ……………………59
Table 4.6 Group Means and Standard Deviations of EASe IQ …………………………………61
Table 4.7 Minimum and Maximum EASe App Session Time and EASe IQ……………………62
Table 4.8 Frequencies (n) and Percentages of EASe App Preset at Week 1 ……………………63
Table 4.9 Frequencies (n) and Percentages of EASe App Preset at Week 2 ……………………64
Table 4.10 Frequencies (n) and Percentages of EASe App Preset at Week 3 …………………..65
Table 4.11 Frequencies (n) and Percentages of EASe App Preset at Week 4 …………………..66
Table 4.12 Mean Percentages of Participants at Each EASe App Preset During Weeks 1- 4...…67
Table 4.13 Pearson Correlation of Session 1 EASe IQ to Subsequent Sessions’ EASe IQ…..…68
Table 4.14 Spearman’s rho Correlation of Week 4 EASe IQ to COPM Performance and Satisfaction ………………………………………………………………………………………69
Table 4.15 Qualitative Themes ……………………………..…………………………..………72
8
ACKNOWLEDGEMENTS
The “AdEASe” team would first like to thank Dr. M. Irma Alvarado for all of her
guidance and encouragement throughout this process. We also want to thank our thesis
committee – Dr. Tamara Mills and Jennifer Allison – for their dedication and knowledge, with
special thanks to Jennifer Allison for providing us with support at all the right times.
We would like to thank all of our participating occupational therapists, Varsha Das and
staff at Sai Rehab, Inc. and Dr. M. Irma Alvarado and staff at Essential Therapy Services, Inc.
We appreciate their flexibility and commitment of outside-work hours that contributed to the
success of our study. We acknowledge and thank our participants and their legal
guardians/parents, whose involvement, time, and energy made this study possible.
We would like to thank McKenzie McQuaig, Charmaine Montez, Amanda Stephens, and
Ashley Tolland from the “SmartEASe” team for working with us collaboratively throughout this
process. We are very glad that we were able to work alongside with you all, and we commend
your team for your hard work.
We would like to thank Bill Mueller and Tibor Horvath for all of their time, energy, and
expertise regarding the EASe application. We are grateful for your knowledge and your
vigilance whilst working with us as we learned about the app. We would also like to thank the
Apple corporation for providing us free codes for the app – without access to these codes, we
would have not been able to complete this study.
Lastly, we would like to thank our family and friends who have supported us and
encouraged us throughout not only the thesis process, but the last three years of the occupational
therapy graduate program. Their love and support have helped us successfully complete these
accomplishments, and we are grateful to them every day.
9
ABSTRACT
The purpose of this research study is to determine if the EASe app improves sensory
processing responses through habituation to auditory environments, thereby improving
occupational performance, for adolescents and adults ages 11-22 years with sensory
processing deficits. Thirteen participants followed the 28-day protocol of listening to the
EASe application for two sessions daily. Researchers analyzed COPM scores to measure
occupational Performance and Satisfaction, as well as EASe IQ to measure intensity of each
EASe app session. The analysis of the data confirmed that the use of the EASe application
did improve the participants’ habituation to auditory environments and occupational
performance, which sets precedence for future studies with the EASe app and research on
interventions for adolescents and adults with sensory processing deficits.
Keywords: auditory processing, Electronic Auditory Stimulation effect (EASe),
habituation, occupational performance, occupational therapy, sensory integration, sensory
modulation, sensory processing.

10
Chapter 1
Introduction
Research data has determined that approximately five to ten percent of children in the
general population have sensory processing deficits (Ahn, Miller, Milberger & McIntosh, 2004).
Sensory processing deficits can be identified as difficulties effectively interpreting and/or
regulating sensory input from within the body or the environment (Ben-Sasson, Carter, &
Briggs-McGowan, 2009). According to Ayres (1979, p. 9), these deficits can negatively affect
sensory integration which she defined as “the neurological process that organizes sensations
from one’s body and from the environment and makes it possible to use the body effectively in
the environment.” The inability of the body to effectively process sensations is manifested in
atypical behaviors.
Ayres’ sensory integration theory was developed for assessment and intervention
purposes with persons with sensory integration dysfunction (Ayres, 1979). Sensory processing is
a lifelong process (King, 1978, p. 260). Additionally, Dunn reports that “consistent patterns
about temperament, personality, and sensory processing emerge across studies of children and
adults” (2001, p. 615). Although most of the research reports that sensory processing deficits
effect children, there has been an increased awareness among occupational therapy practitioners
to address the sensory processing deficits in the adult population as well (May-Benson &
Champagne, 2011).
Sensory Processing
Sensory processing is a naturally occurring function that is typically performed without
conscious thought or effort, but at times dysfunction occurs (Biel & Peske, 2005). The central
nervous system (CNS) and peripheral nervous system (PNS) process sensory information by
receiving, modulating, integrating, and organizing sensory input. This process also includes the

11
behavioral responses to sensory information (Lane et al, 2000). Sensory processing deficits
might include problems with movement, touch, vision, the auditory system, oral functions, and
social skills. Sensory processing disorder (SPD) involves the inability of the brain to process
sensory input effectively. SPD might include impairment to any part of sensory processing that
impacts occupational performance (Ayres, 1979).
Various assessments are used to identify sensory processing deficits and SPD for
children. The measures are limited for identifying the deficits of adolescents and adults with
impaired sensory processing, which is a problem due to the possible continuation of sensory
processing deficits into adolescence and adulthood (Watling, Bodison, Henry, & Miller-
Kuhaneck, 2006). The Adolescent/Adult Sensory Profile (AASP) is a measure based on the
Model of Sensory Processing developed by Winnie Dunn which focuses on taste, smell,
movement, visual, touch, and auditory processing (Brown & Dunn, 2002). This measure is used
by occupational therapists to identify specific areas of sensory processing deficits. Other
assessments that might be used to identify these deficits include the Sensory Processing Measure
(SPM) and Sensory Integration Praxis Test (SIPT). An assessment that can be used to identify
occupational performance in relation to sensory processing deficits is the Canadian Occupational
Performance Measure (COPM). Along with assessments, therapists use clinical observations
and interviews to assist in identification of sensory processing deficits (Ayres, 2005).
Once an individual’s sensory processing skills and occupational performance are
identified, therapists use interventions, sensory based techniques, or approaches to address the
noted deficits. These approaches might include the Wilbarger Deep Pressure and Proprioceptive
Technique (DPPT) & Oral Tactile Technique (OTT), sensory diet, and/or auditory intervention
programs (Dawson & Watling, 2000; May-Benson & Champagne, 2011). Auditory intervention

12
programs used by occupational therapists include Tomatis, auditory integration training (AIT),
Therapeutic Listening®, and the Electronic Auditory Stimulation effect (EASe) (“Electronic
Auditory overview,” n.d.; Hall & Case-Smith, 2007).
The Electronic Auditory Stimulation effect (EASe) is a form of auditory intervention that
uses “random bursts of sound to stimulate, challenge, and promote sensory processing in
children on the autism spectrum and others experiencing difficulty with sensory processing and
organization” (“EASe App,” n.d.). An EASe application (app) is available and is delivered via
iPad, iPhone, and iPod touch. This application was developed to improve auditory habituation
for individuals with sensory processing deficits (“Electronic Auditory-overview,” n.d.). The
EASe app is an auditory tool used to improve an individual’s tolerance of auditory input
(“Electronic Auditory overview,” n.d.).
Problem Statement
Research is abundant regarding children with sensory processing deficits and the
treatment programs used to assist in improving problems with integrating sensory information.
Limited research is available regarding adolescents and adults with sensory processing deficits
and the needed treatment programs. Research is considered necessary regarding auditory-based
interventions to gain knowledge of the outcomes when using an intervention program such as
EASe. The overall impetus for undertaking this study is to provide evidence regarding the effect
of the EASe app for adolescents and adults with sensory processing deficits which are
particularly related to auditory processing.
Purpose Statement
The purpose of this research study is to determine if the Electronic Auditory Stimulation
effect application (EASe app) improves sensory processing responses through habituation to
13
auditory environments, thereby improving occupational performance, for adolescents and adults
ages 11 to 22 years with sensory processing deficits. The research questions are: 1) For
adolescents and adults ages 11 to 22 years with sensory processing deficits, does listening to the
Electronic Auditory Stimulation effect application two times a day for 30 minutes improve
habituation to auditory environments, which in turn might improve behavioral responses to
sensory input? 2) Will the participants’ occupational performance improve as evidenced by the
comparison of their COPM baseline and reassessment scores?
Significance
This study is important as it is anticipated to provide exploratory data regarding the
utility of the EASe app and evidence toward its use as an intervention to improve auditory
processing deficits in the specified population. By participating in this study, the participants
might demonstrate an increased habituation to auditory input from their environments thereby
improving their functional behavior. This study will contribute to the body of knowledge in the
occupational therapy discipline regarding the effect of the EASe app on auditory habituation of
adolescents and adults with sensory processing deficits. Our aim is that the data will support our
hypothesis that the EASe app is an effective intervention for improving sensory and auditory
processing as well as occupational performance in adolescents and adults.
Operational Definitions
For the purposes of this study, the following terms have been operationally defined for
use within this study:
Auditory processing. The analysis, identification, storage, recollection, and relay of
auditory information from the auditory nerve to the brain, which results in understanding the
auditory input received (Herer, Knightly, & Steinberg, 2007).

14
Electronic auditory stimulation effect (EASe). EASe is a form of auditory
intervention that uses “random bursts of sound to stimulate, challenge, and promote sensory
processing in children on the autism spectrum and others experiencing difficulty with sensory
processing and organization” (“EASE App,” n.d.).
Occupational performance. “Occupational performance is the accomplishment of the
selected occupation resulting from the dynamic transaction among the client, the context and the
environment, and the activity” (American Occupational Therapy Association, 2008, p. 650).
Occupational therapy. “The practice of occupational therapy means the therapeutic use
of everyday life activities (occupations) with individuals or groups for the purpose of
participation in roles and situations in home, school, workplace, community and other settings”
(American Occupational Therapy Association, 2008, p. 673).
Sensory integration. A. Jean Ayres described sensory integration as the “process of
organizing sensory input so that the brain produces a useful body response and useful
perceptions, emotions, and thoughts” (Ayres, 2005).
Sensory modulation. The nervous system’s ability to regulate and organize itself in
response to sensory input (Ayres, 1979).
Sensory processing. Sensory processing is a method by which the body appropriately
internalizes sensory input received (Dunn, 2001).

15
Chapter 2
Literature Review
The purpose of this research study is to determine if the Electronic Auditory Stimulation
effect application (EASe app) improves sensory processing responses through habituation to
auditory environments, thereby improving occupational performance, for adolescents and adults
ages 11 to 22 years with sensory processing deficits.
Literature has been reviewed from the following professional disciplines regarding
individuals with sensory processing deficits: occupational therapy, audiology, speech-language
pathology, and neurology. The resources were gathered primarily through databases including
the Cochrane Library, MedlinePlus, MEDLINE with Full Text, and CINAHL PLUS with Full
Text. Literature was also reviewed from the American Journal of Occupational Therapy (AJOT)
archives.
The literature search terms and phrases included in the review were: sensory processing,
sensory integration, sensory discrimination, sensory processing deficits, sensory processing
measures, occupational performance measures, sensory processing disorder, prevalence and
sensory processing, sensory modulation, sensory processing and adults, sensory processing and
adolescents, occupational performance and sensory processing deficits, neurology of hearing,
audiology, auditory processing, sensory integration interventions, and auditory interventions.
This literature review will provide an overview of topics pertinent to sensory processing.
The neurological process of integration of sensory input, deficits in this process, and the effects
on occupational performance will be examined. Specifically, adolescents and adults with
sensory processing deficits will be addressed in the review of the literature. The occupational
therapy measures used to identify sensory processing deficits and occupational performance,
16
such as the Sensory Processing Measure (SPM), Sensory Integration and Praxis Test (SIPT),
Sensory Profile, Adolescent/Adult Sensory Profile (AASP), and Canadian Occupational
Performance Measure (COPM), will be discussed. In addition, the occupational therapy
interventions used for individuals with sensory processing deficits will be reviewed. These
approaches include the sensory integrative approach, sensory- based interventions, and auditory
interventions including an overview of the use of the EASe app as an auditory intervention.
Sensory Systems
Humans receive input from the environment through sensory systems in order for proper
neurological function of the brain to occur (Parham & Mailloux, 2010). According to Kandel,
Schwartz, & Jessell (2000), neuroscientists discovered the distinct properties of each sensory
system that enable humans to receive sensory input for neurological use. The sensory systems
that enable humans to receive sensory input are the proprioceptive, tactile, vestibular, visual, and
auditory systems (Ayres, 1979).
The proprioceptive system receives sensation through muscles and joints to sensory nerve
fibers that travel through peripheral nerves to the brain to give feedback on where the body is in
space. Similar to the proprioceptive system, the tactile system uses sensation through receptors
in the skin to deliver sensory input for the brain to respond appropriately (Parham & Mailloux,
2010). The vestibular system uses the position of the head and parts of the auditory and visual
systems for balance and spatial orientation of the body in relation to gravity and accelerated
movement. The visual system “scans the environment and obtains information regarding
distance, movement, and discrimination of objects and symbols” (Russell & Nagaishi, 2010, p.
744).

17
The auditory system, consisting of bones, muscles, and nerves, begins at the external ear,
passes through the middle and inner ear and ends at the auditory nerve. The central auditory
system connects the auditory nerve to the brain “which analyzes, identifies, stores, recalls, and
relates auditory information” to give meaning and understanding to the auditory input received
(Herer et al., 2007, p. 170). This process occurs within the inner ear which contains the organ of
corti, containing cylindrical hair cells that collect sound through an oscillating motion and
transform the energy into electrical impulses. The auditory nerve carries the signals from the
organ of corti, by way of the vestibulocochlear nerve (the eighth cranial nerve), to the brainstem,
midbrain, and thalamus where higher processing and integration occur before ending at the
auditory cortex of the brain located in the temporal lobe (Herer et al., 2007, p.172).
The central and peripheral nervous systems organize and integrate the sensory input from
these systems and instruct the body to make adaptive responses (Smith, Press, Koenig, &
Kinnealey, 2005). This process enables adaptive and organized reactions to environmental
demands to occur (Ben-Avi, Almagor, & Engel-Yeger 2012) ). According to Lane and Schaaf
(2010), this neurological process of neuroplasticity is defined as the nervous system’s ability to
change in response to environmental input. Dysfunction of the integrative process of the brain
occurring at any of the sensory systems can lead to sensory processing deficits.
Prevalence
Much of the literature regarding the occurrence of sensory processing deficits pertains to
children. In a study by Ahn et al. (2004), it was found that 5%-15% of typically developing
kindergarten-aged children exhibited sensory processing deficits. In more recent multiple factor
analytic studies, research has reported the presence of these atypical behaviors in children who
have developmental diagnoses, such as attention deficit and autism spectrum disorders (Brown &

18
Dunn, 2010). Though many individuals with sensory processing deficits may not have a specific
diagnosis, common diagnoses associated with sensory processing problems include autism
spectrum disorder, Asperger syndrome, learning disabilities, attention deficit hyperactivity
disorder (ADHD), developmental coordination disorder (DCD), anxiety and panic disorders,
depression, posttraumatic stress disorder, schizophrenia, sensory processing disorder, or auditory
processing disorder (May-Benson & Champagne, 2011; Polatajko & Cantin, 2010).
Although sensory processing deficits are not officially considered a diagnostic
characteristic for autism spectrum disorders, studies have shown that individuals with this
diagnosis display atypical behaviors in response to sensory input (Ben-Sasson et al., 2007).
Researchers estimate that 80-90% of children who have an autism spectrum disorder also
demonstrate behaviors identified as “atypical sensory responsivity” (Rogers & Ozonoff, 2005).
The percentage of children with autism spectrum disorders exhibiting sensory processing deficits
is increasing (Lane, Reynolds, & Dumenci, 2012).
While the prevalence of sensory processing deficits of children has been established, the
paucity of evidence regarding the prevalence of sensory processing deficits in adolescents and
adults still remains. The research pertaining to adolescents and adults lacks empirical statistical
data, and the majority of the information is collected from surveys, interviews, or medical
records (May-Benson & Kinnealey, 2012). It could be inferred that the lack of data is related to
the fairly recent recognition of sensory processing disorder as an official diagnosis in 2006 in the
Diagnostic Classification: Zero to Three: Diagnostic Classification of Mental Health in
Developmental Disorders in Infancy and Early Childhood (ZERO TO THREE, 2005).

19
Sensory Processing Disorder
Sensory processing disorders can be described as conditions by which the body has
difficulty “detecting, modulating, interpreting or responding to sensory input” (Miller, Coll, &
Schoen, 2007, p. 228). In the literature, varying terms, such as sensory integrative dysfunctions
(Ayres, 1979), sensory processing dysfunctions (Tomchk & Dunn, 2007), and sensory
processing disorders (Miller et al., 2007), all have similar descriptions that characterize these
sensory processing deficits. In an attempt to reach a general agreement for the varying terms and
their meanings within the occupational therapy discipline, Lane, Miller, and Hanft (2000)
proposed a categorization of these descriptive terms. More recently, Lane and Miller, along with
other colleagues, collaborated again and devised a categorization that divided sensory processing
disorder into three main types: sensory discrimination disorder, sensory-based motor disorder,
and sensory modulation disorder (Miller, Anzalone, Lane, Cermak, and Osten, 2007).
Sensory discrimination disorder. Sensory discrimination is the ability to interpret
sensation which enables the body to effectively assess its location in space. In addition, it also
allows the body to efficiently extract contextual information from the environment from varied
sensory systems (Roley & Jacobs, 2009, p.798). Specifically, intact “discrimination in the tactile
proprioceptive and vestibular systems leads to smooth, graded, coordinated movement” (Miller,
Anzalone et al., 2007, p. 138). Individuals with this disorder have difficulty accurately
determining differences and similarities of sensory input (Miller, Anzalone, et al., 2007).
Persons with this disorder may have decreased sensation, decreased sensory association, and
decreased perception formation which can manifest impairments in language, learning or motor
performance due to inefficient sensory interpretation (Kielhofner, 2009).

20
Sensory-based motor disorder. Sensory-based motor disorders are separated into two
disorder subtypes classified as dyspraxia and postural disorders (Kielhofner, 2009). Dyspraxia
can be defined as the decreased ability of the body to “conceive of, plan or execute” new actions
(Miller, Anzalone, et al., 2007 p.138). Individuals with this disorder lack the ability to
effectively coordinate gross and fine motor control and can appear clumsy (Kielhofner, 2009).
Due to this fact, sports and actions that require timing are often difficult for individuals with this
disorder to perform. Moreover, this disorder is commonly associated with visual motor deficits,
which adds to the person’s difficulty judging the distance of objects and people in space (Miller,
Anzalone, et al., 2007). Postural disorder is classified as difficulty holding the body in a steady
position when moving or at rest to complete a specific task (Miller, Anzalone, et al., 2007). The
impairments are demonstrated by “inappropriate muscle tension, hypotonic or hypertonic muscle
tone, inadequate motor control of movement, or inadequate muscle contraction to achieve
movement against resistance.” (Miller, Anzalone, et al., 2007 p.138).
Sensory modulation. The process of sensory modulation involves the self-organization
of the brain to sensory input (Ayres, 1979). According to Wilbarger and Stackhouse (as cited in
Gere, Capps, Mitchell, & Grubbs, 2009, p.290), sensory modulation is the “intake of sensation
by means of sensory-processing mechanisms such that the intensity, degree, and quality of
response are processed so as to match environmental demand.” The behavioral aspects as
exhibited with sensory modulation occur in distinguishable sequences associated with extreme
responses (Parham & Mailloux, 2010). These involuntary neurological responses are derived
from the nervous system “facilitating” or “inhibiting” sensory input which lead to non-typical
behaviors (Biel & Peske, 2005, p. 21). The atypical responses are identified as
overresponsiveness (high arousal) and underresponsiveness (low or no arousal).

21
Overresponsiveness can be described as hypersensitivity to normal sensory input which
can result in defensive behaviors along with autonomic responses. In contrast,
underresponsiveness can be characterized by lack of responsiveness to normal sensory input that
would evoke a reaction from most people (Chang et al., 2012). Other researchers have explained
similar phenomena of behaviors associated with sensory modulation and sensory processing
deficits. Dunn (1997) devised a model which explains similar behaviors previously mentioned as
occurring with sensory processing deficits.
Dunn’s Model of Sensory Processing. In contrast to atypical responses of
overresponsiveness and underresponsiveness being expressed in distinct extremes as Chang et al.
(2012) suggested, Dunn’s Model of Sensory Processing behaviors are described as being on a
continuum. The proposed model outlines thresholds of the nervous system associated with one’s
internal capacity to react to the thresholds (Dunn, 2001). According to Dunn’s Model of Sensory
Processing, “neural regulation occurs through mechanisms that balance excitation and inhibition,
creating thresholds for responding at the point that proper input has accumulated” (Dunn, 2001,
p. 492). Ben-Sasson et al. (2007) described the continuum’s behavior responses as follows:
sensory sensitivity, sensation avoiding, low registration and sensation seeking. Persons
exhibiting behavior responses associated with sensory sensitivity most often relate distress and
distraction with sensory input. Similarly, persons who demonstrate sensation avoiding behaviors
due to experiencing discomfort with sensory stimuli control and/or limit the amount and type of
sensory input (Ben-Sasson et al., 2007).
Low registration behavior responses are associated with underresponsivity, and persons
who demonstrate these reactions lack the ability to readily respond to sensory input. In addition,
persons who demonstrate sensory seeking behavior look for opportunities to receive heightened
22
sensory input due to high neurological threshold (Dunn, 1997). This model indicates that
persons do not receive sensory input in a “unitary” pattern and have varied behavior responses
that impact occupational performance (Dunn, 2001, p. 496). Many individuals might not realize
the effects of their sensory processing deficits on performance in areas such as leisure, ADLs,
school, work, and social participation, but it is important for these individuals to be aware of how
their sensory processing problems effect participation in daily activities (Bissell, Watling,
Summers, Dostal, & Bodison, n.d.).
Effects on Occupational Performance
Impairment to any part of sensory processing can impact occupational performance
(Ayres, 1979). Sensory processing deficits that effect occupational performance include sensory
defensiveness, sensory discrimination, sensory sensitivity, and sensory avoiding. The effects of
sensory processing deficits can vary from person to person depending on how a person's brain
processes information. Functional performance, quality of life, completion of activities of daily
living (ADLs), social participation, and behavior are all affected by sensory processing deficits.
Sensory defensiveness is a dysfunctional response to tactile, vestibular, auditory, visual,
gustatory, olfactory, or proprioceptive inputs. The impaired response is related to sensory
modulation, specifically overresponsivity. The overresponsivity is a result of the individual’s
low thresholds for sensory stimuli. The behavioral manifestations associated with sensory
defensiveness might include fearfulness, cautiousness, sensory avoiding, and anxiety, which
might have a social–emotional impact on the individual. Sensory defensiveness might affect an
individual’s participation in social activities, motor performance, and participation in ADLs
(Pfeiffer & Kinnealey, 2003).

23
Children with sensory difficulties tend to have immature play patterns which “are
associated with poor peer acceptance and poor social competence” (Cosbey Johnston, & Dunn,
2010, p. 462). The ability to participate in meaningful life activities is essential for a child to
understand the social rules, cognitive, and physical skills required to further development
(American Occupational Therapy Association, 2008; Cosbey, Johnston, & Dunn, 2010).
Conversely, characteristics such as immature play patterns are associated with poor peer
acceptance and poor social competence (Williamson & Dorman, 2002). Social competence,
which develops through social participation, is associated with improved peer interactions,
increased school performance, and better adult outcomes (Elksnin & Elksnin, 1995).
If poor social competence in an individual remains in adulthood, the individual may have
increased anxiety, leading to an increasing decline in social participation. Increased anxiety and
sensory defensiveness have been found to have a significant correlation in adulthood (Pfeiffer &
Kennealey, 2003). Kinnealey & Fuiek (1999) found that anxiety, depression, and mal-adaptation
are more prominent in adults with sensory defensiveness compared to adults without sensory
defensiveness. The side effects of sensory processing deficits in the lives of adults can manifest
themselves in many different manners, such as the ability to parent, work or manage a home,
participate in social activities, and participate in leisure activities (May-Benson & Champagne,
2011).
Relationships and intimacy might also be a struggle for adults with sensory processing
deficits. Six coping strategies identified for adults with sensory processing deficits include
avoidance, predictability, mental preparation, talking through, counteraction, and confrontation
(Kinnealey, Oliver, & Wilbarger, 1995). The detrimental effects of sensory processing

24
impairments necessitate specific intervention approaches from various professionals, including
speech-language pathologists, audiologists, and occupational therapists.
Roles of Professionals
Speech-language pathology. The role of a speech-language pathologist is to engage in
“clinical services, prevention, advocacy, education, administration, and research in the areas of
communication and swallowing across the life span” (American Speech-Language-Hearing
Association, 2007). Areas typically addressed by speech-language pathologists include speech
sound production, resonance, voice, fluency, language, cognition, and feeding and swallowing.
Speech-language pathologists may also utilize the sensory integration approach to treatment
(Treatment, 2013).
Audiology. The role of an audiologist includes completing a comprehensive evaluation
of an individual’s auditory ability, diagnosing auditory processing deficits, and developing a
treatment plan to “maximize successful therapeutic outcomes and minimize residual functional
deficits” (American Speech-Language-Hearing Association, 2005). The intervention plan
incorporates direct skills remediation, compensatory strategies, and environmental modifications.
An audiologist’s overall goal is to improve an individual’s ability to hear and communicate in
everyday life (American Speech-Language-Hearing Association, 2004).
Occupational therapy. The role of occupational therapy (OT) entails “therapeutic use of
everyday life activities” (American Occupational Therapy Association, 2010a) and addresses all
populations in a variety of settings, including the home, school, work, and community
environments. The purpose of OT is to promote health and wellness in those who have an
illness, disability, disorder, disease, condition, or injury (American Occupational Therapy
Association, 2010a). OT contributes to the healthcare profession by using core values,

25
knowledge, and skills of the profession to help individuals participate in ADLs and occupations
(American Occupational Therapy Association, 2008). According to the Standards of Practice for
Occupational Therapy (American Occupational Therapy Association, 2010a), the overall aim of
OT is “to support [people’s] health and participation in life through engagement in occupations.”
Occupational therapists have a major role in treating individuals with sensory processing
deficits, especially in school systems and clinics. The primary method that is used in
occupational therapy for sensory-related impairments is the sensory integration method. The
sensory integration method is used to assist an individual’s ability to participate in activities in
school and at work, as well as to help with adaptive behaviors so that the individual can function
in his or her everyday activities (American Occupational Therapy Association, 2010c). To
determine if the sensory integration approach to intervention is appropriate for the individual
with sensory processing deficits, assessments are used to identify sensory processing abilities.
Assessments
Occupational therapists use a variety of tools to assess the sensory processing abilities
and skills of individuals of different age ranges. The Sensory Profile, the Sensory Processing
Measure, and the Sensory Integration and Praxis Test all measure the level of sensory
processing deficits that an individual might exhibit which limit occupational performance.
Occupational therapists also use measures of occupational performance that can be related to
sensory processing such as the Canadian Occupational Performance Measure (COPM).
Sensory processing deficits can impact an individual’s ability to participate in activities,
and it is important to use measures to identify one’s sensory processing patterns and occupational
performance (Dunn, Cox, Foster, Mische-Lawson, & Tanquary, 2012). One study described the
use of various measures, including the COPM and the Sensory Profile, to identify sensory
26
processing patterns and participation. The results of the measures were used to develop an
intervention plan with functional goals based on the individual’s performance and sensory
processing abilities (Dunn, Cox et al.,2012).
Sensory Processing Measure. The Sensory Processing Measure is used to assess social
participation, praxis, and sensory processing deficits and is based on Ayres’ sensory integration
(SI) theory (Brown, Morrison, & Stagnitti, 2010). The measure was developed based on a
teamwork approach between school personnel and the parents of a child; this was so that the
child’s occupational performance could be measured in both the school and home environment.
This evaluation method also aids in determining if any issues are solely based on environmental
factors. The Sensory Processing Measure is standardized assessment for children ages 5-12
years, which limits the use of the tool for various populations, and strong validity and reliability
has been determined (Brown et al., 2010).
Sensory Integration and Praxis Test. The Sensory Integration and Praxis Test (SIPT)
has been known as the golden standard for “measuring sensory integration functioning” (Asher,
Purham, & Knox, 2008). The assessment is based on Ayres’ (SI) model, and other sources of
information are used to evaluate the client such as clinical observation, occupational profile, case
history, and parent or teacher interview addressing goals and concerns (Asher et al., 2008).
Occupational therapy practitioners must have a specialty SIPT certification to administer the
assessment and interpret the results (Asher, 2007; Stallings-Sahler, 1990). The SIPT is
composed of 17 standardized tests that measure praxis, various aspects of sensory processing,
and the integration of sensory inputs. The assessment has both strong inter-rater reliability and
validity, and is standardized for children ages 4 years to 8 years 11 months (Asher et al., 2008).

27
Sensory Profile. The Sensory Profile is based on Dunn’s Model of Sensory Processing,
which was developed in 1997 (Brown & Dunn, 2010). The Model of Sensory Processing
originally derived from neuroscience and behavioral science. It led to Dunn’s hypothesis that an
individual’s neurological thresholds and behavioral responses are related. The result of the
interaction between the neurological thresholds and behavioral responses can be conceptualized
as four sensory patterns, described as low registration, sensory seeking, sensory sensitivity, and
sensory avoidance.
Low registration is defined as the degree to which an individual is interpreting sensory
input. Sensory seeking is defined as the degree to which an individual is able to attain sensory
input. Sensory sensitivity is the degree to which an individual notices and responds to sensory
input, and it is a passive, automatic, and subconscious response. Sensory avoidance is the degree
to which an individual is bothered by sensory input, and this is an active, self-generated response
(Brown & Dunn, 2010; Miller, Anzalone et al., 2007). The analysis of an individual’s sensory
patterns using the Sensory Profile leads to an explanation of how an individual is interpreting
sensory input and what treatment interventions might be effective (Brown & Dunn, 2010).
Adolescent/Adult Sensory Profile. The Adolescent/Adult Sensory Profile (AASP) is
standardized for individuals 11 years and older to measure different components of sensory
processing in an individual’s daily life such as touch, taste, smell, auditory, activity level, and
vision. These categories all fall into the four quadrants of sensory sensitivity, sensory avoiding,
sensory seeking, and low registration (Brown, Tollefson, Dunn, Cromwell, & Filion, 2001). A
person’s sensory processing abilities can fall into either a high or low neurological threshold
within any of the four quadrants. If a person has a high threshold to sensory input, that person
participates in a high amount of sensory seeking and needs more input in order to be sensory
28
stimulated. If a person has a low threshold to sensory input, he or she does not need a lot of
sensory input in order to be stimulated and is sensory sensitive (Brown et al., 2001). The
coefficient alpha method was used to determine reliability of the assessment, and content,
convergent, and discriminant validity were found as well (Brown & Dunn, 2002).
Canadian Occupational Performance Measure. The Canadian Occupational
Performance Measure (COPM) is an assessment that was developed to help individuals
“identify, prioritize, and evaluate important issues they encounter in occupational performance”
(Eyssen et al., 2011, p. 518). It was originally based on the Canadian Model of Occupational
Performance, now known as the Canadian Model of Occupational Performance and Engagement
(Eyssen et al., 2011). The COPM is one of the few assessments that employs a client-centered
approach to measure occupational performance (Knecht-Sabres, 2011). The COPM is
administered as a semi-structured interview with the client, and the assessment utilizes a
structured scoring method that measures the client’s occupational performance. The client self-
identifies occupational performance problems that are measured over time to determine if the
client’s performance of or satisfaction with a specified task or behavior has improved (Eyssen et
al., 2011).
The COPM is an individualized measure, so the scores of the client are compared to his
or her own initial scores (Knecht-Sabres, 2011). The two measured components of the COPM
are Performance and Satisfaction; each problem identified is measured on a 10-point scale based
on these two components. When a client is re-evaluated, it is noted as clinically important when
there is a change of two or more points in either Performance or Satisfaction. Other benefits of
the COPM are that it: supports goal writing (e.g., goals are focused on occupational performance
rather than on body function); ensures that the client is involved in the goal formulation process;
29
helps with team conferences and ensures that conferences are focused on the client’s needs;
facilitates intervention planning and motivation of the client; facilitates evaluation of outcomes;
and, outcomes are clear and evident to the client (Knecht-Sabres, 2011). Test-retest reliability
has been identified, as well as content, criterion, and construct validity (Cup, Scholte op Reimer,
Thijssen, van Kuyk-Minis, 2003; Law et al., 2005; Pan, Chung, & Hsin-Hwei, 2003; Sewell &
Singh, 2001).
Occupational Therapy Intervention
Once specific occupational performance and sensory processing abilities are identified
through assessments, appropriate interventions can be chosen. The end result of an intervention
is known as an outcome, and many outcomes might be the focus of an intervention (American
Occupational Therapy Association, 2008). Types of outcomes include adaptation, health and
wellness, occupational justice, occupational performance, participation, prevention, quality of
life, role competence, and self-advocacy. Though the outcomes might focus on improving
health, participation, and engagement in occupation, there may be some differences between the
end results for children versus adolescents and adults (American Occupational Therapy
Association, 2008). Outcomes for adolescents and adults might focus primarily on transitioning
from grade school to post-secondary school or work, job preparation and training, home
management, transportation, money management, and independent living. A variety of
interventions are used to work toward these outcomes for improved occupational performance.
Interventions used in occupational therapy focus on the person, environment, and
occupation and how these factors interact (Brown, 2009). Areas of occupation in which a person
may engage include activities of daily living (ADLs), instrumental activities of daily living
(IADLs), rest and sleep, education, work, play, leisure, and social participation. Performance in
30
these occupations is influenced by the physical and social environments. Performance in
occupations is also influenced by specific client factors that include the values, beliefs, body
functions, and body structures of an individual (American Occupational Therapy Association,
2008).
An abundance of literature is available that provides evidence for interventions used with
children and adolescents with sensory processing and integrating deficits (Dawson & Watling,
2000; Hall & Case-Smith, 2007; May-Benson, 2009; May-Benson & Champagne, 2011;
Neistadt, 1990; Roley & Jacobs, 2009; Sinha, Silove, Hayen, & Williams, 1996; Polatajko &
Cantin, 2010). Though adults often present with the same sensory integrating and processing
deficits, there is not as much evidence provided for interventions specifically used with adults
who have sensory deficits (May-Benson, 2009). Three categories of intervention commonly
used with individuals with sensory deficits are the sensory integrative approach, sensory-based
interventions, and auditory interventions (Case-Smith & Arbesman, 2008).
Sensory integrative approach. The sensory integrative approach of intervention for
individuals with sensory deficits is based on A. Jean Ayres’ theory of sensory integration (SI). SI
interventions promote the improvement of sensory deficits that result from the impaired nervous
system (Neistadt, 1990). The SI theory is based on five ideas that include neuroplasticity,
organization of the brain, developmental progression, adaptive response, and inner drive.
Interventions based on the SI theory focus on activities that target the identified sensory deficits.
The tactile, vestibular, and proprioceptive sensations that contribute to performance are also
addressed during SI intervention (Roley & Jacobs, 2009).
Key components of SI intervention include a trained occupational therapist, use of
sensory opportunities that involve appropriate sensory stimulation, motivation from the therapist

31
for the client to succeed, challenge fit to the client’s needs that promotes success, space for
movement, and opportunity for interaction with environment. These key components can be
used to determine fidelity of interventions using the SI approach (Parham et al., 2007).
SI techniques can be used in many settings with individuals who exhibit sensory
processing problems. These interventions all focus on “the production of functional and adaptive
responses to sensory stimuli” (Dawson & Watling, 2000, p. 416). SI intervention for children
might focus more on play, but it could be embarrassing for adolescents and adults to participate
in activities that are child oriented. It is important to incorporate SI techniques that are age
appropriate for each client, which may include activities such as vocational training, house
management skills, food preparation, and money management (May-Benson, 2009) see 2011 OT
Practice.
Sensory-based interventions. Sensory-based interventions can be used by occupational
therapists for individuals with sensory processing deficits to “decrease maladaptive behaviors,
reduce hyperactivity, inhibit self-stimulation and stereotypic movements, and improve attention
and focus” (Escalona, Field, Singer-Strunck, Cullen, & Hartshorn, 2001; Field et al., 1997;
Polatajko & Cantin, 2010). Sensory-based interventions focus on a particular sensory input, such
as using sound therapy for auditory processing or weighted vests to provide deep pressure.
Common sensory-based techniques used include adaptations/accommodations, sensory
diet programs, environmental modifications, education, and remedial interventions. Wearing
noise cancelling headphones and wearing clothing made of a certain material are examples of
accommodations/adaptations. Incorporating a sensory diet program into one’s daily schedule
can help manage sensory processing deficits by devising strategies to help accommodate for the
sensory processing difficulties. Dimming the lights, using a sound machine, and having a

32
specific type of carpet are examples of environmental modifications (May-Benson &
Champagne, 2011).
Additionally, sensory processing deficits can be managed by providing education about
the effects of sensory processing along with strategies to minimize the effects of the sensory
processing problems. This education might be beneficial to the individual with the sensory
processing deficits as well as the people who associate with him or her. Remedial interventions
can involve sensory and motor activities which may include using suspended equipment, for
example, swings, tactile activities such as massaging and brushing, and motor planning activities
such as obstacle courses (May-Benson & Champagne, 2011).
Auditory interventions. The auditory system is connected to many parts of the nervous
system, and sound can be used to promote change in sensory processing (Vital Links, n.d.).
Sound therapy is commonly used for individuals who have difficulty with auditory processing
and are sensitive to noise (May-Benson, 2009). The use of music as therapeutic intervention has
become more popular in recent years (Hall & Case-Smith, 2007). Although there is little
evidence supporting the use of auditory interventions as an effective treatment for individuals
with sensory and auditory processing deficits, there are many methods of auditory intervention
used (Dawson & Watling, 2000; Sinha, Silove, Hayen, & Williams, 1996). Common auditory
interventions used for individuals with auditory processing deficits include Tomatis, auditory
integration training (AIT), Therapeutic Listening®, and the Electronic Auditory Stimulation
effect (EASe).
Tomatis. The first auditory intervention was developed by Alfred Tomatis in the early
1950s. Tomatis was an ear, nose, and throat physician who first developed the method for
singers, but then he used the method for individuals with functional deficits (Nwora & Gee,

33
2009). Tomatis believed that the ear functioned as the “integrator” of the nervous system, and it
was responsible for organizing sensory input received (Thompson & Andrews, 2000). The
Tomatis Method consists of modulated music delivered through “electric ears”, or headphones.
The auditory stimulus provided includes music by Mozart and Gregorian chants, and the music
includes low and high frequencies (Corbett, Shickman, & Ferrer, 2008).
Neysmith-Roy (2001) conducted a study with six boys ages four to11 years with severe
autism. The purpose of the study was to determine if the Tomatis Method was an effective
intervention for improving language skills in children with autism. Results showed that 3 of the
6 boys had improved behavior and prelinguistic changes, and 1 boy was no longer classified as
having autism. Also, more improvement was shown in the younger participants. Corbett et al.
(2008) conducted a study with 11 children ages three years, six months and seven years, two
months with a diagnosis of autism. Although overall improvement of language was shown
throughout the study, the improvement could not be attributed solely to the Tomatis Method
(Corbett et al.).
Auditory integration training. Another form of auditory intervention that incorporates
music modulated with low and high frequencies is auditory integration training (AIT) (Corbett et
al., 2008). Guy Berard studied under Tomatis, and he developed AIT in the early 1960s (Hall &
Case-Smith, 2007). AIT is designed to be used for 2 sessions per day for 10 consecutive days.
An evidence-based review that included 5 studies with AIT found that parents reported
improvement in aberrant behaviors, sound sensitivity, and eye contact (Case-Smith & Arbesman,
2008). Other studies have shown the effectiveness of AIT for improving communication,
behavior, and attention to task (Nwora & Gee, 2009). Mudford, Cross, Breen, and Cullen (2000)
conducted a study using AIT with 16 children. The children had an average age of 9.42 years,

34
and they each had a diagnosis of autism. The result of the study showed no significant benefit
from the use of AIT (Mudford et al., 2000).
Therapeutic Listening®. With inspiration from Berard and Tomatis, Sheila Frick,
OTR/L developed the Therapeutic Listening® program for individuals who have difficulty with
sensory processing, communication, listening, and attention. There are five series of music with
over 45 selections that can be customized by the therapist to design an intervention fit to each
client’s needs. High quality headphones are used to listen to the modified and enhanced music
on the CDs included in the Therapeutic Listening® program. The program was designed to be a
home-based intervention in addition to SI intervention that takes place in the clinic. The
intervention is used two times per day for 30 minute sessions for an average of three to six
months (Vital Links, n.d.).
From use of the Therapeutic Listening® program, improvement has been seen in
emotional regulation, auditory habituation, handwriting, sleep, sensory modulation, posture,
movement, attention, and social interactions (Vital Links, n.d.). Hall and Case-Smith (2007)
conducted a 12-week study to identify the effects of a sensory diet along with the Therapeutic
Listening® program using 10 participants ages 5 to 11 with visual-motor delays and sensory
processing disorder. It was concluded that the Therapeutic Listening® program is an effective
component of SI intervention, especially when used with a sensory diet.
Electronic Auditory Stimulation effect (EASe). William “Bill” Mueller developed the
Electronic Auditory Stimulation effect (EASe) program with inspiration from the work of Jean
Ayres, Glenn Doman, Gerard Beard, and Sheila Frick. EASe is a form of auditory intervention
that uses “random bursts of sound to stimulate, challenge, and promote sensory processing in
children on the autism spectrum and others experiencing difficulty with sensory processing and

35
organization” (“EASe App,” n.d.). EASe is designed for use by individuals with SPD, sensory
integration dysfunction, autism, autism spectrum disorders (ASD), pervasive developmental
disorder (PDD), pervasive developmental disorder not otherwise specified (PDD-NOS), attention
deficit hyperactivity disorder (ADHD), Down syndrome, sensory integration dysfunction,
auditory hypersensitivity, central auditory processing disorder (CAPD), hearing or
developmental sensory issues, and other individuals who are hypersensitive to auditory stimulus
(“EASe,” n.d.).
Bill Mueller began studying children with brain injuries and sensory processing deficits
in the 1980s. He has developed many products for use by these individuals, which include the
EASe CDs, games, and applications (app) for Apple iDevices (“EASE,” n.d.; W. Mueller,
personal communication, December 3, 2012). Approximately 10,000 therapists use the EASe
CDs through Therapeutic Listening, and there are hundreds of therapists that utilize the EASe
games and apps (W. Mueller, personal communication, December 11, 2012).
The EASe CDs were developed in the early 1990s, and there are 10 EASe audio CDs that
are designed to aid individuals with auditory processing difficulties improve their ability to
manage noise. The concept of the EASe CDs is based on the Berard’s AIT method, and Frick’s
Therapeutic Listening program includes some of the EASe CDs. There are six EASe games that
“engage and challenge the child to manage noise and integrate conflicting vestibular and visual
information” (“EASe Games,” n.d.). The games were developed in 2009, and they incorporate
the use of the EASe music with non-violent video games.
A study completed in 2011 determined that the EASe Funhouse game was an effective
intervention for increasing sensory desensitization with children aged eight to 12 years (Carroll,
Lambert, & Brooks, 2011). Improvement in sound sensitivity, sensory defensiveness, eye

36
contact, nonverbal communication, verbal communication and articulation, temperament and
self-management, organization, sleep management, focus and attention, and SPD has been
reported by parents and therapists of individuals who use the EASe products (“EASe,” n.d.).
EASe app. Mueller teamed with Audioforge Labs to develop an EASe app that is
delivered via iPad, iPhone, and iPod touch. There is an EASe Personal app for use by the
individual needing auditory intervention, an EASe Pro app for the therapists, and an EASe Lite
app that can be used as a trial to get an idea of what the EASe apps entail. The EASe Personal
app costs $39.99, the EASe Pro app costs $99.99, and the EASe Lite app costs $0.99. All of the
apps can be purchased in the iTunes App Store (“EASe App,” n.d).
The EASe apps are an accessible auditory intervention that can be used anywhere that an
iDevice can be taken. High quality, over the ear headphones with a frequency response of 20hz
to 20khz are needed for listening to the EASe app. Mueller recommends using the same device
and headphones throughout the EASe intervention. Sessions typically take place two times per
day for no more than 30 minutes per session. Upon completion of each session, data can be
emailed from the device to the therapist to show how the client is progressing (W. Mueller,
personal communication, October 17, 2012).
Data collected from the EASe app includes: song, album, elapsed time in seconds, global
volume, burst length, gap length, high shelf frequency, high shelf gain, attack, stereo, mute left,
mute right, notch frequency, notch gain, and notch Q. The global volume shows the percentage
of volume used during the session. The burst length is how long the burst of music delivered
lasts. Longer bursts increase intensity of the session. The gap length is the time between two
bursts. A shorter gap length means that more bursts are being delivered, which makes a more
intense session. The high shelf frequency is the frequency above which the nominal amount of

37
boost is applied to the music during a burst. The session is more intense when the frequency is
lower. The high shelf gain is also called the boost. Boost ranges from 0dB to 40dB, and a
higher boost is more intense. The attack describes how fast the burst is ramped up and ramped
down. A lower attack number is more intense. The left or right speaker can be muted to target
one hemisphere of the brain (W. Mueller, personal communication, October 17, 2012; T.
Horvath, personal communication; February 25, 2013; “Electronic Auditory,” n.d).
The auditory input delivered through the EASe app provides challenges to improve
habituation to intense auditory environments. While the music in the EASe app is similar to the
EASe CDs, the EASe app can be more personalized to each individual. There are 4 Presets of
music programed into the EASe app which are customizable to each individual’s needs. The
goal of using the EASe app is for the individual to move through Presets 1 to 4 by listening to the
music for 30 minutes per session, which in turn will increase the individual’s ability to habituate
to auditory input in the environment (W. Mueller, personal communication, October 17, 2012;
“Electronic Auditory,” n.d).
Summary
The literature concerning sensory processing, the effects of sensory processing deficits on
occupational performance, and occupational therapy interventions for individuals with sensory
processing deficits has been explored. Due to the lack of research available to support the use of
the EASe application, the researchers aim to explore the effects of the EASe Personal app for
adolescents and adults 11 to 22 years with sensory processing deficits. The research will also
provide evidence on the use of the EASe app intervention with adolescents and adults in multiple
environments including the clinic, home, and school. This study is important as it is anticipated
to provide data regarding the utility of the EASe application and evidence toward its use as an

38
intervention to improve auditory processing and occupational performance for individuals who
are 11 to 22 years old with sensory processing deficits.

39
Chapter 3
Methodology
Purpose
The purpose of this research study is to determine if the Electronic Auditory Stimulation
effect application (EASe app) improves sensory processing responses through habituation to
auditory environments, thereby improving occupational performance, for adolescents and adults
ages 11 to 22 years with sensory processing deficits.
Research Design
This was a quasi-experimental pre-post research study that aimed to answer the following
research questions: For adolescents and adults ages 11 to 22 years with sensory processing
deficits, does listening to the EASe application two times a day for 30 minutes improve
habituation to auditory environments, which in turn may improve behavioral responses to
sensory input? Also, will the participants’ occupational performance improve from baseline
assessment to post-intervention?
It was hypothesized that the use of the EASe application for two 30 minute sessions per
day for 28 consecutive days will improve the participants’ habituation to auditory environments
and occupational performance, as measured by the Canadian Occupational Performance Measure
(COPM) and EASe Intensity Quotient (IQ).
The independent variable was the use of the EASe application. The dependent variables
were habituation to auditory environments as identified by the EASe intensity quotient (IQ) and
occupational performance as shown by the COPM. The Adolescent/Adult Sensory Profile
(AASP) and the COPM were completed to identify specific sensory processing and occupational

40
performance of each participant. This study called for each participant to listen to the EASe
Personal app for two 30 minute sessions per day for 28 consecutive days.
Participants
A convenience sample of approximately 40 participants was recruited from All About
Kids Therapy Services, Sai Rehab, and Essential Therapy Services, Inc. Letters of authorization
from all facilities were signed before recruitment of their clients began (Appendix A, B, and C).
Participants were recommended based on their observed sensory processing deficits addressed
by their occupational therapists. Flyer advertisements in the clinics, as well as word of mouth
from employees at the clinic, were used to recruit participants (Appendix D). After the study
was explained to potential participants, consent for participation in this study was obtained.
Inclusion criteria. Participants in this study had to be fluent in the English language.
The participants must have been within the age range of 11 years to 22 years. The participants
must have had sensory processing deficits/auditory processing deficits identified by a diagnosis
or their therapist through assessment. The participants must have been currently receiving
occupational therapy services. Daily access to an iPod touch, iPad, or iPhone was required in
order to use the study’s Electronic Auditory Stimulation effect (EASe) application. Participants
must have had access to quality headphones as recommended by EASe developer. The
headphones must have been approved by the researchers prior to beginning the EASe
intervention.
Exclusion criteria. Individuals who were not fluent in the English language were
excluded from the study due to potential language barriers. Adolescents and adults who did not
have access to iPod touch, iPad, iPhone, and/or required headphones were excluded as well.
Individuals with a condition that impacts neurological development, such as seizure disorder or

41
Fragile X syndrome were excluded. Adolescents and adults who are taking medications that
may affect autonomic activity, such as dextroamphetamine and amphetamine (Adderall), beta
blockers, oxybutynin (Ditropan), selective serotonin reuptake inhibitors, or methylphenidate
(Ritalin) were also excluded. Typically developing individuals and/or those who have no
identified sensory deficits were excluded from the study. Adolescents and adults who were
currently participating in any listening therapy program were excluded due to possible
interference with the EASe application.
Procedures
Once approval from the Institutional Review Board (IRB) was received (Appendix E),
recruitment of participants began. At the initial meeting with the researchers and study
participants, the participants were informed of the purpose of the study, and the consent form
was completed by the participants and/or legal guardians (Appendix F). During this session, the
EASe Personal app was downloaded to their device if available. Participants also had an
opportunity to ask the student researchers questions regarding the study. An EASe identification
(ID) number was assigned to each participant upon completion of the consent form. The EASe
ID number was used to identify the participants. A student researcher, who was assigned as the
data manager, kept the list of EASe ID numbers and participant names. The data manager was
the only researcher who had access to the data.
Once consent was gained from all participants and the app had been downloaded to their
devices, a training session took place. During this session, the EASe app was explained to the
participants, and a demonstration of the EASe app was shown. A training packet (Appendix G)
was given to the participants for reference. The training packet included EASe instructions, the
daily data sheet, a schedule, and the researchers’ contact information.

42
A demographic form was completed during the training session to collect information
about the participants to adequately describe the sample (Appendix H). The demographic form
included information such as the participants’ name, date of birth, age, diagnosis/developmental
history, medications, therapy services, history of using auditory interventions, and participation
in hobbies and leisure activities. Data collection began once participants were identified and
trained.
Prior to administration of the Adolescent/Adult Sensory Profile (AASP) and Canadian
Occupational Performance Measure (COPM), researchers completed standardization procedures
to assure uniform administration of these tools. Student researchers received training in the
administration of the AASP and COPM by two faculty members in the School of Occupational
Therapy with advanced skills and experience in administering the AASP and COPM. Next, one
volunteer was identified and selected for training purposes. Each student researcher was
assigned to complete either the AASP, COPM, training procedures, or consent procedures with
the volunteer. Consent was gained from the volunteer to allow for the session to be videotaped.
After the tests were administered and scored, the research team, along with a faculty/thesis
committee member, discussed the scores and observations to determine if standardized
procedures were met. Additionally, this served to facilitate skill development and test protocol
compliance by each student researcher.
One to three days prior to the participants beginning the EASe app intervention, the
AASP and COPM was administered by student researchers who had been trained to administer
the study protocol. Participants then used the EASe app for two 30 minute sessions per day for
28 consecutive days. Mueller recommends listening to the EASe app once in the morning and
once in the afternoon. High quality headphones (e.g. Shure SRH 240A, Sennheiser HD 500A,

43
Audio-Technica ATH FC700, Sony MDR V6) approved by the researchers were used with the
EASe app, and Mueller recommends using the same iDevice and headphones for each session.
EASe listening sessions could take place at home, school, or in a clinic. During each daily
session, participants had the option of completing different activities that did not include
background music/sound. For example, activities might have included reading a book,
assembling a puzzle, drawing, writing, and completing school work. Activities done during each
session could not include auditory stimuli other than the EASe app (W. Mueller, personal
communication, October 17, 2012).
Upon completion of each EASe app session, data was emailed to the assigned data
manager. A data sheet was used to keep track of information relating to each session, such as
when each session occurred and what activity was done during the session (Appendix I). The
data sheets were monitored by student researchers, who checked-in on each participant every
Monday, Wednesday, and Friday by either phone call, text, email, or in person. The data sheets
were collected at the end of the 28 day study.
An exit interview (Appendix J) and reassessment COPM were administered to each
participant by a student researcher one to three days following the completion of the 28-day
intervention. If a participant was unable to complete the 28-day study, a separate exit interview
was conducted (Appendix K). Upon completion of the exit interview and COPM reassessment,
each participant and legal guardian was told that they would be provided with the results from
the study once data analysis and interpretation were completed.
Additionally, a Procedures Chart was available for reference as needed (Appendix L).
The Procedures Chart illustrated the step-by-step study protocol, which was utilized for quick
reference among researchers.

44
Data Collection Strategies
The AASP and COPM were administered to each participant by the student researchers.
The assessments were completed by the participants with assistance from their guardian(s) as
needed. The AASP was completed once, prior to beginning the EASe app intervention. The
COPM was completed prior to beginning the intervention and immediately following completion
of the 28 day study. An exit interview (Appendix H) was completed along with the COPM
reassessment.
To ensure consistent use of the EASe app, the student researchers made check-in calls,
emails, or sent text messages to the participants and/or their guardians every Monday,
Wednesday, and Friday. The EASe app has a data collection system built in that kept track of
data from each session. This data was emailed to the student data manager upon completion of
each session. A daily data sheet was completed by the participants and/or guardians to keep track
of other relevant information, including session date, session number, start and end time, activity
completed, and additional comments (Appendix F).
The EASe Personal app intervention was scheduled to be completed over a 28 day period
between January to February 2013. Each participant completed two sessions each day for no
more than 30 minutes per session. Mueller recommends that one session take place in the
morning and the second session take place in the afternoon (W. Mueller, personal
communication, October 17, 2012).
Measures
Measures used for this study included the Adolescent/Adult Sensory Profile (AASP),
Canadian Occupational Performance Measure (COPM), and EASe Intensity Quotient (IQ). The
45
measures were used to identify specific sensory processing deficits, occupational performance,
and intensity of each EASe session.
Adolescent/Adult Sensory Profile. The Adolescent/Adult Sensory Profile (AASP) was
developed by Catana Brown, Ph.D., OTR, FAOTA and Winnie Dunn, Ph.D., OTR, FAOTA for
use with individuals ages 11 and older. It is a self-report questionnaire used to identify specific
sensory processing deficits. The questionnaire consists of 60 items. The categories included in
the questionnaire are taste/smell processing, movement processing, visual processing, touch
processing, activity level, and auditory processing. The answer options for each question are
“almost never”, “seldom”, “occasionally”, “frequently”, and “almost always” (Brown & Dunn,
2002). Scores on the AASP are categorized into four quadrants, which are low registration,
sensation seeking, sensory sensitivity, and sensation avoiding. The quadrants are based on Dr.
Dunn’s Model of Sensory Processing. Each quadrant includes 15 of the 60 items. Classification
in each quadrant is based on the given answers, which are “much less than most people”, “less
than most people”, “similar to most people”, “more than most people”, and “much more than
most people”. Pattern grids are also included in the AASP to identify patterns that might emerge
within each sensory processing category. (Brown & Dunn, 2002).
COPM. The COPM is a measure used with a variety of individuals to identify “changes
in self-perception of occupational performance” (Law et al., 2005, p.1). Occupations in the
COPM are classified into the areas of self-care, productivity, and leisure. The self-care category
includes personal care, functional mobility, and community management. The productivity
category includes paid/unpaid work, household management, and play/school. Quiet recreation,
active recreation, and socialization are included in the leisure category.

46
During completion of the COPM, individuals are asked to identify the activities involved
in a typical day with which they have difficulty. The participant then rates the identified
activities from 1 to 10, with 1 being not important at all and 10 being extremely important. The
client is then asked to identify a maximum of five occupations that are of the most importance to
them. Each of the most important activities is rated on Performance and Satisfaction. Scores are
calculated by dividing the total Performance and Satisfaction scores by the number of difficult
activities identified.
A reassessment can be done to determine change in Performance and Satisfaction over
time (Law et al., 2005). Although the COPM does not specify the length of time between
assessment and reassessment, numerous studies have utilized the measure with different time
frames. Evidence is available supporting the use of the COPM as an effective
assessment/reassessment measure as early as one to three months (Chen, Rodger, & Polatjko,
2002; Eyssen et al., 2011).
EASe Intensity Quotient. The EASe IQ was developed by Mueller and Horvath for use
in this EASe study. The Ease IQ is used to measure the intensity of one EASe session to the
next. From the EASe app data emailed to the data manager upon completion of each listening
session, the EASe IQ formula was used to determine intensity of each listening session. Data
included in the EASe IQ formula is song, album, elapsed time, global volume, burst length, gap
length, high shelf frequency, high shelf gain, attack, mute left, and mute right (W. Mueller,
personal communication, October 17, 2012). A higher EASe IQ means that the participant
demonstrates a greater habituation to auditory stimuli (W. Mueller, personal communication,
October 17, 2012).

47
Reliability and Validity of Measures.
Various methods are used to determine the reliability and validity of measures used in
this study. Methods to ensure reliability include coefficient alpha and test-retest reliability. To
confirm test-retest reliability, an assessment is administered once, and then after a determined
period of time the assessment is administered again to the same group of participants under
similar circumstances (Bordens & Abbott, 2011). In the coefficient alpha method, an assessment
is administered in two halves, which are then correlated with one another. The coefficient alpha
ranges between zero to one, with a higher number representing greater reliability.
Methods to ensure validity include: content validity, criterion validity, construct validity,
convergent validity, and divergent validity. In order to ensure content validity, the questions in
an assessment must “cover the range of behaviors normally considered to be part of the
dimension” being assessed (Bordens & Abbott, 2011, p.276). Criterion validity involves
comparing the results of an assessment to another established assessment with similar criteria.
Construct validity is used to determine if a measure correlates positively with theoretical
concepts (Bordens & Abbott, 2011; Law et al., 2005). Convergent validity is used to ensure that
two parallel measures with the same constructs will produce similar results (Portney & Watkins,
2009). Discriminant validity is determined through the establishment of a lower correlation
between related yet separate constructs in two different standardized measures (Brown & Dunn,
2002).
The coefficient alpha method was used to determine reliability of the Adolescent/Adult
Sensory Profile (AASP). Coefficient alphas range from 0 (no consistency) to 1 (perfect
consistency). Each quadrant and age group of the AASP was evaluated. The coefficient alphas
for the 11-17 year and 18-64 year age groups range from .639 to .748. The coefficient alpha for

48
low registration is .712 for 11-17 years and .692 for 18-64 years. Sensation seeking is .748 for
11-17 years and .639 for 18-64 years. The coefficient alpha for sensory sensitivity for 11-17
years is .646 and 18-64 years is .657. Sensation avoiding has a coefficient alpha of .678 for 11-
17 years and .699 for 18-64 years (Brown & Dunn, 2002).
Content validity was determined for the AASP by a review of pilot studies completed by
an expert panel. Convergent and discriminant validity was determined by comparing the AASP
quadrants to the NYLS Adults Temperament Questionnaire subscales. Correlations of moderate
strength scoring of .30 and above are as follows: sensation seeking to approach/withdrawal and
mood, sensory sensitivity to mood and sensory threshold, and sensation avoiding to adaptability,
approach/withdrawal, and mood (Brown & Dunn, 2002).
Three studies were reviewed to determine test-retest reliability of the Canadian
Occupational Performance Measure (COPM), and results were consistent among the studies.
One study was completed with stroke patients, which provided test-retest reliability of 0.89 to
0.88 (Cup, Scholte op Reimer, Thijssen, van Kuyk-Minis, 2003). Another study was completed
in Taiwan with individuals with Schizophrenia, and the results yielded test-retest reliability
scores of 0.84 to 0.85 (Pan, Chung, & Hsin-Hwei, 2003). A third study was completed with
individuals with chronic obstructive pulmonary disease (COPD), which provided scores of 0.90
to 0.92 for test-retest reliability (Sewell & Singh, 2001). All three studies provided acceptable
reliability scores above 0.80.
Eight studies were reviewed to determine content, criterion, and construct validity of the
COPM. The measures that were used as a comparison to the COPM include: Reintegration to
Normal Living Index (RNL), Dutch version of the Disabilities of Arm, Shoulder, and Hand
Questionnaire (DASH-DLV), Health Assessment Questionnaire (HAQ), Wisconsin Quality of

49
Life-Client Questionnaire (WQL), Work Personality Profile (WPP), Satisfaction with
Performance Scaled Questionnaire (SPSQ), Life Satisfaction Scale (LSS), Functional
Independence Measure (FIM), and the Klein Bell ADL Activity Subscale. The two measures
most similar to the COPM are the SPSQ and RNL (Law et al., 2005).
The EASe Intensity Quotient (IQ) is a formula developed by William Mueller and Tibor
Horvath for this study, and there have been no studies done thus far to determine the reliability
and validity of the formula.
Data Analysis
The data analysis for this study was completed using the Statistical Package of the Social
Sciences (SPSS). The SPSS data set included variables from the demographic form, AASP,
COPM, and EASe IQ, preset, and elapsed time for each EASe application session.
The AASP was the first assessment that was administered, and descriptive statistics were
analyzed to examine and describe the participant’s specific deficits in the four sensory
processing quadrants, and trends in sensory processing deficits in the study sample.
The COPM was the second assessment that was administered to participants. Parametric
and qualitative data were both gathered from the COPM. The baseline and reassessment scores
of the COPM were analyzed with descriptive data from the COPM. The qualitative data that was
gathered from the COPM was the specific difficulties or problem areas in occupational
performance that the participants identified during the interview. From this qualitative data,
themes were analyzed, created, and re-analyzed.
The EASe Intensity Quotient (IQ) is the measure of the intensity of the EASe session. As
the participant is able to increase his or her tolerance to the EASe sessions, the EASe IQ of the
session will increase (W. Mueller, personal communication, November 1, 2012). Mueller’s

50
EASe IQ formula was used to determine the EASe IQ for each session. Descriptive statistics and
a Spearman’s rho correlation test were used to analyze the non-parametric data of the EASe IQ
and participant COPM scores. A Pearson correlation test was used to compare each session’s
EASe IQ across the 56 sessions.
Within one to three days after completion of the 28-day study, the COPM reassessment
was completed. Also, the participants’ daily data sheets (Appendix F) were collected and an exit
interview was conducted for qualitative interpretation. Additionally, qualitative data was
gathered from the emails, texts, and phone calls that took place among the participants and
researchers. Convergence of these sources of information was performed to identify categories
through open coding. Next, the information was dimensionalized into a smaller set of categories
to facilitate processing of the information. Following this process, axial coding was implemented
to generate emerging themes and patterns from constant comparative analysis of the reported
data.
Researcher Bias and Assumptions
Potential biases of the researchers included the desire of the study outcomes to be
significant. This was controlled by the use of the standardized assessments, which are the AASP
and COPM. The scores from these standardized assessments were analyzed by SPSS. The
outcome measure, the EASe IQ, is a measure that also could not be altered. One of the
researchers was the data manager, and the data manager was the only researcher who had access
to the data. This eliminated bias from the other researchers, as well as eliminated bias from the
occupational therapists of the participants.
Another potential bias was that the student researcher’s thesis advisor is a co-owner of
one of the therapy clinics used in this study to obtain the convenience sample. This bias was
51
controlled through the student researchers administering the assessments and the thesis advisor
not taking part in any of the data gathering processes. The thesis advisor also did not have
access to any of the participants’ EASe app information gathered at any point of the study.
Timeline and Budget
Participants were initially gathered from existing caseloads at the four participating
therapy clinics. Following consent and download of the EASe application in November, 2012,
participants completed training for the EASe application in December, 2012. The participants
were instructed to not use the EASe application until the beginning of data collection in January
2013. Data collection began between the dates of January 11th -22nd, and ended between the
dates of February 11th-22nd. Data analysis was conducted during February 2013. The
compilation of results and discussion of the study findings was completed in March 2013. In
addition, expenses such as printing the PowerPoint poster and other documents, binding, and
traveling were equally divided among the student researchers.
Summary
The purpose of this quasi-experimental pre-post research study using a convenience
sample of approximately 25 adolescents and young adults was to determine if the EASe app
improves sensory processing responses through habituation to auditory environments, thereby
improving occupational performance, for adolescents and adults ages 11 to 22 years with sensory
processing deficits.
The study explored the participants’ ability to habituate to auditory stimuli and any
changes in their occupational performance as a result of using the EASe app. This was the first
study to research the use of the EASe application as an intervention.

52
Once Internal Review Board (IRB) approval was received and consent to participate in
this study was obtained, EASe apps was downloaded, demographic information was gathered,
and a training session took place all before the EASe intervention began in January 2013. The
Adolescent/Adult Sensory Profile (AASP) and the Canadian Occupational Performance Measure
(COPM) were administered to participants prior to beginning the intervention, and the COPM
was re-administered post-intervention. Data was collected from each EASe session, and EASe
IQ was formulated to determine the intensity of each session tolerated by each participant. Upon
completion of the 28 day intervention, data analysis was completed using SPSS to determine the
effects of the EASe app on sensory processing responses, habituation to auditory environments,
and occupational performance. Data was analyzed by descriptive statistics of EASe IQ, EASe
preset, EASe session time, COPM baseline and reassessment scores, AASP scores, a Pearson
correlation of the mean EASe IQ of each EASe app session, and a Spearman’s rho correlation
of EASe IQ and COPM scores.
53
Chapter 4
Results
The research study was conducted to determine if the Electronic Auditory Stimulation
effect (EASe) application (app) improves sensory processing responses through habituation to
auditory environments, thereby improving occupational performance, for adolescents and adults
ages 11 to 22 years with sensory processing deficits. The research questions were: 1) For
adolescents and adults ages 11 to 22 years with sensory processing deficits, does listening to the
Electronic Auditory Stimulation application two times a day for 30 minutes improve habituation
to auditory environments, which in turn might improve behavioral responses to sensory input?
2) Will the participants’ occupational performance improve as evidenced by the comparison of
their COPM baseline and reassessment scores?
It was hypothesized that the use of the EASe application for two 30 minute sessions per
day for 28 consecutive days will improve the participants’ habituation to auditory environments
and occupational performance, as measured by the EASe Intensity Quotient (IQ) and Canadian
Occupational Performance Measure (COPM). The independent variable was the use of the EASe
application. The dependent variables were habituation to auditory environments as ascertained
by the EASe intensity quotient (IQ) and occupational performance as shown by the COPM.
Participants
The participants were recruited from three occupational therapy clinics – Essential
Therapy Services, Inc., Sai Rehab, Inc., and All About Kids Therapy Services, Inc. Ten
participants were recruited from Essential Therapy Services, Inc, four participants were recruited
from Sai Rehab, Inc, and one participant was recruited from All About Kids Therapy Services,
Inc., resulting in a total of 17 participants consenting. The 28-day study protocol was completed

54
by 13 participants. Four participants were unable to complete the study. One participant
withdrew due to non-compliance with EASe protocol and no sessions completed, one participant
withdrew due to an ear infection and inability to tolerate headphone use, and two participants did
not meet the full inclusion criteria.
Table 4.1 displays the demographic data gathered from the demographic forms completed
by the13 participants. The majority of the participants were male (n=10) and Caucasian (n=11).
The participants’ age range was from eleven years to seventeen years. The participants had a
wide range of diagnoses, yet all of them had sensory processing deficits identified by their
occupational therapists. The types of schools the participants attended were public school,
private school, and public online school. The participants’ grade range was from 4th grade to 10th
grade. The participants received a wide range of therapies, including occupational therapy,
physical therapy, speech therapy, music therapy, psychological therapy, and relationship
development intervention.
The participant group overall used four different types of iDevices for the EASe app, and
they included the iPad, the iPad Mini, the iPhone, and the iPod Touch. Several types of
headphones were used for the EASe app which included Shure SRH 240A headphones, the
Sennheiser HD 500 A headphones, the AfterShokz Sportz 2 headphones, the Audio Technica
ATH FC 700 headphones, and the Sony MDR V6 headphones. The aforementioned headphone
models were either recommended or approved by the EASe developer.
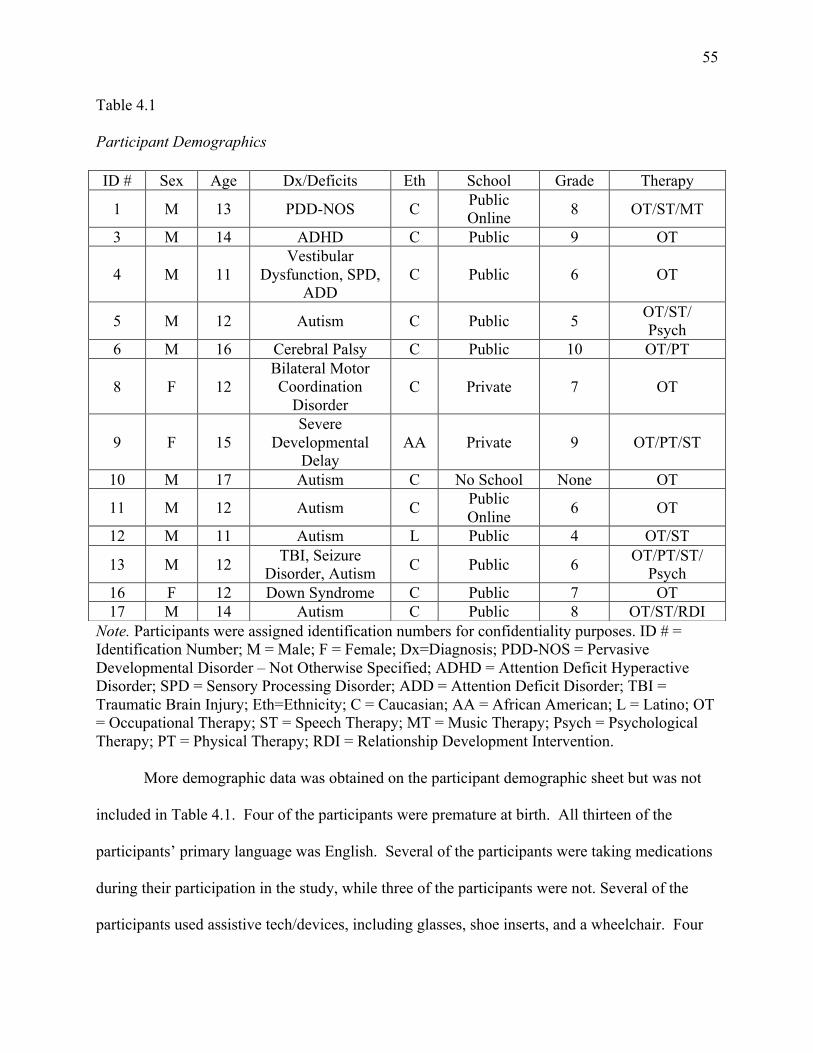
55
Table 4.1
Participant Demographics
Note. Participants were assigned identification numbers for confidentiality purposes. ID # = Identification Number; M = Male; F = Female; Dx=Diagnosis; PDD-NOS = Pervasive Developmental Disorder – Not Otherwise Specified; ADHD = Attention Deficit Hyperactive Disorder; SPD = Sensory Processing Disorder; ADD = Attention Deficit Disorder; TBI = Traumatic Brain Injury; Eth=Ethnicity; C = Caucasian; AA = African American; L = Latino; OT = Occupational Therapy; ST = Speech Therapy; MT = Music Therapy; Psych = Psychological Therapy; PT = Physical Therapy; RDI = Relationship Development Intervention.
More demographic data was obtained on the participant demographic sheet but was not
included in Table 4.1. Four of the participants were premature at birth. All thirteen of the
participants’ primary language was English. Several of the participants were taking medications
during their participation in the study, while three of the participants were not. Several of the
participants used assistive tech/devices, including glasses, shoe inserts, and a wheelchair. Four
ID # Sex Age Dx/Deficits Eth School Grade Therapy
1 M 13 PDD-NOS C Public Online 8 OT/ST/MT
3 M 14 ADHD C Public 9 OT
4 M 11 Vestibular
Dysfunction, SPD, ADD
C Public 6 OT
5 M 12 Autism C Public 5 OT/ST/ Psych
6 M 16 Cerebral Palsy C Public 10 OT/PT
8 F 12 Bilateral Motor Coordination
Disorder C Private 7 OT
9 F 15 Severe
Developmental Delay
AA Private 9 OT/PT/ST
10 M 17 Autism C No School None OT
11 M 12 Autism C Public Online 6 OT
12 M 11 Autism L Public 4 OT/ST
13 M 12 TBI, Seizure Disorder, Autism C Public 6 OT/PT/ST/
Psych 16 F 12 Down Syndrome C Public 7 OT 17 M 14 Autism C Public 8 OT/ST/RDI
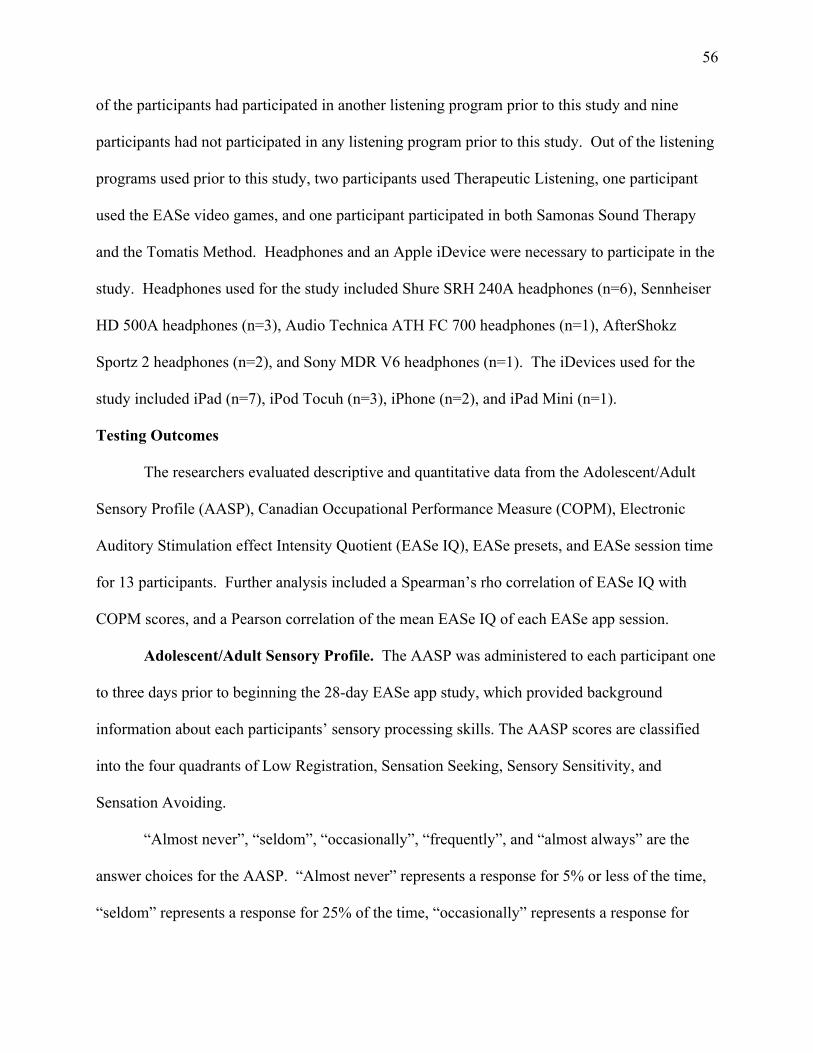
56
of the participants had participated in another listening program prior to this study and nine
participants had not participated in any listening program prior to this study. Out of the listening
programs used prior to this study, two participants used Therapeutic Listening, one participant
used the EASe video games, and one participant participated in both Samonas Sound Therapy
and the Tomatis Method. Headphones and an Apple iDevice were necessary to participate in the
study. Headphones used for the study included Shure SRH 240A headphones (n=6), Sennheiser
HD 500A headphones (n=3), Audio Technica ATH FC 700 headphones (n=1), AfterShokz
Sportz 2 headphones (n=2), and Sony MDR V6 headphones (n=1). The iDevices used for the
study included iPad (n=7), iPod Tocuh (n=3), iPhone (n=2), and iPad Mini (n=1).
Testing Outcomes
The researchers evaluated descriptive and quantitative data from the Adolescent/Adult
Sensory Profile (AASP), Canadian Occupational Performance Measure (COPM), Electronic
Auditory Stimulation effect Intensity Quotient (EASe IQ), EASe presets, and EASe session time
for 13 participants. Further analysis included a Spearman’s rho correlation of EASe IQ with
COPM scores, and a Pearson correlation of the mean EASe IQ of each EASe app session.
Adolescent/Adult Sensory Profile. The AASP was administered to each participant one
to three days prior to beginning the 28-day EASe app study, which provided background
information about each participants’ sensory processing skills. The AASP scores are classified
into the four quadrants of Low Registration, Sensation Seeking, Sensory Sensitivity, and
Sensation Avoiding.
“Almost never”, “seldom”, “occasionally”, “frequently”, and “almost always” are the
answer choices for the AASP. “Almost never” represents a response for 5% or less of the time,
“seldom” represents a response for 25% of the time, “occasionally” represents a response for
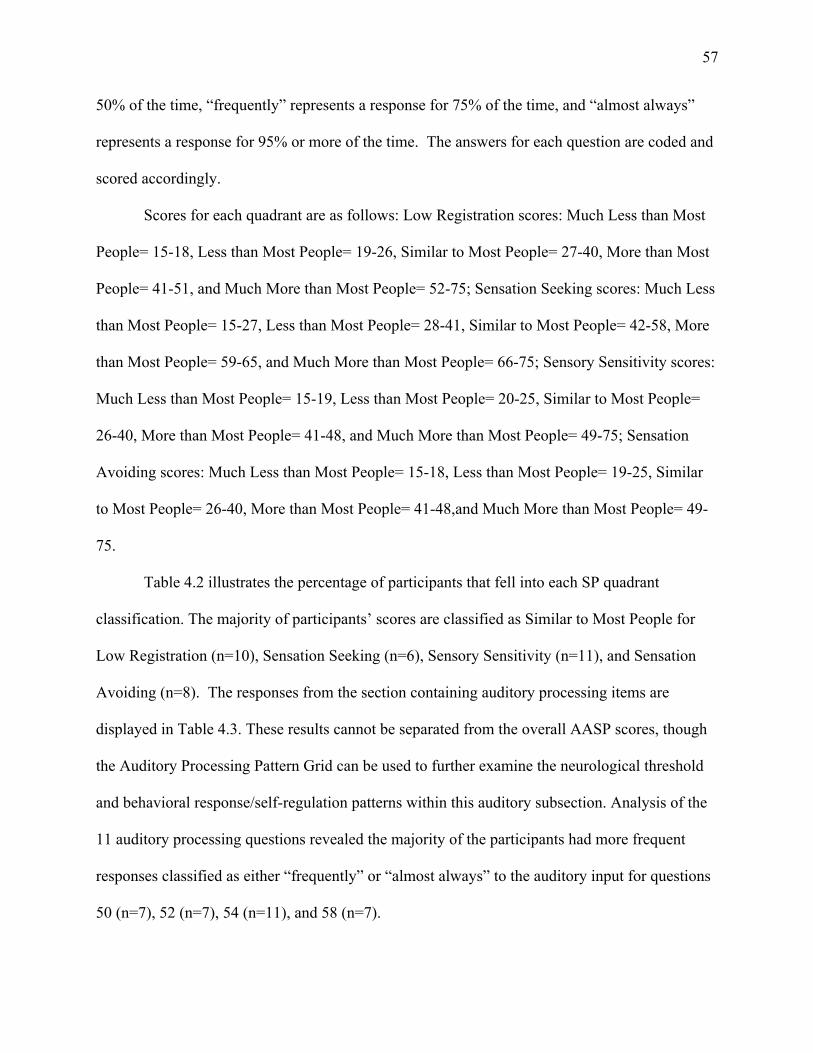
57
50% of the time, “frequently” represents a response for 75% of the time, and “almost always”
represents a response for 95% or more of the time. The answers for each question are coded and
scored accordingly.
Scores for each quadrant are as follows: Low Registration scores: Much Less than Most
People= 15-18, Less than Most People= 19-26, Similar to Most People= 27-40, More than Most
People= 41-51, and Much More than Most People= 52-75; Sensation Seeking scores: Much Less
than Most People= 15-27, Less than Most People= 28-41, Similar to Most People= 42-58, More
than Most People= 59-65, and Much More than Most People= 66-75; Sensory Sensitivity scores:
Much Less than Most People= 15-19, Less than Most People= 20-25, Similar to Most People=
26-40, More than Most People= 41-48, and Much More than Most People= 49-75; Sensation
Avoiding scores: Much Less than Most People= 15-18, Less than Most People= 19-25, Similar
to Most People= 26-40, More than Most People= 41-48,and Much More than Most People= 49-
75.
Table 4.2 illustrates the percentage of participants that fell into each SP quadrant
classification. The majority of participants’ scores are classified as Similar to Most People for
Low Registration (n=10), Sensation Seeking (n=6), Sensory Sensitivity (n=11), and Sensation
Avoiding (n=8). The responses from the section containing auditory processing items are
displayed in Table 4.3. These results cannot be separated from the overall AASP scores, though
the Auditory Processing Pattern Grid can be used to further examine the neurological threshold
and behavioral response/self-regulation patterns within this auditory subsection. Analysis of the
11 auditory processing questions revealed the majority of the participants had more frequent
responses classified as either “frequently” or “almost always” to the auditory input for questions
50 (n=7), 52 (n=7), 54 (n=11), and 58 (n=7).
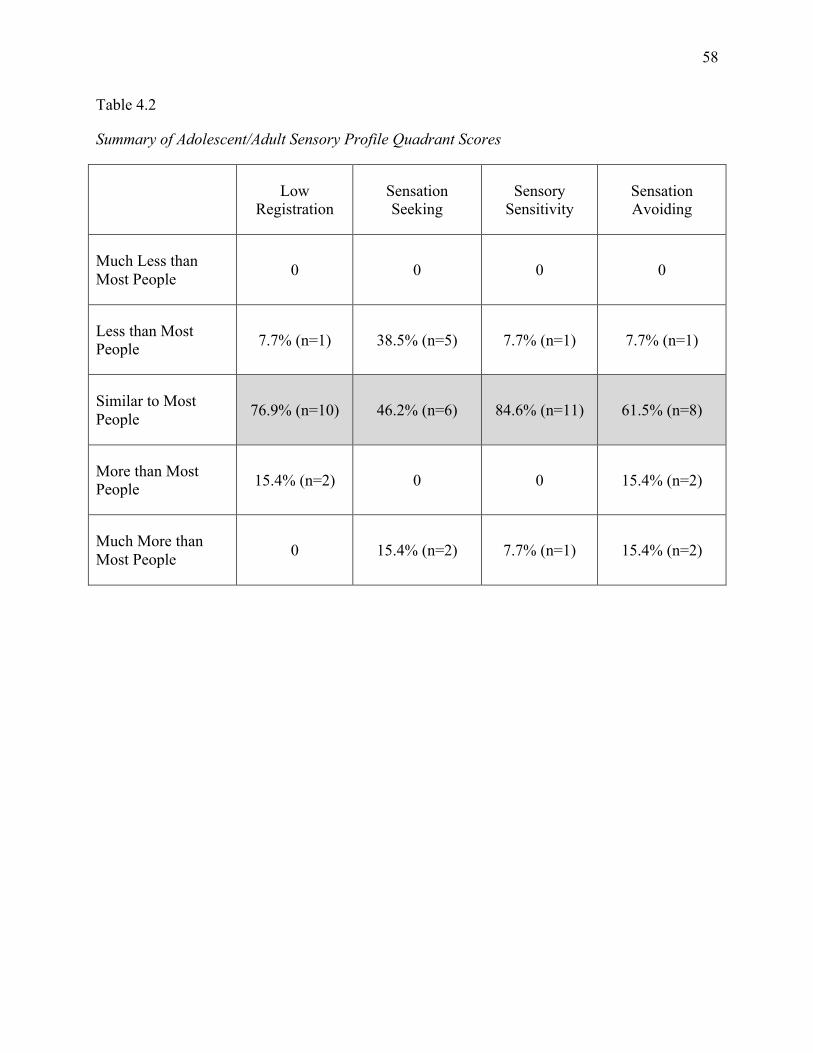
58
Table 4.2
Summary of Adolescent/Adult Sensory Profile Quadrant Scores
Low Registration
Sensation Seeking
Sensory Sensitivity
Sensation Avoiding
Much Less than Most People 0 0 0 0
Less than Most People 7.7% (n=1) 38.5% (n=5) 7.7% (n=1) 7.7% (n=1)
Similar to Most People 76.9% (n=10) 46.2% (n=6) 84.6% (n=11) 61.5% (n=8)
More than Most People 15.4% (n=2) 0 0 15.4% (n=2)
Much More than Most People 0 15.4% (n=2) 7.7% (n=1) 15.4% (n=2)

59
Table 4.3
Summary of Adolescent/Adult Sensory Profile Auditory Processing Questions
Almost Never Seldom Occasionally Frequently Almost Always Question 50 (Sensation Seeking)
7.7% (n=1) 30.8% (n=4) 7.7% (n=1) 23.1% (n=3) 30.8% (n=4)
Question 51 (Sensory Sensitivity)
30.8% (n=4) 23.1% (n=3) 23.1% (n=3) 7.7% (n=1) 15.4% (n=2)
Question 52 (Low Registration)
7.7% (n=1) 7.7% (n=1) 23.1% (n=3) 30.8% (n=4) 30.8% (n=4)
Question 53 (Sensation Avoiding)
61.5% (n=8) 7.7% (n=1) 23.1% (n=3) 7.7% (n=1) 0
Question 54 (Sensory Sensitivity)
15.4% (n=2) 0 0 69.2% (n=9) 15.4% (n=2)
Question 55 (Low Registration)
46.2% (n=6) 15.4% (n=2) 23.1% (n=3) 7.7% (n=1) 7.7% (n=1)
Question 56 (Sensation Avoiding)
15.4% (n=2) 0 46.2% (n=6) 23.1% (n=3) 15.4% (n=2)
Question 57 (Sensation Avoiding)
15.4% (n=2) 23.1% (n=3) 38.5% (n=5) 15.4% (n=2) 7.7% (n=1)
Question 58 (Sensation Seeking)
30.8% (n=4) 0 15.4% (n=2) 38.5% (n=5) 15.4% (n=2)
Question 59 (Low Registration)
23.1% (n=3) 7.7% (n=1) 46.2% (n=6) 23.1% (n=3) 0
Question 60 (Sensory Sensitivity)
30.8% (n=4) 7.7% (n=1) 15.4% (n=2) 23.1% (n=3) 23.1% (n=3)
Average Percentage 25.89% 11.2% 23.8% 24.49% 14.7%
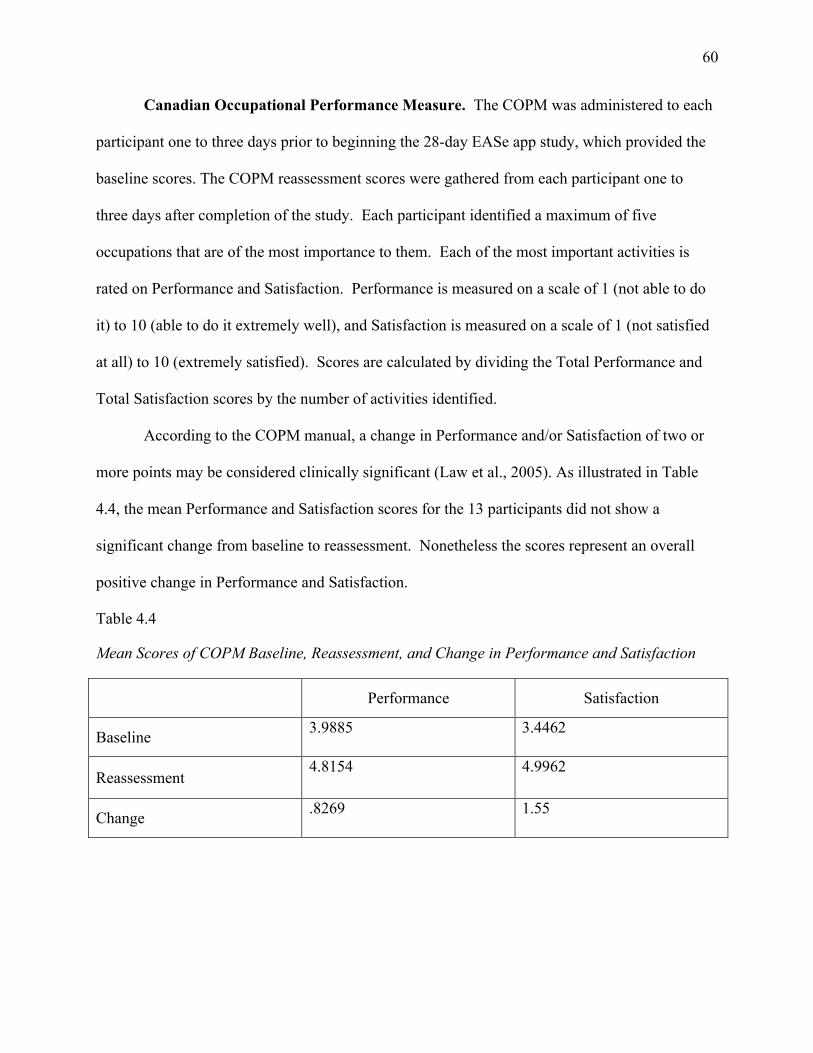
60
Canadian Occupational Performance Measure. The COPM was administered to each
participant one to three days prior to beginning the 28-day EASe app study, which provided the
baseline scores. The COPM reassessment scores were gathered from each participant one to
three days after completion of the study. Each participant identified a maximum of five
occupations that are of the most importance to them. Each of the most important activities is
rated on Performance and Satisfaction. Performance is measured on a scale of 1 (not able to do
it) to 10 (able to do it extremely well), and Satisfaction is measured on a scale of 1 (not satisfied
at all) to 10 (extremely satisfied). Scores are calculated by dividing the Total Performance and
Total Satisfaction scores by the number of activities identified.
According to the COPM manual, a change in Performance and/or Satisfaction of two or
more points may be considered clinically significant (Law et al., 2005). As illustrated in Table
4.4, the mean Performance and Satisfaction scores for the 13 participants did not show a
significant change from baseline to reassessment. Nonetheless the scores represent an overall
positive change in Performance and Satisfaction.
Table 4.4
Mean Scores of COPM Baseline, Reassessment, and Change in Performance and Satisfaction
Performance Satisfaction
Baseline 3.9885 3.4462
Reassessment 4.8154 4.9962
Change .8269 1.55
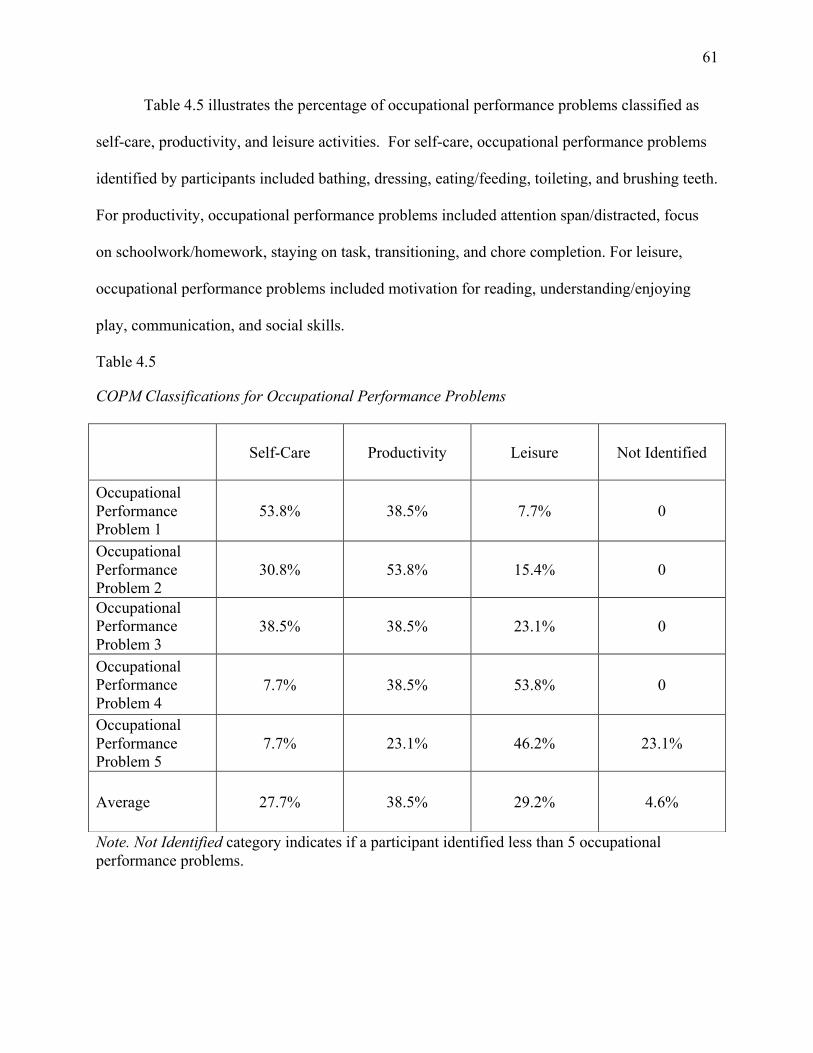
61
Table 4.5 illustrates the percentage of occupational performance problems classified as
self-care, productivity, and leisure activities. For self-care, occupational performance problems
identified by participants included bathing, dressing, eating/feeding, toileting, and brushing teeth.
For productivity, occupational performance problems included attention span/distracted, focus
on schoolwork/homework, staying on task, transitioning, and chore completion. For leisure,
occupational performance problems included motivation for reading, understanding/enjoying
play, communication, and social skills.
Table 4.5
COPM Classifications for Occupational Performance Problems
Note. Not Identified category indicates if a participant identified less than 5 occupational performance problems.
Self-Care Productivity Leisure Not Identified
Occupational Performance Problem 1
53.8% 38.5% 7.7% 0
Occupational Performance Problem 2
30.8% 53.8% 15.4% 0
Occupational Performance Problem 3
38.5% 38.5% 23.1% 0
Occupational Performance Problem 4
7.7% 38.5% 53.8% 0
Occupational Performance Problem 5
7.7% 23.1% 46.2% 23.1%
Average 27.7% 38.5% 29.2% 4.6%

62
EASe App. An EASe Intensity Quotient (IQ) was calculated from the EASe IQ formula,
which includes data from the e-mail reports for each EASe app session. Data included in the
EASe IQ formula is song, album, elapsed time, global volume, burst length, gap length, high
shelf frequency, high shelf gain, attack, mute left, and mute right (W. Mueller, personal
communication, October 17, 2012). The EASe IQ represents the overall intensity of each EASe
app session. An EASe IQ was generated from each EASe app session, and a mean and standard
deviation was calculated from each session’s EASe IQ. Table 4.6 displays the EASe IQ means
and standard deviations derived from week one to week four data. Overall, the mean EASe IQ
increased by 12.88 points as shown by a comparison of session one in week 1 (46.478) and
session 56 in week 4 (59.359).

63
Table 4.6
Group Means and Standard Deviations of EASe IQ
Note. SD= Standard Deviation. SD rounded to hundredth decimal place. Mean rounded to thousandth decimal place.
Week 1 Week 2 Week 3 Week 4
Session Mean (SD) Session Mean (SD) Session Mean (SD) Session Mean (SD)
1 46.478(5.05) 15 50.254(4.4) 29 51.773(5.78) 43 57.979(3.94)
2 46.461(3.4) 16 50.035(4.5) 30 54.258(3.98) 44 58.227(4.29)
3 46.558(2.98) 17 51.911(3.83) 31 53.550(3.62) 45 59.118(2.08)
4 46.842(2.63) 18 51.322(3.92) 32 53.755(3.84) 46 57.150(3.85)
5 47.183(2.95) 19 50.782(5.3) 33 53.850(2.69) 47 57.829(3.14)
6 47.020(3.71) 20 49.144(5.12) 34 55.153(3.89) 48 60.065(2.27)
7 48.226(4.18) 21 51.699(3.9) 35 55.394(3.21) 49 59.463(3.06)
8 48.358(4.22) 22 51.009(5.49) 36 54.416(5.05) 50 57.440(5.3)
9 48.495(4.96) 23 52.737(2.52) 37 54.925(4.22) 51 58.115(5.31)
10 49.342(4.83) 24 50.269(4.15) 38 55.596(4.21) 52 56.707(5.58)
11 48.493(3.66) 25 51.372(4.13) 39 56.783(4.31) 53 59.927(2.12)
12 48.295(2.74) 26 50.961(3.97) 40 56.669(2.48) 54 58.204(4.16
13 46.724(2.58) 27 51.560(3.35) 41 55.918(2.68) 55 60.783(3.39)
14 50.185(3.96) 28 50.719(3.09) 42 57.344(2.93) 56 59.359(3.92)

64
During the 28-day EASe app study, the study protocol required that the participants listen
to the EASe app for two sessions per day for no more than 30 minutes (1800 seconds) per
session. Table 4.7 displays the overall mean minimum and mean maximum listening time of the
EASe app sessions, as well as the mean minimum and means maximum EASe IQ.
Table 4.7
Minimum and Maximum EASe App Session Time and EASe Intensity Quotient (IQ)
Time in Seconds EASe IQ
Mean Minimum 1407.08 46.46084
Mean Maximum 1817.44 60.78252
Note. 1800 seconds=30 minutes

65
The EASe app incorporates transitions through presets one, two, three, and four. The
music in each preset gradually increases in intensity. During the 28-day EASe app study,
researchers recommended that participants transition to the next consecutive preset every seven
days, equaling 14 sessions at one preset per week. Table 4.8 displays the percentage of
participants at each preset during week one, which includes sessions one to 14. Approximately
77% of the participants were listening to preset one during week one.
Table 4.8
Frequencies (n) and Percentages of EASe App Preset at Week 1
Preset 1 Preset 2 Preset3 Preset 4 Missing n % n % n % n % n % Session 1 12 92.3 0 0 1 7.7 0 0 0 0
Session 2 12 92.3 0 0 0 0 0 0 1 7.7
Session 3 9 69.2 0 0 0 0 0 0 4 30.8
Session 4 11 84.6 0 0 0 0 0 0 2 15.4
Session 5 11 84.6 0 0 0 0 0 0 2 15.4
Session 6 11 84.6 1 7.7 0 0 0 0 1 7.7
Session 7 11 84.6 0 0 1 7.7 0 0 1 7.7
Session 8 11 84.6 1 7.7 1 7.7 0 0 0 0
Session 9 8 61.5 1 7.7 1 7.7 0 0 3 23.1
Session 10 9 69.2 0 0 1 7.7 1 7.7 2 15.4
Session 11 10 76.9 0 0 0 0 0 0 3 23.1
Session 12 9 69.2 0 0 0 0 0 0 4 30.8
Session 13 9 69.2 0 0 0 0 0 0 4 30.8
Session 14 8 61.5 2 15.4 0 0 0 0 3 23.1
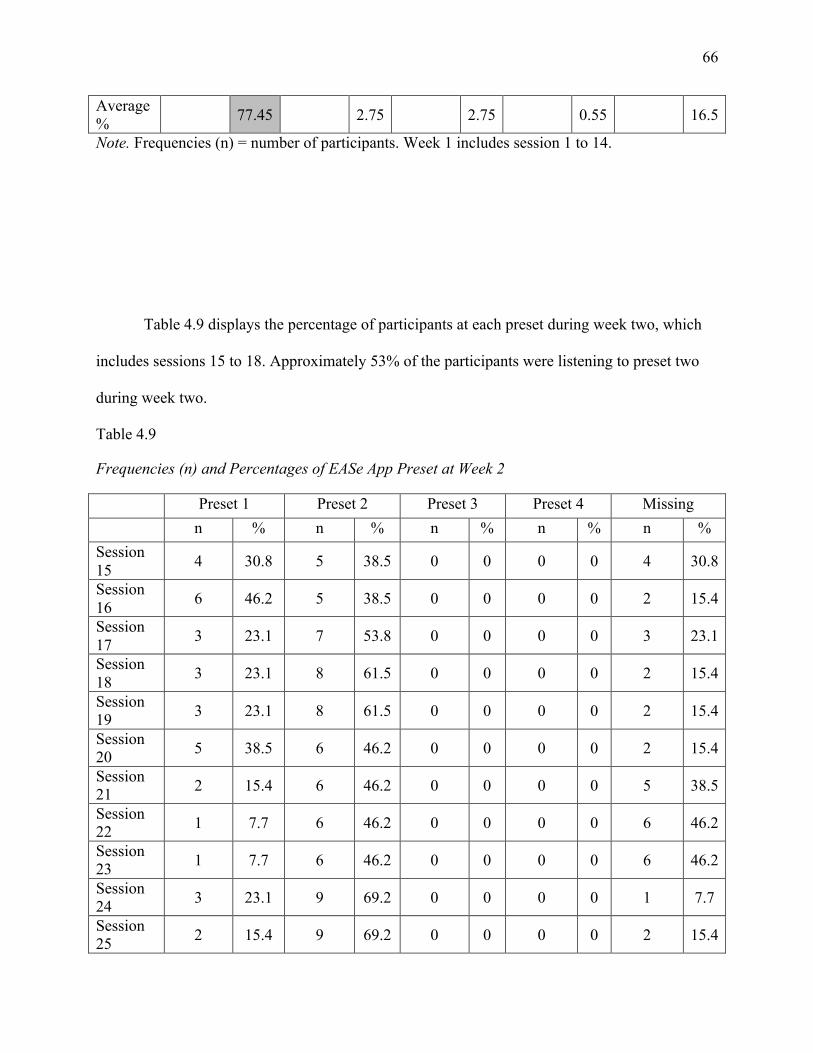
66
Average % 77.45 2.75 2.75 0.55 16.5
Note. Frequencies (n) = number of participants. Week 1 includes session 1 to 14.
Table 4.9 displays the percentage of participants at each preset during week two, which
includes sessions 15 to 18. Approximately 53% of the participants were listening to preset two
during week two.
Table 4.9
Frequencies (n) and Percentages of EASe App Preset at Week 2
Preset 1 Preset 2 Preset 3 Preset 4 Missing n % n % n % n % n % Session 15 4 30.8 5 38.5 0 0 0 0 4 30.8
Session 16 6 46.2 5 38.5 0 0 0 0 2 15.4
Session 17 3 23.1 7 53.8 0 0 0 0 3 23.1
Session 18 3 23.1 8 61.5 0 0 0 0 2 15.4
Session 19 3 23.1 8 61.5 0 0 0 0 2 15.4
Session 20 5 38.5 6 46.2 0 0 0 0 2 15.4
Session 21 2 15.4 6 46.2 0 0 0 0 5 38.5
Session 22 1 7.7 6 46.2 0 0 0 0 6 46.2
Session 23 1 7.7 6 46.2 0 0 0 0 6 46.2
Session 24 3 23.1 9 69.2 0 0 0 0 1 7.7
Session 25 2 15.4 9 69.2 0 0 0 0 2 15.4
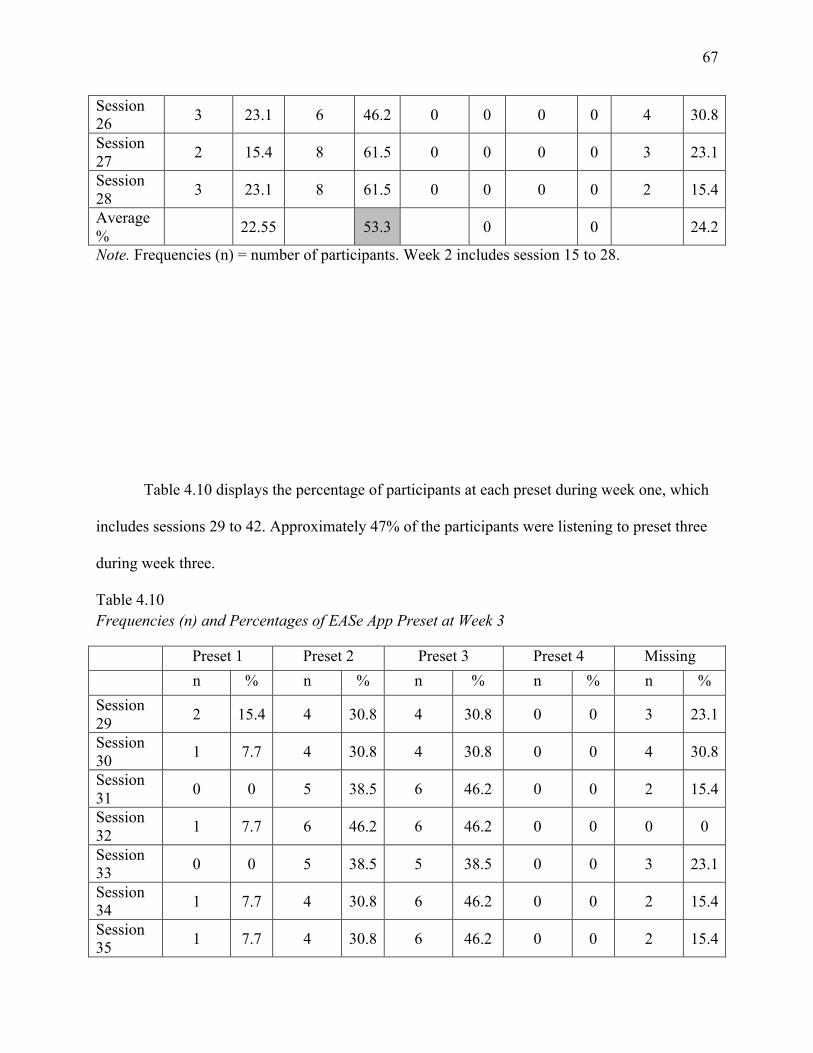
67
Session 26 3 23.1 6 46.2 0 0 0 0 4 30.8
Session 27 2 15.4 8 61.5 0 0 0 0 3 23.1
Session 28 3 23.1 8 61.5 0 0 0 0 2 15.4
Average % 22.55 53.3 0 0 24.2
Note. Frequencies (n) = number of participants. Week 2 includes session 15 to 28.
Table 4.10 displays the percentage of participants at each preset during week one, which
includes sessions 29 to 42. Approximately 47% of the participants were listening to preset three
during week three.
Table 4.10 Frequencies (n) and Percentages of EASe App Preset at Week 3
Preset 1 Preset 2 Preset 3 Preset 4 Missing n % n % n % n % n % Session 29 2 15.4 4 30.8 4 30.8 0 0 3 23.1
Session 30 1 7.7 4 30.8 4 30.8 0 0 4 30.8
Session 31 0 0 5 38.5 6 46.2 0 0 2 15.4
Session 32 1 7.7 6 46.2 6 46.2 0 0 0 0
Session 33 0 0 5 38.5 5 38.5 0 0 3 23.1
Session 34 1 7.7 4 30.8 6 46.2 0 0 2 15.4
Session 35 1 7.7 4 30.8 6 46.2 0 0 2 15.4
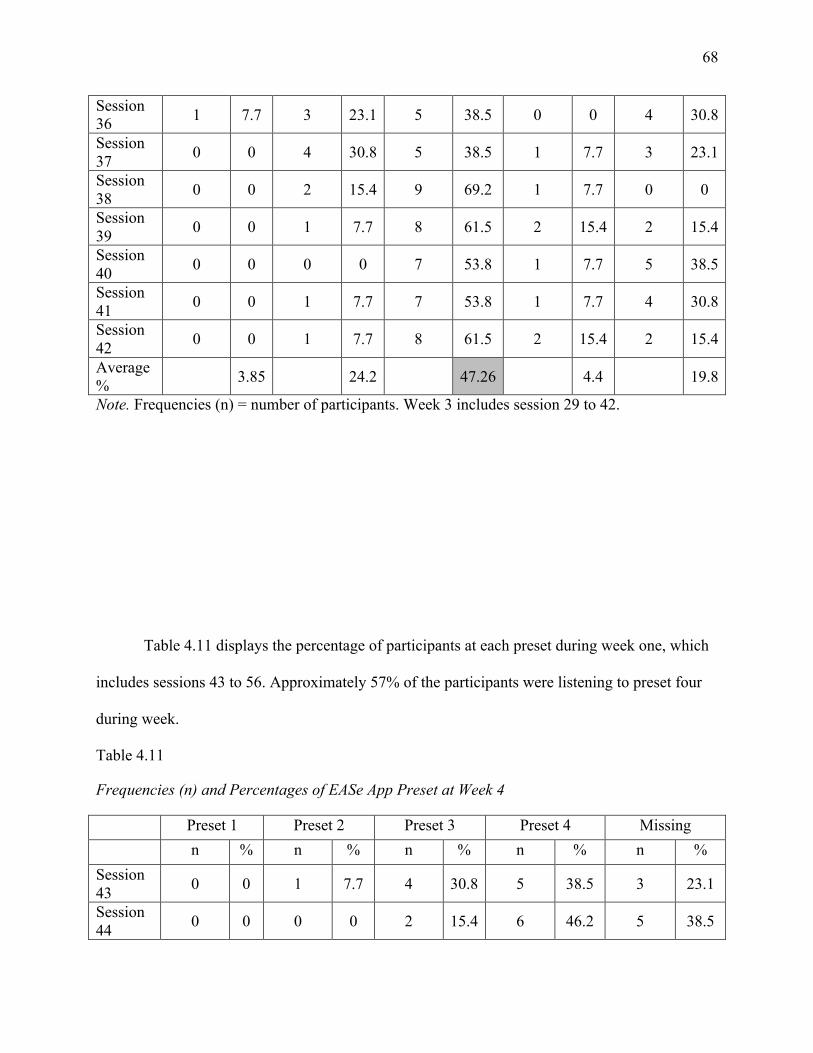
68
Session 36 1 7.7 3 23.1 5 38.5 0 0 4 30.8
Session 37 0 0 4 30.8 5 38.5 1 7.7 3 23.1
Session 38 0 0 2 15.4 9 69.2 1 7.7 0 0
Session 39 0 0 1 7.7 8 61.5 2 15.4 2 15.4
Session 40 0 0 0 0 7 53.8 1 7.7 5 38.5
Session 41 0 0 1 7.7 7 53.8 1 7.7 4 30.8
Session 42 0 0 1 7.7 8 61.5 2 15.4 2 15.4
Average % 3.85 24.2 47.26 4.4 19.8
Note. Frequencies (n) = number of participants. Week 3 includes session 29 to 42.
Table 4.11 displays the percentage of participants at each preset during week one, which
includes sessions 43 to 56. Approximately 57% of the participants were listening to preset four
during week.
Table 4.11
Frequencies (n) and Percentages of EASe App Preset at Week 4
Preset 1 Preset 2 Preset 3 Preset 4 Missing n % n % n % n % n % Session 43 0 0 1 7.7 4 30.8 5 38.5 3 23.1
Session 44 0 0 0 0 2 15.4 6 46.2 5 38.5
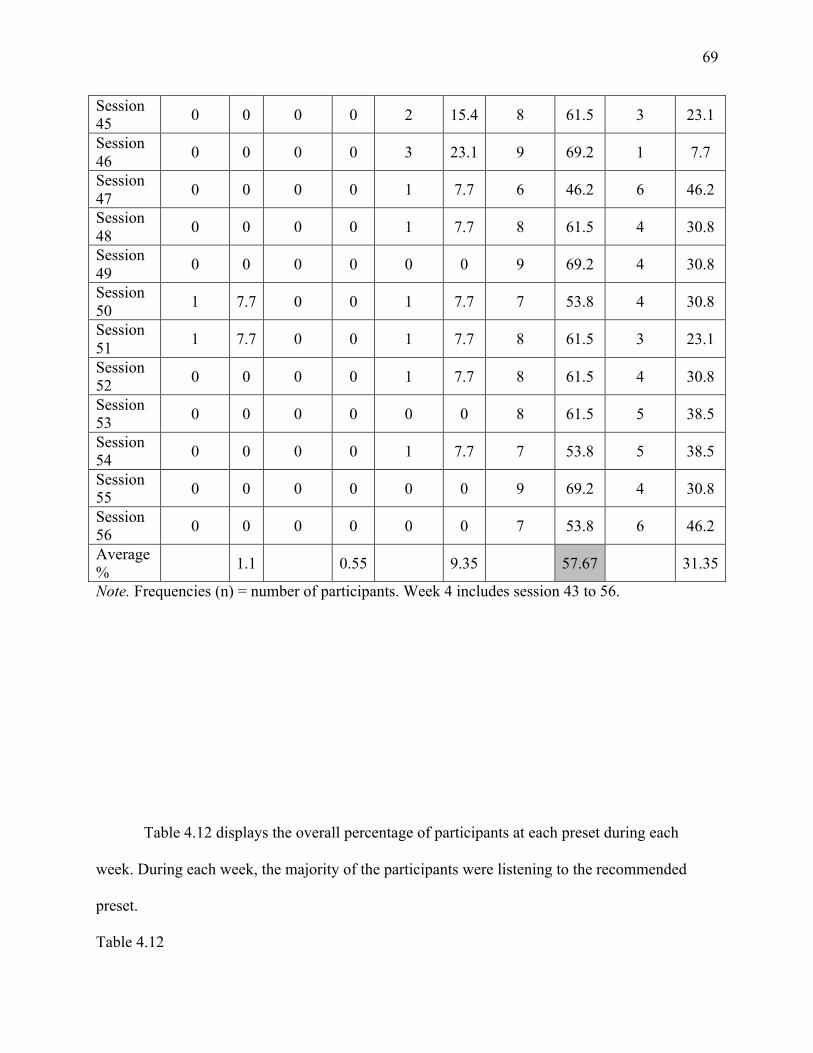
69
Session 45 0 0 0 0 2 15.4 8 61.5 3 23.1
Session 46 0 0 0 0 3 23.1 9 69.2 1 7.7
Session 47 0 0 0 0 1 7.7 6 46.2 6 46.2
Session 48 0 0 0 0 1 7.7 8 61.5 4 30.8
Session 49 0 0 0 0 0 0 9 69.2 4 30.8
Session 50 1 7.7 0 0 1 7.7 7 53.8 4 30.8
Session 51 1 7.7 0 0 1 7.7 8 61.5 3 23.1
Session 52 0 0 0 0 1 7.7 8 61.5 4 30.8
Session 53 0 0 0 0 0 0 8 61.5 5 38.5
Session 54 0 0 0 0 1 7.7 7 53.8 5 38.5
Session 55 0 0 0 0 0 0 9 69.2 4 30.8
Session 56 0 0 0 0 0 0 7 53.8 6 46.2
Average % 1.1 0.55 9.35 57.67 31.35
Note. Frequencies (n) = number of participants. Week 4 includes session 43 to 56.
Table 4.12 displays the overall percentage of participants at each preset during each
week. During each week, the majority of the participants were listening to the recommended
preset.
Table 4.12
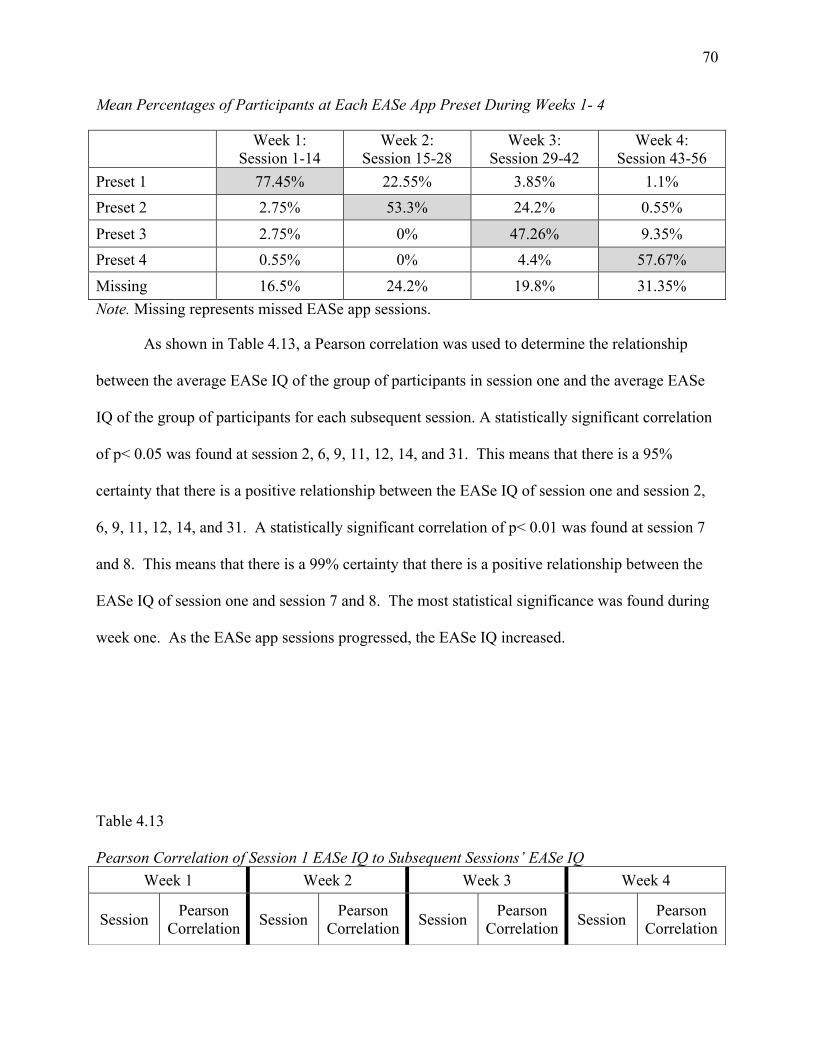
70
Mean Percentages of Participants at Each EASe App Preset During Weeks 1- 4
Week 1: Session 1-14
Week 2: Session 15-28
Week 3: Session 29-42
Week 4: Session 43-56
Preset 1 77.45% 22.55% 3.85% 1.1% Preset 2 2.75% 53.3% 24.2% 0.55%
Preset 3 2.75% 0% 47.26% 9.35% Preset 4 0.55% 0% 4.4% 57.67% Missing 16.5% 24.2% 19.8% 31.35% Note. Missing represents missed EASe app sessions.
As shown in Table 4.13, a Pearson correlation was used to determine the relationship
between the average EASe IQ of the group of participants in session one and the average EASe
IQ of the group of participants for each subsequent session. A statistically significant correlation
of p< 0.05 was found at session 2, 6, 9, 11, 12, 14, and 31. This means that there is a 95%
certainty that there is a positive relationship between the EASe IQ of session one and session 2,
6, 9, 11, 12, 14, and 31. A statistically significant correlation of p< 0.01 was found at session 7
and 8. This means that there is a 99% certainty that there is a positive relationship between the
EASe IQ of session one and session 7 and 8. The most statistical significance was found during
week one. As the EASe app sessions progressed, the EASe IQ increased.
Table 4.13
Pearson Correlation of Session 1 EASe IQ to Subsequent Sessions’ EASe IQ Week 1 Week 2 Week 3 Week 4
Session Pearson Correlation Session Pearson
Correlation Session Pearson Correlation Session Pearson
Correlation
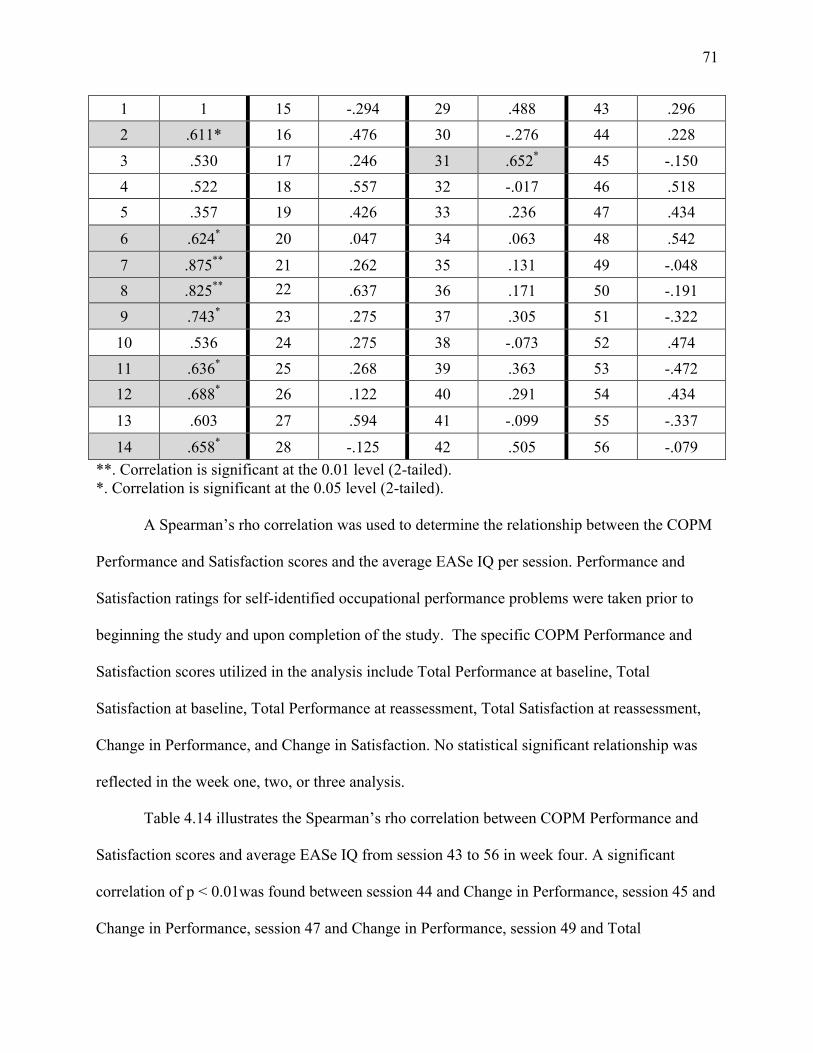
71
**. Correlation is significant at the 0.01 level (2-tailed). *. Correlation is significant at the 0.05 level (2-tailed).
A Spearman’s rho correlation was used to determine the relationship between the COPM
Performance and Satisfaction scores and the average EASe IQ per session. Performance and
Satisfaction ratings for self-identified occupational performance problems were taken prior to
beginning the study and upon completion of the study. The specific COPM Performance and
Satisfaction scores utilized in the analysis include Total Performance at baseline, Total
Satisfaction at baseline, Total Performance at reassessment, Total Satisfaction at reassessment,
Change in Performance, and Change in Satisfaction. No statistical significant relationship was
reflected in the week one, two, or three analysis.
Table 4.14 illustrates the Spearman’s rho correlation between COPM Performance and
Satisfaction scores and average EASe IQ from session 43 to 56 in week four. A significant
correlation of p < 0.01was found between session 44 and Change in Performance, session 45 and
Change in Performance, session 47 and Change in Performance, session 49 and Total
1 1 15 -.294 29 .488 43 .296 2 .611* 16 .476 30 -.276 44 .228 3 .530 17 .246 31 .652* 45 -.150 4 .522 18 .557 32 -.017 46 .518 5 .357 19 .426 33 .236 47 .434
6 .624* 20 .047 34 .063 48 .542
7 .875** 21 .262 35 .131 49 -.048 8 .825** 22 .637 36 .171 50 -.191 9 .743* 23 .275 37 .305 51 -.322 10 .536 24 .275 38 -.073 52 .474 11 .636* 25 .268 39 .363 53 -.472 12 .688* 26 .122 40 .291 54 .434
13 .603 27 .594 41 -.099 55 -.337
14 .658* 28 -.125 42 .505 56 -.079
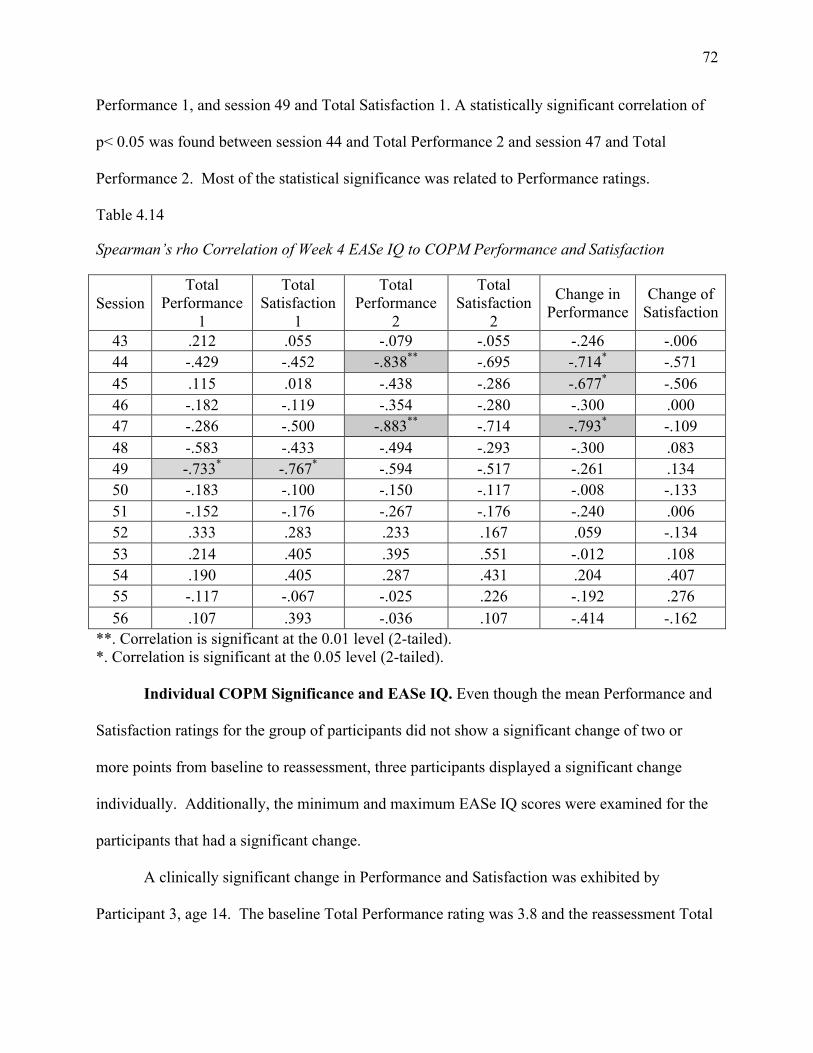
72
Performance 1, and session 49 and Total Satisfaction 1. A statistically significant correlation of
p< 0.05 was found between session 44 and Total Performance 2 and session 47 and Total
Performance 2. Most of the statistical significance was related to Performance ratings.
Table 4.14
Spearman’s rho Correlation of Week 4 EASe IQ to COPM Performance and Satisfaction
Session Total
Performance 1
Total Satisfaction
1
Total Performance
2
Total Satisfaction
2
Change in Performance
Change of Satisfaction
43 .212 .055 -.079 -.055 -.246 -.006 44 -.429 -.452 -.838** -.695 -.714* -.571 45 .115 .018 -.438 -.286 -.677* -.506 46 -.182 -.119 -.354 -.280 -.300 .000 47 -.286 -.500 -.883** -.714 -.793* -.109 48 -.583 -.433 -.494 -.293 -.300 .083 49 -.733* -.767* -.594 -.517 -.261 .134 50 -.183 -.100 -.150 -.117 -.008 -.133 51 -.152 -.176 -.267 -.176 -.240 .006 52 .333 .283 .233 .167 .059 -.134 53 .214 .405 .395 .551 -.012 .108 54 .190 .405 .287 .431 .204 .407 55 -.117 -.067 -.025 .226 -.192 .276 56 .107 .393 -.036 .107 -.414 -.162
**. Correlation is significant at the 0.01 level (2-tailed). *. Correlation is significant at the 0.05 level (2-tailed).
Individual COPM Significance and EASe IQ. Even though the mean Performance and
Satisfaction ratings for the group of participants did not show a significant change of two or
more points from baseline to reassessment, three participants displayed a significant change
individually. Additionally, the minimum and maximum EASe IQ scores were examined for the
participants that had a significant change.
A clinically significant change in Performance and Satisfaction was exhibited by
Participant 3, age 14. The baseline Total Performance rating was 3.8 and the reassessment Total

73
Performance rating was 6.6, reflecting a Change in Performance of 2.8. The baseline Total
Satisfaction rating was 3, and the reassessment Total Satisfaction rating was 8.4, reflecting a
Change in Satisfaction of 5.4. Productivity and Leisure were the areas in which Performance
and Satisfaction enhanced. As the COPM scores increased, the EASe IQ scores reflected an
increase as well. Participant 3’s minimum and maximum EASe IQ scores from the study were
43.26481 and 59.25617.
A clinically significant change in Performance and Satisfaction was exhibited by
Participant 8, age 12. The baseline Total Performance rating was 3.4 and the reassessment Total
Performance rating was 5.8, reflecting a Change in Performance of 2.4. The baseline Total
Satisfaction rating was 3.2, and the reassessment Total Satisfaction rating was 6, reflecting a
Change in Satisfaction of 2.8. Self-Care, Productivity, and Leisure were the areas in which
Performance and Satisfaction enhanced. As the COPM scores increased, the EASe IQ scores
reflected an increase as well. Participant 8’s minimum and maximum EASe IQ scores from the
study were 40.59259 and 68.60556.
A clinically significant change in Performance and Satisfaction was exhibited by
Participant 9, age 15. The baseline Total Performance rating was 4.75 and the reassessment
Total Performance rating was 7.25, reflecting a Change in Performance of 2.5. The baseline
Total Satisfaction rating was 5.25, and the reassessment Total Satisfaction rating was 8.5,
reflecting a Change in Satisfaction of 3.25. Productivity and Leisure were the areas in which
Performance and Satisfaction enhanced. As the COPM scores increased, the EASe IQ scores
reflected an increase as well. Participant 9’s minimum and maximum EASe IQ scores from the
study were 44.99343 and 64.05556.
Qualitative Data Analysis

74
Qualitative data analyzed during this study were gathered from participant and/or legal
guardian report through exit interviews, daily data sheets, and reciprocal communication by
phone, text, or email. Table 4.15 presents an overview of emerging themes with related findings
gleaned from participant and/or legal guardian descriptions. Three themes were identified
through the qualitative analysis process. The first theme is context, which refers to where the
EASe session took place and what activity the participant performed during the EASe session.
The second theme is behavior, which refers to desirable or undesirable actions performed by the
participant during or after the EASe session observed by the legal guardian. Classification of
desirable and undesirable actions was based on legal guardian and/or participant reports. The
third theme is barriers, which refers to unidentified challenges regarding the EASe session.
Table 4.15
Qualitative Themes
Themes Findings

75
1. Context Environment
• Home
• Outdoors
• Clinic
• Automobile
Activity
• Sitting/lying (i.e. in bed, in wheelchair, on couch)
• Watching TV on mute
• Reading
• Working on homework/studying
• Therapy
• Physical activity ( i.e. walking on treadmill, jumping on
trampoline, stretching, standing in stander, swinging)
• Morning routine (i.e. personal grooming, bathing, ironing
clothes, makeup)
• Riding in automobile
• Eating
• Playing a game
2. Behavior
Desirable
• Enjoyment

76
• Happy
• Relaxing
• Improved focus on work
Undesirable
• Hyperactive
• Distracted
• Agitated by music and/or headphones
• Non-compliance (i.e. completing sessions or preset
changes)
3. Barriers Technical Difficulties
• EASe app difficulties
• E-mail difficulties
Scheduling/Time
• Completing two sessions
• Completing 30 minute sessions
• Maintaining minimum 3 hours between each session
The student researchers utilized an exit interview to gain information about the overall
experience using the EASe app from the participants and or parents/guardians. The following
data was collected from the exit interviews completed with all participants.

77
Likes. When asked what they liked about the EASe application, the participants reported
enjoyment of the music, and some thought it was soothing. It was also asked if the training
session was adequate, and all of the participants and guardians stated that it was sufficient.
Finally, the participants were asked about the contact with the researchers during the study, and
the overall reply was that contact was good and they felt supported by the amount of contact they
received. Additionally, they thought that the researchers were available for any questions they
may have had and that they appreciated the reminders regarding the advancement of presets.
Dislikes. When the participants and guardians were asked about the things they did not
like about the EASe application, they reported not liking the technical issues they encountered
with the app, such as the timer not resetting, the e-mails not sending, and not knowing what
preset they were currently using. The participants also did not like that there was not a lot of
music to listen to and wanted more music available. Additionally, it was difficult for them to fit
the two thirty minute sessions into their schedules. Some of the participants and guardians
admitted to not understanding the purpose of the EASe application and they could not see how it
would be beneficial.
Suggestions. When asked for suggestions to improve the application and study,
participants and legal guardians provided feedback related to both the app and the study protocol.
Suggestions related to the app included confirmation on which preset was being currently used
on the app, having a pause feature, having more music, and fixing the e-mail technical
difficulties. Suggestions were also made about the daily use of the app. Participants suggested
that the app either be used for shorter periods of time per session, or limit use to one session per
day. One more suggestion was made related to the daily date sheet; it was suggested that the
78
data sheet be simplified so that the participants and legal guardians would not have to write down
as much daily information.
Changes to Protocol
During the implementation of the study, several aspects of the protocol were modified to
improve the efficiency of the study’s methodology. Several protocol changes were associated
with participant involvement. One aspect of the original protocol that was changed was that the
participants (n=3) whose legal guardians felt were unable to give relevant information due to
their inability to understand or were non-verbal were not required to attend the initial assessment.
Another change in protocol made during the study was that the student researchers increased
contact as needed to provide additional support to the participants and/or legal guardians who did
not participate in ongoing reciprocal communication. Contact was increased on a case-by-case
basis. In addition, in order to enhance the process of attaining more qualitative data in an
operationalized manner, an exit interview was added to the reassessment process and was
administered at the end of the 28 study trial.
Another protocol change involved the operation of the EASe application. Initially,
several participants were experiencing technical issues with the operation of the EASe
application. In an effort to resolve these problems, the developer of the EASe application
recommended that participants avoid using other applications simultaneously while the EASe
music was being delivered on the same device. This recommendation resolved the problems for
most of the participants who had been experiencing difficulties.
Summary of Results
79
The objective of this study was to provide data regarding the utility of the EASe app and
evidence towards its use as an intervention to improve auditory processing and occupational
performance for individuals who are 11 to 22 years old with sensory processing deficits. It was
hypothesized that the use of the EASe application for two 30 minute sessions per day for 28
consecutive days will improve the participants’ habituation to auditory environments and
occupational performance, as measured by the Canadian Occupational Performance Measure
(COPM) and EASe Intensity Quotient (IQ). The dependent variables were habituation to
auditory environments as identified by the EASe intensity quotient (IQ) and occupational
performance as shown by the COPM.
The results showed that the EASe IQ increased overall from session one to session 56.
The Pearson correlation used to determine the relationship between the average EASe IQ of each
session showed that the most statistical significance was found during week one at session 2, 6,
7, 8, 9, 11, 12, and 14. The Spearman’s rho correlation between COPM Performance and
Satisfaction scores and average EASe IQ from each session showed the most statistical
significance during week four in EASe IQ relating to COPM Performance. The overall
qualitative themes found from the exit interviews, daily data sheets, and reciprocal
communication were context, behavior, and barriers related to EASe app use. The researchers’
interpretation of these results will follow in chapter five.
Chapter 5
80
Discussion
The purpose of this research study was to determine if the Electronic Auditory
Stimulation effect (EASe) application (app) improves sensory processing responses through
habituation to auditory environments, thereby improving occupational performance, for
adolescents and adults ages 11 to 22 years with sensory processing deficits. The guiding
research questions were: 1) For adolescents and adults ages 11 to 22 years with sensory
processing deficits, does listening to the Electronic Auditory Stimulation application two times a
day for 30 minutes improve habituation to auditory environments, which in turn may improve
behavioral responses to sensory input? 2) Will the participants’ occupational performance
improve as evidenced by the comparison of their COPM baseline and reassessment scores?
To address the research questions, the researchers assessed the data collected from the
Adolescent/Adult Sensory Profile (AASP), Canadian Occupational Performance Measure
(COPM), Electronic Auditory Stimulation effect Intensity Quotient (EASe IQ), EASe presets,
EASe session time, exit interviews, daily data sheets, and reciprocal communication with
participants and/or legal guardians. The analysis of the data confirmed that the use of the EASe
application for two 30 minute sessions per day for 28 consecutive days did improve the
participants’ habituation to auditory environments and occupational performance, as measured
by the EASe Intensity Quotient (IQ) and the Canadian Occupational Performance Measure
(COPM). This was determined by the overall increase of the COPM scores and EASe IQ per
session throughout the study.
Interpretation of Findings

81
An examination of the EASe app presets revealed that the majority of the participants
were listening to the appropriate preset during each week; however, there were several
participants who did not follow the preset protocol or missed sessions. Multiple participants
missed sessions each week, with the fewest number of missed sessions during week one at
16.5% and the most missed sessions during week four at 31.35%. This increase in missed
sessions could be related to the barriers identified by the participants and/or legal guardians,
which include technical difficulties with the EASe app and email system, as well as scheduling
conflicts related to finding time for the EASe app sessions in an already busy schedule.
The recommended EASe app session time was 30 minutes, equaling 1800 seconds.
Throughout the study, mean session time ranged from 1407.08 seconds to 1817.44 seconds, or
approximately 23 to 30 minutes. The lower EASe app session times may have been attributed to
lower tolerance to the music, scheduling conflicts, and stopping the session because of the
inability to pause the EASe app. The higher EASe app session times represented higher
tolerance of the EASe app. Session time lasting longer than 1800 seconds might have been the
result of the EASe app timer not being set or the participant losing track of time. Each session’s
time and preset was accounted for in the EASe IQ formula calculations, thus providing a true
picture of listening time.
The EASe IQ is used to quantify the intensity of each EASe app session. During the
study, the mean EASe IQ ranged from 46.46084 to 60.78252. A higher EASe IQ means that the
participant demonstrates a greater habituation to auditory stimuli (W. Mueller, personal
communication, October 17, 2012). Overall, the EASe IQ increased from session one to session
56, representing a positive change in the intensity quotient and a greater habituation to auditory
stimuli. The participants’ improved auditory habituation might be representative of the

82
improved organization and integration of the auditory stimuli during the brain’s auditory process
(Ben-Avi, Almagor, & Engel-Yeger, 2012; Smith, Press, Koenig, & Kinnealey, 2005). Though
overall change in EASe IQ was seen from week one to week four for all 13 participants, the
majority of the EASe app sessions with statistically significant EASe IQs were found during
week one as measured by Pearson’s correlation.
Pearson’s correlation was used to determine the relationship between the average EASe
IQ of the group of participants in session one and the average EASe IQ of the group of
participants for each subsequent session. A statistically significant correlation was found at the
p< 0.05 level for EASe app session 2, 6, 9, 11, 12, 14, and 31. Also, a statistically significant
correlation was found at the p< 0.01 level for session 7 and 8. An explanation for the majority of
statistical significance during week one could be due to the participants listening to the
recommended preset and the least amount of missed sessions during week one. This might be
explained due to the recent training of the participants for use of the EASe app, as well as their
eagerness to participate in a new intervention. Another plausible explanation for the statistical
significance during week one could be that the majority of the participants were listening to
preset one, which was the least intense preset, therefore easier to tolerate.
Spearman’s rho was used to assess the association between the dependent variables of
habituation to auditory environment and occupational performance. The dependent variables
were measured by the average EASe IQ per session and the COPM Performance and Satisfaction
scores. A statistically significant correlation was established at the p < 0.01 level between
session 44 EASe IQ and Change in Performance, session 45EASe IQ and Change in
Performance, session 47 EASe IQ and Change in Performance, session 49 EASe IQ and Total
Performance 1, and session 49 EASe IQ and Total Satisfaction 1. A statistically significant

83
correlation was established at the p < 0.05 level between session 44 EASe IQ and Total
Performance 2, and session 47 EASe IQ and Total Performance 2. All of the statistical
significance was found in week four, and the most statistical significance was related to
Performance.
In addition, the overall mean Change in Performance was .8269 and the overall mean
Change in Satisfaction was 1.55. The COPM Change in Performance and Change in Satisfaction
scores reflected a positive change for 11 of the participants, while two participants reported no
change in Performance or Satisfaction from baseline to reassessment. Additionally, a significant
change of two or more points in Change in Performance and Change in Satisfaction was reported
by three participants, representing an overall improvement in occupational performance.
Although the Spearman’s rho correlation reported that the most statistical significance was found
related to Performance, the least amount of change was shown in Change in Performance and the
most change was found in Change in Satisfaction. From communication with the participants’
legal guardians and participants themselves, it was shown that a higher Change in Satisfaction
might be a reflection of even a small positive Change in Performance.
A strength of the COPM is that the clients are able to actively participate in identifying
their self-perception of their occupational performance, as shown by the Performance and
Satisfaction scores (Law et al., 2005). These COPM scores accurately depict the participants’
self-perception of their Performance and Satisfaction with their identified problems because most
of the participants (n=10) acted as respondents along with their legal guardians in the assessment
process.
Occupational performance can be affected by sensory processing deficits. Further
analysis of each Auditory Processing question revealed clustering of responses at either end of
84
the continuum, which can be problematic such that responding “almost never” or “seldom” to
particular sensory input can be just as problematic as responding “frequently” or “almost
always”. Though the results of the Adult/Adolescent Sensory Profile (AASP) revealed that the
overall scores of the participants fell into Similar to Most People for each quadrant, the Auditory
Processing Pattern Grid identified that the majority of the participants had more frequent
responses classified as either “frequently” or “almost always” to the auditory input for questions
50 (n=7), 52 (n=7), 54 (n=11), and 58 (n=7).
Question 50 and 58 are associated with Sensation Seeking, which is related to behaviors
such as creativity, happiness, and the pursuit of sensory stimuli. Question 52 is associated with
Low Registration, which is related to behaviors such as delayed response and missing stimuli.
Question 54 is associated with Sensory Sensitivity, which includes behaviors such as
distractibility and uneasiness with sensory stimuli (Brown & Dunn, 2002). In relation to these
behaviors, the participants’ legal guardians and the participants themselves reported similar
behaviors associated with use of the EASe app during the study. Behaviors identified include
enjoyment, happiness, improved focus on work, agitation to music and/or headphones,
distracted, and hyperactivity.
Though there is a paucity of research regarding the use of the EASe app, this current
study adds to the knowledge about EASe technology overall. A prior EASe study conducted in
2011 by Carroll, Lambert, and Brooks using the EASe games and CDs shows various similarities
and differences when compared to the current study. The prior study included two groups of
participants ages eight to 12 years, which used the EASe Fun House game for 14 days and the
EASe Off Road game for 14 days. One group began using EASe Fun House on day one of the
study, while the other group began using EASe Off Road. After the first 14 days, the groups

85
played the alternate game for an additional 14 days. The 13 participants in this study listened to
the same EASe app music for 28 days. While both studies sought to examine the occupational
performance of each participant as affected by the EASe technology, the study using EASe
games examined visual attention and spatial organization skills whereas this EASe app study
examined habituation to auditory environments. Some similarities that are evident among both
studies include: 28-day study, participants with sensory processing deficits, use of daily logs and
exit interviews, and some reports of increased focus/attention throughout the study (Carroll,
Lambert, & Brooks, 2011).
Implications
The Electronic Auditory Stimulation effect application (EASe app) is an effective
occupational therapy intervention to improve auditory habituation and occupational performance
for adolescents and adults with sensory processing deficits. The EASe app technology is
relatively new as of 2010, and this study provides research that is the first of its kind in relation
to use of the EASe app with the adolescent/adult population. Additionally, empirical data is
provided for this type of auditory intervention for use with individuals with sensory processing
deficits.
The EASe app is a portable auditory intervention that not only can be used in a therapy
clinic, but in various other environments such as the home, school, and other community
settings. The EASe app is an affordable intervention priced at $39.99, as compared to more
costly auditory interventions. Furthermore, the affordability of the EASe app increases the
accessibility of an auditory intervention to adolescents and/or adults with sensory processing
deficits who do not receive therapy services, but still have the need for an intervention. The
increased accessibility of the EASe app is also due to the ability to purchase the app from iTunes

86
and utilize it on an iPad, iPhone, and iPod Touch, which might be more appealing to the
adolescent and adult population. Additionally, this study provides evidence that might be
assistive in gaining insurance coverage for the intervention and technology based on the results
which illustrate an increase in auditory habituation and improved occupational performance
Limitations
Several of the study’s limitations were associated with participant recruitment and
involvement. One limitation was that the small sample size of 13 participants does not represent
the entire adolescent and adult population with sensory processing deficits. Another limitation
was the lack of diversity within the sample, which may be due to recruitment of the majority of
the participants from one clinic, as well as the majority of the participants being Caucasian and
male. Also, the clinics from which the participants were recruited from did not have clients over
the age of 17 that met the inclusion criteria, which affected the age range of 11-22 years that the
researchers established at the beginning of the study.
Two more limitations that were a result of participant involvement were that the
participants became less responsive to contact from the researchers throughout data collection,
and data sheets were not filled out completely when retrieved from the participants upon
completion of the study.
One major limitation affecting the design of the study and the literature review was that
there was limited research regarding interventions with the adolescent and adult populations with
sensory processing deficits, specifically auditory processing deficits. There was also inadequate
information regarding assessments targeting sensory processing abilities used with the
participant population. Additionally, the overall results from the AASP showed that the
participant group was classified as Similar to Most People in each of the four quadrants, which

87
was not representative of the occupational therapists’ referral for the study based on the presence
of sensory processing deficits.
Three more limitations involved the EASe app. The first limitation was that it was a new
app, so there was no research to base the study design on. Next, the additional modules were not
utilized, resulting in less variety in music and data results. The participants and legal guardians
reported a dislike of the lack of music and wanted more music available. Lastly, participants
who did not have the proper Apple product needed for use of the EASe app did not meet
inclusion criteria.
Strengths
A significant strength of the study was that all 13 participants made gains in EASe IQ
throughout the study, which represents improved auditory habituation. The majority of the
participants (n=11) improved their COPM Performance and/or Satisfaction scores from baseline
to reassessment, reflecting a change for the better in occupational performance. Of the 11
participants that demonstrated gains, three participants displayed a significant improvement for
Change in Performance and Change in Satisfaction.
A second strength of the study was that the researchers developed an EASe app protocol.
An initial establishment of the EASe app protocol was created, as prior to this study a protocol
was non-existent. This in turn will serve to guide sensory-based intervention with the EASe app
and the adolescent/adult population.
A scarcity of information was available regarding sensory-based interventions for the
adolescent/adult population. This study provided a strong foundation for future research in the
occupational therapy discipline concerning this population. Furthermore, a new auditory
intervention was piloted and examined for use with the adolescent/adult population.

88
Finally, this study incorporated quantitative data, as well as qualitative data, to provide
insight into the lived experiences of the participants. Utilizing both forms of research provided
rich information, which could not be derived from one type of data. The combination of the
quantitative data with the qualitative data provided a meaningful interpretation representative of
the participants’ experiences throughout the study.
Recommendations for Future Studies
Throughout the study, various recommendations to better future research arose. The
researchers ran into an issue of locating facilities with a robust adolescent/adult population.
Therefore, it is recommended that future studies include facilities with an abundant
adolescent/adult population. Also, the researchers suggest that future studies find participants
that are within proximity to researchers. It was relatively difficult to set up meeting times for the
initial assessments as well as reassessments and exit interviews for most of the participants due
to distance. It was especially challenging to set up appointments for the participants from
another research site located approximately 2 hours travel time, due to lack of flexibility with
scheduling. Also, if problems arose relating to technical issues, researchers were able to meet
with the local participants if needed. This was not the case for the participants from the remote
site; therefore all of the technical issues had to be dealt with over the phone.
The AASP was not sensitive enough to identify the sensory processing deficits of the
participants; therefore it may be advantageous to utilize another tool to assess sensory processing
deficits. Though the AASP Auditory Processing Pattern Grid was useful for identifying patterns
related to auditory processing, further research is warranted for further understanding of how
auditory response patterns can provide more detail on how the individual deals with auditory
input. If future researchers decide to focus on auditory processing, it is recommended that an

89
audiologist assess the participants to identify specific auditory processing deficits. The
researchers originally discussed developing a sample of participants with auditory processing
deficits, but it was difficult to find a measure to assess auditory processing specifically.
The researchers also recommend having a focused training session with the developer of
the EASe app prior to the participants beginning the study. Though all of the researchers
reviewed information about the EASe app and participated in a trial run, it would have beneficial
to have a training session with the developer of the EASe app to gain better understanding of the
protocol and technical aspects as well as have questions answered. Additionally, it is
recommended that researchers pilot the EASe app with a client or another individual to practice
every study protocol.
A recommendation regarding the collection of relevant information about each
participant could be to enhance the demographic form. Though there was an item about previous
participation in listening therapies on the demographic form, many participants failed to report
this information. It is recommended to make sure that this information is gathered on the
demographic form or during the initial interview. Also, the researchers recommend the addition
of an item stating if the participant is verbal or non-verbal, as well as to pre-identify the
respondent for each participant if the potential participant is non-verbal.
The final recommendation is in regard to participants following the study protocol. Many
participants did not follow protocol to change presets from week to week, which was
recommended by the researchers. More participation during week one could be due to the recent
training of the participants for use of the EASe app, as well as their eagerness to participate in a
new intervention. A decrease in participation and compliance with the study protocol as the
study progressed might be explained by scheduling conflicts, technical difficulties, agitation with
90
the music and/or headphones, and presence of undesirable behaviors. For future studies, it is
recommended that the researchers utilize the EASe Pro app to control the preset options to
prevent veering from the protocol. The EASe Pro app enables the researchers to control which
preset the participants are listening to, as well as customize presets as needed.
Conclusion
In summary, given the study’s results occupational therapy clinicians should proactively
explore the feasibility of the use of the Electronic Auditory Stimulation Effect application (EASe
app) as an effective intervention for adolescents and adults with sensory processing deficits. The
aim of this study was for the data to support the hypothesis that the EASe app is an effective
intervention for improving sensory and auditory processing as well as occupational performance
in adolescents and adults with sensory processing deficits.
The analysis of the data confirmed that the use of the EASe application for two 30 minute
sessions per day for 28 consecutive days did improve the participants’ habituation to auditory
environments and occupational performance, as measured by the Canadian Occupational
Performance Measure (COPM) and EASe Intensity Quotient (IQ). This was determined by the
group’s overall increase of the COPM scores and EASe IQ per session throughout the study. The
increase of COPM scores was represented as the Change in Performance of .8269 and Change in
Satisfaction of 1.55. The increase in EASe IQ was represented by the minimum mean EASe IQ
of 46.46084 and maximum mean EASe IQ of 60.78252. Specifically, participants 3, 8, and 9
displayed significant changes of two or more points in Performance and Satisfaction in the areas
of Self-Care, Productivity, and Leisure, as well as an increase in EASe IQ throughout the study.
These gains translate into improvement of daily functioning in the areas identified by the
participants.

91
This evidence serves as a template for future studies examining interventions for sensory
processing and its impact on improved occupational performance. The research gained from this
study bolsters evidence regarding auditory interventions appropriate for adolescents and adults
with sensory processing deficits. A dearth of evidence remains surrounding interventions with
this population, therefore it is incumbent upon future generations of therapists to continue
research to uncover evidence and beneficial interventions for this population.
References

92
Ahn, R., Miller, L., Milberger, S., & McIntosh, D. (2004). Prevalence of parents' perceptions of
sensory processing disorders among kindergarten children. The American Journal Of
Occupational Therapy, 58(3), 287-293. doi:10.5014/ajot.58.3.287
American Occupational Therapy Association. (2004). Definition of occupational therapy practice
for the AOTA Model Practice Act. Retrieved from
http://www.aota.org/Practitioners/Advocacy/State/Resources/PracticeAct/36437.aspx
American Occupational Therapy Association (2008). Occupational therapy practice framework:
Domain & process (2nd ed., pp. 634-673). Bethesda, MD: The American Occupational
Therapy Association, Inc.
American Occupational Therapy Association. (2010a). Standards of practice for occupational
therapy. American Journal of Occupational Therapy, 64, S106-S111. doi:
10.5014/ajot.2010.64S106
American Occupational Therapy Association. (2010b). Providing occupational therapy using
sensory integration theory and methods in school-based practice. American Journal of
Occupational Therapy, 63, 823-842.
American Speech-Language-Hearing Association. (2005). (Central) auditory processing
disorders—the role of the audiologist [Position statement]. Retrieved from
www.asha.org/policy.doi:10.1044/policy.PS2005-00114
American Speech-Language-Hearing Association. (2004). Scope of practice in audiology [Scope
of Practice]. Retrieved from www.asha.org/policy.
Asher, A. V., Purham, L. D., & Knox, S. (2008). Interrater reliability of sensory integration and
praxis tests (SIPT) score interpretation. American Journal of Occupational Therapy,
62(3), 308-319.

93
Asher, I. E. (Ed.). (2007). Occupational therapy assessment tools: An annotated index (3rd ed.).
Bethesda, MD: AOTA Press.
Ayres, A. J. (1979). Sensory Integration and the child. Los Angeles, CA: Western Psychological
Services.
Ben-Avi, N., Almagor, M., & Engel-Yeger, B. (2012). Sensory processing difficulties and
interpersonal relationships in adults: An exploratory study. Psychology 3(1), 70-77. doi:
10.4236/psych.2012.31012
Ben-Sasson, A., Cermak, S. A., Orsmond, G. I., Tager-Flusberg, H., Carter, A. S., Kadlec, M. B.,
& Dunn, W. (2007). Extreme sensory modulation behaviors in toddlers with autism
spectrum disorders. American Journal of Occupational Therapy, 61, 584–592.
doi: 10. 5014/ajot.61.5.584
Ben-Sasson, A., Carter, A.S., & Briggs-Gowan, M.J. (2009). Sensory overresponsivity in
elementary school: Prevalence and social emotional correlates. Journal of Abnormal
Child Psychlogy, 37, 705-716. doi: http://dx.doi.org/10.1007/s10802-008-9295-8
Biel, L. & Peske, N. (2005). Raising a sensory smart child: the definitive handbook for helping
your child with sensory integration issues. New York, NY: Penguin Books.
Bissell, J., Watling, R., Summers, C., Dostal, J., & Bodison, S. (n.d.). Retrieved from
http://www.aota.org/Practitioners-Section/Children-and-Youth/Browse/SI/Fact-
Sheet.aspx?FT=.pdf
Bordens, K. S. & Abbott, B. B. (2011). Research design and methods: A process approach. New
York, NY: McGraw-Hill.
Brown, C. (2009). Functional assessment and intervention in occupational therapy. Psychiatric
Rehabilitation Journal, 32(3), 162–170.
94
Brown, C., & Dunn, W. (2002). Adolescent/Adult Sensory Profile: User’s manual. San Antonio,
TX: Pearson.
Brown, C., Tollefson, N., Dunn, W., Cromwell, R., & Filion, D. (2001). The adult sensory
profile: measuring patterns of sensory processing. American Journal of Occupational
Therapy, 55(1), 75-82.
Brown, N., & Dunn, W. (2010). Relationship between context and sensory processing in children
with autism. American Journal Of Occupational Therapy, 64(3), 474-483.
doi:10.5014/ajot.2010.09077
Brown, T., Morrison, I., & Stagnitti, K. (2010). The convergent validity of two sensory
processing scales used with school-age children: comparing the Sensory Profile and the
Sensory Processing Measure. New Zealand Journal of Occupational Therapy, 57(2), 56-
65.
Carroll, C., Lambert, J., & Brooks, S. (2011). The effect of the Electronic Auditory Stimulation
effect (EASe) program on 8-12 year old children who exhibit sensory processing deficits.
(Unpublished master’s thesis). Brenau University, Gainesville, GA.
Case-Smith, J. & Arbesman, M. (2008). Children and youth: Evidence-based review of
interventions for autism used in or of relevance to occupational therapy. American
Journal of Occupational Therapy, 62, 416-429. doi:10.5014/ajot.62.4.416
Chang, M. C., Parham, L. D., Blanche, E. I., Schell, A. Chou, C. P., Dawson, M., Clark, F.
(2012). Autonomic and behavioral responses of children with autism to auditory stimuli.
American Journal of Occupational Therapy, 66, 567-575. doi: http://dx.
doi.org/10.5014/ajot.2012.004242
95
Chen, Y., Rodger, S., & Polatjko, H. (2002). Experiences with the COPM and client-centered
practice in adult neurorehabilitation in Taiwan. Occupational Therapy International,
9(3), 167-184.
Corbett, B., Shickman, K., & Ferrer, E. (2008). Brief report: the effects of Tomatis sound therapy
on language in children with autism. Journal of Autism and Developmental Disorders,
38(3), 562-566.
Cosbey, J., Johnston, S., & Dunn, M. (2010). Sensory processing disorders and social
participation. The American Journal of Occupational Therapy, 64(3), 462-473.
Cup, E., Scholte op Reimer, W., Thijssen, M., & van Kuyk-Minis, M. (2003). Reliability and
validity of the Canadian Occupational Performance Measure in stroke patients. Clinical
Rehabilitation, 17(4), 402-409.
Dawson, G. & Watling, R. (2000). Interventions to facilitate auditory, visual, and motor
integration in autism: A review of the evidence. Journal of Autism and Developmental
Disorders, 30(5), 415-421.
Dunn, W. (1997). The impact of sensory processing abilities on the daily lives of young children
and families: A conceptual model. Infants and Young Children, 9(4), 23-25.
Dunn, W. (2001). The sensations of everyday life: Empirical, theoretical, and pragmatic
considerations, 2001 Eleanor Clarke Slagle lecture. American Journal of Occupational
Therapy, 55, 608-620.
Dunn, W., Cox, J., Foster, L., Mische-Lawson, L., & Tanquary, J. (2012). Impact of a contextual
intervention on child participation and parent competence among children with autism
spectrum disorders: A pretest–posttest repeated-measures design. American Journal of
Occupational Therapy, 66, 520–528. http://dx.doi.org/10.5014/ajot.2012.004119

96
EASe App for iPhone, iPad, and iPod touch. (n.d.). Retrieved from http://www.vision-
audio.com/EASe-app.html
EASe: Electronic Auditory Stimulation effect. (n.d.). Retrieved from http://www.vision-
audio.com/index.html
EASe games. (n.d.). Retrieved from http://www.vision-audio.com/ease_games.html
Electronic Auditory Stimulation effect. (n.d.). Retrieved from
http://www.audioforge.ca/downloads/User_guide.pdf
Electronic Auditory Stimulation effect – overview. (n.d.). Retrieved from http://www.vision-
audio.com/ease_overview.html
Elksnin, L. K., & Elksnin, N. (1995). Assessment and instruction of social skills (2nd ed.). San
Diego: Singular.
Engel-Yeger, B., & Dunn, W. (2011). The relationship between sensory processing difficulties
and anxiety level of healthy adults. British Journal Of Occupational Therapy, 74(5), 210-
216. doi:10.4276/030802211X13046730116407
Escalona, A., Field, T., Singer-Strunck, R., Cullen C., & Hartshorn, K. (2001). Brief report:
Improvements in the behavior of children with autism following massage therapy.
Journal of Autism and Developmental Disorders, 31, 513–516.
Eyssen, I. C. J. M., Steultjens, M. P. M., Oud, T. A. M., Bolt, E. M., Maasdam, A., Dekker, J.
(2011). Responsiveness of the Canadian Occupational Performance Measure. Journal of
Rehabilitation Research & Development, 48(5), 517-528.
doi:10.1682/JRRD.2010.06.0110

97
Field, T., Lasko, D., Mundy, P., Henteleff, T., Kabat, S., Talpins, S., et al. (1997). Brief Report:
Autistic children’s attentiveness and responsivity improve after touch therapy. Journal of
Autism and Developmental Disorders, 27, 333–338.
Gere, D. R., Capps, S. C., Mitchell, D. W., & Grubbs, E. (2009). Sensory sensitivities of gifted
children. American Journal of Occupational Therapy, 64, 288–295.
Hall, L., & Case-Smith, J. (2007). The effect of sound-based intervention on children with
sensory processing disorders and visual–motor delays. American Journal of Occupational
Therapy, 61, 209–215.
Herer, G. R., Knightly, C.A., & Steinberg, A.G. (2007). Hearing. In M. L. Batshaw, L.
Pellegrino, & N. J. Roizen (Eds.), Children with disabilities (6th ed., pp. 157-183).
Baltimore, MD: Paul H. Brookes Publishing.
Kandel, E., Schwartz, J., & Jessell, T. (2000). Principles of neural science. New York: McGraw-
Hill.
Kielhofner, G. (2009). The sensory integration model. (2009). In The conceptual foundations of
occupational therapy practice (4thed., pp. 203-227). Philadelphia, PA : F.A.
Davis Company.
King, L. J. (1978). Toward a science of adaptive responses. American Journal of Occupational
Therapy, 32, 429–437.
Kinnealey, M., & Fuiek, M. (1999). The relationship between sensory defensiveness, anxiety,
depression and perception of pain in adults. Occupational Therapy International, 6(3),
195-206.
Kinnealey, M., Oliver, B., & Wilbarger, P. (1995). A phenomenological study of sensory
defensiveness in adults. American Journal of Occupational Therapy, 49(5), 444-451.

98
Koomar, J., & Bundy, A. (2002). Creating direct intervention from theory. In Sensory
integration: Theory and practice (pp. 261-308). Philadelphia, F.A. Davis.
Knecht-Sabres, L. (2011). The Canadian Occupational Performance Measure: An outcome
measure. Communique, 2011(4), 4-11.
Lane, S. J., Miller, L. J., & Hanft, B. E. (2000, June). Toward a consensus in terminology in
sensory integration theory and practice: Part 2: Sensory integration patterns of function
and dysfunction. Sensory Integration Special Interest Section Quarterly, 23, 1–3.
Lane, S. J., Reynolds, S., & Dumenci, L. (2012). Sensory Overresponsivity and Anxiety in
Typically Developing Children and Children With Autism and Attention Deficit
Hyperactivity Disorder: Cause or Coexistence?. American Journal Of Occupational
Therapy, 66(5), 595-603. doi:http://dx.doi.org/10.5014/ajot.2012.004523
Lane, S., & Schaaf, R. (2010). Examining the neuroscience evidence for sensory-driven
neuroplasticity: Implications for sensory-based occupational therapy for children and
adolescents. American Journal of Occupational Therapy, 64(3), 375–390.
doi:10.5014/ajot.2010.09069
Law, M., Baptiste, S., Carswell, A., McColl, M. A., Polatajko, H., & Pollock, N. (2005).
Canadian Occupational Performance Measure (4th ed.). Ottawa, ON: CAOT
Publications ACE.
May-Benson, T. (2009). Occupational therapy for adults with sensory processing disorder. OT
Practice, 14(10), 15–19.
May-Benson, T. & Champagne, T. (2011). Occupational therapy using a sensory integration–
based approach with adult populations. Retrieved from
99
http://www.aota.org/Consumers/Professionals/WhatIsOT/HW/Facts/Sensory-Approach-
Adults.aspx?FT=.pdf
May-Benson, T. & Kinnealey, M. (2012). An approach to assessment of and intervention for
adults with sensory processing disorders. OT Practice, 17(17), 17-23.
Miller, L.J., Anzalone, M.E., Lane, S.J., Cermak, S.A., & Osten, E.T. (2007). Concept evolution
in sensory integration: A proposed nosology for diagnosis. American Journal of
Occupational Therapy, 61,135-140. doi: 10.5014/ajot.61.2.135
Miller, L. J., Coll, J. R., & Schoen, S. A. (2007). A randomized controlled pilot study of the
effectiveness of occupational therapy for children with sensory modulation disorder.
American Journal of Occupational Therapy, 61, 228–238. doi: 10.5014/ajot.61.2.228.
Miller, L. J., Schoen, S. A., James, K., & Schaaf, R. C. (2007). Lessons learned: A pilot study on
occupational therapy effectiveness for children with sensory modulation disorder.
American Journal of Occupational Therapy, 61, 161–169. doi: 10.5014/ajot.61.2.161.
Mudford, O. C., Cross, B. A., Breen, S., & Cullen, C. (2000). Auditory integration training for
children with autism: No behavioral benefits detected. American Journal of Mental
Retardation, 105, 118–129.
Neistadt, M. E. (1990). A Critical Analysis of Occupational Therapy Approaches for Perceptual
Deficits in Adults With Brain Injury. The American Journal of Occupational Therapy,
44(4), 299–304. doi:10.5014/ajot.44.4.299
Neysmith-Roy, J. M. (2001). The Tomatis method with severely autistic boys: individual case
studies of behavioral change. South African Journal of Psychology, 31(1), 19-28.
Nwora, A. J., & Gee, B. M. (2009). A case study of a five-year-old child with pervasive
developmental disorder. Occupational Therapy International, 16, 25–43.

100
Pan, A., Chung, L., & Hsin-Hwei, G. (2003). Reliability and validity of the Canadian
Occupational Performance Measure for clients with psychiatric disorders in
Taiwan. Occupational Therapy International, 10(4), 269-277.
Parham, L. D., Cohn, E. S., Spitzer, S., Koomar, J. A., Miller, L. J., Burke, J. P., Brett-Green, B.,
et al. (2007). Fidelity in sensory integration intervention research. The American Journal
of Occupational Therapy, 61(2), 216–227. doi:10.5014/ajot.61.2.216
Parham, L. D., & Mailloux, Z. (2010). Sensory integration. In J. Case-Smith, & J. O’Brien
(Eds.), Occupational therapy for children (6th ed., pp. 325-372). St Louis, MO: Mosby.
Pfeiffer, B. & Kinnealey, M. (2003). Treatment of sensory defensiveness in adults. Occupational
Therapy International, 10(3), 175-184.
Polatajko, H. J. & Cantin, N. (2010). Exploring the effectiveness of occupational therapy
interventions, other than the sensory integration approach, with children and adolescents
experiencing difficulty processing and integrating sensory information. American Journal
of Occupational Therapy, 64(3), 415-429. doi: 10.5014/ajot.2010.09072
Pollock, N. (1993). Client-centered assessment. American Journal of Occupational Therapy,
47(4), 298-301.
Portney, L.G. & Watkins, M.P. (2009). Foundations of clinical research: Applications to
practice (3rd ed.). Upper Saddle River, New Jersey: Pearson Prentice Hall.
Rogers S. J., & Ozonoff, S. (2005). Annotation: What do we know about sensory dysfunction in
autism? A critical review of the empirical evidence. Journal of Child Psychology and
Psychiatry and Allied Disciplines 46:1255–1268. doi:10.1111/j.1469-7610.2005.01431.x

101
Roley, S. & Jacobs, S., (2009). Sensory integration. In E. B. Crepau, & B. A. B. Schell (Eds.),
Williard and Spackman's Occupational Therapy (11th ed., pp. 792-817). Philadelphia:
Lippincott Williams & Wilkins.
Russell, E., & Nagaishi, P. (2010). Service for children with visual or hearing impairments. In J.
Case-Smith, & J. O’Brien (Eds.), Occupational therapy for children (6th ed., pp. 744-
784). St Louis, MO: Mosby.
Sewell, L., & Singh, S.J. (2001). The Canadian Occupational Performance Measure: Is it reliable
measure in clients with chronic obstructive pulmonary disease? British Journal of
Occupational Therapy, 64, 305-310.
Sinha, Y., Silove, N., Hayen, A., & Williams, K. (1996). Auditory integration training and other
sound therapies for autism spectrum disorders (ASD). Cochrane Database of Systematic
Reviews. John Wiley & Sons, Ltd. Retrieved from http://onlinelibrary.wiley.com.medlib-
proxy.mercer.edu/doi/10.1002/14651858.CD003681.pub3/abstract
Smith, S. A., Press, B., Koenig, K. P., & Kinnealey, M. (2005). Effects of sensory integration on
self-stimulation and self-injurious behaviors. American Journal of Occupational Therapy,
59, 418-425.
Stallings-Sahler, S. (1990). Certification in administration and interpretation of the Sensory
Integration and Praxis Tests. The American Journal of Occupational Therapy, 44(7),
655–657. doi:10.5014/ajot.44.7.655
Thompson, B. M., & Andrews, S. R. (2000). An historical commentary on physiological effects
of music: Tomatis, Mozart, and neuropsychology. Integrative Physiological and
Behavioral Science, 35, 174–188.

102
Tomchek, S. D., & Dunn, W. (2007). Sensory processing in children with and without autism: A
comparative study using the Short Sensory Profile. American Journal of Occupational
Therapy, 61, 190–200. doi: 10.5014/ajot.61.2.190
Treatment. (2012). Retrieved from http://www.spdfoundation.net/treatment.html
Watling, R., Bodison, S., Henry, D. A., & Miller-Kuhaneck, H. (2006). Sensory integration: It’s
not just for children. Sensory Integration Special Interest Section Quarterly, 29(4), 1–4.
Wilbarger, P. & Wilbarger, J.L. (1991). Sensory defensiveness in children ages 2–12. Santa
Barbara, CA: Avanti Educational Programs.
Williamson, G. G., & Dorman, W. J. (2002). Promoting social competence. San Antonio, TX:
Therapy SkillBuilders.
World Health Organization. (2001). International classification of functioning, disability and
health. Retrieved from www.who.int/classifications/icf/en/
Vital Links. (n.d.). Retrieved from http://www.vitallinks.net
ZERO TO THREE. (2005). Diagnostic classification of mental health and developmental
disorders of infancy and early childhood: Revised edition (DC: 0-3R). Washington, DC:
ZERO TO THREE Press.
103
APPENDIX A LETTER OF AUTHORIZATION:
ALL ABOUT KIDS THERAPY SERVICES, INC.
Letter of Authorization
I authorize the graduate students of Brenau University; School of Occupational Therapy, Day
Program: Hope Harris, Sherry Miller, Sadie Ricketts, and Olivia Stieren to conduct research
under the direction of M. Irma Alvarado, PhD, OTR for their thesis titled The effects of the
Electronic Auditory Stimulation effect (EASe) application in adolescents/adults ages 11 years to
22 years with sensory processing deficits with clients receiving services from All About Kids
Therapy Services, Inc.
The graduate students will follow all Brenau University Institutional Review Board (IRB)
guidelines approving their research procedures for the time predetermined in their IRB.
Additionally, the students will adhere to all the All About Kids Therapy Services, Inc. policies
and procedures regarding client services.
Aimee Eblen 545 Old Norcross Rd, Suite 100 Lawrenceville, Georgia 30046 678-377-2833 phone| 678-377-2882 fax allaboutkidstherapyservices.com

104
APPENDIX B LETTER OF AUTHORIZATION: SAI REHAB INC.

105
APPENDIX C LETTER OF AUTHORIZATION: ETS, INC.
Letter of Authorization
I authorize the graduate students of Brenau University; School of Occupational Therapy, Day
Program: Hope Harris, Sherry Miller, Sadie Ricketts, and Olivia Stieren to conduct research
under the direction of M. Irma Alvarado, PhD, OTR for their thesis titled The effects of the
Electronic Auditory Stimulation effect (EASe) application in adolescents/adults ages 11 years to
22 years with sensory processing deficits with clients receiving services from Essential Therapy
Services.
The graduate students will follow all Brenau University Institutional Review Board (IRB)
guidelines approving their research procedures for the time predetermined in their IRB.
Additionally, the students will adhere to all Essential Therapy Services policies and procedures
regarding client services.
M. Irma Alvarado, PhD, OTR/L
Co-Owner, Essential Therapy Services, Inc. 4640 Martin Road, Ste. 300 Cumming, GA. 30041 678 679 1261 [email protected]

106
APPENDIX D RECRUITMENT FLIER
Participants Needed Brenau University Occupational Therapy students are developing a study utilizing the Electronic Auditory Stimulation effect (EASe) application in relation to
sensory processing.
We need CHILDREN ranging in ages of 5 years to 10 years, 11 months
CONTACT: McKenzie McQuaig ([email protected])
and/or ADOLESCENTS & ADULTS 11 years to 22 years CONTACT: Sadie Ricketts ([email protected]).
Each participant will need daily access to an iPad, iPod
touch, and/or iPhone to participate in the study.
Participation will begin January 2013. Details to be provided
at a later date.
If you are willing to participate in the study or have any questions, please let your primary OCCUPATIONAL
THERAPIST and/or the above CONTACTS know.
Thank you!

107
APPENDIX E INSTITUTIONAL REVIEW BOARD LETTER OF APPROVAL
Brenau University
Institutional Review Board 500 Washington Street SE
Gainesville, GA 30501 678-707-5029 Office 770-538-4666 Fax
October 26, 2012 RE: The effects of Electronic Auditory stimulation Effect (EASe) application for adolescents and adults 11 to 22 years with sensory processing deficits. Dear Irma Alvarado, The IRB has reviewed your proposal and has made the following decision:
Approval with stipulations. • Please make the following changes and then send one copy of the revisesd
paperwork to the IRB office for our files. Email to [email protected] is acceptable. You may proceed with your research.
o Please be sure to admit ALL letters of authorization o Editorial note: The recruitment flyer that is hsared with McQuaig’s
states that McQuaig’s research is looking for 3-10 year olds, but McQuaig’s states “5-10 year olds”. Please make these corrections for consistency.
o Please re-write the consent letter(s) so that it is at an 8th grade reafing level
Please feel free to contact me (or have your advisor contact me) if you have questions or concerns. Our best wishes as you proceed with your research project. Sincerely,
Dr. Irma Alvarado Chair, Institutional Review Board Brenau University Institutional Review Board office: [email protected], 678-707-5029 Office of Dean, College of Health & Science
CC: Student’s Advisor: Irma Alvarado, Occupational Therapy

108
APPENDIX F PARTICIPANT INFORMED CONSENT FORM
Identification Number ________________ (for therapist/researcher use only)
The effects of Electronic Auditory Stimulation Effect (EASe) application for adolescents
and adults ages 11 to 22 years with sensory processing deficits. Participant name: __________________________________________ This consent form may be completed and signed by the participant if they are an adult who is legally able to consent. If the participant is a minor and/or is not legally able to consent, a legal guardian should complete and sign the consent form. All participants are asked to provide a signature of agreement. I understand that I have been asked to participate in a research study involving the use of the EASe application that is being conducted under the direction of M. Irma Alvarado, PhD OTR/L, Principal Investigator and Brenau University Occupational Therapy Graduate students Hope Harris, OTS; Sherry Miller, OTS; Sadie Ricketts, OTS; and Olivia Stieren, OTS at any of the following clinics: Sai Rehab, Essential Therapy Services, and All About Kids Therapy Services. PURPOSE The purpose of this study is to determine the effect of the EASe application with male and female adolescents and adults ages 11 to 22 years who have sensory processing problems including auditory processing deficits to improve their ability to adjust to sound in their environment. PROCEDURE I understand that I will be participating in a study that will include an initial screening, along with one pre- and one post intervention assessment. Also, I understand that I will be asked to provide personal information including name, age, sex, medical history, and other information to aid the researchers in their data analysis The intervention is use of the EASe application for the iPad, iPhone, and iPod Touch for a total 56 sessions across a 28 day period with two sessions per day. Each session will last 30 minutes. I understand that my legal guardian(s) and/or I will receive training in the use of the EASe application and study procedure in order to use it at home. I understand that I must email data from the EASe application upon completion of each session to my assigned researcher. I understand that a data sheet will be used to keep track of information from each session, including the length of each session and what activity was done during the session. The data sheets will be collected after the 28 day study. I understand that a student researcher will check-in on me every Monday, Wednesday, and Friday by either phone call, text, email, or in person. I understand that I will use the EASe application at home or wherever I can listen to the music to
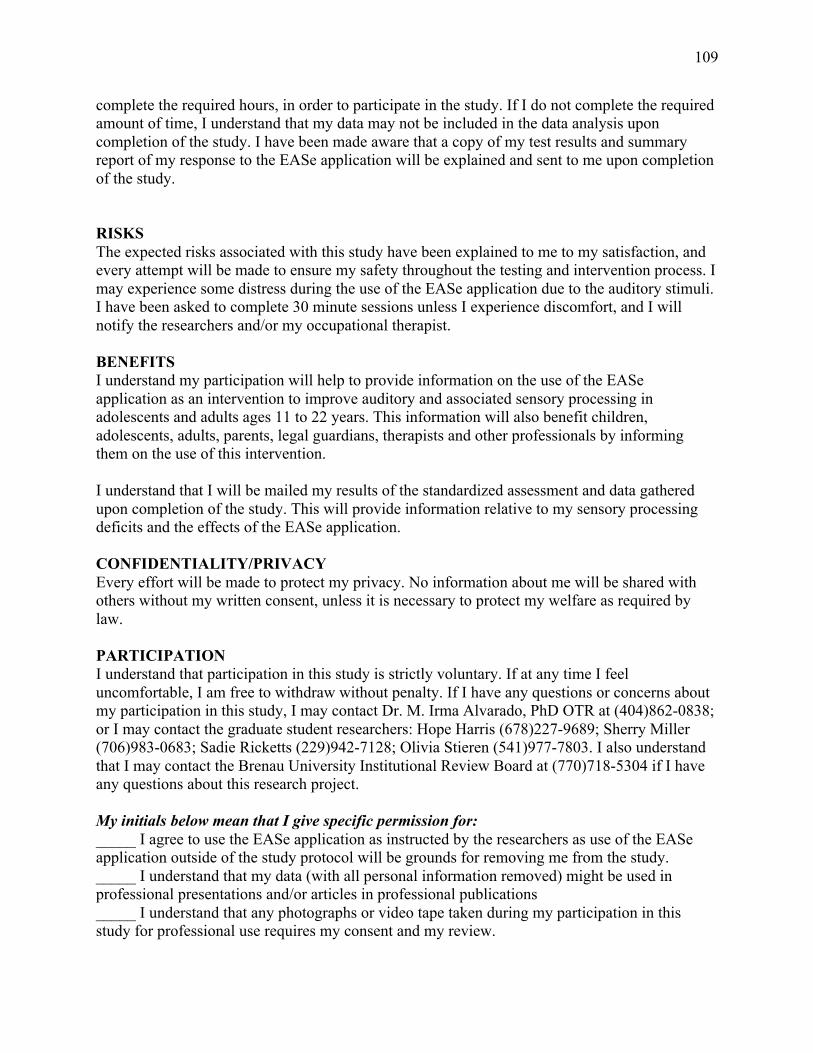
109
complete the required hours, in order to participate in the study. If I do not complete the required amount of time, I understand that my data may not be included in the data analysis upon completion of the study. I have been made aware that a copy of my test results and summary report of my response to the EASe application will be explained and sent to me upon completion of the study. RISKS The expected risks associated with this study have been explained to me to my satisfaction, and every attempt will be made to ensure my safety throughout the testing and intervention process. I may experience some distress during the use of the EASe application due to the auditory stimuli. I have been asked to complete 30 minute sessions unless I experience discomfort, and I will notify the researchers and/or my occupational therapist. BENEFITS I understand my participation will help to provide information on the use of the EASe application as an intervention to improve auditory and associated sensory processing in adolescents and adults ages 11 to 22 years. This information will also benefit children, adolescents, adults, parents, legal guardians, therapists and other professionals by informing them on the use of this intervention. I understand that I will be mailed my results of the standardized assessment and data gathered upon completion of the study. This will provide information relative to my sensory processing deficits and the effects of the EASe application. CONFIDENTIALITY/PRIVACY Every effort will be made to protect my privacy. No information about me will be shared with others without my written consent, unless it is necessary to protect my welfare as required by law. PARTICIPATION I understand that participation in this study is strictly voluntary. If at any time I feel uncomfortable, I am free to withdraw without penalty. If I have any questions or concerns about my participation in this study, I may contact Dr. M. Irma Alvarado, PhD OTR at (404)862-0838; or I may contact the graduate student researchers: Hope Harris (678)227-9689; Sherry Miller (706)983-0683; Sadie Ricketts (229)942-7128; Olivia Stieren (541)977-7803. I also understand that I may contact the Brenau University Institutional Review Board at (770)718-5304 if I have any questions about this research project. My initials below mean that I give specific permission for: _____ I agree to use the EASe application as instructed by the researchers as use of the EASe application outside of the study protocol will be grounds for removing me from the study. _____ I understand that my data (with all personal information removed) might be used in professional presentations and/or articles in professional publications _____ I understand that any photographs or video tape taken during my participation in this study for professional use requires my consent and my review.
110
_____ I agree to allow my data to be used for analysis and comparison in future studies. _____ I agree to participate in this study. _____ I agree to allow my occupational therapist to consult with the researchers and provide information about my participation in this study from time of consent to completion of this study. ________________________________________________ _______________ Signature of Participant OR Legal Guardian of Participant Date ________________________________________________ _______________ Signature of Participant (if applicable) Date ________________________________________________ _______________ Signature of Researcher Date
111
APPENDIX G EASe APPLICATION TRAINING PACKET
Training Packet
Dear Parent and Participant: Thank you for participating in this exciting research study! We are thrilled to have you on board with the EASe team, helping us to explore the effect of the EASe application. Please note that you must have daily access to an Apple iPhone, iPad, or iTouch device, as well as high quality headphones. In this packet, you will find:
• Contact information for the graduate student researchers, • Instructions for installation of the EASe application, • Instructions for using the EASe application, • A “Daily Protocol for Using the EASe Application”, • A “Daily Data Sheet” to be completed by the parent after each EASe session, • An “EASe Application Calendar” for tracking use of the EASe application
Please do not hesitate to contact us should any questions, comments, or concerns arise during the next few weeks while using the EASe application. Once again, thank you for your participation in this research study. We look forward to working with you! Sincerely, The EASe Team

112
Contact Information
Dr. M. Irma Alvarado, Thesis Advisor Essential Therapy Services, Inc.
(678) 679-1261 [email protected]
If the participant is between the ages of five and 10, please contact the following:
McKenzie McQuaig, OTS Charmaine Montez, OTS (770) 377-5200 (804) 926-7650
[email protected] [email protected]
Amanda Stephens, OTS Ashley Tolland, OTS (770) 846-6182 (770) 365-6720
[email protected] [email protected]
If the participant is between the ages of 11 and 22, please contact the following:
Hope Harris, OTS Sherry Miller, OTS (678) 227 – 9689 (706) 983 – 0683
[email protected] [email protected]
Sadie Ricketts, OTS Olivia Stieren, OTS (229) 942 – 7128 (541) 977 – 7803

113
Installation of the EASe Application
To install directly on iPhone, iPad, or iTouch device: 1. From the iPhone click the 'iTunes' application
2. Sign into your iTunes account with your Apple ID and password 3. Click 'Music' button on bottom left
4. Scroll all the way down and hit 'Redeem' 5. Enter the download code provided by the student researchers
6. Click “GO” on the keyboard to purchase the application
To install on iPhone, iPad, or iTouch device from the computer: 1. Please note that this method of installation should only be used if you have an iCloud
account and are familiar with syncing applications from the computer to the Apple device from iCloud
2. Open iTunes 3. Sign into your iTunes store account with your Apple ID and password.
4. On the right side there is a 'Quick Links' box. Click 'Redeem'. 5. Enter the download code provided by the student researchers and click 'Redeem' to
purchase the application 6. iCloud should automatically transfer the application to your iPhone, iPad, and or iTouch
To optimize the audio: 1. Please ensure the audio on your Apple device is turned to the lowest setting.
2. To adjust the music volume, adjust the volume on your Apple device as you normally would.
3. When the music starts playing, adjust the volume to a level that is comfortable for you.

114
EASe Application Instructions
How to play EASe Application: 1. Before you start the application, ensure that the speaker volume on your Apple device
(iTouch, iPad, iPhone) is set to the desired level for the participant 2. Plug in headphones
3. Open the EASe application 4. Document Start Time on Daily Data Sheet.
5. Click the play button 6. Listen to the music for up to 30 minutes while participating in an activity such as writing,
drawing, assembling a puzzle, or reading. Activity cannot include music/sound other than the EASe application.
*** If the participant becomes uneasy or is unable to listen to the music for the entire 30 minutes, just record the amount of time that he/she was able to complete the session on the data
sheet 7. At the end of the 30 minute session, hit stop.
8. Document End Time on Daily Data Sheet 9. An email will come up with the data from that session, compose email and send to the
researchers (____________________________________). Send an e-mail for each individual session of the day, 2 e-mails total.
10. Record any observations, amount of time, and activity that the individual was participating in on data sheet.
11. For participants ages five to 10 years, the participant sticker for calendar for completion of session.
*** Remember that the participant may be sensitive to the music volume, so keep the initial volume on the soft side. If you hear distortion, it is probably because of a volume setting.
Try adjusting the volume on the phone down slightly or the EASe volume down slightly to see if the quality of sound improves. The music should be very sharp at the edgy, boosted
parts and muffled in between, but never distorted.
Daily Protocol for Using the EASe Application
This research study is designed to last 28 days. The participant should listen to the EASe application for 2 daily half-hour sessions, once in the morning and once in the evening at home
while engaging in an activity that does not involve excess noise. Appropriate activities to engage in while listening to the EASe application include, but are not limited to: drawing or coloring,
reading a book, and playing with a toy. If you are unsure if the activity is appropriate, please ask the student researchers.
Day 1 of intervention will begin on the one to three days following initial testing. This may result
in a different start date for the participant than other individuals participating in the study. Post intervention testing will be completed one to three days following Day 28 by the graduate
student researcher.

115
If at any point the participant does not want to listen to the EASe application, he or she has the
option to remove the headphones. The music should be turned off immediately following headphone removal and the legal guardian or participant should send the EASe email report to
the student researchers. Additionally, the legal guardian or participant should document the listening time, behavior, and other observations (including headphone removal) on the provided
daily data sheet.
***For participants aged five to 10, the legal guardian is responsible for all documentation.
Example daily data sheet: Session Number
Date Session (AM/PM)
Preset(s) Played
Start Time
End Time
Activity Comments (include behaviors, medication changes,
environmental factors, etc.)
1 01/4/13 AM Preset 1 7:15 am 7:45 am
Reading a book
Took about ten minutes to focus,
but then really enjoyed listening
2 01/5/13 PM Preset 2 4:30 pm 4:37 pm Coloring Music was overstimulating
today; had to end session due to
increase in crying behavior.
3 01/6/13 AM Preset 2 7:45 am 8:15 am Coloring Noticed a decrease in disruptive
behavior today. Much more
cooperative than yesterday.
For participants aged five to 10: Weekly check-up emails or phone calls by student researchers
will be made to help answer any questions you may have or other comments you may wish to share. A final interview will be conducted by the student researchers during the week after the
conclusion of the 28-day cycle during post intervention testing in order to gain parent and participant feedback on the overall effect and usefulness of EASe application.
For participants aged 11 to 22: A student researcher will check-in every Monday, Wednesday, and Friday by either phone call, email, or in person to help answer any questions you might have
or receive other comments you may wish to share.

116
APPENDIX H PARTICIPANT DEMOGRAPHIC FORM
EASe DEMOGRAPHIC FORM
Name of participant: _____________________________________ DOB: _______________________ Age: _________ Were you born prematurely? Y / N Race/Ethnicity: ______________________ Is English your primary language? Y / N Are you currently in school? Y / N If YES, what grade? __________ Type of school: Public ______ Private ______ Home school ______ Other_________________ Diagnosis/Significant Developmental History: ________________________________________ Medications that you are currently taking (type and dosage): ___________________________ Therapy currently receiving: OT ____PT____ST_____ Psychological ____Other ___________
Frequency of current Therapy: ___________________________________________________ Glasses: Y / N If Yes, please list wearing schedule and type of vision problem: __________ ______________________________________________________________________________ Other assistive devices used (i.e. hearing aides) ______________________________________ Have you or are you currently using any auditory/listening programs? Y / N If YES, please list the name of program(s): __________________________________________ Please tell us what dates you began and/or ended the program(s): _________________________ Frequency and duration of the program(s): __________________________________________ Do you own headphones? Y / N If YES, please list the type of headphones: ______________
Researcher use only: EASe ID #_______________

117
Do you participate in any hobbies or extra-curricular activities? Y / N If YES, please list type and frequency of the activity(ies)._______________________________

118
APPENDIX I DAILY DATA SHEET

ADEASE 119

AdEASe 120

AdEASe 121

AdEASe 122

AdEASe 123

AdEASe 124
APPENDIX J EXIT INTERVIEW 1
For participants who completed the 28-day EASe app trial.
Participant Name: __________________________________________
Date of Interview: __________________________________________
1. Did using the EASe app 2 times a day for 30 minute sessions fit into your schedule?
If not, what would have worked better?
2. Were any behavior changes observed throughout the 28-day EASe app trial?
If so, what behavior changes were observed?
3. What did you like about the EASe app trial?
4. What didn’t you like about the EASe app trial?
5. Did the training session provide adequate preparation for use and understanding of the EASe app? Please explain.
6. How do you feel about the contact with the student researchers? (too much, too little, available for questions, etc.)
7. Do you have any suggestions for the study and/or EASe app?

AdEASe 125
APPENDIX K EXIT INTERVIEW 2
For participants unable to complete the 28-day EASe app trial.
Participant Name: __________________________________________
Date of Interview: __________________________________________
1. Did the participant complete any sessions?
If so, how many sessions were completed?
If not, why did the participant not complete any sessions?
2. Were any behavior changes observed when completing or attempting to complete sessions?
If so, what behavior changes were observed?
3. Does using the EASe app 2 times a day for 30 minute sessions fit into your schedule?
If not, what would have worked better?
4. Did the training session provide adequate preparation for use and understanding of the EASe app? Please explain.
5. How do you feel about the contact with the student researchers? (too much, too little, available for questions, etc.)
7. Do you have any suggestions for the study and/or EASe app?

AdEASe 126
APPENDIX L PROCEDURES CHART
Procedures Chart
• We gained approval from Institutional Review Board
• We recruited participants
• During initial meeting, the researchers informed the participants of the purpose of the
study
o We gained consent
o The EASe app was downloaded onto participants devices
o EASe identification number was assigned to each participant
o The demographic form was collected during the training session
o A training packet included EASe instructions, the daily data sheet, a schedule, and
the researchers’ contact information was given to each participant
• Training began January 2013
• The Adolescent/Adult Sensory Profile and the Canadian Occupational Performance
Measure assessments were administered to the participants
• Participant began using the EASe app within 3 days after training /assessment
• Participants completed the 28 study
• A post-intervention COPM was administered 1-3 days following the completion of the
28-day intervention
• Data was gathered from EASe app, AASP, COPM, Daily Data Sheet, Demographic
Form, and communication logs
• Analyzed qualitative and quantitative data
• Discussed results

AdEASe 127
• Provided a packet of results to each participant
• Presented a group presentation of overall results to participants

AdEASe 128
APPENDIX METHODOLOGIST APPROVAL FORM