the effects of privatization on consumers’ welfare: the
TRANSCRIPT

THE EFFECTS OF PRIVATISATION ON CONSUMERS’
WELFARE: The Case of Tea and Coffee Farmers in
Kirinyaga District, Kenya
by
John W. Nguri
A research paper submitted to the School of Economics in partial fulfilment of
Master of Arts Degree in Economics of the University of Nairobi.
tJOWC)
/\
- - N Y A T T A VEMORHI .
OCTOBER 2007
U N I V E R S I T Y o f NA I ROR I- Ab! COLLECTION

DECLARATION
This research paper is my original work and has not been presented for a degree
award in any other university.
Signature Date ( J ° ) t ( ( 0 ^
This Research paper has been submitted for examination with our approval as
university supervisors.
Signature Date ( K
II

DEDICATION
This paper is dedicated to my late mother, Jane Nguri for her dedication towards
my education and the other family members.

ACKNOWLEDGEMENTS
I would like to thank most sincerely my two supervisors Dr N.H.Wawire and Mr
B.Kinyanjui who despite their busy schedule, spared all the time I needed to provide me
with perceptive comments and constructive criticisms, which were very useful in
improving this final paper. I would also like to thank them for their patience and
counselling which went a long way in making me finalize this paper despite the time
taken since I finished my course work.
My sincere thanks also go to the directors of my firm, Pinnacle International
Consulting Limited, for giving me time to undertake this course and their assistance in
allowing some of the staff to assist in data collection, without which I would not have
been able to finalize this paper.
Finally, I would like to give special thanks to my family. My wife Esther*
encouraged me to go on despite spending a lot of time in the evening writing this paper.
My two sons, Isaac and Michael, and my daughter Jane for their encouragement and
support.
i\
IV

OPERATIONAL DEFINITION OF TERMS
Concessioning - privatisation method where the operation of an enterprise is leased
out to the private operator for a period of time at a fee and share of profit.
Denationalisation - process of returning formally nationalised enterprises to the former
owners or to the private sector.
Divesture - transfer of title in or sale of some or all assets or shares in an enterprise
regardless of any transfer of operations.
Equity dilution - a privatisation method where an enterprise’s share capital is
increased, with the new share capital subscribed by private shareholders.
Externalities - interdependencies not conveyed through prices. In other words
externalities are third party (or spill-over) effects arising from the production
and/or consumption of goods and services for which no appropriate
compensation is paid.*
Joint venture - privatisation method where a company is owned by the government
and private investor(s).
Liberalisation - as used in this context, it means economic liberalisation which
refers to less government regulations and restrictions in the economy in
exchange for greater participation of private entities.
Management contract - privatisation method where a contractor is charged with thet
responsibility of running the enterprise or a section of it at a fee based on certain
performance criteria.
Privatisation - any transactions that result in government selling or transferring control
of an enterprise to the private sector.
N

Public goods - goods which are jointly consumed and non-excludable.
Restitution - privatisation method where shares or assets are returned to former
owners from whom they had been acquired through nationalization or
confiscation.
Structural Adjustment Programs (SAPs) - prescribed economic programmes by the
World Bank and the International Monetary Fund (IMF).
i\
VI

ABBREVIATIONS
FRG Federal Republic of Germany
GNP Gross National Product
IMF International Monetary Fund
KNBS Kenya National Bureau of Statistics
CES Constant Elasticity of Substitution
OLS Ordinary Least Square
PERP Privatisation and Public Enterprise Reform Programme
SAM Social Accounting Matrix
SAP Structural Adjustment Program
SOE State Owned Enterprises
UK United Kingdom
ABSTRACT
Kenya embraced privatisation as one of the liberalization measures in 1990s, for
it to accelerate its economic growth. Despite embarking in it early 1990s, the economic
growth during this period deteriorated from a GDP growth rate at constant prices of 4.8
percent in 1995 to -0.2 percent in 2000. At the same time wage employment fell from a
growth rate of 3.4 percent to 0.4 percent. The poverty level of the average Kenyan
increased from 48 percent of the population in 1990 to almost 56 percent ten years
latter. There is therefore need to investigate the degree to which privatisation has
achieved the intended purpose of increasing economic efficiency and economic flows,
which would have had direct contribution towards poverty reduction and reduction in
unemployment.
The objective of this study was to investigate the contribution of privatisation to
the consumers’ welfare and the appropriateness of the process so far undertaken. In
addition the study has suggested how the-process of privatisation could be modified to
achieve optimal consumers’ welfare; and finally drawn policy implications from the
findings of the privatisation process implemented in Kenya.
The methodology used in this study was on two levels. From the national
production of tea and coffee, the growth rates of real incomes based on 1982 prices
was estimated using semilog model. On the second leyel the impact on the consumers’
welfare was estimated using comparative statistics derived from the utility maximisation
modelled as a Cobb-Douglas function. Data used to construct the model was the basic
consumer’s bundle of goods and services.
viii

The empirical findings from this study show that coffee income in real terms had
a negative growth rate, over the period between 1995 and 2006, of approximately 5.8%
per annum. At the same time tea income had a positive growth rate of 2.9% per annum.
Overall, the consumer welfare showed a decline for all bundles of goods included in the
study, notwithstanding the substitution effects like on foodstuffs.
From the findings of the study it was evident that success or failure of
privatization of a particular sector depended very much on the leaders of the process
rather than any available laws or developed policies to achieve a unified goal. This can
be deduced from the fact that the coffee sector had a negative growth, while that of the
tea sector was positive. Empirically it is evident that these two sectors took different
strategy in their privatization process.
The emergent conclusions from the findings are that privatization process would
have been positive if the process was well designed, laws enacted and properly
implemented.
\
IX

TABLE OF CONTENTS
DECLARATION............................................................................................................. "
DEDICATION................................................................................................................ Ill
ACKNOWLEDGEMENTS............................................................................................. IV
OPERATIONAL DEFINITION OF TERMS....................................................................V
ABBREVIATIONS.......................................................................................................VII
ABSTRACT................................................................................................................VIII
CHAPTER ONE: INTRODUCTION................................................................................1
1.1. Background....................................................................................................... 1
1.1.1. Reasons for Privatisation and Methods Applied...............................................2
1.1.2. Privatisation Program Design......................................................................... 3
1.1.3. Privatisation in Africa......................................................................................4
1.1.4. Privatisation in Kenya.....................................................................................6
1.2. The Statement of the Problem.................. ..................................................... 13
1.3. The objectives of the study............................................................................14
1.4. Significance of the Study................................................................................ 14
1.5. Scope of the Study.......................................................................................... 15
1.6. Organization of Study..................................................................................... 16
CHAPTER TWO: LITERATURE REVIEW................... 17
2.1. Introduction..................................................................................................... 17/
2.2. Theoretical Literature Review..... ;................. .'i............................................. 17
2.3. Empirical Literature Review........................................................................... 24
2.4. Overview of the Literature.......................................... 31
CHAPTER THREE: CONCEPTUAL FRAMEWORK AND METHODOLOGY.............. 34
x

3.1. Introduction.........................................................................................................34
3.2. Conceptual Framework..................................................................................... 34
3.2.1. Conceptual Growth Model................................................................................ 35
3.2.2. Conceptual Consumer Utility Maximization Model.......................................... 35
3.2.3. Definition and measurement of variables........................................................37
3.3. Study Design.......................................................................................................38
3.3.1. Sampling Techniques and Sample Size.......................................................... 39
3.3.2. Data Sources and Types.................................................................................. 39
3.4. Estimation Techniques...................................................................................... 40
3.4.1. Growth rate for Coffee and Tea........................................................................ 41
3.4.2. Consumer Welfare........................................................................................... 42
CHAPTER FOUR: EMPIRICAL FINDINGS................................................................... 48
4.1. Introduction.........................................................................................................48
4.2. Growth Model Analysis..................................................................................... 48
4.2.1. Coffee Sector Growth Model................ *..........................................................49
4.2.2. Tea Sector Growth Model................................................................................ 52
4.3. The Consumer Utility Model............... 56
CHAPTER FIVE: SUMMARY, CONCLUSION AND POLICY IMPLICATIONS............ 62
5.1. Summary.............................................................................................................62
5.2. Conclusions....................................................................................................... 65
5.3. Policy Implications............................................................................................ 65
5.4. Limitation of the Study and Areas of Further Research................................ 67
6. REFERENCES........................................................................................................ 68
APPENDIX ONE: DATA.................................................. 70
APPENDIX TWO: QUESTIONNAIRE............................................................................77
xi

LIST OF TABLES
Table 4.1: Proportion of the household expenditures.....................................................56
Table A.1: Key economic and social indicators in percentage terms..............................70
Table A.2: Country annual tea and coffee production (millions Kshs)........................... 71
Table A.3: Sample farmers’ income from coffee and tea................................................72
Table A.4: Sample farmers’ income................................................................................ 73
Table A.5: Average prices of selected household goods................................................74
Table A.6: Price index and average inflation rate........................................................... 74
Table A.7: Average prices.............................................................................................. 75
Table A.8: Optimal units of variables demanded by the households..............................76
Table A.9: Marginal change in equilibrium quantities.....................................................76
i\
xii

LIST OF FIGURES
Figure 1.1: Key economic and social indicators..............................................................11
Figure 1.2: Poverty Indicators and GDP growth rate......................................................12
Figure 2.1: Post-privatisation performance - Argentina Power Sector..........................29
Figure 4.1: Coffee Growth Model....................................................................................50
Figure 4.2: Tea Growth Model........................................................................................53
Figure 4.3: Foods (F) Demand curve..............................................................................57
Figure 4.4: School fees (s) Demand curve.....................................................................58
Figure 4.5: Clothing (C) demand curve...........................................................................59
Figure 4.6: Other goods and services (p) demand curve............................................... 60
Figure 4.7: Multiplier Factor (A) curve.............................................................................61
/\
xiii

CHAPTER ONE INTRODUCTION
1.1. Background
Privatization as an economic development policy has been in progress world
over for over twenty years now. However, nowhere so far was privatization undertaken
as in Britain under Mrs Thatcher. By the time she came to power in 1979, about 11.5
percent of Gross National Product (GNP) was accounted for by the State Owned
Enterprises (SOEs) and by the time of her third election in 1987, the GNP from SOEs
had reduced to 7.5 percent (Vickers and Yarrow, 1988)
Though modern privatization is associated with the Thatcher government in the
United Kingdom, the first large-scale, ideologically motivated “denationalization”
program of the post war era was launched by Konrad Adenauer elected to power in the
Federal Republic of Germany (FRG) in 1957 (Megginson et al, 1994). The first major
sale occurred in 1961, when the FRG sold a majority stake in Volkswagen in a public
share issue heavily tilted towards small investors, and four years later FRG orchestrated
a similar but larger secondary share issue in the company. The objectives expressed by
the FRG government in launching the first privatization were the objectives expressed
by the Thatcher government two decades later when the UK government launched its
privatization, and followed by every government which has decided to follow the
privatization route, regardless of their ideological basis. The main reasons for
privatization have been based on the disappointment with the actual performance of the
SOEs and the belief that the lure of financial incentives and the discipline provided by
the capital market will spur greater efficiency.
1

Since early 1980s privatization has been high on the political agenda. However
what are the economic consequences? The Wealth of Nations by Adam Smith (1776),
argued that in every great monarchy in Europe the sale of the crown lands would
produce a very large sum of money, which, if applied to the payment of public debts
would deliver from mortgages a much greater revenue than any which those lands have
ever afforded to the crown. Meaning that with the former crown lands becoming private
property, they would, in the course of a few years become well improved and well
cultivated (Vickers and Yarrow, 1988). Therefore, in the Kenyan situation, has
privatisation brought in economic development? Has the welfare of Kenyans been
improved since the country embarked on full scale privatization?
1.1.1. Reasons for Privatisation and Methods Applied
There are various reasons given by the advocates and authors on privatisation.
Vickers and Yarrow (1988) gave the objectives for privatisation as reducing governmentA
involvement in the industry; improving efficiency; reducing the public sector borrowing;
easing problems of the public sector pay determination by weakening the public sector
unions; widening share ownership; encouraging employee share ownership; and
gaining political advantage. Empirical evidence shows that the reasons given for
privatisation by most governments included reducing fiscal burden; developing private
sector; broadening ownership; increasing economic efficiency; reducing administrative
burden; developing capital markets; accessing markets, capital and technology; and/or
raising revenue for treasury.
Various privatisation and divesture methods have been used by various
countries, major ones being: sale of shares, which could be partial or majority
2

privatisation; sale of assets through partial divesture or full divesture; management or
employee buyouts; equity dilution; joint venture; restitution; liquidation; leasing;
concessioning; and management contract.
1.1.2. Privatisation Program Design
White and Bhatia (1998) stated that privatisation is an intensive political process
involving players from the executive, legislature, and judicial branches of government on
one part, and the private sector representatives on the other hand. Success of
privatisation is dependent on the political leadership’s commitment to the process at the
highest level; and the structured process for executing and coordinating its transactions
in place.
Before a privatisation process is embarked on, it should be well thought out,
objectives should have been set, each sector of the economy it is likely to affect be
reviewed and impact analysed. The laws should be reviewed to ensure that they are*
accommodative to the privatisation process and the institutions like the regulatory* 4 ̂
authorities are put in place (White and Bhatia, 1998).
According to White and Bhatia, (1998) the first activity in undertaking the process
is program design and preparation exercise whereby a privatisation agency is
established; enterprises to be privatized are selected and the mode of executing the
process for each sector or enterprise defined; organisation and performance review of/
each enterprise to be privatized undertaken; and 'preparation of detailed operating
policies and procedures for the privatisation program defined.
The second activity is to enact privatisation law defining key principles on which
the program will be based on and the institutional arrangement for its implementation
3

including the process to be followed before it can commence. The third activity is the
implementation process whereby enterprises to be privatised are selected and
privatisation method for each indicated; and terms of reference for transaction advisors
developed and consultants recruited. The final activity is to manage the process by
providing independence to the privatisation agency, and ensuring that it is focused and
has adequate resources to facilitate implementation.
1.1.3. Privatisation in Africa
In the developing countries, privatisation was introduced as part of the Structural
Adjustment Programs (SAPs) sponsored by the World Bank and the International
Monetary Fund (IMF) (Mitine, 2000) to correct structural imbalances hindering economic
growth. SAPs were designed as short term measures to solve severe balances of
payments crises which hit the Third World in the 1970s and 1980s as a result of high oil
prices, deterioration in terms of trade, heavy external borrowing at high interest rates
leading to heavy debt burdens.
The genesis of the parastatal sector in East Africa goes back to the 1960’s and
1970’s when many countries lacked an industrial base and an entrepreneurial class with
sufficient capital to undertake projects (Mitine, 2000). The state was, therefore, called
upon to play a key role in the promotion of economic development. It was envisaged
that the state would be in a position to mobilize both human and financial resources to
launch projects for further economic growth. Consequently, these countries set up
state-owned enterprises covering the length and breadth of economic activities.
Africa’s limited reliance on the private sector in the early years of independence
stems from its colonial experience and ideological stance after independence (Debebe,
4

1993). During the colonial times the production and consumption structure of African
economies was structured to fit the interest of the colonial powers. The colonies
produced raw materials for factories in Europe and manufactured goods which were
exported back to the African countries for sale, a process which has remained, even
many years after independence. During the colonial period Africans were deprived off
entrepreneurial skills while their labour was widely used in colonial establishments. The
colonial powers used their people for entrepreneurial management with little, if any,
sharing with African natives.
The political and economic environment of the world at the time of independence
played an important role in determining the development path many African countries
chose (Debebe, 1993). The world was divided between the capitalist west and the
communism east. The East-West competition cared little to get the African economies
growing as their main concern was political power which influenced their aid assistance
to these newly independent countries, channelled mainly in form of military hardwareA
with little, if any, on economic welfare of these nations. This game continued until the* i *
collapse of the Soviet Union when the Western Economies started paying interest to the
economic well-being of the African countries.
Both Mitine (2000) and Debebe (1993) concur that by the beginning of 1970’s it
was realized that the economic performance of these countries like all third world
countries showed either marginal growth or stagnation. The expected stimuli to growth/
that was expected from SOEs proved disappointing as many of them continued to
accumulate huge losses and became a drain on the national treasuries. Through
recommendations by the World Bank and the IMF, privatisation measures were
5

introduced to remove ownership of SOEs from Government to the private sector.
Privatisation went hand in hand with other macro-economic measures to achieve faster
economic growth through better and efficient use of resources. Some of the other
measures besides privatisation included trade liberalization, exchange rate alignment,
and removal of price controls, budgetary controls, and more allocation of credit to the
private sector.
1.1.4. Privatisation in Kenya
The thinking on privatization in Kenya started way back in late 1970s. In 1979 the
government of Kenya (GOK) undertook a review of statutory boards (Republic of Kenya,
2005) to evaluate why the performance of parastatals was not up to the expectation,
with a view to coming up with ways and means of arresting the situation. The main
conclusions of this report was that there were general lack of efficiency in the sector;
general financial mismanagement; lack of focus; and general exposure of the
government to the benefit of a few inventors in the private sector.
This study was closely followed by the Report of the Working Party on
Government Expenditures published in 1982 (Republic of Kenya, 2005). This report
concluded that productivity of the state corporations was quite low while at the same
time they continued to absorb an excessive portion of the budget, becoming a principal
cause of long-term fiscal problem. The report observed that Kenyanization had
remained merely presentational through government ownership; state corporations’
operations had become inefficient and unprofitable, partly due to multiplicity of
objectives; existence of parastatals in commercial activities had stifled private sector
6

initiatives; and many of the joint ventures had failed, requiring the Government to
shoulder major financial burden.
The report therefore recommended that the government should act as a creator
of favorable setting within which people can develop themselves and hence the
economy; divest from its investments in commercial and industrial enterprises to
transfer active participation to more Kenyans through shareholding; reduce exposure to
risk in areas in which the private sector could assume risk without government
intervention; dismantle some of the existing administrative hurdles which discourage
private sector initiative and provide needless opportunities for corruption; and
reorganize legal and institutional framework regarding monitoring and supervision of
parastatals.
Despite these two reports which were a clear manifesto to the government to
develop an appropriate policy on the parastatal reform, more stringent controls were
instead introduced through the enactment of the State Corporations Act in 1986. With
the enactment of this law, political patronage became the norm to get parastatal
appointments with no regard to qualification and experience in running such
organizations. Performance of these executives was no longer a criterion as long as
they remained loyal political players to the appointing authority.
This obviously led to deterioration in the performance of the parastatals in all
spheres ranging from general to financial mismanagement. The government in its effortf
to sustain them injected more and more funds from its limited resources and through
guaranteed borrowings. In the face of poor performance of the SOEs, the Kenya
Government adopted a new development strategy, spelt out in Sessional paper No.1 of
7

1986, on Economic Management for Renewed Growth (Republic of Kenya, 1986). The
strategy was to restructure the economy so as to remove distortions, and to create a
market driven economy, through concentration of its energies on creating an enabling
environment for doing business by providing such things as infrastructure and security.
The poor state of the public sector performance led to the publication of
Sessional Paper No.4 of 1991 on Development and Employment in Kenya, which
decried the continued deterioration of the performance of state corporations. The Paper
observed that while the creation of state corporations through which government
participation in economic activities was promoted was perhaps appropriate soon after
independence, the objectives for and the circumstances under which most of the state
enterprises were created had since changed. The paper underlined the need to
implement privatization and divestiture of State corporations urgently in view of the
managerial problems afflicting the parastatals leading to poor return on government
investments, the existence of a larger pool of qualified manpower, availability of more
indigenous entrepreneurship to permit private sector led economy, and the need for• -i ^
non-tax revenue for the Government.
Indeed, initial efforts towards parastatal reforms were ad hoc and included
capitalization and restructuring of managements (Mitine, 2000). It was soon realized,
however, that the malaise was so deep that only a comprehensive and far-reaching
program stood any chance of success. Therefore in July 1992 the government launched
the policy paper on Privatisation and Public Enterprise Reform Programme (PERP)
(Republic of Kenya, 1992), with wide-ranging objectives. Based on this paper the
Government was to discontinue its presence in commercial activities and dovetail its
8

services to those activities relating to governance; promote the growth and development
of the stock market and accelerate investment and broaden share ownership. In
addition the government was to avoid unfair competition and resultant crowding out of
the private enterprise; lessen political interference in company operations; promote
competition, efficiency and productivity; and improve the regulatory environment by
selecting more economically rational means of regulation (thereby reducing conflicts of
interest between the regulatory and commercial functions of state corporations.
There were 240 public enterprises, with 207 non strategic commercial public
enterprises which were to be privatized and 33 Strategic Commercial public enterprises
which were to be restructured and retained under public sector ownership and control in
Kenya when the PERP paper was published in 1992. By May 2000 out of the original
240 directly and indirectly owned parastatals, a total of 168 parastatals had been
privatised, 14 through liquidation; 22 through receiverships; 54 through pre-emptive
rights; 10 through public floatation; 17 through competitive bidding; 1 through*
management/employee buyout; 11 through partial divesture; and 39 through total
divesture (Mitine, 2000). The government total earnings out of these transactions were
just slightly more than Kenya Shillings 11 billion or an average of Kenya shillings 65
million each, a price considered by many as far below the market value of these
corporations.
Though Kenya embarked on privatisation aggressively, there were no laws which!
were enacted to control or regulate the process. Hence, as stated by White and Bhatia
(1998) from a World Bank publication, that Kenya’s privatisation program was designed
to be coordinated centrally by a privatization implementation agency reporting to a
9

government appointed committee, which lacked legal status and authority. As such
each sector handled its own privatization process with no formal program, regulation or
control. Due to these disconnects in 1995 some 41 members of Parliament held a press
conference in which they complained of the process. In their statement they indicated
that the privatisation process had opened up perhaps the most lucrative means of
looting and legitimizing the plunder of public investments.
In addition to the privatization process for the commercial parastatals which was
taking place, the other sectors of the economy were also being liberalised. In agriculture
the two main commodities, tea and coffee were also subjected to liberalization with the
affected institutions either being candidates for restructuring or full privatization.
Evidently it was clear that for those sectors of the economy where
liberalization/ privatisation was undertaken based on well articulated studies and all
factors considered including regulatory issues, the sector’s performance improved
despite lack of a national policy on privatisation. It is also evident that after liberalisation*
the production of coffee plunged while that of tea thrived, a factor attributable to the’ 4 ̂
differences in management of the process for the two sectors. Therefore, for those
sectors where the liberalization/privatisation process was undertaken haphazardly, the
results were very discouraging.
Generally the analysis above is in agreement with a study undertaken in
Argentina (Chisari, Estache and Romero, 1997), where it was found that if privatisationi
process was well thought out and effective regulatory institutions put in place, the gains
from privatisation were significant. In addition the economic development was readily
10

realised with minimal effect on unemployment even in the short run when this would be
mostly felt.
To assess the overall economic performance of the Kenyan economy after
privatisation it would be important to review the performance of some key economic
indicators like Gross Domestic Product (GDP), employment and population. Figure 1-1
below and table 1 give the relative changes in these three indicators over the study
period.
Figure 1.1: Key economic and social indicators
Figure 1-1 above show that the key Kenya economic indicators, declined over
the study period despite the anticipated increase in productivity as a result of increased!
private sector participation. While population growth did not materially change over the
study period, GDP and employment growth declined to negative growth rate between
2000 and 2001. Table 1 show that GDP declined from 4.8 percent in 1995 to 1.8
11

percent in 2003 with a negative growth rate in 2000 of -0.2 percent. At the same time
wage employment rate declined from 4 percent in 1995 to 1.6 percent in 2003, with a
negative growth rate of -1.1 percent in 2001. It is therefore noteworthy to say that this
poor performance of the Kenyan economy occurred during the time when the country
was at the peak of its privatisation program.
GDP growth rates from the Kenya National Bureau of Statistics
Figure 1-2 above shows the poverty level in relationship to the GDP growth rate.
As can be seen from the figure, since 1995 as the GDP declined to its lowest level in
2001, the poverty increased from about 40 percent persons living below poverty line to
56 percent by the year 2003.
12

1.2. The Statement of the Problem
In 1991, the Government announced privatisation measures in its budget speech
(Republic of Kenya, 1991). This was followed by the launch of the Privatisation and
Public Enterprise Reform Programme in July 1992 (Republic of Kenya 1992). So far
since Kenya started privatisation and parastatal reforms, the poverty level of the
average Kenyan has increased from 48 percent of the population in 1990 to almost 56
percent ten years latter, i.e. 2001 (Republic of Kenya, 2003).
Despite the privatisation and economic liberalization measures undertaken in
1990s, the economic situation in the country seemed to have worsened. The economic
growth during this period deteriorated from a GDP growth rate at constant prices of 4.8
percent in 1995 to -0.2 percent in 2000, as shown in table 1 (Appendix 1). At the same
time wage employment fell from a growth rate of 3.4 percent to 0.4 percent. This was
not withstanding the population growth rate which has been maintained at an average
growth rate of 2.6 percent during this period.
This was notwithstanding the proponents of privatisation argument that, it
increases economic efficiency and flows to the government, which leads to enhanced
economic development of the country. Evidently, between 1995 and the year 2000 out
of the former 240 SOEs, 168 parastatals had been privatised, (Mitine, 2000). At the
same time other sectors of the economy were liberalised including the coffee sector, the
tea sector and most crucial, the price controls had been removed.
During this period, though privatisation should have enhanced economic
development of the country, it seems the situation was worsened with poverty level
mcreasing coupled with sluggish economic growth. It is therefore not clear whether the
13

problem originated from the privatisation itself, the design of the program, or the
implementation process. There is therefore need to investigate the degree to which
privatisation has achieved the intended purpose of increasing economic efficiency and
economic flows, which would have had direct contribution towards poverty reduction
and reduction in unemployment leading to increased consumers’ welfare.
This research will therefore answer the following questions: (a) Has privatisation
contributed positively or negatively to consumers’ welfare? (b) Was the process of
privatisation adopted appropriate? (c) How would the process of privatisation be
modified to achieve optimal benefits to the consumers’ welfare?
1.3. The objectives of the study
The general objective of this study was to investigate the degree to which
privatisation has achieved the intended purpose. The specific objectives of the study
were:
a) To investigate the contribution of privatisation to the consumers’ welfare;
b) To investigate the appropriateness of the process of privatisation; and
c) To suggest how the process of privatisation could be modified to achieve
optimal consumers’ welfare;
1.4. Significance of the Study.
Since privatisation was started in the late 80s no known major assessment of its/
effect to the consumer welfare has ever been done. The only widely known study
undertaken in the country was in 1997-1998 sponsored by the World Bank through the
Ministry of Finance. However, as most of the privatisation had not taken place by then,
14

certain economic factors as a result of the privatisation may not have been conclusively
evaluated. In any case, the assessment was undertaken through the instigation of the
World Bank which had also prescribed the system to the country. Hence there was
need to have independent evaluation of the policy. The other reason which made this
study important was the need to re-evaluate the whole process and the policy
implications.
The study also contributes to the existing literature by providing empirical
evidence on how failure to coordinate policies on privatisation could impact negatively to
the development policies of the country. Furthermore, this study has developed a base
for a more detailed one on the overall impact on privatisation in Kenya, not only on the
consumers’ welfare but also on the overall economic development of the country. Its
timing not only assists the policy makers as the country embarks on the implementation
of the new Privatisation Act, but also provides both critics and proponents of
privatisation a basis for taking the process further and review its long-term impact on theA
development strategies of Kenya and other developing countries.* 4 ^
1.5. Scope of the Study
The study took 1995 as the base year given that this is the time substantive
privatisation of SOEs had been accomplished after the publication of the government
PERP paper in 1992. Between 1992 and 1995 most of the work done included
privatisation designs, valuation, selling processes and divesture processes. Also during
this period liberalisation of the various economic sectors like the banking sector;
Marketing of various commodities like coffee and tea; and price control regimes like that
°f petroleum products were removed.
15
The study is from 1995 to 2001, a period considered long enough for a policy
change to have had impact. The scope of the study covers the coffee and tea sectors of
the Kenyan economy to demonstrate how the different policies on liberalisation/
privatisation of the two sectors bore different results to the economic well being of the
communities. The aggregate production of the commodities during the period were
analysed and their growth pattern assessed. Additionally specific consumer welfare
assessment study was undertaken based on a sample of 10 farmers spread between
coffee and tea growing zones of Kirinyaga District.
1.6. Organization of Study
The reminder of this paper is organized as follows: Chapter 2 reviews that
theoretical and empirical literature on the area of privatization. Chapter 3 introduces the
conceptual and analytical framework used in this study. Chapter 4 specifies the model
and the methodology to be followed in the study and chapter 5 presents the results.
Finally chapter 6 gives a summary and draws conclusions and policy recommendations.
\
16

CHAPTER TWO LITERATURE REVIEW
2.1. Introduction
To address the problems and the objectives of this study discussed in chapter
one, it is important to understand what the various writers and researchers have
concluded on privatisation and its effect to the economic well being of nations and their
people. Section 2.2 discusses the theoretical literature; and section 2.3 reviews the
empirical one. Finally section 2.4 gives an overview of the literature review.
2.2. Theoretical Literature Review
One of the earliest proponents of privatisation was Smith A (1776), who argued
that, in every great monarchy in Europe the sale of the crown land would produce a very
large sum of money, which, if applied to the payment of public debts would deliver from
mortgages a much greater revenue than any which those lands had ever afforded to the*
crown in its tenure of public ownership. The argument being based on the premise that* 4 '
when such lands were operated by the private sector, they would bring in efficiency and
hence increase productivity resulting to the overall improved benefits to the country as a
whole.
Megginson et al, (1994) wrote about the first large-scale, ideologically motivated
denationalisation program of the post war era launched by Konrad Adenauer elected to
power in the Federal Republic of Germany' (FRG) in '1957. FRG’s first major sale
occurred in 1961, when they sold a majority stake in Volkswagen in a public share issue
heavily tilted towards small investors, and four years later orchestrated a similar but
'arger secondary share issue in the company. The reasons expressed by the FRG
17

government in launching the first privatisation were based on the disappointment with
the actual performance of the SOEs and the belief that the lure of financial incentives
and the discipline provided by the capital market will spur greater efficiency.
Since the Volkswagen privatisation in FRG, as an economic development policy,
it has been in progress the world over (Vickers and Yallow, 1988), in Europe, North
America, Japan and numerous developing and newly industrialized countries. Again the
reasons expressed for privatisation were similar to those by FRG in 1950s. However,
nowhere was privatisation undertaken as in Britain under Mrs Thatcher. By the time she
came to power in 1979, about 11.5 percent of gross national product (GNP) was
accounted for by the state owned enterprises (SOEs) and by the time of her third
election in 1987, the GNP from SOEs had reduced to 7.5 percent.
Clarke and Pitelis (1993) reviewed the case for private ownership under three
theories. The first theory referred to as the neo-classical property rights school theory
states that lack of private property rights (communal ownership) lead to dissipation
referred to as the tragedy of commons. Critics of this theory however argue that* 4 ̂
historically communal ownership has often had efficiency enhancing effects brought
about by the synergy created. The second theory referred to as the Hayek’s dispersed
knowledge theory, states that knowledge is widely dispersed in every society and
efficient acquisition and utilization of such knowledge can only be achieved through
price signals provided by markets. For this, the critics argue that knowledge tends to be/• \
more widely dispersed in market economies where there is no central planning and
coordinated effort.
18

The third theory, referred to as the Alchian and Demsetz’s (1972) residual
claimant theory, suggested that private ownership of firms is predicated upon the need
for residual claimant of income generating assets in the absence of which members
tend to ‘free ride’, leading to inefficient allocation of resources. Again critics of this
theory argue that this is much weaker in joint stock companies proposed by the
proponents of privatisation.
Despite these theories and criticism levelled against them, Clarke and Pitelis
(1993) noted that based on the mainstream economic theory, the first fundamental
theorem of welfare economics shows that markets allocate resources efficiently without
state intervention as long as market failures do not exist. In their view, market failures
can be caused by existence of externalities, public goods, and monopolies. Accordingly,
it is the reasons why every industrialized country in the 20th century felt the need for a
large public sector, suggesting that public enterprises served a purpose private
entrepreneurship could not fulfil as portrayed in the Wagner’s Law. Even today despite
the widespread global privatisation, most industrial countries have been modest in their* 4 ̂
transfer of public assets to the market system (Stevens, 1992).
Newthorn et al (1993) examined some existing theories equating efficiency with
private ownership which they argued that they were quite misleading. Their argument
was based on the premise that the performance of an enterprise is dependent on the
political economy of the state intervention rather than ownership per se. They looked at/
the two dimensions of efficiency and investigated how political economy related to the
question of efficiency. They argued that those who consider private ownership to be
19

superior to public ownership based their arguments on (a) residual claimant theory and
(b) the dispersed knowledge theory.
The proponents of residual claimant theory as a justification of private ownership
was based on the argument that modern production which is usually organized on team
basis made it difficult to measure individual efforts. Therefore, to ensure that individual
members are not shirking, there was need to have a specialized monitor who had to
have a claim to the profits of the company. This made the private ownership have the
best guarantee for the monitor as the residual claimant of the profit of the enterprise, a
matter not guaranteed by the public sector. However, the variant on the claimant theory
argued that motives such as nationalism, altruism, and even pride in serving the public
can motivate public sector managers towards good performance. Examples of states
with no prospect of privatisation, that have put enormous pressure on the public
enterprises to be efficient include France, Austria, Taiwan and South Korea.
The proponents of dispersed knowledge theory justified the private ownership on
the basis of the nature of human knowledge, that it can never be codified and* 4 ^
transmitted to others. Therefore given such limited transferability of knowledge, the
state is always more ignorant than individual private owners, as far as the latter’s own
business is concerned.
Jhingan (2000) explained the vital role played by the public sector in accelerating
the economic development. The argument was that, public sector is responsible for the\
provision of infrastructure like roads, sea, air transport, and railways; and utilities like
electricity, water supply, postal services, and telegraph and telephone services. These
services benefit the development of agriculture and industrial sectors of the economy by
20

the private sector, leading to accelerated development of the country. Furthermore,
conservation of natural resources provides domestic base and raw materials for
industrialization and economic development.
Jhingan (2000) further noted that development of key industries that would lead
the economy to the path of self sustained growth was ensured especially where heavy
investments are required with long gestation period. State owned financial corporations,
investment trusts, and state banks helped in providing direct financial assistance by way
of loans and credit to the private sector. At the same time public investment in the field
of internal and external trades facilitated smallholder producers to get fair prices and as
a result increased their productivity. While development of public sector led to many
indirect benefits to a developing country such as employment, balanced regional
development, increased incomes of its peoples, improved living standards and increase
in the peoples’ productive efficiency. Furthermore, when public enterprises are ran on
profit-price policy they lead to higher capital formation in the country which was crucial
for accelerated economic development.
The Marxian theory of economic development (Jhingan, 2000) helps in
understanding capitalism and where it could lead to if unchecked. Marx considered the
surplus value to be the main characteristic of capitalism. Marx argued that capitalism is
divided into two great protagonists, the worker who sells their labour power and the
capitalist who own the means of production. The labourer sells labour for what it is/worth in the market which is the value of the means of subsistence necessary for the
wa'ntenance of the labourer. The capitalists will always try to maximise the difference
between the total produce of the labour and its value known as the surplus value.
21

Based on this theory, the capitalist will accumulate more capital through increase
of the surplus labour. The capitalist will increase the surplus labour either by prolonging
the working day; diminishing the hours required for labourers’ sustenance; or increasing
the productivity of labour through technological change. More often than not the
capitalist will use technological change. The more capital accumulated the more profit
the capitalist made and hence the profits made. Based on this, Marx defined capital as
dead labour that like vampire only lives by sucking living labour and lives the more
labour it sucks.
The consequence of capital accumulation according to Marx is the concentration
of capital gigantic enterprises. Competition among the capitalists will force them to
cheapen their products through introduction of labour saving machines, which increased
labour productivity. Those capitalists not able to replace labour with machines are
forced out. This then led to increase of technological capital, which replaced labour as
means of production. Accordingly, this process of supplementing labour by machines*
created an industrial reserve army which increased as capitalism developed referred as
the “Law of the increasing misery of the masses under capitalism” (Jhingan, 2000).
Koutsoyiannis (1979) has written extensively on welfare economics. Welfare
economics is concerned with the evaluation of alternative economic situations from the
point of view of the society’s wellbeing. Koutsoyiannis (1979) has written on the various
criteria suggested by various economists. According to one of those criterion by thet
famous Italian economist, Vilfredo Pareto referred vto as the Pareto-Optimality, any
changes in the economic efficiency that makes at least one individual better-off and no
22

one worse-off is an improvement in social welfare, and if it made one person better-off
and at least one worse-off is a decrease in social welfare.
According to the Pareto-Optimality theory, to attain the Pareto efficiency situation
in an economy three marginal conditions must be satisfied: (a) efficiency of distribution
of commodities among consumers (efficiency in exchange or free movement and
availability of goods and services with no trade barriers); (b) efficiency in allocation of
factors among firms (efficiency of production); and (c) efficiency of allocation of factors
among commodities (efficiency in product mix, or composition of outputs). Though as
indicated in the text that Pareto-optimality is of limited applicability in the real world
situation, part of the reasons why privatisation was adopted by most countries was to
bring about the efficiencies suggested in this theory.
Indeed as Koutsoyiannis (1979) writes, an important ingredient to achieve the
Pareto optimality is the improvement in the consumer welfare which is one of the basic
purpose of privatisation. The consumer is considered to be rational and aims at*
maximisation of his/her utility subject to the constraints imposed by the available
disposable income and the market prices of goods and services. Preferences are
ranked in terms of indifference curves which are convex to the origin, indicating a
diminishing marginal rate of substitution between the bundle of goods and services. The
total utility of the consumer depends on the quantities of the goods and services
consumed as shown in equation 2.1 below:1
U = 2> <?3—........<?n) .......... ■................. .........................2.1
Given the market prices and the income of the consumer, the aim is the
Maximisation of utility. Therefore with n commodities available to the consumer, the
23

market prices given as Pi, P2........ Pn and the income given as Y, the above utility
maximisation would be subject to the budget constraint indicated in equation 2.2 below.
E/^oQ i Pi = Q lPl + 92*2 + ...............+ <lnPn = Y .........................................2.2
To solve the above equations the Lagrangian multiplier method is used to get the
constrained maximum. After converting the two equations using the Lagrangian
multiplier into a composite function, the first order condition can be obtained. Equating
the resulting equations to zero, the maximisation of the utility function can be obtained,
which gives the equilibrium condition for each good and service. At the equilibrium
condition, the marginal utilities of the various goods and services divided by their
individual prices will be equal as shown in equation 2.3 below:
MUi MU2 MUx MUy MUn
From the above equilibrium condition and the budget constraint indicated in
equation 2.2 above, the demand function can be derived for each of the commodities in
the consumer’s bundle of goods and services.
2.3. Empirical Literature Review
Todaro (1992) explored some of the problems of public administration in the
developing countries as caused by the widespread of state owned enterprises (SOEs).
The research found that during the last three decades, there had been rapid growth in/, \
number and sizes of SOEs in the developing countries, not only in the traditional sectors
of utilities (gas, water, electricity), and communications (telephone, telegraph and
Postal), but also in other sectors of manufacturing, construction, finance, services,
24

natural resources and agriculture. Empirical evidence showed that SOEs contribute 7-
15 percent of their GDPs in most economies of the developing countries and for a
substantial amount of investments yielding more than a quarter of the total capital
formation in these countries. Besides, the study showed that these SOEs absorbed
considerable amount of resources hence imposing a heavy burden to the economies.
Todaro (1992) gave the reasons for widespread of SOEs as persistence of
monopoly power in many developing countries which led governments to instil controls
to ensure prices are not set above the costs of producing the outputs; need for capital
formation as a foundation for further development through development of
infrastructures; lack of private incentives for promotion of economic activities; and the
need to expand employment and training of labour force, equitable income distribution;
and control of strategic sectors of the economy.
However, despite the good reasons for their establishment, SOEs have been
wasteful of resources, and have remained unprofitable and inefficient (Todaro, 1992),*
as evidently was the case unveiled by a World Bank study (1977) covering 24*4 ̂
developing countries. However it was argued that there were two possible solutions to
these problems (a) reorganisation with a greater bottom line focus for the SOEs as is
the case in China, and (b) the transfer of ownership and control to the private sector
(the case for privatisation).
Despite the strong arguments for privatization, Todaro observed that it raisedi
many questions ranging from feasibility, appropriate financing, the structure of legal and
Property rights, the role of competing elites and interested groups and whether or not
widespread privatisation promoted or ultimately weakened existing dualistic economic,
25

social and political structures. That it is not sufficient to claim, as many neo-classical
free market advocates have, that privatisation can lead to higher profits, greater output,
or even lower costs. That the key issue is whether such privatisation better served the
long-run development interest of the country by promoting a more sustainable and
equitable pattern of economic and social progress.
Jones (1993) undertook an empirical study of the privatisation and market
structures of the UK Gas Industry and had interesting revelations. One key finding was
that privatisation is not always complementary to the promotion of competition. The
study found that the method and execution of privatisation in the UK positively hindered
the development of competitive market structures in a number of cases. This was due to
emphasis of policy for changing ownership based on other reasons other than for
promoting competition, thus ignoring the allocative and productive efficiencies. As a
result public monopolies became private owned monopolies thereby depriving the
economy many of the claimed benefits of the private ownership which are dependent on
competition in the product market.
Debebe (1993) discussed the sources and essence of privatisation in sub-
Sahara Africa. The study identified the privatisation strategies, assessed their feasibility
and explored their implication on future development. The study further noted that, the
World Bank through its structural adjustment policies and the IMF through its
conditionality program brought pressure to bear on the African governments to adopt
privatisation. The study therefore concluded that privatisation in Africa originated from
the explicit and implicit conditions imposed by the West and its institutions for receiving
26

aid rather than from the realization of basic weaknesses in the approaches of the past
economic policies.
Debebe (1993) analysis further observed that the essence of privatisation in
Africa is different from that in the West. The West recognized the primacy of markets
and relied primarily on the private sector, with government intervention when markets
do not work or they fail to produce optimal outcomes either due to externalities or the
existence of public goods. In Africa, the study noted, that there is heavy reliance on the
public sector with the government intervening extensively in making production and
consumption decisions. The public sector produced and delivered even those goods
and services typically provided by the private sector in the west.
Sarbib (1997) looked at the trends in privatisation in Africa in three time phases.
The launch and learning phase up to 1994/95 which gave clear lessons to be followed
for successful privatization activity in Africa. The maturity phase beginning in 1995 to
the beginning of the 21st century. And the final phase when anticipated benefits of
privatization were expected to be felt through accelerated economic growth and* 4
development.
Sarbib (1997) argued that in the first phase, privatization began against a
background of poor economic performance; public mistrust due to concerns about
corruption, ownership, and unemployment; weak institutional capacity; and weak or
virtually non-existent capital markets. It was therefore not surprising that governments/
were feeling their way and efforts were largely directed to privatizing small and medium
size enterprises, most of who were loss-making. During that period many countries,
deluding those which embraced modern market economics, underwent through
27

structural adjustment. A key policy measure of that reform was liberalization which was
important both for privatization and private sector development.
Crampes and Estache (1996) reviewed the water concession in Argentina and
noted that labour productivity had improved, service coverage had increased, reliability
and responsiveness had improved considerably, and the prices of the services had
fallen. However there were problems with the water regulator which obviously made the
private operator exploit the situation whereby though the prices of water had initially
fallen by 27 percent the consumer had to bear with an ad hoc increase in the prices of
about 13 percent. As noted during this review a private monopoly will exploit any weak
point in the system of regulation if it exists to make the most of the monopolistic power.
Estache and Rodriguez-Pardina (1996) reviewed the Argentinean power
concession. The purpose the Argentinean government wanted to reform its electricity
sector was to achieve efficient pricing and production levels in the short term and an
investment level sufficient to meet demand in the long term. To ensure that it was
properly done, the government started off by revamping the legal framework in 1989.
The results were impressive as shown in figure 2-1 below. Spot prices of power
decreased by almost 50 percent from $41.85 in 1992 to $22.30 by 1995 per MWh.
Distribution losses decreased from 21 percent in 1992 to 12 percent in 1995; and
thermal availability increased from 48.2 percent to 69.9 percent over the same period.
Transmission forced outages reduced from 100 hours in 1992 to 300 hours in 1995.
2 8
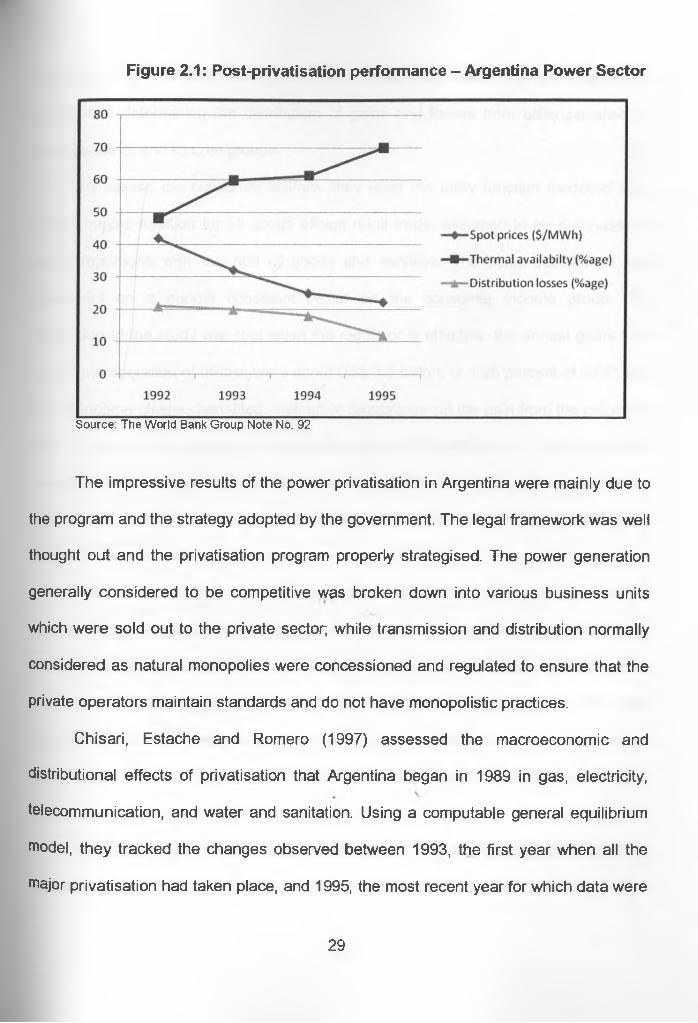
Figure 2.1: Post-privatisation performance - Argentina Power Sector
Source: The World Bank Group Note No. 92
The impressive results of the power privatisation in Argentina were mainly due to
the program and the strategy adopted by the government. The legal framework was well
thought out and the privatisation program properly strategised. The power generation
generally considered to be competitive was broken down into various business units
which were sold out to the private sector; while transmission and distribution normally
considered as natural monopolies were concessioned and regulated to ensure that the
private operators maintain standards and do not have monopolistic practices.
Chisari, Estache and Romero (1997) assessed the macroeconomic and
distributional effects of privatisation that Argentina began in 1989 in gas, electricity,
telecommunication, and water and sanitation. Using a computable general equilibrium
model, they tracked the changes observed between 1993, the first year when all the
major privatisation had taken place, and 1995, the most recent year for which data were
29

available. In an innovative use of the model, they also assed the importance of the
regulator in determining the distribution of gains and losses from utility privatisation
among sectors and income groups.
To assess the consumer welfare, they used the utility function modelled as a
Cobb-Douglas function for all goods except retail trade, assumed to be purchased in
fixed proportions with the rest of goods and services. The utility satisfaction was
dependent on a budget constraint based on the consumer income group. The
conclusion of the study was that when the regulator is effective, the annual gains from
the private operation of utilities were about US$ 3.3 billion, or 1.25 percent of GDP, and
that all income classes benefited. Ineffective regulations cut the gain from the reform by
US$ 1 billion or 0.35 percent of GDP, representing an implicit tax of 16 percent on the
average consumer, paid direct to the owner of the utility rather than to the government.
For the poorest income classes, the implicit tax was 20 percent, showing that good
regulation is in the interest of the poor.
The study also showed that privatisation of the utilities could not be blamed for
the significant increase in unemployment observed in Argentina since 1993. That
effective regulation could lead to a decline in unemployment, and that ineffective
regulation led to only a small increase in unemployment. That the gains from utility
privatisation were not sufficient to offset the negative efficiency and distributional impact
on the economy which increased unemployment dramatically by limiting access to credit/
for users and producers alike.
Argentina having been a leader in the matters of designing regulatory agencies
Presented a learning point. There Estache (1997), based on the experience in the
30

studies done on the Argentinean privatisation, came up with a design of regulatory
institutions for infrastructure. The design came up with four essential principles for a
good regulatory agency, which were independence, autonomy, expertise and
accountability. The study concluded that the greatest challenge to designing a
regulatory agency are in achieving political independence and establishing rules to
ensure regulatory accountability. The study therefore concluded that, those regulatory
agencies in Argentina founded on the above principles, were very successful while
others were not.
2.4. Overview of the Literature
Both the theoretical and empirical literature review indicates strong arguments for
and against privatisation. The proponents of private ownership argued that markets are
more efficient and allocate resources better than the state. That private ownership
removes joy riders and brings efficiency due to focused claimant of profits and efficient
allocation of resources. This argument can be traced from Smith (1776) to latter Neo
classical Property Rights School theorists. Empirical researchers including studies
undertaken through the auspices of the World Bank and IMF associated the poor
performance of the state enterprises to public ownership. One such studies in Africa
showed that, in West Africa 60 percent of SOEs posted losses while 36 percent had
negative net worth (Debebe, 1993). Empirical evidence through Todaro (1992) works
showed that SOEs absorbed considerable amount of resources resulting to heavy
burdens to the African economies.
The protagonists of privatisation have argued that transfer of a public monopoly
to the private sector has a worse effect to the general public in terms of economic
31
efficiency. That the resource allocation efficiency envisaged through market systems
can only succeed if there are no externalities; no public goods; and no monopolies. That
efficiency is not purely associated with private sector as evidenced in countries like
France, Austria, Taiwan and South Korea where the governments put enormous
pressure on the public enterprises to be efficient.
The work by Todaro (1992) gave two solutions for resolving burden created by
SOEs to the African economies: reorganization with a greater bottom line focus (case
for China); and/or transfer of ownership to the private sector (case for privatization).
However, this study noted that privatization raised many questions ranging from
feasibility, financing, legal and role of competing elites and interested groups.
The literature reviewed shows that adoption of privatization in most of the
developing countries was not subjected to critical analysis. Many of these countries
adopted privatization as a tool for promoting economic development purely based on
prescription given by the World Bank and the IMF without any analysis of the social and
economic effects; and without laying any mechanism to undertake the process.■ 4 ^
Institutions and legal structures which should have been created to ensure coordinated
process were in most countries ignored. Empirical evidence based on the study on the
impact of privatization of the major utility companies in Argentina, (Chisari, Estachie and
Romero, 1997) demonstrated this fact as it showed that where adequate regulations
were not put in place the expected gains were reduced considerably./
% \
In this study, the effect of privatization to the consumers welfare, investigated the
degree to which the process achieved its intended purpose. The study focus was on the
consumers’ welfare contributed by the two major export commodities, coffee and tea,
32

since the country embarked on liberalisation and privatization of the various sectors of
the economy. Further, the study investigated the process of privatisation as
implemented in Kenya. Additionally, the study suggested how the process of
privatisation could be modified to achieve optimal consumers’ welfare. Finally, the study
drew policy implications from the findings and learning from the privatisation process
implemented.
/\
33

CHAPTER THREECONCEPTUAL FRAMEWORK AND
METHODOLOGY3.1. Introduction
This study, as noted in the previous chapters was to assess the impact of
privatisation to the Kenyan economy in general and welfare of Kenyans in particular
based on the coffee and tea farming communities in Kirinyaga District. Section 3.2
discusses the conceptual framework adopted in this study; and section 3.3 analyses the
methodology used in undertaking this study.
3.2. Conceptual Framework
To assess the full impact of privatisation in the economy, there was need to use
macroeconomic social accounting matrix model for interactions among sectors (see
Chisari, Estachie and Romero, 1997). The idea was to assess the performance of these
sectors under private sector operations against how they performed under the state
control.
The concept of this study was to assess the improvement or otherwise of the
consumers’ welfare during the period of the study based on the farming community in
Kirinyaga District of the two major export commodities of coffee and tea. This is the
period soon after most of the measures on privatisation of the coffee and the tea sectors
had taken place. Hence it was important to assess the growth pattern of these two
commodities, as a measure of improvement of the welfare of the farmers.
34

3.2.1. Conceptual Growth Model
Based on the arguments advanced by the proponents of privatization as
analysed in chapter two, the liberalization of coffee and tea in Kenya would have been
expected to bring to the fore positive effects to the economic growth of the country.
Thus there is a relationship between the rates of growth (r) for each of these
commodities to the GNP growth factor. Assuming the growth rate factor for each of the
commodities is represented by (1+r), interpreted to mean that the income generated by
coffee or tea will grow from year 0 by 1+r to year t1t the growth equation can be written
as follows (Gujarati, 1992):
C!r = Cl0( l + r ) f ............................................................................................ (3.1)
where
Clt is the gross revenue from tea or coffee for the country in period (t);
CI0 is the gross revenue from tea or coffee for the base year assumed for this
study; and
(1 + r ) r is the growth rate factor for the period t.
3.2.2. Conceptual Consumer Utility Maximization Model
To assess the impact of privatization to the welfare of the people, a utilityI
maximization model was constructed. The* utilities of the consumers are modelled as a
Cobb-Douglas function between various selected goods with the utility maximization
Problem for the consumer (Chisari, Estache and Romero, 1997) function as:
UNIVERSITY OF NAIROBIHAST AFRICAN A COLLECTION
35KT.NYA T 7 A MEMORIAL
t fd & A P v■ j a v a

U ,=u[c, Y , lJ ......3.3
Subject to the following budget constraint
A c + AT +W + R + N 1 = X iPj + I iPi = Y .........................................................................3.4
Where
Ul = the utility maximization level of a given household in a given time.
C = the aggregate of goods and services consumed by a household.
Y = disposable income available to the household.
I = disposable income invested by the household.
Ac = household net income earned from coffee farming activities
Ar = household net income earned from tea farming activities.
W = household income earned from employment in both government and private sector.
R = household rent income earned from rented capital to the government and the
private sector.
!N = Profits earned by the consumer from investment activities.
= the /4h good or services bought by the consumer
Pi = Price of / h investments by the consumer.
P j- Price o ff h good or services bought by the consumer.
The price of goods and services are assumed to be market determined and\
therefore are exogenous. Therefore, with the purchasing power of the household for
Period t limited to the available disposable income represented byF,, the problem is to
Maximize the utility of the household for each year given the budgetary constraint. The
36
3.2.3. Definition and measurement of variables
• Total aggregate income earned from coffee (Cl) measured in Kenya Shillings.
• Total aggregate income earned from tea (Tl) measured in Kenya Shillings.
• The aggregate growth rate (r) measured in percentage terms.
• Consumer’s utility (Ui ) measured in proportionate quantity of goods or services
the consumer would consume in a given period.
• The quantity of goods and services consumed measured (C) in units (for
example goods measured in absolute units and services measured in hours).
• The disposable income available to the household (Y) measured in Kenya
Shillings.
• The disposable income invested by the household (I) measured in Kenya*
Shillings.
• The income earned by the consumer within a household (W) measured in Kenya
Shillings.
• The rent income from the capital rented to the productive sectors by the
consumer (R) measured in Kenya Shillings.
• The prices of investments (p,) measured in Kenya Shillings./
. \• The prices of all other domestic goods and services {pjj measured in Kenya
Shillings.
change in utility satisfaction by the household over the period assisted in assessing the
increase o r decrease in its welfare.
37
Shillings.
3 .3 . Study Design
To assess the changes in consumer welfare, it meant that incomes and
consumption habits of the people, over the study period were to be analysed. The study
focus was on measuring the effect on the consumers welfare resulting from the
privatisation of the two major agricultural sectors of the Kenyan economy (tea and
coffee), centred on the farmers in Kirinyaga District. Therefore, the study involved
analysing the farmers incomes arising from the two commodities over the study period,
and also taking into consideration other incomes from businesses, employment,
investments in properties and newly privatised firms, and any other income.
Additionally, the study was to analyse the expenditure pattern of the farmers given their
budgetary constraints occasioned by their sources of incomes.*
To collect the data from the field, a questionnaire, attached as appendix two, was
designed for use by the research assistants. The main focus of the questionnaire was to
collect the data from the tea and coffee farmers, firstly on production and income data
from the two commodities, and then from other income generating activities. The next
level of the questionnaire was to collect data on farmers consumption habits, covering
both normal and luxury goods. The farmers were also interviewed on the reasons
contributing to the changes in their incomes from the tvyo commodities.
To complement the field data, additional national data was collected from the
Kenya National Bureau of Statistics (KNBS). This included the national production and
income data of tea and coffee over the study period. The data gathered was used for
• The profits earned by the household on investm ents (N1) m easured in Kenya
38

developing the growth model associated with these commodities over the study period,
additional data required to complement the field data, which were collected from KNBS,
included prices of consumer goods and inflation data.
3.3.1. Sampling Techniques and Sample Size
The study as explained above was centred in Kirinyaga District within the tea and
coffee zones. The sampling technique was based on getting a number of farmers
growing tea only, some coffee only and a mixture of both. The research assistants
visited the tea and coffee factories whereby, based on the records of the farmers, they
randomly picked those to be interviewed and questionnaire completed. Before
undertaking the interviews with the farmers the research assistants firstly collected the
farmers’ production and payment records at the factory level where available.
Thereafter they visited the farmers and confirmed the details including gathering data on
other income earning activities.
The sample size initially selected was for twenty farmers. However some of
those selected did not have adequate data and others were not available to give any
information to the research assistants. Finally the sample was reduced to cover eight
farmers, but well spread in the two zones, for tea and coffee.
3.3.2. Data Sources and Types
The data collected through the field questionnaires was the sample income/\
(coffee, tea, employment, rent, business, and other incomes), and expenditure pattern,
of eight respondents distributed between tea and coffee, tea only and coffee only
growing zones in Kirinyaga District (table 8 Appendix 1). Additional information collected
39

included comments by the farmers on major issues related to the liberalisation and
management of the tea or coffee sectors, which may have contributed to increase or
decline in production of these commodities. Further, they also commented on their
consumption habits and why they may have changed in a particular direction.
Average prices of selected consumer bundle of goods were analysed from the
statistical abstract published by the KNBS (table 9 Appendix 1). In addition annual
weighted average index of goods and services published by KNBS (table 10, Appendix
1), for use in deriving the consumers’ prices for the various bundle of goods at constant
prices shown in table 11 were analysed. Finally gross marketed production of coffee
and tea at constant (1982) prices (table 2), covering the study period were collected
from the statistical abstract published by the KNBS.
Due to the time period covered by the model and with most of the household
unlikely to know the exact incomes earned from the various sources, available data like
crop production, were used to estimate average incomes from the farming activities,A
while type of work and organization worked for, were used to estimate the income from
employment. Available published statistics were used to estimate the household income
earned from the particular economic activity. The distribution of the disposable income
amongst the various goods and services were based on the estimated proportions given
by the households during the interviews.
3.4. Estimation Techniques. \
The regression analysis has been used to determine the growth curve estimation
for each of the two commodities, tea and coffee, based on the total country production
data. Comparative statistics (Chians, 1984) based on the Lagrangian model was used
40

to determine the consumer utility satisfaction based on the sample data of farmers
earnings from coffee, tea and other incomes during the study period. These techniques
are analysed in the following subsections.
3.4.1. Growth rate for Coffee and Tea
Equation 3.1 and 3.2 were used for the estimation of the economy growth rate
contributed by coffee and tea earnings respectively. Regression analysis was used to
estimate the growth rate of these two commodities. To estimate the two equations using
regression analysis, they were converted to semilog model as follows:
CIt = Clod + r y ............................................................................................(3.5)
Take the natural log on both sides to obtain the following equation in logarithmic
form:
In CIt = In Cl0 + tln ( l + r)
.............................................................................. ............. (3.6)
Let bi = lnC\0 and b2 = ln ( l + r), then the above equation can be expressed as a
linear regression model as follows:
In CIt =b{ +b2t + u,..............................................................................................(3.7)Where ^,is the error term.
Similarly the linear model for tea was estimated as above with the following% \
resultant model:
In 77, =c] +c2t + u,.................................................... .......... ..............................(3.8)
41

3.4.2. Consumer Welfare
Equation 3.3 and 3.4 were used for the estimation of the consumer welfare. The
goods and services included in the model were based on the respondents’ indication of
how they spent their incomes. Included in the model were foodstuffs, clothing, school
fee and others which could vary between luxury goods like beer, cigarettes and
communication. The model estimated the demand function for the consumers based on
the disposable income for a household earned from coffee and tea or any one of them
plus other incomes from employment, rental, business, and investment.
From equation 3.3, the utility function is estimated by the following equation:
U t = ................................................................................................................... (3.9)
Subject to the following budgetary constrain:
FtPft + StPst + CtPct + FTPflt = Yt ................................................................ (3.10)
With Y, made up of Cl, +77, + EI, + RI, +BIt -\-OIand where:
Fr= Quantity of foodstuffs demanded by the household in period t
5r= Quantity of school fee demanded by the household in period t
Cr= Quantity of clothing demanded by the household in period t
Quantity of all other goods and services demanded by the household in/% \
period t
Cl, = Net Coffee income earned by the household in period t
77, = Net tea income earned by the household in period t
42

El, = net income earned from employment in period t
RI, = net income earned from rental of property in period t
BI, = net income earned from business operations in period t
01,- Other net incomes earned from farming, dividends or other activities by the
household in period t
Pf, = average prices ruling for the foodstuffs in period t
Ps, = average school fee paid by the household per child in period t
Pc, - average price of clothing spent by a household in period t
P/u,= average other prices for all other goods and services in period t
Y, = total income of the household in period t
To develop the comparative statistics (Chians, 1984), the following Lagrangian
expression was set up based on the above utility function:
As the first-order condition, the following sets of simultaneous equations are
developed:
Z = U(F,S, C,ft) + a (Y - FPf - SPs - CPc - plPu (4.7)
yx = y - FPr - sps - cpc - ^ = o }
}\
dZ = Us - APs = 0 } (3.11)dF
43

}
I £ « 0 , - A P „ - O .......................... }
The above model is mathematically complete because it contains five equations
with five variables which can be solved simultaneously. The prices of the goods and
services were exogenous and the goods and services demanded by the household
were endogenous. Assuming the satisfaction of the second-order sufficient condition,
the comparative statistics properties of the model were analysed on the basis of the
above first-order condition shown in equations 3.11, viewed as a set of equations P = 0
(/ = 1,2,3,4,5), where each P function has continuous partial derivatives. The
endogenous variable Jacobian determinant of this set of equations has the same value
as the bordered Hessian, or \J\ =|/7|. As such when the second-order condition is met,
\ j| must be positive and it does not vanish at the* initial optimum. Therefore the implicit-
function theorem is applicable and as such the optimal values of the endogenous
variables were expressed as implicit functions of the exogenous variables:
A=A(Pr ,PstPc,Pfl.Y)......... }
F = F{Pf f PSlPc,P^,Y)......... }
t
S = S(Pr ,Ps,Pc.Ph.Y)..........j .......................................... (3.12)
C = C(Pf .Ps,Pc,P^,Y).........}
aJ - = U c - A P c = 0
44

/7 = f i ( P r , P s , P c , P ^ . Y ) }
Functions 3.12 possess continuous derivatives from which comparative statistics
information was analysed. The derivatives of the second to fifth functions of equations
3 .12 which showed the equilibrium level of foodstuffs, school fee, clothing and other
goods and services demanded by the household, gave over the period, the reaction of
the consumer to the changes in prices and available budget. To find these derivatives
equations 3.12 was converted into a set of equilibrium identities as follows:
y - FPf - SPs -CPc - fiPtl sO ..........}
ur (F, s, c, rO - *Pr = o........... }
Us(F, 5. C, iO - APS =0................................................. }.(3.13)
Uc (F, 5, C, fi) - APC = 0........... }
U„(F, 5, C, fi) - APf( = 0........... }
Taking the total differential of each identity in turn, and allowing every variable to
change, the linear system arrived at was as follows:
- P fd F - PsdS - PcdC - Pudfi = FdP( + SdPs +Cd?( + pd?t - dY
-P fdX + U f f dF + U fsdS + U fcdC + U ft ldp =~?dPf I• \
—PM?. + U SfdF + + U :cdC + [Jsud fi- ?-dPs (3.14)
-P<d? + U CfdF + U^fi’5 + Uf f rfC + U Cildx4= ?dP(
45

- P Md X +U ̂ f d P + U ^ + U*fdC+U ̂ d f i =
A key component of this study was to assess the effect of the household’s
budget size caused by the changes in earnings over the period of the study. To do this
the changes in prices were held constant, or rather it was assumed that Pf =
d?i = d?c - dPa = 0, but keep dY * 0. After dividing the above equations with dY, and
interpreting each ratio of the differentials as a partial derivative, matrix equations were
solved as follows:
- P idF /dy o
(3.15)
0
-r,
-p.
-P i2
%U./uf/
- p ,
U„u
- p ,u - tu „
U/*
U„Uw U„J
CJ u c<
' dX/dy' T ’dF /dy 0ds/dy = 0d c /d y 0dji/dy. -0 -
Using the Cramer’s rule, the changes in the equilibrium quantities of the goods
and services (dF/dy, ds/dy, dc/dy, dji/dy) demanded by the household, were solved
over the study period as the income levels changed:
dfdy 171
££dy
1_IJl
0 1 -Ps -Pc -p *- p/ 0 U „ U / c
-Ps 0 u„ uJf U,,-Pc 0 u„ U cc Uc„- p . 0 u * U„„
0 -P f 1 -p f- P f % 0 u/f-Ps u * 0 u„ U3»-Pc v<r 0 ucf u,*-p * U uf 0
-P.-Pc-P-,
1nr
-p ,-Pc-p .
U5SU „V
u ,fU Cfu*.
■Pf Uff 'U / c
u sf uu cf uu uf U
u,«U „ U
U?<!uIT
(3.16)
(3.17)
46

d_C_dy
d±dy
0 - p f- P f U f f-Ps V-Pc Ur/- p * V
0 - pf~ pf U //- Ps V-Pc U c-P u V
-P3U/,U„
-P ,
U/,
1 - A0 U0 u fK0 U C«
0 U u *
-P c 1
V f ' 0
U ,c 0
U cr 0
U W 0
17?
1
ITT
- P f % U /«
- P s u
- P c V U « i
~P* V U « ,
- A d Ur* U/eA V U5f-Pc V u «- p * V U«c
(3.18)
(3.19)
Under normal circumstances, the results of the above models would mean that
as the budget of the household increases the optimal purchases F, S, C, and fi
increase. An increase in demand as the income increases would mean a normal good
and a decrease being an inferior good. However in this study, this was not true as the
households included in this study were on average below middle income group. This/
means that satisfaction of the consumption levels of the goods selected were far from
being adequately covered based on their income levels. Hence, an increase or
decrease on demand as income increased or decreased represented increase or
decrease in the total welfare of the household.
/\
47

CHAPTER FOUR EMPIRICAL FINDINGS
4 /1 . Introduction
This study focused on two major export commodities (coffee and tea) which
accounted for the largest share of Kenya’s export earnings. As stated in sub-section
1.1.5, when Kenya embarked on privatization in early 1990s no legal mechanisms were
put in place to govern the process. Each sector or organisation adopted its own
programme with no formal regulations or control. For the two commodities included in
this study, though they were both under the Ministry of Agriculture, the privatisation
programmes adopted for each were diverse with far reaching differing results. The
model therefore traces the liberalisation and privatisation process of these two
commodities, and their performance in terms of growth and changes in welfare of the
farmers six years after the liberalisation/ privatisation of the sectors.
In this chapter therefore, the empirical findings resulting from this study wereA
analysed in relation to the three objectives stated in section 1.5. Section 4.2 analyses
the results arrived at from the growth model for the two commodities. Section 4.3
analyses the results arising from the consumer utility model. Each of the four objectives
of the study are addressed based on the empirical findings from these analysis.
4.2. Growth Model Analysis
The regression analysis described in section 3.4.1 was used to estimate the
growth model for the two commodities, tea and coffee, based on their gross national
production for the period 1995 to 2006. Table A.2 shows the gross incomes of the two
commodities for the period used to estimate the natural log, forming dependent variable.
48

assuming that the usual assumptions of OLS are satisfied the semilog models shown in
equations 3.7 and 3.8 were estimated for each of the commodities as explained in the
ensuing subsection.
4.2.1. Coffee Sector Growth Model
The growth rate associated with coffee revenue was estimated from the data
given in table 2, and by equation 4.1 as follows:
In Cl, = Z>, + b2t + u,...........................................4.1
lrTc/j = 7.845 - 0.058t
t = (58.145) (-3 .1 7 7 ) 1^=0.502
The negative slope coefficient of -0.058 means that the gross national revenue
earned from coffee income had a negative growth rate of 0.058 (or 5.8 percent) per year
over the study period. The graphical representation of the model is as shown in Figure*
4.1 below:
/\
r
49

Figure 4.1: Coffee Growth Model
------Growth-------LinearO Observed
Figure 4.1 above shows graphically the trend in coffee growth which was
negatively sloped over the study period indicating that the coffee production impacted
negatively to the GNP over the study period. This means that the incomes of the coffee
farmers declined in real terms over the study period, impacting negatively on the
consumer welfare.
These results are confirmed by the sample farmers incomes from coffee shown% \
in Table A.3. Despite the income figures in table A.3 being stated at that year’s value of/
money, the coffee incomes decline was quite significant, meaning that the farmers
purchasing power declined, with a negative effect to the consumers welfare.
50

Empirical evidence gathered from the study indicated that, the causes for the
decline in the coffee performance since the liberalisation were, irregular payments; low
prices; inputs were no longer availed at reasonable prices; general red tape and
management problems; no field extension services were available; coffee millers
disproportionately licensed; quota marketing system of coffee removed; more factories
constructed without regard to the economy and effectiveness; and political interference
with the management of the coffee societies.
The information gathered from the farmers during the research underpinned the
argument given by Newthorn et al (1993) that efficiency of an enterprise is not purely
dependent on the private sector ownership. That it is related more to the political
economy of the state intervention.
Therefore looking at the history of coffee liberalisation, the results and the poor
performance of the sector was to a large extent attributed to the process, rather than
problems which would have been brought about by privatisation. Liberalisation and
reforms on coffee started well before 1992 with the producers being allowed to retain
part of their proceeds in foreign currency retention accounts. These reforms were
followed by the liberalization of the producer cooperative societies which saw
segmentation of former large societies divided into small units. At the same time coffee
milling was deregulated and farmers were at liberty to choose their millers. The
marketing of coffee however, continued to be controlled by the Coffee Board of Kenya
with all coffee sales through the Nairobi Coffee Exchange auction but with no effective
protection to the weakened producer units.
51

When all this was happening, hardly were the laws amended or changed to take
care of the new situation. Hence the management of the dismembered units had no
controls which made the situation already aggravated by the declining world coffee
prices worse. The coffee farmers’ incomes deteriorated much more as empirical
evidence through this research shows.
4.2.2. Tea Sector Growth Model
Similarly the growth rate associated with tea revenue was estimated from the
data given in table 2 and analysed using the model equation 4.2 as follows:
In 77, = c, + c 2t + u, .............................................4.2
lnTTf = 8.401 + 0.029t
t = (161.982) (4.078) r2 =0.622
The positive slope coefficient of 0.029 means that the gross revenues earned
from tea had a positive growth rate of 0.029 (or 2.9 percent) per year over the study
period. This indicates that tea farmers incomes had real income growth over the period,
though marginally. The graphical representation of the tea growth model is shown in
Figure 4-2 below:
I
\
52

Figure 4.2: Tea Growth Model
Figure 4-2 showed graphically the trend in tea growth which was positively
sloped over the study period indicating-that the tea production had a positive impact to
the GNP over the study period. This was in tandem with the information gathered from
the field interviews with the tea farmers, whereby they were positive about the
liberalisation of the tea sector. The farmers indicated that the good performance was
attributable to the independence of the factories, whereby control was removed from the
Kenya Tea Development Authority (KTDA), to a board of directors directly elected by« \
the farmers; tea SACCOs introduced which assisted the farmers in affordable financing
of their activities; tea cess management returned to the individual factories and hence
its efficiency usage in improving the tea roads infrastructure thus reducing production
53

costs; good management accountable to the farmers through their elected directors;
and lack of political interference as the laws governing the growing and management of
tea had been amended with government direct control of the tea growing removed and
the role of the Tea Board of Kenya as a regulator enhanced.
These sentiments of the farmers, and the good performance of the sector, had its
bearing to the liberalisation/ privatisation measures undertaken. The liberalization of the
tea sector took slightly different turn from that of coffee, due to the presence of KTDA,
which despite being an authority was almost operating independently from the
government direct control even before formal privatisation exercise was undertaken.
The tea liberalization started in 1992 when the government decontrolled the
prices of packaged tea and followed this with a complete deregulation of the tea trade in
the country. However due to lack of coordinated polices and law governing the
liberalization and privatization, the tea sector also had a share of this confusion. Before
the formal deregulation of the tea trade and before the PERP policy paper wasA
published in 1992, the government appointed a probe committee to look into the
operations of the KTDA, which gave recommendations as to how the organization could
be improved. The probe committee published its report in January 1992 whereby it
recommended among others the strengthening of the government control in both KTDA
and the factory companies. Before the report could be implemented, the government
succumbed to the demands of the World Bank and IMF and published the PERP policy/
paper, whereby KTDA was classified as one'of the 33 strategic public enterprises to be
restructured and be retained under government control.
54

The government therefore, contracted Coopers and Lybrand Management
Consultants to propose the reforms/restructuring KTDA could be subjected to for
conformity with the policy guidelines. The consultants published their report in August
1992 with far reaching recommendations for the restructuring of the KTDA. Among
other recommendations, the report proposed that KTDA be completely dismantled and
in its place be established regional tea companies (RETCOs) to be the key operational
units for the smallholder tea farmers. Then KTDA and other tea players in the industry
would provide management services to these RETCOs. These recommendations were
contested by the KTDA management who foresaw this as a way of weakening the
strong production grip KTDA had in the global tea trade and as such leaving the farmers
at the mercy of a strong marketing cartel then controlled 70 percent by Unilever
(Republic of Kenya, 1995).
Based on these developments the government of Kenya through the World Bank
financing commissioned a comprehensive study for the tea sector in 1995 which
recommended the various restructuring proposals for the players in the sector including
the KTDA and the Tea Board of Kenya. Among the major recommendations KTDA was
to be strengthened as private institution owned by the farmers and the Tea Board be
strengthened as a regulator of the whole industry. The implementation of the report to
restructure the tea sector, had a direct effect to the increased production of tea as
shown in table 2. It also proved that if privatisation is well implemented and proper
regulations set, its results would be positive (Chisari, Estache and Romero, 1997)./—/
'
55
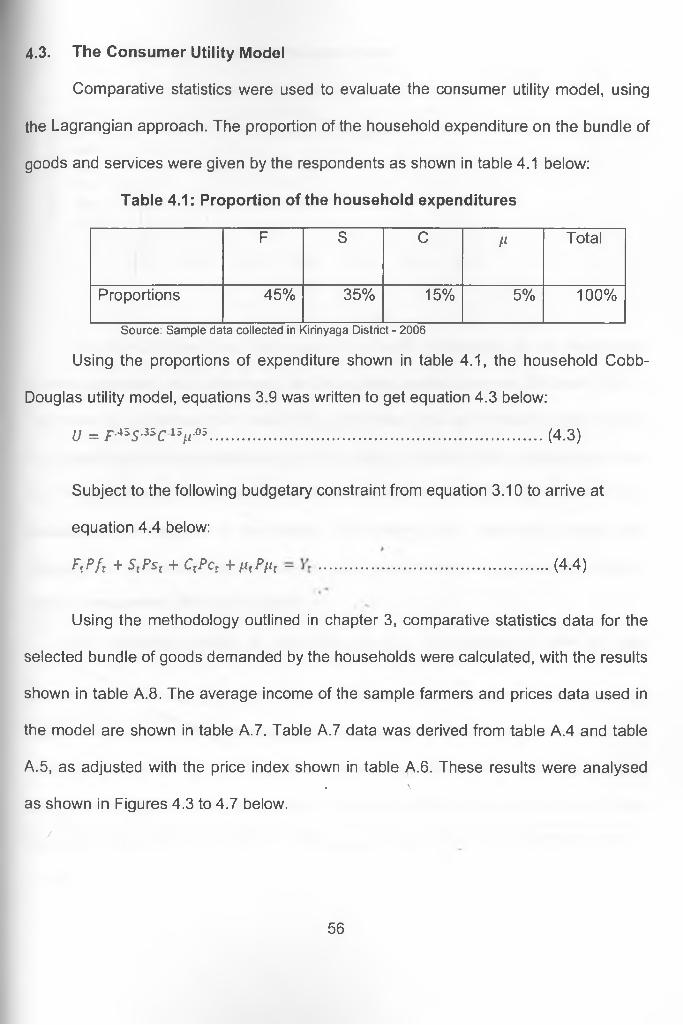
Comparative statistics were used to evaluate the consumer utility model, using
the Lagrangian approach. The proportion of the household expenditure on the bundle of
goods and services were given by the respondents as shown in table 4.1 below:
4.3. The Consumer Utility Model
Table 4.1: Proportion of the household expenditures
F S C P Total
Proportions 45% 35% 15% 5% 100%
Source: Sample data collected in Kirinyaga District - 2006
Using the proportions of expenditure shown in table 4.1, the household Cobb-
Douglas utility model, equations 3.9 was written to get equation 4.3 below:
U = f Als3SClsfi'05........................................................................... (4.3)
Subject to the following budgetary constraint from equation 3.10 to arrive at
equation 4.4 below:
Fr^/r 4- StPsl 4- CzPct + f-tfPPt ~ ....................................................(4-4)
Using the methodology outlined in chapter 3, comparative statistics data for the
selected bundle of goods demanded by the households were calculated, with the results
shown in table A.8. The average income of the sample farmers and prices data used in
the model are shown in table A.7. Table A.7 data was derived from table A.4 and table
A.5, as adjusted with the price index shown in table A.6. These results were analysed% \
as shown in Figures 4.3 to 4.7 below.
/
56
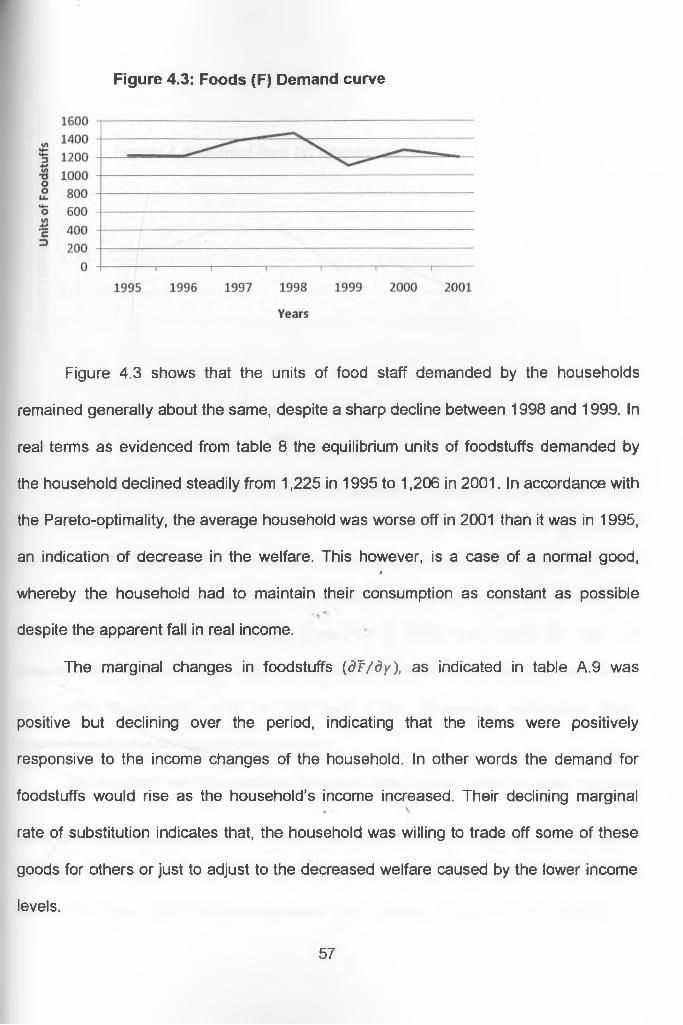
Figure 4.3: Foods (F) Demand curve
Figure 4.3 shows that the units of food staff demanded by the households
remained generally about the same, despite a sharp decline between 1998 and 1999. In
real terms as evidenced from table 8 the equilibrium units of foodstuffs demanded by
the household declined steadily from 1,225 in 1995 to 1,206 in 2001. In accordance with
the Pareto-optimality, the average household was worse off in 2001 than it was in 1995,
an indication of decrease in the welfare. This however, is a case of a normal good,*
whereby the household had to maintain their consumption as constant as possible
despite the apparent fall in real income.
The marginal changes in foodstuffs (df/dy), as indicated in table A.9 was
positive but declining over the period, indicating that the items were positively
responsive to the income changes of the household. In other words the demand for
foodstuffs would rise as the household’s income increased. Their declining marginal
rate of substitution indicates that, the household was willing to trade off some of these
goods for others or just to adjust to the decreased welfare caused by the lower income
levels.
57

Figure 4.4: School fees (s) Demand curve
Figure 4.4 shows that the equilibrium number of children a household could
afford to pay school fee for declined substantially from 1995 to 2001, unlike the case for
the food staff. Table from 8 shows that the number of children the household could*
afford to take to school declined from 4 in 1995 to 3 in 2001. In accordance with the*4 ̂
Pareto-optimality, the household was worse off in 2001 than it was in 1995, an
indication of decrease in the welfare. The sharper decline of the school fee relative to
food stuffs (figure 4.3), could be attributed to the households substitution effect
necessitated by declining purchasing power.
The marginal rate of substitution for school fees (dS/dy) shown in table A.9, was/, \
negative and increasing over the period, indicating that it was negatively responsive to
the income changes of the households. In other words the household would demand
less of school fees as the income increases. The increasing marginal rate of substitution
58

0f school fee indicated that the households are willing to trade off other goods for these
aS the income decreased.
Figure 4.5: Clothing (C) demand curve
Like the case of the school fee, figure 4.5 shows that the demand for clothing
also declined considerably between 1995 and 2001. As indicated in table 8, the/
equilibrium units of clothing a household could afford declined from 9 pairs per annum in*
1995 to 6 in 2001. Again in accordance with the Pareto-optimality, the communities* 4 ^
were worse off in 2001 than they were in 1995. Again, this is a case of luxury goods,
whereby the consumer substituted clothing for foodstuffs to take care of the declining
real incomes.
The marginal changes in clothing (dl/dy), as indicated in table A.9 was positive
but declining over the period, indicating that they were positively responsive to the. \
income changes of the household. In other words the demand for clothing would rise as
the household’s income increased. Their declining marginal rate of substitution indicates
59
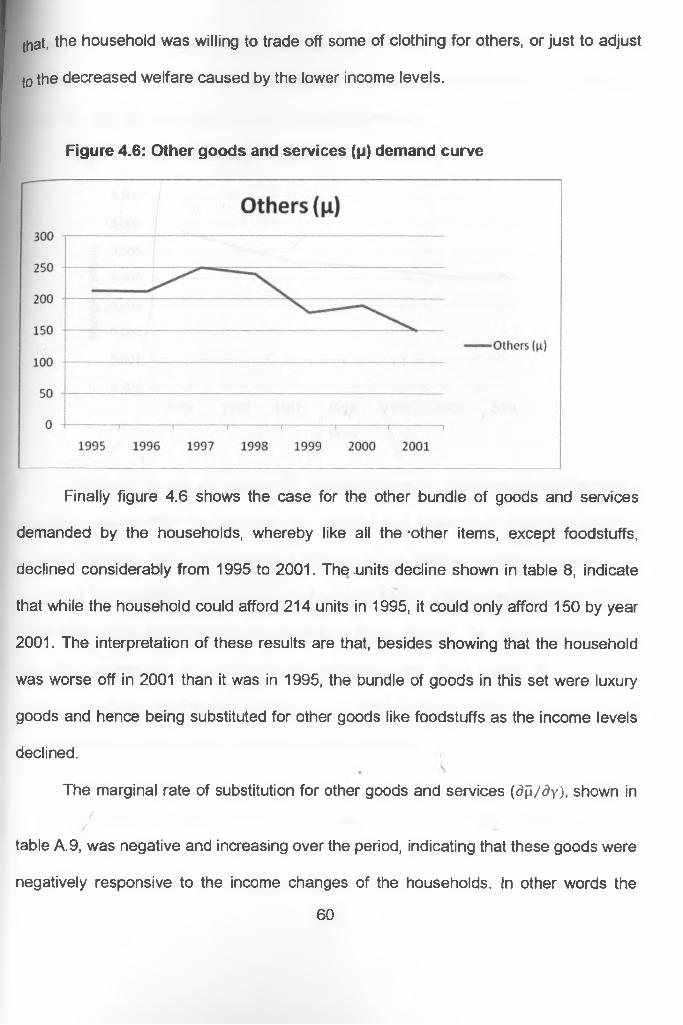
that, the household was willing to trade off some of clothing for others, or just to adjust
t0 the decreased welfare caused by the lower income levels.
Figure 4.6: Other goods and services (\i) demand curve
Finally figure 4.6 shows the case for the other bundle of goods and services
demanded by the households, whereby like all the 'other items, except foodstuffs,
declined considerably from 1995 to 2001. The .units decline shown in table 8, indicate
that while the household could afford 214 units in 1995, it could only afford 150 by year
2001. The interpretation of these results are that, besides showing that the household
was worse off in 2001 than it was in 1995, the bundle of goods in this set were luxury
goods and hence being substituted for other goods like foodstuffs as the income levels
declined.
The marginal rate of substitution for other goods and services (dji/dy), shown in/
/table A.9, was negative and increasing over the period, indicating that these goods were
negatively responsive to the income changes of the households. In other words the
60

household would demand less of these items as the income increased. The increasing
marginal rate of substitution of other goods indicated that the households are willing to
trade off other goods for these as the income decreased.
Figure 4.7: Multiplier Factor (A) curve
Figure 4.7 shows the Lagrangian multiplier curve dropping throughout the period
between 1995 to 2001, an indication of decline in the household utility. This confirms
results observed from the demand functions of the various bundles of goods. The* 4 ^
results of this analysis is that the tea and coffee farmers’ welfare declined from 1995 to
2001 despite the liberalisation/ privatisation of these sectors. The marginal increase in
revenues earned by tea as previously discussed were more eroded by the loss of
income resulting from the poor earnings from coffee and other sectors of the economy,
resulting on the communities being on average worse-off./\
. y/ •••• -- • ~ .......
61

CHAPTER FIVESUMMARY, CONCLUSION AND POLICY
IMPLICATIONS5.1. Summary
The overall objective of this study was to assess the degree to which privatisation
has achieved the intended purpose, with specific objectives of the study being to
investigate its contribution to the consumers’ welfare, and the appropriateness of the
process. Based on the findings the study was to suggest how the process could be
modified to achieve optimal consumers’ welfare.
Privatization in Kenya was mooted way back in 1979 but no serious efforts were
made by the government to refine the process and legislate relevant laws to govern the
process. The required programme design and preparation exercise were not
undertaken which resulted into haphazard implementation process. Therefore the two
sectors included in this study underwent different processes in the design and
implementation of the privatization process, with differing results achieved.* 4 ^
Coffee liberalization process started well before 1992 with no particular
programme design or coordination of the process. The first part of the liberalization
process was to allow the producers to retain part of their proceeds in foreign currency.
The second part was the segmentation of former large societies which were divided into
small units. The third part of the process was to deregulate the milling in 1993 with the/
farmers allowed to choose their own millers independently, or through their coffee
societies. Finally in 2001/02 on the operationalization of the Coffee Act 2001 the coffee
marketing and regulation roles were separated, with the Coffee Board of Kenya (CBK)
62

retaining the regulatory role while the marketing function was given to the marketing
agents.
Empirical findings indicated that, since privatisation process of the coffee sector
started, its performance had been on the decline. The main causes given by the farmers
for the decline in its performance since the liberalisation were, irregular payments; low
prices; inputs were no longer availed at reasonable prices; general red tape and
management problems; no field extension services were available; coffee millers
disproportionately licensed; quota marketing system of coffee removed; more factories
constructed without regard to the economy and effectiveness; and political interference
with the management of the coffee societies.
The reasons given for the poor performance of the coffee sector underpinned on
the privatisation design and implementation process, which were never thought out
properly nor coordinated. Evidently, the regulatory function, though said to have been
retained with the CBK, the essential elements of a good regulator, of independence,
autonomy, expertise and accountability were lacking in the organisation. Therefore the
resultant effect of all these reforms were to increase the number of middle men in the
coffee chain without increasing the coffee earnings leading to the decline of the farmers’
incomes.
The tea liberalization started in 1992 when the government decontrolled the
prices of packaged tea and followed this with a complete deregulation of the tea trade in% y
the country. However despite the initial lack of coordinated polices on the process, the
tea sector substantially overcame the problems after the management of the Kenya Tea
Development Authority rejected the original proposals for the privatisation of the sector
63

vs/hich would have seen it go in the direction of the coffee sector. As a result, through a
World Bank financing, a comprehensive study for the sector was undertaken, which
defined and articulated the privatisation process including its implementation.
Empirical evidence shows that the tea sector privatisation results, were improved
performance of the sector with production growing and the real incomes to the farmers
increasing. These favourable results, as confirmed by the farmers interviewed, were
due to the independence of the factories; tea SACCOs introduced which assisted the
farmers in affordable financing of their activities; tea cess management returned to the
individual factories and hence its efficiency usage in improving the tea roads
infrastructure thus reducing production costs; good management accountable to the
farmers through their elected directors; and lack of political interference as the laws
governing the growing and management of tea had been amended with government
direct control in tea growing removed and the role of the Tea Board of Kenya as a
regulator enhanced. This evidently confirmed the findings of Chisari, Estache and
Romero (1997) that where the privatisation process was articulately followed and the
regulatory authority strengthened the gains were positive.
Empirically the overall consumers’ welfare declined as the results of the study
show. On average the incomes of the households declined in monetary and real terms
as shown in table A.7. The optimal quantity of the various goods and services
demanded by the households declined. As such the welfare of the consumer was worse/in 2001 than it was in 1995.
64
5.2. Conclusions
In conclusion, empirical findings indicate that the sectors where privatisation
process including its implementation were well thought out, contribution to the consumer
welfare was positive; while if the process was haphazardly designed and implemented,
the results were negative. Therefore the tea sector performed well and the real incomes
to the farmers increased over the study period, while the coffee sector performed
decimally.
Overall the privatisation process in Kenya was poorly designed with most of the
programmes poorly implemented. This is evident from the combined performance of the
households, whereby the utility of the consumers went down with a total decrease in
welfare. As pointed out by White and Bhatia (1998), Kenyan privatisation was evidently
designed to be coordinated centrally by a privatisation agency reporting to a
government appointed committee, which lacked legal status and authority. Therefore
the privatisation lacked coordination, both from the design and implementation, resulting
in the poor performance of the economy as portrayed by the results of this study based
on the two commodities. - -
5.3. Policy Implications
Policy directions will require to be drawn to address some of the mistakes which
were made in the past. Based on the empirical findings of this study, the general
consumer welfare of the communities declined since privatisation was embraced in
Kenya. To reverse the situation, policies must be put in place to correct the past
mistakes so as to enhance the returns from the privatised sectors and those to undergo
the process in future. As the new privatisation law is implemented appropriate policies
65
will need to be put in place to ensure that the past mistakes are not repeated. In
addition there will be need to internalise the process and develop clear policies which
addresses the Kenyan problems.
To improve the farmers’ earnings from the privatised sectors of coffee and tea,
policies on production and marketing must be well thought out. Empirical evidence
shows that one of the reasons why the tea sector performed better than the coffee
sector was due to the privatisation process adopted. The tea sector adopted a process
which facilitated institutionalisation of economical production units and also
strengthened the regulatory function of the Tea Board of Kenya with adequate policies
to deal with the marketing of made tea. Therefore to collect the problems in the coffee
sector there is need for institutionalisation and strengthening of the dismembered
farmers’ cooperatives in the coffee sector to viable production units. In addition
strengthen the regulatory authorities to achieve independence, autonomy, expertise,
and accountability to deal with issues of oligopolistic and other monopolistic operations.*
Overall regulatory agencies should be institutionalised where none exist covering
well defined sectors. Where the regulatory authorities already exist, they should be
strengthened and their operational policies and procedures developed. The role and
breadth of each regulatory authority should be decided based on the key qualities of a
good regulator. In other words the appropriate decision on whether the regulatory
agencies should be industry-specific, sector-specific, or multi-sectoral should bet
analysed before institutionalisation of the each of the agency.
Key among issues which need to be reviewed as the new law is operationalised
is to have a study undertaken to assess the full impact so far on all sectors of the
66
economy which have been privatised so far. Stock of all remaining institutions to be
privatised should be taken and clear objectives set including collective measures to
correct adjustable mistakes caused by the unplanned privatisation. Regulatory
measures covering all areas which would be prone to private monopolies should be
analysed and the government ensure that strong agencies are put in place.
The next issue which need to be tackled is to develop a programme on
privatisation both for use in privatising the remaining institutions and to correct past
mistakes. The programme should include detailed methods of privatisation for each of
the sectors which should ensure maximum impact to the welfare of the Kenyans. The
operational policies and procedures should well be defined and gazetted for
harmonisation of the process.
5.4. Limitation of the Study and Areas of Further Research
The key limitation of this study was the research budget plus inadequate*
statistical data related to the newly privatised sectors in Kenya. The other key limitation
of the study was lack of readily available statistical data, which made it impossible to
undertake direct analysis of all the sectors of the economy and how they affect each
other taking into consideration the privatised sectors. As such key issues like effects on
employment and capital formation were not analysed.
There is therefore need to undertake a comprehensive study based on the input/
output matrix to fully analyse the impact of privatisation to the total economy.
67

References
Chians (1984): “Fundamental Methods of Mathematical Economics; International Edition - Published by McGraw-Hill, 1984.
Chisari, Estache and Romero (1997): 'Winners and Losers from Utility Privatisation in Argentina, Lessons from a General Equilibrium ModeT. The World Bank, Economic Development Institute, Regulatory Reform and Privatization Division.
Clarke and Pitelis (1993): “The Political economy of Privatisation"; Published by Routledge 11 New Fetter Lane, London EC4P 4EE.
Crampes and Estache (1996): “Regulating Water Concessions; Lessons from the Buenos Aires Concession" The World Bank Group, Note No. 91.
Estache and Rodriguez-Pardina (1996): “Regulatory Lessons from Argentina’s Power Concession". The World Bank Group - Note No. 92.
Estache (1997): “Designing Regulatory Institutions for Infrastructure - Lessons from Argentina”. The World Bank Group - Note No. 92.
Fekru Debebe (1993): “Privatisation in Sub-Sahara Africa: Origins, Trends and Influences on Development Strategies"; Center for Economic Research on Africa School of Business - Montclair State University.
Gujarati (1992): “Essentials of Economics". Published by McGraw-Hill Inc. 1992
Jhingan M.L. (2000): ‘The Economic of Development and Planning"; 33rd Revised and Enlarged Edition Published by Vrinda Publications (P) Ltd
* 4
Koutsoyiannis (1979): “Modern Microeconomics"; 2nd Edition Published by MacMillan Press Limited; Chapter 2 and 23.
Megginson et la (1994): ‘The Financial and Operating Performance of Newly Privatized Firms: An International Empirical Evidence"; The Journal of Finance, Vol. XLIX, No 2 June 1994.
Mitine G (2000): ‘The Privatization and Parastatal Reform Programme - Kenyan Experience”; A Paper Presented to the Government of Botswana During the Seminar to Launch the Privatization Policy for BQtswana Held in Gaborone on the 17th November 2000.
Republic of Kenya (1991): “Finance Bill - An Act of Parliament to amend the law relating to various taxes and duties and matters incidental thereto"; Printed and Published by the Government Printer, Nairobi.
68

Republic of Kenya (1992): “Policy Paper on Public Enterprises Reform and P riva tisa tionDepartment of Government Investments and Public Enterprises together with the Executive Secretariat and Technical Unit (1998 edition).
Republic of Kenya (2003): “Economic Recovery Strategy for Wealth and Employment Creation, 2003-2007”\ Prepared by the Government of Kenya, June 2003.
Republic of Kenya (2005): “Privatisation of State Corporations and Investments”; Sessional Paper prepared by the Government of Kenya, 2005.
Sarbib (1997): “Privatization in Africa: Present and Future Trends”; A paper presented to the African Development Bank Group 1977 Annual Meeting Symposium on "Private Sector Development In Africa".
Smith A (1776) “An Inquiry into the Nature and Causes of the Wealth of Nations, 1996 edition by Edwin Cannan”\ The University of Chicago Press, Chicago 60637, Pp348-349.
Todaro M P (1992); “Economics for a Developing World - an introduction to principles, problems and policies for development’’; 3rd edition at page 452-455.
Vickers and Yarrow (1988) Privatisation: An economic Analysis’, The MIT Press Cambridge, Massachusetts London, England, Chapter one.
Weyman-Jones (1993): Regulating the Privatized Electricity Utilities in the UK’, Published in the Political Economy of Privatisation Vol - pp 93-107.
White and Bhatia (1998): Privatisation in Africa” Published in the World Bank Journal.
i\
69
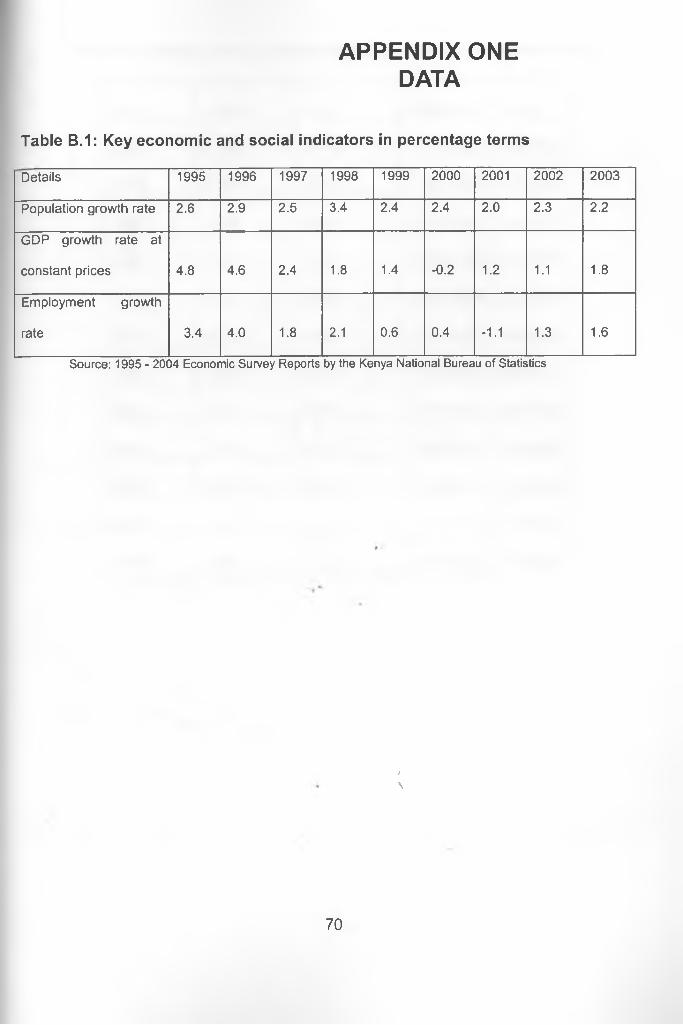
APPENDIX ONE DATA
Table B.1: Key economic and social indicators in percentage terms
Details 1995 1996 1997 1998 1999 2000 2001 2002 2003
Population growth rate 2.6 2.9 2.5 3.4 2.4 2.4 2.0 2.3 2.2
GDP growth rate at
constant prices 4.8 4.6 2.4 1.8 1.4 -0.2 1.2 1.1 1.8
Employment growth
rate 3.4 4.0 1.8 2.1 0.6 0.4 -1.1 1.3 1.6
Source: 1995 - 2004 Economic Survey Reports by the Kenya National Bureau of Statistics
/\
70
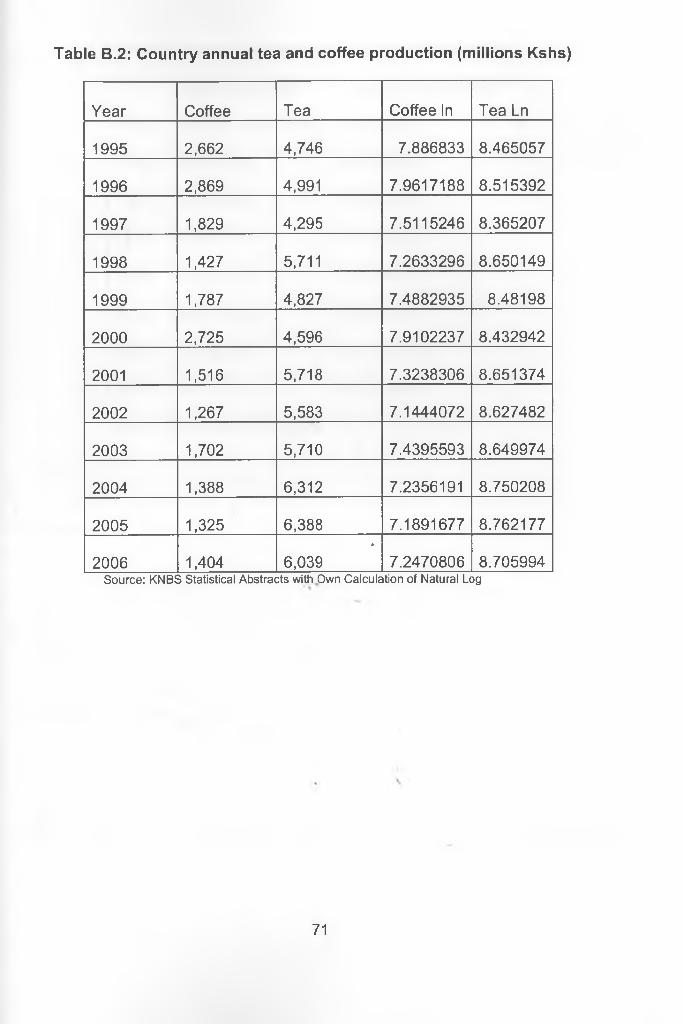
Table B.2: Country annual tea and coffee production (millions Kshs)
Year Coffee Tea Coffee In Tea Ln
1995 2,662 4,746 7.886833 8.465057
1996 2,869 4,991 7.9617188 8.515392
1997 1,829 4,295 7.5115246 8.365207
1998 1,427 5,711 7.2633296 8.650149
1999 1,787 4,827 7.4882935 8.48198
2000 2,725 4,596 7.9102237 8.432942
2001 1,516 5,718 7.3238306 8.651374
2002 1,267 5,583 7.1444072 8.627482
2003 1,702 5,710 7.4395593 8.649974
2004 1,388 6,312 7.2356191 8.750208
2005 1,325 6,388 7.1891677 8.762177
2006 1,404*
6,039 7.2470806 8.705994Source: KNBS Statistical Abstracts with Own Calculation of Natural Log
71
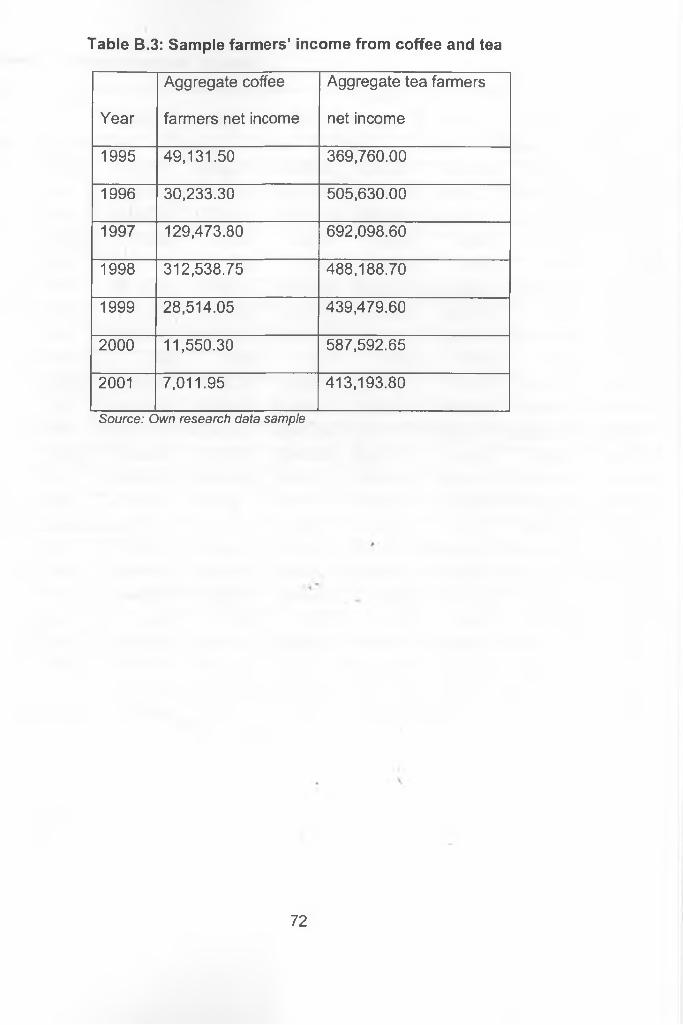
Table B.3: Sample farmers’ income from coffee and tea
Year
Aggregate coffee
farmers net income
Aggregate tea farmers
net income
1995 49,131.50 369,760.00
1996 30,233.30 505,630.00
1997 129,473.80 692,098.60
1998 312,538.75 488,188.70
1999 28,514.05 439,479.60
2000 11,550.30 587,592.65
2001 7,011.95 413,193.80
Source: Own research data sample
72

Table B.4: Sample farmers’ income
Type Year
of 1995 1996 1997 1998 1999 2000 2001
londents income Kshs Kshs Kshs Kshs Kshs Kshs Kshs
Coffee 14,647.70 12,436.75 69,436.00 79,326.25 4,061.90 3,370.50 1,968.75
Tea 65,280.00 104,100.00 150,921.85 111,984.10 87,596.25 140,200.30 97,959.60
1 Other 33,600.00 31,100.00 32,600.00 32,950.00 36,000.00 36,000.00 36,000.00
Coffee 704.40 770.50 294.75 782.00 787.80 308.85 0.00
Tea 0.00 0.00 0.00 0.00 0.00 0.00 0.00
2 Other 36,000.00 36,000.00 36,000.00 36,000.00 36,000.00 36,000.00 36,000.00
Coffee 7,644.60 2,102.75 7,667.20 26,101.50 3,886.95 1,113.10 650.00
Tea 85,460.00 104,870.00 122,344.75 73,917.05 72,483.25 112,151.90 77,520.20
3 Other 0.00 0.00 0.00 0.00 0.00 0.00 0.00
Coffee 6,248.40 4,214.25 14,532.80 13,222.75 1,414.35 1,806.00 1,263.75
Tea 31,640.00 51,050.00 91,203.25 78,386.30 37,503.45 17,000.75 30,973.00
4 Other 162,600.00 162,000.00 162,000.00 192,000.00 192,000.00 192,000.00 192,000.00
Coffee 6,692.35 1,771.70 4,960.60 16,533.25 536.40 269.90 850.00
Tea 8,230.00 27,640.00 57,690.05 29,414.75 12,582.00 26,726.45 19,137.80
5 Other 36,000.00 36,000.00 36,000.00 36,000.00 36,000.00 36,000.00 36,000.00
Coffee 11,710.40 7,839.00 26,088.20 , 49,138.75 1,517.30 1,841.50 837.50
Tea 117,690.00 137,100.00 163,130.30 147,612.75 187,468.75 212,871.45 122,790.40
6 Other 96,000.00 96,000.00 96,000.00 120,000.00 126,000.00 150,000.00 150,000.00
Coffee 597.00 205.00 1,215.85 1,195.00 3,313.60 254.25 16.95
Tea 0.00 0.00 0.00 0.00 0.00 0.00 0.00
7 Other 54,000.00 54,000.00 54,000.00 87,000.00 87,000.00 87,000.00 87,000.00
Coffee 886.65 893.35 5,278.40 126,239.25 12,995.75 2,586.20 1,425.00
Tea 80,870.00 80,870.00 106,808.40 46,873.75 41,845.90 78,641.80 64,812.80
__8 Other 72,000.00 72,000.00 72,000.00 72,000.00 108,000.00 108,000.00 108,000.00
73

Table B.5: Average prices of selected household goods
Year
Food Staffs Other
Beef
Cooking
fat Beans Flour
Maize
grains Rice Sugar Beer Kerosene
1995 106.67 51.31 31.88 15.96 12.58 33.21 40.5 36.17 17.04
1996 126.25 54.25 33.67 16.92 13.67 39.38 47.25 41 19.28
1997 134.17 52.28 61.36 21.5 19.34 37.47 44.77 43.67 21.76
1998 127.53 59.33 55.68 20.11 16.7 40.52 48.9 49.5 22.03
1999 142.43 62.04 51.21 22.06 19.79 43.4 44.77 51.25 24.82
2000 137.36 55.58 46.46 23.17 20.54 42.19 57.75 50.14 31.82
2001 142.82 45.13 41.9 18.12 15.59 32.36 51.76 53.96 34.74
Source: Kenya National Bureau of Statistics
Table B.6: Price index and average inflation rate
Period A verage Price Index A verage in flation rate
1995 82.41>
1.6
1996 89.84 9
1997 99.9 11.2
1998 106.53 6.6
1999 112.65 5.8
2000 123.86 10.0
2001 130.99 5.8
2002 133.56 2
2003 146.64 v 9.8
2004 163.6 11.6
2005 180.6 10.3
2006 206.7 14.5
74
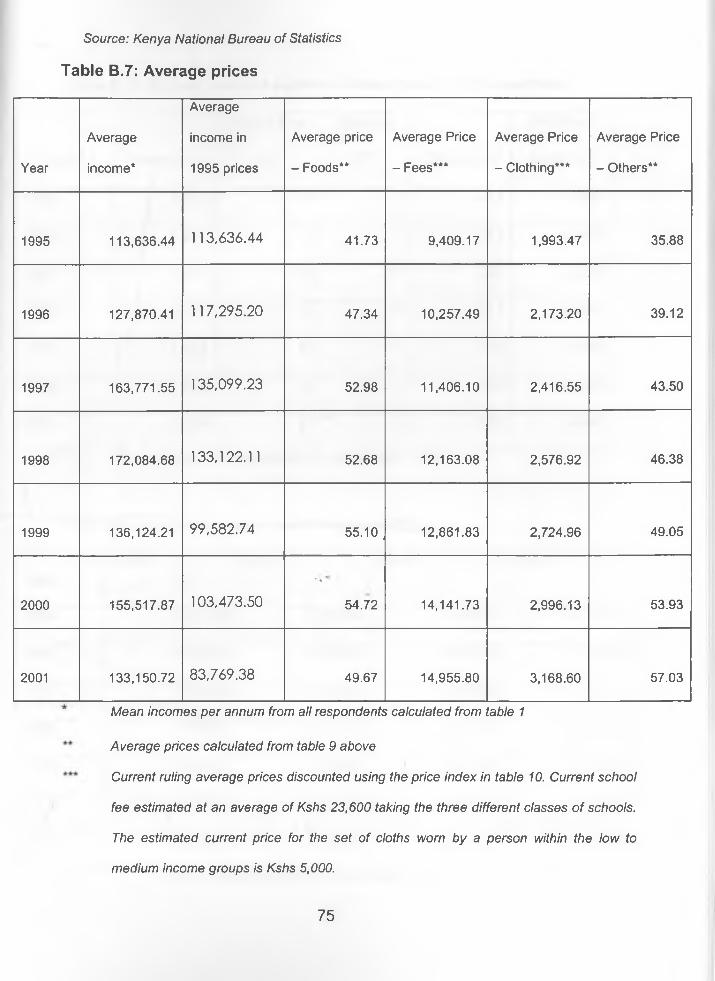
Source: Kenya National Bureau of Statistics
Table B.7: Average prices
Year
Average
income*
Average
income in
1995 prices
Average price
- Foods**
Average Price
- Fees***
Average Price
- Clothing***
Average Price
- Others**
1995 113,636.44 113,636.44 41.73 9,409.17 1,993.47 35.88
1996 127,870.41 117,295.20 47.34 10,257.49 2,173.20 39.12
1997 163,771.55 135,099.23 52.98 11,406.10 2,416.55 43.50
1998 172,084.68 133,122.11 52.68 12,163.08 2,576.92 46.38
1999 136,124.21 99,582.74 55.10 . 12,861.83 2,724.96 49.05
2000 155,517.87 103,473.50* 4
54.72 14,141.73 2,996.13 53.93
2001 133,150.72 83,769.38 49.67 14,955.80 3,168.60 57.03
Mean incomes per annum from all respondents calculated from table 1
Average prices calculated from table 9 above
Current ruling average prices discounted using the price index in table 10. Current school
fee estimated at an average of Kshs 23,600 taking the three different classes of schools.
The estimated current price for the set of cloths worn by a person within the low to
medium income groups is Kshs 5,000.
75

Table B.8: Optimal units of variables demanded by the households
Year Foods (F)
School Fee
(S)
Clothing
(C) Others (p)
Multiplier
factor (A)
1995 1,225 4 9 214 0.006
1996 1,215 4 9 212 0.005
1997 1,391 5 10 250 0.005
1998 1,470 5 10 241 0.004
1999 1,112 4 7 179 0.004
2000 1,279 4 8 190 0.004
2001 1,206 3 6 150 0.004
Source: Own calculation from the sample data - 2007
Table B.9: Marginal change in equilibrium quantities
Yeardf /dy dl /dy
'4 ' dc/dy dfi/dy
1995 0.01090 -0.00004 0.00008 -0.00141
1996 0.00988 -0.00003 0.00007 -0.00132
1997 0.00864 -0.00003 0.00006 -0.00117
1998 0.00854 -0.00003 0.00006 -0.00140
1999 0.00817 -0.00003 v 0.00006 -0.00131
2000 0.00822 -0.00002 0.00005 -0.00122
2001 0.00962 -0.00002 0.00005 -0.00120
Source: Own calculation from the sample data - 2007
76

APPENDIX TWO QUESTIONNAIRE
IMPACT OF PRIVATISATION AND PRASTATAL REFORM
QUESTIONNAIRE
A CASE STUDY FOR THE PROGRAMME IN KENYA
This questionnaire aims to collect data to facilitate completion of a Master’s degree in
Economics Project on the impact of Privatization and Parastatals Reform in Kenya. The
information obtained will remain confidential and will not be used for any other purpose.
Your cooperation in completing the questionnaire as accurately as possible will be
appreciated.
1. Personal details
i) Name*
ii) Gender Male |----- 1 Female - I----- 1
Age 20-30 | | 30-40 |----- 1 Over 40 |-----
iii) Highest Education level
No schooling |----- I Primary School qZD
Secondary School |----- I University j-__ I
I V ) Number in family I/
I
V) Head of Family Yes I___ I No CZZI •
77

2. Income details (Self and family if living in the same household)
Year Netearningsfromcoffee
Netearnings from tea
Employment
Rent on property
Incom e from busine ss
Dividends/otherincome
Total
1995
1996
1997
1998
1999
2000
2001
3. Coffee farming activities
a) Name of society _____________________________
b) No. of stems 1----- 1 Acreage under coffee ^
c) Indicate any changes in coffee farming activities since 1995:
V
78

d) Production details
Year Production in Kgs
Netpaymentreceived
Wagespaid
Cost of inputs
Netproceeds
1995
1996
1997
1998
1999
2000
2001
e) Major factors considered by the household as main contributors to the
success or otherwise in their coffee farming activities:
/4. Tea farming activities
a) Name of factory ____________________
b) No. of stems I----- I Acreage under tea

c) Indicate any changes in tea farming activities since 1995:
d) Production details
Year Production in Kgs
Net payment received
Wagespaid
Cost of inputs
Netproceeds
1995
1996
1997
1998
1999
2000
2001>
e) Major factors considered by the household as main contributors to the
success or otherwise in their coffee farming activities:
\
80
a) Salary and employers details
5. Employment income details
Year Employer Salaries/wages Remarks
1995
1996
1997
1998
1999
2000
2001
* * '
b) Comment on major employment changes over the period
81

6. Income spending details (Self and family if living in the same household)
a) Spending details
Year Totalincome
Total on normal goods/ services
Total on luxury goods/ services
Savings/Invested
Otheruses
1995
1996
1997
1998
1999
2000
2001
b) Details of normal goods and percentage of income spent
Year 1----------- 2--------- 3-------- 4-------- 5-------
1995
1996
1997
1998
1999
2000
2001
82

c) Details of luxury goods and percentage of income spent
Year 1 o__ n._____ AO — —
1995
1996
1997
1998
1999
2000
2001
7. Investment details
Year Total savings/
investment
Type of
investment
Rate
1995
1996
1997
1998>
1999
2000
2001
Thank you for your cooperation and contribution to this study.
John W Nguri
University of Nairobi
Faculty of Arts
Economics DepartmentU N I V E R S I T Y o f NAIROBI-AST AFRICANA COLLECTION
83
- N YA 7 TA ME.UQRUU