the effects of organizational structure on sustainability
TRANSCRIPT

Purdue UniversityPurdue e-Pubs
College of Technology Masters Theses College of Technology Theses and Projects
4-1-2012
The Effects of Organizational Structure onSustainability Report ComplianceKurt E. MinkPurdue University, [email protected]
Follow this and additional works at: http://docs.lib.purdue.edu/techmastersPart of the Environmental Health and Protection Commons, Environmental Indicators and
Impact Assessment Commons, Environmental Monitoring Commons, and the SustainabilityCommons
This document has been made available through Purdue e-Pubs, a service of the Purdue University Libraries. Please contact [email protected] foradditional information.
Mink, Kurt E., "The Effects of Organizational Structure on Sustainability Report Compliance" (2012). College of Technology MastersTheses. Paper 62.http://docs.lib.purdue.edu/techmasters/62

C o l l e g e o f T e c h n o l o g y
The Effects of Organizational Structure on Sustainability Report Compliance
In partial fulfillment of the requirements for the
Degree of Master of Science in Technology
A Directed Project Report
By
Kurt Mink
March 29, 2012
Committee Member Approval Signature Date Bruce A. Harding, Chair _______________________________________ ____________ Rodney G. Handy, Member _______________________________________ ____________ Gareth O’Donnell, Member _______________________________________ ____________
Purdue University West Lafayette, Indiana


iii
DEDICATION
To my amazing wife, Becky – for her unconditional love and support for all that I do.
To my father, Dereke – for providing me the guidance that has led to a fortunate life and
instilling in me the characteristics necessary to succeed. My success truly is your success.
To my brother, Brandon – for his unwavering support and influential view on life.
To my in-laws, Steve and Mary Jane – for gaining a son, not losing a daughter.

iv
ACKNOWLEDGMENTS
The amount of support and encouragement while conducting this research during
the past two years has been tremendous. There have been several individuals that played
an integral role in the completion of this research and I would like to acknowledge them
now. First and foremost, I would like to thank Professor Bruce Harding for recruiting me
into the Atlantis Program. The opportunity to not only pursue a concurrent master’s
degree program but also to travel abroad has been one of the most rewarding experiences
of my life. I would also like to thank Professor Harding, as my committee chair, for
providing guidance throughout the pursuit of this degree and for providing the
opportunity to gain valuable experience as his teaching assistant. I would also like to
thank my committee members, Dr. Gareth O’Donnell and Dr. Rod Handy, for providing
suggestions and mentorship that not only contributed to the development of my research
but also to my professional development.
I would also like to acknowledge all of those involved in the Atlantis program,
including the Principal Investigators from Purdue, the Dublin Institute of Technology,
and the Universitat Politècnica de Catalunya. Specifically, I would like to thank Gareth
O’Donnell, in his administrative role, for his unprecedented commitment to the success
of each student involved in the Atlantis program. I would also like to thank the Fund for
the Improvement of Postsecondary Education, (FIPSE), U.S. Department of Education
for its financial support, without which I would not have been able to complete the
Atlantis program.
Finally, I would like to thank my family and friends for supporting me through
this two-year journey. I would like to specifically thank my wife for her support and
sacrifices during my pursuit of this non-traditional masters program, which required a
considerable amount of time apart from each other.

v
TABLE OF CONTENTS
Page LIST OF FIGURES ……………………………………………………………………...vii
EXECUTIVE SUMMARY ……………………………………………………………..viii
SECTION 1. INTRODUCTION ………………………………………………………….1
1.1. Problem Statement……………………………………………………………...….1 1.2. Research Question ……………………………………………………………...….2 1.3. Scope ……………………………………………………………………………....2 1.4. Significance ………………………………………………………………………..3 1.5. Definitions …………………………………………………………………………4 1.6. Acronyms………………………………………………………………………..…5 1.7. Assumptions ……………………………………………………………………….5 1.8. Limitations …………………………………………………………………………6 1.9. Delimitations ………………………………………………………………………7 1.10. Summary………………………………………………………………………….7
SECTION 2. LITERATURE REVIEW…………………………………………………...8
2.1. The History of Sustainability Awareness ………………………………………….9 2.2. Sustainability Reporting Implications ……………………………………………10 2.3. Global Reporting Initiative ……………………………………………………….12 2.4. Objectives of Previous Research …………………………………………………14
2.4.1. Country-level Assessments …………………………………………………...14 2.4.2. Sector-level Assessments ……………………………………………………..15 2.4.3. Reporting-Framework Assessments …………………………………………..16 2.4.4. Acknowledging Additional Assessments ……………………………………..17
2.5. Methodology Justification ………………………………………………………..18 2.6. Summary………………………………………………………………………….19 SECTION 3. FRAMEWORK AND METHODOLOGY ………………………………..21
3.1. Research Framework …………………………………………………….……….21 3.2. Methodology……………………………………………………………………...23 3.3. Population and Sample Approach ………………………………………………..24

vi
Page 3.3.1. Industry Population …………………………………………………………...24 3.3.2. Sample Approach ……...……………………………………………………...25
3.4. Data Collection …………………………………………………………………...26 3.5. Summary………………………………………………………………………….27 SECTION 4. DATA AND RESULTS……………………….…………………………..28 4.1. Presentation of Survey Results …………………………………………………...29 4.1.1. Number of Employees ………………………………………………………..29 4.1.2. Perception of Sustainability Reporting within the Organization……………..30 4.1.3. Number of People Involved in Creating a Sustainability Report ...…………..31 4.1.4. Estimated 2010 Sustainability Report Budget ………………………………..32 4.1.5. Number of Sustainability Reports Created …….……………………………..33 4.1.6. Mediums Used to Disseminate a Sustainability Report .……………………..34 4.1.7. Sustainability Report Implementation Challenges ......……………………….35 4.1.8. Effects of Economic Uncertainty on Sustainability Reporting ...………….....36 4.1.9. Motivations for Voluntarily Reporting Sustainability ………………………..37 4.1.10. Initiating Sustainability Reporting....………………………………………..38 4.1.11. Advocating Sustainability Reporting…….………………………………….40 4.1.12. Sustainability Report Design and Implementation Responsibility ...………..41 4.1.13. Sustainability Report Final Approval ...……………………………………..42 4.1.14. Ensuring Indicator Response ………………………………………………..44 4.1.15. Other Keys to Sustainability Report Success …...…………………………..45 4.2. Discussion of Survey Results …………………………………………………….47 4.2.1. Management Philosophy ……………………………………………………..47 4.2.2. Resource Availability ……………………………………….………………..49 4.2.3. Market Incentives …………………………....…………………...…………..51 4.3. Summary………………………………………………………………………….52 SECTION 5. CONCLUSIONS AND RECOMMENDATIONS...………………………54 5.1. Conclusions ………………………………………………………………………54 5.2. Recommendations …...……...……………………………………………………57 LIST OF REFERENCES ….……………………………………………………………..60 APPENDICES Appendix A: Distributed Survey Questions ..…………………………………………63 Appendix B: Email Correspondence ………………………………………………….66 Appendix C: Short-Answer Analysis Method …...……………………………………67

vii
LIST OF FIGURES
Figure Page Figure 3.1. Schematic diagram of the theoretical framework used to evaluate
the characteristics associated with sustainability …………………………………….22 Figure 4.1. Number of employees employed by each organization……………………...30 Figure 4.2. Overall perception toward sustainability & sustainability reporting
(S&SR) in the organization …………………………………………………………..31 Figure 4.3. Distribution of the number of sustainability reports created using the GRI guidelines by the responding organizations …………………………………….33 Figure 4.4. Distribution of the mediums used to disseminate sustainability
reports (SR) …………………………………………………………………………..34 Figure 4.5. Main challenges associated with implementing a sustainability
report (SR)…………………………………………………………………………....35 Figure 4.6. The effect of economic recessions on sustainability report activity …………36 Figure 4.7. Motivations for voluntarily developing a sustainability report (SR) ………...37 Figure 4.8. Title of the individual responsible for initiating sustainability reporting (SR) within the organization ………………………………………………39 Figure 4.9. Title of the strongest advocate for sustainability reporting (SR) within the organization……………………………………………………………….40 Figure 4.10. Title of the individual with final approval authority for sustainability report publication ……………………………………………………...43 Figure 4.11. Method of ensuring core G3 and Sector Supplement indicators with due regard to the materiality principle ………………………………………….44

viii
EXECUTIVE SUMMARY
Mink, Kurt E. M.S., Purdue University, May 2012. The Effects of Organizational Structure on Sustainability Report Compliance. Major Professor: Bruce Harding.
The purpose of this qualitative research was to determine the organizational
characteristics that contribute to developing sustainability reports with GRI A+
application levels. Judgment sampling was used to select organizations that received an
A+ GRI application level in 2010. These organizations were then surveyed using a
fifteen-question survey, which emulated the semi-structured interview questions utilized
by Farneti and Guthrie (2007). The survey was disseminated to 107 organizations and the
responses were collated and analyzed to determine important themes relevant to this
research study. The results of this research study suggest a relationship between an
organization’s genuine commitment to sustainability by their leadership and a
sustainability report’s compliance level. Furthermore, this research also implies a
relationship between the stakeholders’ sustainability expectations and the sustainability
report compliance level. The combination of an organization’s leadership expressing a
genuine commitment to sustainability reporting, as well as the stakeholder’s expressing
expectations for sustainably promotes a sustainability-minded culture within the
organization, which facilitates sustainability report production. Also, the compliance
level of an organization’s sustainability report is contingent upon the organization’s
ability to overcome resource constraints and to recognize the value of the market
incentives generated by the development of a sustainability report. The implications of
this research provide a global, multi-industry benchmark for organizations struggling
with sustainability reporting compliance, government policy-makers, and stakeholders.

1
INTRODUCTION SECTION 1.
This research study delves the growing field of sustainability reporting in order to
aid in the advancement of sustainability reporting efforts. This section defines the
research problem statement, presents the research question, outlines scope, and
establishes significance. This section also presents a list of definitions, abbreviations,
assumptions, limitations, and delimitations to be utilized in this study.
1.1. Problem Statement
A growing number of research studies have engaged in a comparative analysis in
search for the level of sustainability reporting quality among countries, companies, and/or
organizations. The majority of these research studies utilize the Global Reporting
Initiative (GRI) guidelines as the referenced sustainability reporting tool due to its
reputation as the world’s leading set of guidelines and the standard in many sectors
(Fonseca, Macdonald, Dandy, & Valenti, 2010). The results from this like-minded
research contributed significantly to the foundational knowledge necessary to cultivate
sustainability reporting tools from infancy. Moreover, 79% of the largest 250 companies
worldwide generated a distinct corporate responsibility report in 2008 compared to 52%
in 2005 (KPMG, 2008). With the number of organizations reporting sustainability
measures rapidly increasing, the question has become a matter of why and no longer a

2
question regarding what organizations are reporting (Farneti & Guthrie, 2007). In other
words, the question has become “Why are organizations more likely to develop a
sustainability report than others?” More specifically, one may ask, “Why are
organizations more compliant than others at sustainability reporting?” Cognizance as to
why organizations are more compliant at sustainability reporting can prove beneficial to
several entities, including: sustainability reporting organizations struggling with report
compliance, developers of standardized sustainability reporting tools, policy-makers, as
well as others.
1.2. Research Question
This research study investigated which organizational characteristics contribute to
developing sustainability reports that are exceptionally compliant1 with the GRI reporting
framework. In determining specific characteristics that cultivate exceptionally compliant
sustainability reports, a more concentrated sustainability reporting effort may be
implemented by industry members, sustainability reporting framework developers, and
policy-makers.
1.3. Scope
Recognition of the advantages and significance of sustainable development
induces countries, companies, and organizations to increase sustainability activities and
1Exceptionally compliant refers to a sustainability report with a GRI A+ application level, which is defined in Section 1.5.

3
reporting. The purpose of this research was to investigate which organizational
characteristics contributed to developing sustainability reports that were exceptionally
compliant with the GRI reporting framework. Organizations considered the most
compliant in sustainability reporting during 2010 were ascertained and surveyed to
determine the association(s) between organizational characteristics and the compliance
level of sustainability reports. Primary data was collected through surveys with 21
organizations, based on the semi-structured interview questions and methodology of
Farneti and Guthrie (2007). Secondary data from sustainability databases, provided by
firms, such as KPMG International, the GRI, etc., were utilized to supplement research
efforts. Discerning the characteristics that were associated with exceptionally compliant
sustainability reports provided insight as to why organizations were more compliant than
others at sustainability reporting.
1.4. Significance
Disparate research was necessary in order to effectively identify the root cause
contributing to the variance in sustainability report compliance. Organizations that are
struggling to comply with the GRI reporting framework can benefit from this research by
identifying their infrastructural discrepancies when compared to the responses of the
organizations with A+ GRI sustainability reports. Also, this research allows organizations
that have already achieved A+ sustainability reports to determine the areas of greatest
impact for creating compliant reports. Furthermore, the organizations with an A+
sustainability report can identify which characteristics of their organization are the most
value-added to their sustainability reporting efforts. Armed with this knowledge, the

4
organization can then focus efforts and resources to these areas of high-value creation.
This research can also benefit standardized sustainability reporting frameworks (such as
the GRI) by providing guidance to improve sustainability indicators, which can
potentially increase the framework’s industry relevance. By determining these important
organizational characteristics, policy-makers and stakeholders can understand why
certain organizations are struggling in sustainability reporting efforts. The policy-makers
and stakeholders are then able to implement policies to incentivize greater compliance in
sustainability reporting. In summary, this information can act as a benchmark or set of
best practices for organizations struggling with sustainability reporting compliance,
government policy-makers, and stakeholders.
1.5. Definitions
A+ GRI sustainability report – a sustainability report submitted to the GRI that meets the
highest level of reporting criteria and has been externally assured (GRI, 2006).
KPMG – firm that specializes in audit, tax, and advisory services (KPMG, 2008).
organization – broad term that refers to a company within any industry sector.
primary data – data that is directly collected by the researcher in order to conduct the
current research (Sekaran & Bougie, 2010).
secondary data – data that has previously been collected that is used to conduct the
current research (Sekaran & Bougie, 2010).
semi-structured interview – structured interview that allows interviewee to speak freely
without guiding constraints. (Farneti & Guthrie, 2007).
5
stakeholders – “include those who are invested in the organization (e.g., employees,
shareholders, suppliers) as well as those who are external to the organization (e.g.,
communities).” (GRI, 2006, pp.10).
sustainability reporting – “the practice of measuring, disclosing, and being accountable
for organizational performance while working towards the goal of sustainable
development. A sustainability report provides a balanced and reasonable
representation of the sustainability performance of the reporting organization,
including both positive and negative contributions.” (GRI, 2007, G3 Guidelines).
sustainability – "meets the needs of the present without compromising the ability of
future generations to meet their own needs" (WCED, 1987, pp. 43).
1.6. Acronyms
BSC – balanced score card
CSR – corporate social responsibility
GRI – Global Reporting Initiative
TBL – triple bottom line
SR – sustainability report
1.7. Assumptions
The assumptions for this study included:
• There was utility in researching the characteristics that facilitate the
generation of A+ GRI sustainability reports.

6
• All participants were available and willing to take part in the survey process.
• The participants selected to take part in this study were the most appropriate
individuals to answer the survey questions.
• All participants answered honestly and accurately during the survey process
without organizational reserve or bias.
• The research framework and methodology were sufficient to answer the
study’s research question.
1.8. Limitations
This study was limited by the following factors:
• This study was limited to organizations that submitted a sustainability report
to the GRI in 2010 with an A+ application level.
• This study was limited by the availability and accuracy of the contact
information provided within publicly available sustainability reports.
• This study was limited by the participants’ willingness to partake in the survey
process.
• This study was limited to the sustainability reports that were available in
English.
• This study was limited but the sustainability reports developed by
organizations specifically in the regions of Europe, Oceania, and North
America.

7
1.9. Delimitations
The delimitations for this study included:
• The industrial sectors not associated with A+ GRI applications in 2010.
• The ability of the GRI application level to accurately reflect sustainability
report compliance.
• The quality or content of the organizations’ sustainability report.
1.10. Summary
This section has outlined the research study, including the problem statement,
research question, scope, and significance. This section has also presented a list of
definitions, acronyms, assumptions, limitations, and delimitations. The next section will
present an overview of the literature review conducted for this research.

8
LITERATURE REVIEW SECTION 2.
Although sustainability and sustainability reporting are relatively novel concepts,
their global consideration and materiality have contributed to a significant volume of
literature being produced. In order to prudently select literature germane to the current
research question, the researcher acknowledged the notion that relevant research has three
central functions: to solve a problem, to fill a gap in previous research, and/or to replicate
prior research results. To determine which concepts, methodologies and research results
are fundamental to the sustainability field, the researcher evaluated articles and
determined common threads of information found among the mass of literature. The
citations associated with key pieces of information throughout each article were noted
and served as the next piece of work to be reviewed. Common threads where found and
served as the metaphorical trunk of the sustainability movement with the occasional
research breakthrough that created branches of ideas and information.
This section is a culmination of the researcher’s review of prior work and includes
a brief history of sustainability awareness, implications of sustainability reporting,
information regarding the GRI, description of previous research, and a justification of this
research study’s methodology.

9
2.1. The History of Sustainability Awareness
The genesis of the sustainability movement is often traced back to the early 1960s.
Specifically, Rachel Carson’s book Silent Spring, which was published in 1962, acted as
a catalyst for the environmental movement (Sherman, 2001). Silent Spring raised
concerns regarding the use of chemical pesticides by the general public and large
corporations; however, this piece’s most important contribution was the propulsion of the
relationship between environmental, economic, and social issues to the forefront of
public and political agendas for the first time (Sherman, 2001). During the 1960s and
1970s, several environmental awareness campaigns and conferences were held resulting
in the formation of environmental government agencies (National Environment Agency,
2004) including the founding of the Environmental Protection Agency (EPA) on
December 2, 1970 (EPA, 2011). With the influx of environmental agencies and
subsequent research, awareness of issues impacting the environment escalated rapidly.
The effects of chlorofluorocarbons, volatile organic compounds, nitrous oxide, carbon
dioxide, and deforestation on the environment were emerging topics of research
conducted throughout the 1970s and 1980s (National Environment Agency, 2004).
Along with the release of Carson’s Silent Spring, one of the most influential
pieces of literature regarding sustainability is the United Nation’s World Commission on
Environment and Development (WCED) report titled Our Common Future. In 1987, Our
Common Future was released and transformed the perception of the relationship between
economic, environmental, and social sustainability by linking the latter two concepts in
terms of the former (McMichael, 2008). Prior to Our Common Future report,
environmental and social sustainability were considered threats to economic

10
sustainability. In other words, the practice of environmental and social sustainability was
thought to detract from economic sustainability. Our Common Future insisted that
environmental and social health positively impact economic health, which thereby
encourages sustainable development (Azapagic & Perdan, 2000; McMichael, 2008). The
impact of Our Common Future on the sustainability movement is analogous to the impact
Vannevar Bush’s Science: The Endless Frontier had on the advancement of research after
WWII.
During the 1990s to today, the sophistication of sustainable development has
augmented mainly through increased awareness and the use of sustainability tracking and
reporting tools. In 1992, the Earth Summit, with 120 world leaders and representatives
from 150 countries in attendance, accepted Agenda 21, which provided a roadmap to
ensure future sustainable development (Azapagic & Perdan, 2000). Following the
adoption of Agenda 21, sustainability tracking and reporting tools such as the ISO 14000
series, GRI sustainability reporting guidelines, and the Dow Jones Sustainability Index
have increased sustainable development participation and accountability (Bernhart, 2009;
Lozano & Huisingh, 2011; Woods, 2003).
2.2. Sustainability Reporting Implications
Sustainability activity is mainly driven by governmental regulation; nevertheless,
the act of making sustainability activities transparent via sustainability reports is
predominately completed on a voluntary basis. In general terms, a voluntary program
must support economic growth in order to be commonly adopted in the for-profit sector.
More specifically, sincere sustainable development and sustainability reporting must

11
economically align with an organization’s business model; otherwise, only a façade or
minimal amount of sustainable activity will transpire.
Organizations have been heavily criticized for treating sustainability reporting as
a marketing ploy rather than a sincere effort to sustain economic, environmental, and
social growth (KPMG, 2008). However, genuine sustainability reporting has increased
due to the realization that consumers recognize organizations that are truly sustainable
and reward those organizations with their business (Business in the Community, FTSE
Group [FTSE], & Insight Investments, 2005). Other factors, including organization
embarrassment due to unethical behavior, have encouraged operational transparency
through sustainability reporting (KPMG, 2008; Business in the Community, FTSE, &
Insight Investments, 2005). According to KPMG’s 2008 international survey of corporate
responsibility reporting, over 50% of the largest 250 companies worldwide (G250)
expressed ethical and economic considerations, brand value, innovation and learning, and
employee motivation as the main reasons for developing a sustainability report. Other
reasons to develop sustainability reporting include increases in sustainable development,
organizational integrity and reputation, stakeholder inclusiveness and materiality, gaining
competitive advantage, and cost savings through decreased resource consumption
(Business in the Community, FTSE, & Insight Investments, 2005; GRI, 2006; KPMG,
2008; Skouloudis, Evangelinos, & Kourmousis, 2010).
The aforementioned implications are illustrated in Michelle Bernhart’s case study
(2009) on Vancity, a financial institution located in Vancouver, British Columbia.
Vancity initiated a unique program called “Bike Share” that provided 45 bicycles
throughout the city for general public use. This initiative alone created a 300% return on

12
investment and dramatically increased the organization’s website activity. Over a three-
year period, Vancity experienced a 20% increase in branch membership due to the
emphasis on social and environmental growth (Bernhart, 2009).
Value creation through sincere sustainability efforts is a concept that produces
meaningful results with respect to economic, environmental, and social sustainability.
The full capacity to which an organization may stimulate economic growth through
environmental and social initiatives is not wholly comprehended. However, consumer
spending accounts for roughly 70% of the U.S.’s Gross Domestic Product (GDP)
(Goodman, 2009) and 65% of the U.K.’s GDP (MacDonald & Thomson, 2011), which is
an encouraging indicator of value creation potential.
2.3. Global Reporting Initiative
In 1997, the Boston, Massachusetts based Coalition for Environmentally
Responsible Economics (CERES) founded GRI in hopes of developing a standardized
sustainability reporting framework (GRI, 2010). The GRI reporting framework is used to
report the sustainability activities that transpire in the economic, environmental, and
social aspects of organizational operations. After a partnership with the United Nations
Environment Programme (UNEP) was established in 1999, a set of pilot guidelines was
released to only 20 sustainability-reporting organizations. The first generation of official
guidelines was released in 2000 and a second generation (G2) of revised guidelines was
released in 2002, along with the relocation of GRI headquarters to Amsterdam in the
Netherlands. After implementing a substantial amount of industry and professional
feedback, the current generation of guidelines (G3) was released in 2006 with a set of

13
sector supplements that continually increase in sector specificity. The indicators in which
organizations report sustainability activity are disaggregated into two groups of indicators,
core and sector specific, which provide breadth and depth comparisons. In other words,
the core indicators are intended to provide a means to generically compare sustainability
activities globally and the sector specific indicators provide a more in-depth means to
compare within specific sectors of industry (GRI, 2010).
The G3 Guidelines rely on four fundamental principles in order to define report
content: materiality, stakeholder inclusiveness, sustainability context, and completeness
(GRI, 2006). In order to accommodate the varying levels of sustainability maturation
among organizations, GRI Guidelines allow for incremental guideline application. The
G3 Guidelines differentiate between levels of application by assigning corresponding
letters ranging from A to C. Level A application represents the highest level of
compliance to G3 Guidelines, followed by level B and level C. By completing external
assurance, organizations can further increase the level of application, which is
represented by appending a plus sign (+). For example, if an organization was fully
compliant with the G3 Guidelines and solicited external assurance, the organization
would receive an application level of an A+ (GRI, 2006).
Since the inception of the GRI, sustainability reporting has exponentially
increased with nearly 1800 sustainability reports being published in 2010 (GRI, 2010). In
2008, 69% of the 100 largest companies by revenue (N100) and 77% of the G250 used
the GRI framework to develop sustainability reports (KPMG, 2008). The GRI’s
commitment to continuous guideline improvement and materiality, as well as its
reputation as the standard sustainability-reporting framework for industry, has established

14
itself as the discernible instrument for reporting sustainability and completing future
research.
2.4. Objectives of Previous Research
The majority of sustainability reporting research can be classified into three main
categories: country-level assessments, sector-level assessments, or reporting-framework
assessments. However, it should be noted that the research spanned across multiple
category classifications but was generally weighted towards a singular, distinct category.
Each type of sustainability reporting research classification has utility in the sustainability
field. Therefore, the literature reviewed had an equal distribution of each of the above
categories.
2.4.1. Country-level Assessments
Country-level assessments, such as those completed by Skouloudis, Evangelinos,
and Kourmousis (2010), KPMG (2008), and Gallego (2006), focus on the quality of
sustainability reporting within a particular country or among several countries.
Sustainability reporting quality of the country of interest is deduced by assessing the
degree of sustainability report disclosure with respect to a particular reporting framework.
The most common reporting framework used to benchmark country-level sustainability
reporting was the GRI framework.
For example, the drivers for sustainability reporting, as well as the benefits and
quality of reporting, were assessed among corporations in Greece (Skouloudis,

15
Evangelinos, & Kourmousis, 2010). The results of this assessment illustrated that the
expectations of stakeholders – including corporate transparency and accountability-
motivate corporations to report sustainability. Also, the propensity of Greek corporations
to selectively comply with GRI indicators (opposed to holistically complying to all
indicators) led to fragmented reports with varying degrees of disclosure (Skouloudis,
Evangelinos, & Kourmousis, 2010).
Gallego (2006) reported similar results for Spanish firms, alluding to the
disclosure of differing levels of economic, environmental, and social indicators. Although
Spanish firms have increased the quantity and quality of sustainability reports, the
disclosure of adverse environmental indicators remained negligent (Gallego, 2006).
KPMG’s 2008 report, International Survey of Corporate Responsibility Reporting,
highlighted 22 countries regarding their sustainability reporting. The underlying trend
among the 22 countries was that every country reported to a varying degree of
compliance. This common thread of disclosure fragmentation and quality variation within
the sustainability reporting community creates not only reporting discord at the country-
level but also at the global-level.
2.4.2. Sector-level Assessments
Sector-level assessments, such as those completed by Fonseca, Macdonald,
Dandy, and Valenti (2010), Guthrie and Farneti (2008), and Lamprinidi and Kubo (2008),
have similar intentions as country-level assessments, with the differentiating
characteristic being the unit of analysis. As implied by the name, sector-level assessments
focus specifically on either the private or public sector. The distinction between public

16
and private sectors lies in the classification of ownership: public sector organizations are
government owned entities where as private sector organizations are privately owned.
The majority of sector-level assessments concentrate on the compliance of private sector
sustainability reporting, as implications of sustainability reporting (refer to Section 2.2)
are more accurately aligned with private sector business models. However, the GRI’s
perspective regarding public sector reporting is one that acknowledges the public sector’s
unique position as “significant employers, providers of services, and consumers of
resources” (GRI, 2005, p. 7) that can also benefit from the plethora of implications
associated with sustainability reporting.
Guthrie and Farneti (2008) investigated seven Australian public sector companies
with regards to the extent and type of sustainability reporting disclosure. All seven
organizations evaluated in this study claimed to use the GRI framework for sustainability
reporting guidance; however, only 32% of the GRI indicators were used congruently by
all organizations, once again indicating fragmented reporting practices. Similar results
have been reported with respect to Canadian universities (Fonseca, Macdonald, Dandy, &
Valenti, 2010), and public agencies worldwide (Lamprinidi & Kubo, 2008).
2.4.3. Reporting-Framework Assessments
Reporting-framework assessments, such as those completed by Lozano and
Huisingh (2011) and Labuschagne, Brent, and Erck (2003), focus on the evaluation of
sustainability reporting frameworks. The reporting frameworks under evaluation are
typically selected based on their shortcomings perceived by the researcher with the
intention to propose a novel, more relevant reporting framework. For example, Lozano

17
and Huisingh (2011) evaluated three private sector companies, two from Mexico and one
from the United States, in order to determine the degree to which sustainability reporting
takes into account the synergistic relationship between the economy, environment, and
society. It was determined that the evaluated companies report heavily on economic,
environmental, and social issues but fail to take into account the synergy that exists
between these components of sustainability. After determining this fundamental
inadequacy of current reporting frameworks, the researchers concluded by
acknowledging the need for a more comprehensive framework (Lozano & Huisingh,
2011).
Additionally, after speculating that four prominent sustainability-reporting
frameworks lack industry relevance, Labuschagne, Brent, and Erck (2003) proposed a
new framework “to assess the sustainability performances of a company and its
operational activities” (Labuschagne, Brent, & Erck, 2003, p. 384). With the constant
assessment and proposition of new sustainability reporting frameworks, continuous
improvement of established frameworks is mandatory in order to not only survive but
also flourish. Thus, this survival of the fittest competition ensures that the most effective
and efficient sustainability reporting frameworks are available to industry.
2.4.4. Acknowledging Additional Assessments
This general categorization of current research was meant to function as an
instrument to present the types of literature most prominently available for review in the
field of sustainability reporting. Additional research does exist, however, that focuses on
topics other than those referenced above. For example, Farneti and Guthrie (2007)

18
evaluated Australian public sector organizations attempting to determine the intrinsic and
extrinsic motivations that influence organizations to voluntarily report sustainability
efforts. The results of this evaluation cited the act of providing information to internal
stakeholders as the primary reason for developing sustainability reports and this effort
was spearheaded by one influential individual within the organization (Farneti & Guthrie,
2007).
2.5. Methodology Justification
Regardless of the type of assessment, the majority of sustainability reporting
research has focused on what organizations are reporting in order to determine report
quality. Research studies trying to determine what organizations are reporting, such as
Gallego (2006), KPMG (2008), and Skouloudis, Evangelinos, and Kourmousis (2010),
use a similar technique, which includes comparing an organization’s publicly available
sustainability information with sustainability reporting indicators (i.e. GRI G3
Guidelines). The validity of using this technique to determine what organizations are
reporting is not in question. However, this technique was not conducive to the pursuit of
determining the extrinsic or intrinsic characteristics associated with sustainability
reporting.
Pursuing a research question deviant from the majority of prior research required
the use of an atypical research methodology. The research methodology utilized by
Farneti and Guthrie (2007) provided a framework that was useful in determining the
motivations behind organizations that reported sustainability efforts. Farneti and
Guthrie’s (2007) methodology consisted of conducting semi-structured interviews with
19
eleven individuals directly associated with the development of sustainability reports from
seven organizations. These semi-structured interviews used a structured questionnaire but
allowed the interviewee to speak freely. The interviewee’s answers were then analyzed to
find organizational themes that correlated with sustainability reporting motivation.
The implementation of a research methodology similar to Farneti and Guthrie
(2007) allowed the research question sought by this study to be adequately answered. A
more in-depth review of this research’s framework and methodology can be found in
Section 3.
2.6. Summary
This section has provided a review of the research pertinent to sustainability
reporting. It has included a brief history of sustainability reporting, implications of
sustainability reporting, GRI information, an explanation of previous research, and a
justification of the research methodology.
Prior literature focused on sustainability reporting has left a substantial gap in the
research necessary to navigate sustainability to full potential. The overview of prior
literature provided within this section has proven that the disclosure fragmentation and
report quality variation has become the typical topic of concern in sustainability reporting
research, which leads one to reason that a new direction in research focus must be
pursued. By determining the characteristics that predispose organizations to produce
more compliant sustainability reports, organizations can adjust operating characteristics
to facilitate increases in sustainability report compliance. The implications of increasing
sustainability report compliance can inevitably contribute to brand value creation, thereby

20
producing meaningful results with respect to economic, environmental, and social
sustainability. The next section further outlines the research framework and methodology,
including the population and sample approach and the data collection method.

21
FRAMEWORK AND METHODOLOGY SECTION 3.
Establishing a robust research framework and methodology is vital to the success
of any research study. This section outlines the research framework and methodology
used to complete this study. The methodology section specifically focuses on the
population and sample selection approach as well as the data collection method.
3.1. Research Framework
In order to determine the characteristics among organizations associated with A+
GRI compliant sustainability reports, a grounded theory, qualitative research design was
conducted to collect the required data. Specifically, a descriptive study in a non-contrived
setting was employed, which provided a mechanism to profile the selected organizations
and determine common threads of organizational characteristics prevalent in A+
compliant sustainability reporting.
Although this research utilized a grounded theory design, a theoretical framework
was also developed based on the results of prior research. Along with the grounded
theory method, the theoretical framework was used to frame the importance of the survey
responses. The independent variables of management philosophy, resource availability,
and market incentives were anticipated to affect the dependent variable of sustainability
report compliance, as illustrated in Figure 3.1.

22
Figure 3.1. Schematic diagram of the theoretical framework used to evaluate the characteristics associated with sustainability report compliance.
The management philosophy of an organization was thought to have a profound
impact on the presence and compliance of sustainability reports. This conjecture was
supported by Farneti and Guthrie’s (2007) research, which found that an organization’s
sustainability reporting initiative was spurred by a key individual that encouraged
reporting awareness. This finding alludes to the importance of an organization’s
management philosophy to directly encourage sustainability reporting and/or, at the very
least, create avenues to pursue reporting activities. Sustainability reporting adds to the
responsibility of organizations, which are already laden with a multitude of various
reports. This additional workload strains resources, including: capital availability,
personnel time and labor, and equipment availability. It could be expected that an
organization with greater access to resources should be more capable of producing A+
GRI compliant sustainability reports, opposed to organizations with less resources.
Finally, the market position of an organization can act as an incentive to promote a
sustainability culture within the organization. This idea is a direct result of the rising
awareness of organizational reputation on the customer’s purchasing preferences.
IndependentVariables
DependentVariable
SustainabilityReport
Compliance
ManagementPhilosophy
ResourceAvailability
Marketincen@ves
23
3.2. Methodology
The majority of research currently available surveys a select group of
organizations and determines sustainability report quality by perusing the sustainability
report content available to the public. While this may be a satisfactory means to
determine what organizations are reporting with regards to sustainability, it does not aid
in the effort to determine the underpinning characteristics that contribute to A+ GRI
compliant sustainability reporting.
The methodology of this research study was influenced by the research conducted
by Farneti and Guthrie (2007), which also had the aspiration to determine why
organizations report sustainability activity. Due to time and resource restrictions, the
semi-structured interview process was not administered in its entirety. However, the
questions presented during Farneti and Guthrie’s semi-structured interview process were
modified to compliment the research objective and presented in the form of a fifteen-
question survey. The survey was disseminated via email to the selected sample group and
remained accessible for completion for two months. An exhaustive evaluation of the
survey responses was conducted in order to determine common themes of information
that could be associated to discrete organizational characteristics. As the short-answer
and multiple-choice questions were rigorously evaluated, common themes were identified
and provided a basis for determining organizational characteristics that contributed to A+
compliant sustainability reports.
Establishing a working level of trust was necessary to obtain accurate and
thorough answers during the survey process. In order to obtain and maintain participant
trust, the researcher ensured both participant and organization anonymity throughout the
24
research study. Establishing anonymity allowed the participants to answer candidly
without the fear of punitive measures being enforced by the organization due to
potentially unflattering participant remarks. Demonstrating researcher integrity and
respect for the participant also helped establish rapport between the participants and the
researcher by reducing tension and building a communication pathway. Also, the
potential for response bias was considered and avoided, to the best of the researcher’s
ability, by ensuring an objective survey that was free from leading or loaded questions.
3.3. Population and Sample Approach
The intent of this research was to provide organizations of varying sustainability
report compliance with characteristics that were likely to aid in increasing their report
compliance. In order to increase generalizability, careful identification and selection of
the study population and sample were conducted.
3.3.1. Industry population
The population for this study included over 1800 sustainability reports submitted
to the GRI in 2010 (GRI, 2011). Organizations reported from nearly forty different
sectors, including financial services, energy, food and beverage products, energy utilities,
and mining, which were five of the most represented sectors. In 2010, the GRI received
sustainability reports from all over the world, including countries in Africa, Asia, Europe,
Latin America, North America, and Oceania (GRI, 2011). Due to the specific nature of
the research objective, a more appropriate research approach was utilized to determine

25
which organizational characteristics contributed to developing A+ GRI compliant
sustainability reports. This approach consisted of utilizing a unique sampling method,
which is discussed in the next subsection.
3.3.2. Sample Approach
The application of judgment sampling allowed the sample to be confined to the
A+ sustainability reports submitted to the GRI in 2010. Since 2006, the number of GRI
sustainability reports has rapidly increased and so too have the number of A+ GRI
applications (GRI, 2011). In 2010, there were 378 A+ sustainability reports submitted to
the GRI. Through the additional application of judgment sampling, the sample was
further confined to not only the A+ GRI applications but also applications provided in the
English language from countries within Europe, North America, and Oceania. The use of
judgment sampling resulted in a final target sample size of 107 organizations with A+
sustainability reports. Given the sample size used in similar, previously conducted
research (Farneti & Guthrie, 2007; Guthrie & Farneti, 2008; Skouloudis, Evangelinos, &
Kourmousis, 2009) and the timeframe allotted to conduct this research, the selected
sample was considered valid for this descriptive study. Ultimately, this study will provide
global, multi-industry insight as to the characteristics conducive to developing an A+
GRI sustainability reporting.
26
3.4. Data Collection
The collection of data can be a seemingly insurmountable task. For this reason,
the researcher decided to utilize both primary and secondary sources of data. The
collection of primary data was used to answer the specific research question in this study.
The solicitation of secondary data not only decreased the data collection time but also
provided supporting data for study validation.
The primary source of data was collected through the administration of a fifteen-
question survey, which can be found in its entirety in Appendix A. The survey was
disseminated via email to the target sample of 107 organizations that had submitted an
A+ sustainability report to the GRI in 2010. An important consideration for the researcher
throughout the survey process was ensuring anonymity of the respondents, which
provided security for candid responses. The survey was also presented as a voluntary
activity for all recipients. The responses to each of the fifteen questions were collated and
analyzed to determine important themes that were relevant to the research study. The
survey administered included questions that required either a short-answer or a multiple-
choice answer. The two types of response categories, short-answer or multiple-choice,
were handled with two distinct methods. To simplify the arduous task of evaluating short-
answer responses, a poster board was used for each short-answer question and a note card
was used for each response to the corresponding question. As each short-answer was
evaluated, the main idea or theme was written on the note card and placed on the
respective poster board. An initial theme or idea became the header of a column and, as
reoccurring response themes became apparent, the subsequent, corresponding responses
were placed beneath it. This short-answer analysis method allowed for a visual

27
representation of the distribution of response themes for each question, which functioned
similarly to a stem-and-leaf plot being utilized as a histogram with quantitative data. In
order to visualize the short-answer handling method, a graphic for each short-answer
question is provided in Appendix C. The method for analyzing the multiple-choice
questions was more straightforward and was completed by tabulating and graphing the
response rate for each answer, which determined the distribution of each question’s
responses.
Alternatively, secondary sources of data were collected and utilized in order to
validate this study’s results and as supporting data for generalizing results beyond the
subjects of this study. The secondary sources of data included KPMG’s 2008 report,
Internal Survey of Corporate Responsibility Reporting and the GRI’s reporting list, which
archived sustainability report information from 1999 to 2011. The final source of
secondary data included Business in the Community, Insight Investment, and FTSE’s
2005 report titled Rewarding Virtue.
3.5. Summary
This section provided an overview of the research framework and methodology
utilized to complete this study, including the population and sample approach and the
data collection method. The next section includes the data and results from the
administered survey. In the data and results section the survey responses are presented
and their implications are discussed.

28
DATA AND RESULTS SECTION 4.
As the sustainability reporting community continues to be saturated with research
focused on the content of publicly available sustainable reports, this disparate research
provides a perspective on potential sources of compliance variation and valuable
information for organizations that participate in sustainability reporting. The purpose of
this research was to determine the organizational characteristics in sustainability
reporting that contribute to A+ GRI compliance. By determining the organizational
characteristics contributing to variance in sustainability report compliance, it was the
researcher’s intent to provide a benchmark for organizations struggling with
sustainability reporting compliance, government policy-makers, and stakeholders.
A fifteen-question survey, which can be found in Appendix A, was disseminated
to 107 organizations that had submitted an A+ sustainability report to the GRI in 2010.
The responses to each of the fifteen questions were collated and analyzed to determine
important themes that were relevant to this research study. As recurring response themes
became apparent, the organizational characteristics associated with developing A+
sustainability reports also became apparent.
This section presents the data and results from the survey administered to the
selected sample group. Firstly, the survey results are presented in a concise, logical
manner in order to simply relay the main themes that were discovered. Secondly, a

29
discussion of the relationships and generalizations that can be deduced from the survey
results is provided. Finally, this section ends with a brief summary of the data and results
section and leads to the final section, where the researcher’s conclusions and
recommendations are provided.
4.1. Presentation of Survey Results
Of the 107 surveys disseminated, a total of 21 responses were received from 21
distinct organizations. Although the questions utilized in the survey were asked in order
to determine the organizational characteristics in sustainability reporting that contribute
to A+ GRI compliance, the answers can also be dually utilized to provide a high-level
profile of the otherwise anonymous responding organizations. This subsection begins
with a brief overview of the organizations that responded and transitions to the
presentation of the remainder of the survey results.
4.1.1. Number of Employees
The number of employees employed by each organization was separated into
three ranges, 0 to 500 employees, 501 to 10,000 employees, and great than 10,001
employees. The 21 respondents noted the following employee ranges, 14% of the
organizations employed 0 to 500 employees, 38% employed 501 to 10,000 employees,
and 48% employed more than 10,001 employees. This data is graphically illustrated as a
percentage of total respondents in Figure 4.1.

30
Figure 4.1. Number of employees employed by each organization.
4.1.2. Perception of Sustainability Reporting within the Organization
The survey participants were asked to provide the overall perception of
sustainability and sustainability reporting within their organization. The question was
presented using a five-level Likert scale with the following multiple-choice options,
positive (beneficial, value added, etc.), neutral (no strong feelings for or against it), mixed
feelings (a mixture of supporters and detractors), negative (non-value added or
inopportune, etc.), or other. As illustrated in Figure 4.2, the majority of respondents (90%)
acknowledged a “positive” perception within their organization toward sustainability and
sustainability reporting. However, one respondent did concede to a “neutral” perception
and another recognized “other” as the perception within their organization. Unfortunately,
the actual perception towards sustainability and sustainability reporting within the
organization that selected “other” is unknown, as the respondent did not expound upon
his/her selection.

31
4.1.3. Number of People Involved in Creating a Sustainability Report
The survey participants were also asked about the approximate number of people
in their organization that were involved in creating their sustainability report. The
responses varied drastically from 4 full-time employees to 172 employees, with a mean
response of 42.25 employees. There are two plausible explanations for the cause of this
response variation: the varying size of the responding organizations and the different
sectors in which the organizations were involved required varying levels of employee
support to complete the sustainability or, more likely, 2) there were varying
interpretations by the survey participants of the term “involved”, which was derived from
poor question presentation/clarification by the researcher. Asking the question of
“Approximately how many people are involved in creating your organization's
sustainability report?” was intended to account for all employees that contributed to the
development of the organizations sustainability report (e.g. data collectors, content
Figure 4.2. Overall perception toward sustainability & sustainability reporting (S&SR) in the organization.
32
providers, full-time employees, supporting employees, executive oversight, etc.). As it is
an already difficult task to accurately quantify the number of employees that influence a
large report’s development, a question that did not specify the level of detail desired
certainly did not help. This is evidenced by the varying level of detail in responses, which
ranged from precise answers with integers (i.e. “60”, “20”, “5”), estimated answers (i.e.
“cca 50”, “1 full time with circa 40 supporters”), and detailed answers including full-time
equivalency (FTE) (i.e. “2.5 FTE, plus oversight by Director and CFO, plus approx.
0.5FTE in communications. Also, around 100 data providers and subject matter experts
provide input into the report.”)
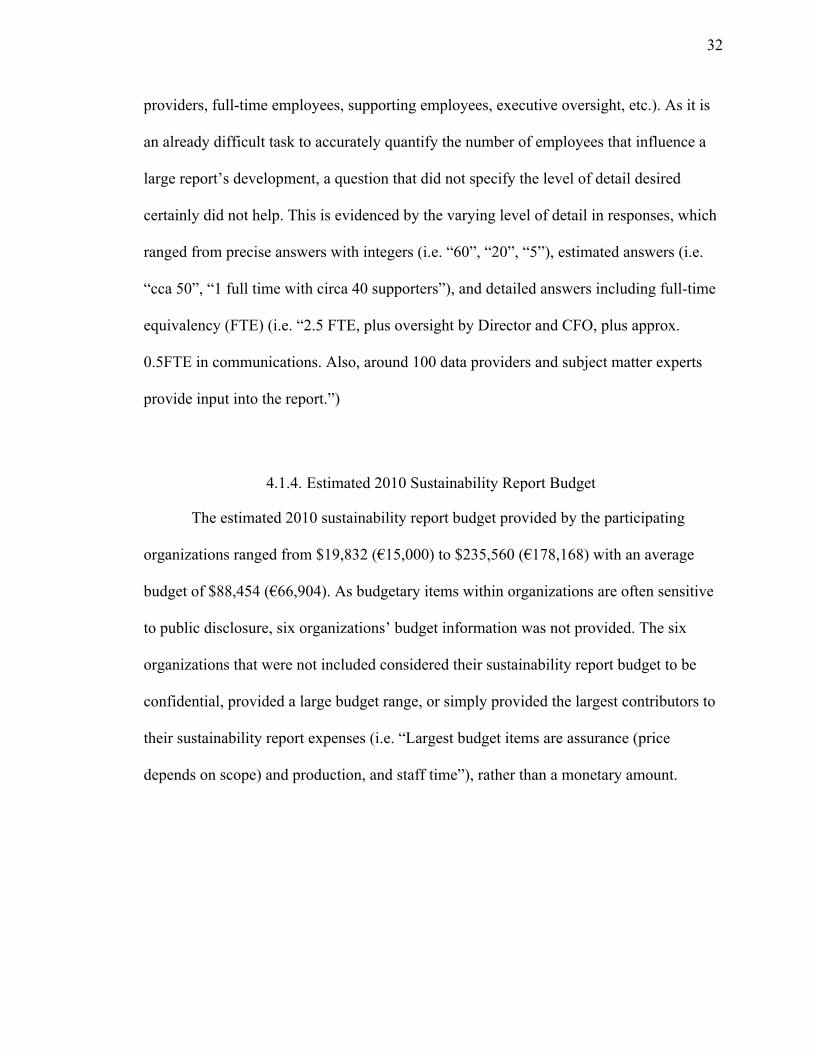
4.1.4. Estimated 2010 Sustainability Report Budget
The estimated 2010 sustainability report budget provided by the participating
organizations ranged from $19,832 (€15,000) to $235,560 (€178,168) with an average
budget of $88,454 (€66,904). As budgetary items within organizations are often sensitive
to public disclosure, six organizations’ budget information was not provided. The six
organizations that were not included considered their sustainability report budget to be
confidential, provided a large budget range, or simply provided the largest contributors to
their sustainability report expenses (i.e. “Largest budget items are assurance (price
depends on scope) and production, and staff time”), rather than a monetary amount.

33
4.1.5. Number of Sustainability Reports Created
The number of sustainability reports the organizations had created using the GRI
framework was also surveyed. This question was presented to the participants as a
multiple-choice question with four separate ranges, 0 to 4 GRI sustainability reports, 5 to
8 reports, 9 to 12 reports, and more than 12 GRI sustainability reports. As seen in Figure
4.3, the responses reveal that 48% of the participating organizations completed between 5
and 8 sustainability reports using the GRI framework. Furthermore, the second most
prevalent range of sustainability reports created using the GRI framework was between 9
and 12 reports, which was closely followed by the lowest reported range of 0 to 4 reports
at 29% and 24%, respectively. The lack of organizations that created more than twelve
sustainability reports using the GRI framework is not surprising, as the GRI did not
release its first generation of guidelines until 2000 (GRI, 2010).
Figure 4.3. Distribution of the number of sustainability reports created using the GRI guidelines by the responding organizations.

34
4.1.6. Mediums Used to Disseminate a Sustainability Report
The participants were then asked to provide the range of mediums used to
disseminate their sustainability reports. The survey respondents were given six different
report dissemination mediums as well as an “other” option and were asked to select all
mediums that apply to their organization. All of the respondents (100%) claimed to use a
web-based medium to disseminate their sustainability report, which included PDF
versions available on the organizations’ website (as illustrated in Figure 4.4). Paper and
hard copy versions of the sustainability report were the second-most utilized medium
with 81% of the respondents affirming the use of this medium. While stand-alone
documents were the third-most utilized (43%) medium to publish a sustainability report,
an integrated document was used fourth-most at 29%. The method that was used fifth-
most (14%) was the compact disk (CD). The “other” category was selected by one
respondent (5%) to explain the airing of an audio broadcast of key chapters as a means to
publicize their sustainability report. Evidently, all of the participating organizations used
at least one medium to circulate their sustainability report, as zero (0) organizations
selected the “N/A” answer choice.
Figure 4.4. Distribution of the mediums used to disseminate sustainability reports (SR).

35
4.1.7. Sustainability Report Implementation Challenges
The survey participants were also asked to answer a short-answer question
regarding the main challenges associated with implementing their organization’s
sustainability report. As illustrated in Figure 4.5, the most common response (67%) cited
the data collection process as the main challenge for their sustainability report
implementation. Specifically, a respondent cited the “data capture and information flow”
Figure 4.5. Main challenges associated with implementing a sustainability report (SR).
aspect of developing their sustainability report to be particularly challenging. Also, as
organizations became global and increased their operations, the data collection process
became more challenging. Resource constraints, including financial, human, and time,
were the second-most common challenge expressed by the organizations with a response
rate of 38%. The third-most common response (19%) stated that “defining materiality”
was another challenge within their organization. Defining materiality was considered
difficult for several reasons including, a lack of set standards and regulations for
establishing materiality, constantly changing information and topics of importance, and
establishing the specific concerns of stakeholders. Other challenges that were expressed
included, the lack of support and consensus (“especially from the CEO”) within the

36
organization, risk-aversion (i.e. publishing areas of poor performance), employee and
customer engagement, integrating financial data and sustainability performance, as well
as integrating the sustainability report into daily operations.
4.1.8. Effects of Economic Uncertainty on Sustainability Reporting
As many of the organizations that were surveyed are located in financially
unstable countries, the organizations were asked how the economic recessions have
affected their sustainability reporting initiative. As illustrated in Figure 4.6, an impressive
81% of organizations were able to maintain their reporting activity. Moreover, reporting
activity had actually increased in 10% of the participating organizations. Conversely, 10%
of the participating organizations had experienced a decrease in reporting activity.
Figure 4.6. The effect of economic recessions on sustainability report activity.

37
4.1.9. Motivations for Voluntarily Reporting Sustainability
Although the participating organizations provided a great deal of information
regarding the challenges associated with implementing a report, the organizations also
provided their motivations for voluntarily developing a sustainability report. As
illustrated in Figure 4.7, the number one motivation (62%) for developing a sustainability
report was to increase stakeholder inclusiveness and engagement. Also, 48% of the
Figure 4.7. Motivations for voluntarily developing a sustainability report (SR).
organizations stated the sustainability reports were implemented as a management tool to
improve sustainability within their organization. The sustainability reports aided in
improving data quality, diagnosing the status of sustainability within the organization,
and ensuring improvement on stakeholder sustainability concerns. The theme of morality
was mentioned by 33% of the respondents, which stated they were motivated to create a
sustainability report because “it is the right thing to do”, it ensures “integrity”, “Corporate
Social Responsibility”, demonstrates “accountability”, and maintains “company values”.
Also at 33%, the organizations were motivated to develop a sustainability report in order
to use it as a communication tool for not only reporting the organization’s performance
but also to demonstrate their commitment to “environmental, social, and governmental

38
issues”. Additionally, using the sustainability report as a communication tool allowed an
organization to show the relationship between “finance and sustainability and how
sustainability contributes to the success of the organization”. Increasing an organization’s
brand value was the fifth-most expressed motivation (29%) for voluntarily developing a
sustainability report. Similarly, the desire to increase the overall transparency of the
organization, especially for “all relevant stakeholders”, was a source of motivation for 29%
of the respondents. Also with a 29% response rate, the organizations were motivated to
develop a sustainability report due to the subsequent motivation of their employees. In
other words, 29% of the organizations were motivated by increasing employee
motivation/moral with the publication of environmental and social improvements, which
provided a sense of “employee-community commitment”. Though, 14% of the
organizations stated that developing a sustainability report was either a standard practice
in their sector or a regulatory requirement to disclose certain environmental indicators.
Other motivations that were singularly provided include, being able to “compare
sustainability performance with other organizations”, and being able to “show reporting
rigor”.
4.1.10. Initiating Sustainability Reporting
The participating organizations were asked to identify the individual that initiated
sustainability reporting in their organization. The Board of Directors was the most
common initiator of sustainability reporting among the organizations surveyed with a 43%
response rate, as seen in Figure 4.8. The President or CEO of the organization was the
second-most (29%) individual credited for initiating sustainability reporting. More

39
specific titles, such as the organization’s “Founders/C-suite1”, were also provided but
ultimately were equated to the President or CEO level. The General Manager was
selected by 14% of the participants as the individual responsible for initiating
sustainability reporting in their organization. Again, the General Manager role was also
equated to the “Corporate Sustainability Office” in one organization and the “Strategic
Relations & Communications Division Director” in another. The Vice President of 10%
of the organizations was recognized as the initiator of their sustainability report. The
“Director of Social Policy” and the “Vice President Environment” were provided as more
specific titles under the Vice President selection. One participant (5%) did provide a title
as “other”, which was the “Environmental Project Manager”. The titles of hourly
employee, salary employee, supervisor, and manager were not considered to have
initiated sustainability reporting in the participating organizations.
Figure 4.8. Title of the individual responsible for initiating sustainability reporting (SR) within the organization.
1The term “C-Suite” refers to executive-level titles, such as the CEO, COO, and CFO.

40
4.1.11. Advocating Sustainability Reporting
After determining the individual that initiated sustainability reporting in the
participants’ organization, the participants where asked who they identified as the
strongest advocate for continuing sustainability reporting in their organization. As
illustrated in Figure 4.9, the President or CEO was credited by 45% of the participants as
the strongest advocate for continuing sustainability reporting within their organization.
Figure 4.9. Title of the strongest advocate for sustainability reporting (SR) within the organization.
The titles of “Chief Sustainability Officer/Co-Founder” were provided as alternative titles
for the President or CEO choice. The Board of Directors was recognized by 25% of the
participants as the strongest advocate for continuing sustainability reporting within their
organization. The General Manager and Vice President titles were separately selected by
10% of the participants as the chief advocate for sustainability reporting. The General
Manager title was more specifically designated as the “Sustainability Manager” and the
“Group Environment Manager”. Moreover, the Vice President title was supplemented
with the “CSO [Chief Sustainability Officer]” and “CFO [Chief Financial Officer]”. Also,
5% of the organizations attributed a manager as the strongest advocate for continuing
41
sustainability reporting. Similarly, 5% of the participants provided a title with the other
selection as their main sustainability-reporting advocate, which was the “Head of Corp.
Sust. [Head of Corporate Sustainability]”. The titles of hourly employee, salary employee,
and supervisor were not considered to be advocates of sustainability reporting in the
participating organizations.
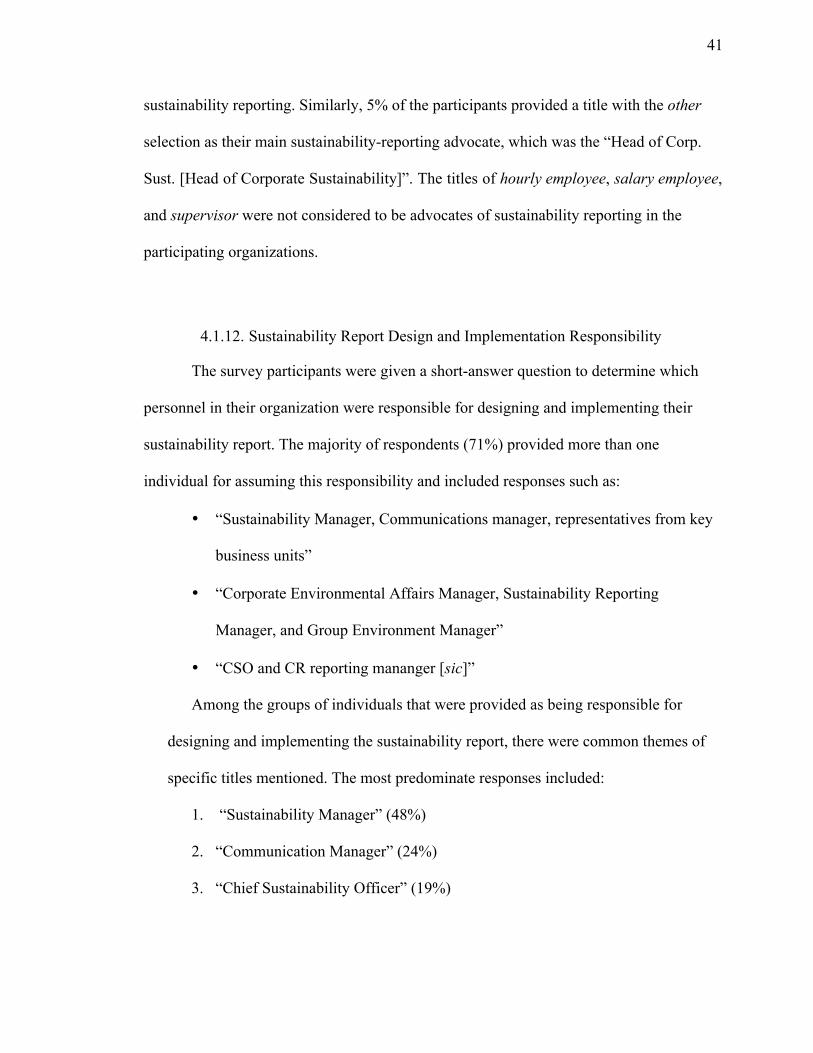
4.1.12. Sustainability Report Design and Implementation Responsibility
The survey participants were given a short-answer question to determine which
personnel in their organization were responsible for designing and implementing their
sustainability report. The majority of respondents (71%) provided more than one
individual for assuming this responsibility and included responses such as:
• “Sustainability Manager, Communications manager, representatives from key
business units”
• “Corporate Environmental Affairs Manager, Sustainability Reporting
Manager, and Group Environment Manager”
• “CSO and CR reporting mananger [sic]”
Among the groups of individuals that were provided as being responsible for
designing and implementing the sustainability report, there were common themes of
specific titles mentioned. The most predominate responses included:
1. “Sustainability Manager” (48%)
2. “Communication Manager” (24%)
3. “Chief Sustainability Officer” (19%)

42
4. “Sustainability Reporting Manager” / “Social Reporting Director” (19%)
5. “CFO” (10%)
6. “Investor Relations Manager” (10%)
The participants also acknowledged the “CSR Staff”, “Sustainability Analyst”,
“Representatives from key business units”, and “company secretary” as positions that
were held responsible for designing and implementing their sustainability report.
Although many variations of one title existed among the multitude of responding
organizations, the common theme of each title was isolated in order to determine
responsibility trends. The main impression to be taken from this set of responses is that,
of the 49 different titles provided, 42 of the titles (86%) were at a manager title of above
(i.e. manager, department head, director, or executive). This notion is further discussed in
Section 4.2.
4.1.13. Sustainability Report Final Approval
As the final question regarding organizational structure, the participants were
asked to identify the individual that provided the final approval for the publication of
their sustainability report. Of the twenty-one responses, four organizations (19%) cited
two parties responsible for providing the final approval, including:
• “Co-Founder + President”
• “Management Board and Supervisory Board Members”
• “Board of Directors and CEO”

43
• “Strategic Relations & Communications Division Director and Board of
Directors”
By evaluating all of the responses individually, common titles were collated to
determine trends in the individuals with final approval authority. As Figure 4.10
illustrates, the Board of Directors was responsible in 43% of the organizations for giving
the final approval for sustainability report publication. The President / CEO was the
Figure 4.10. Title of the individual with final approval authority for sustainability report publication.
second-most title (19%) identified as having final approval for publication. The
management board and indicator owner were both credited by 10% of the participating
organizations as having final approval authority for publicizing their sustainability report.
The “indicator owner” title was created by the researcher and refers to organizations that
offered the “directors” or “department heads” with final approval authority for the
indicators in their respective department(s). Other responses were singularly provided to
describe the individual with final approval authority, such as the “Senior Vice President”,
“Company Secretary”, and the “Disclosure Committee”. The latter title approved all
publications authored within that particular organization.

44
4.1.14. Ensuring Indicator Response
As the main difference between GRI application levels is the level of indicator
compliance, the participating organizations were asked how they ensured a response was
given on each core G31 and Sector Supplement indicator with due regard to the
materiality principle. Incorporating feedback from stakeholder engagement was the most
common approach to ensure indicator responses on items of materiality in 43% of the
participating organizations, as shown in Figure 4.11. The organizations consistently
referred to the importance of stakeholder engagement/involvement in determining
materiality within their organization. The second-most common method employed to
Figure 4.11. Method of ensuring core G3 and Sector Supplement indicators with due regard to the materiality principle.
ensure indicator responses on items of materiality was through external assurance in 24%
of the organizations, which was expected due to the research sample consisting of A+
GRI applicants (i.e. principally, all of the organizations rely on external assurance, which
verifies indicator compliance, to receive an A+ application level). Also, 19% of
organizations expressed the use of checklist comparisons (e.g. GRI sector supplement
1Core G3 refers to the GRI’s third generation of guidelines.

45
checklists, internal checklists, and indicator questionnaire checklists) to ensure their
completed report was compliant and material. Discussions with key subject experts were
utilized by 14% of the participating organizations to ensure indicator compliance and
materiality. Similarly, 14% of the organizations endeavored to align their organizational
strategy with the GRI indicators. Benchmarking the trend of best practices was also a
strategy embraced by 10% of the organizations to ensure indicator responses on items of
materiality. Other approaches to ensuring compliance and materiality included,
“materiality reviews”, “discussion in internal sustainability board”, and “surveying
company managers about key sustainability issues”.
4.1.15. Other Keys to Sustainability Report Success
Finally, the participants were provided the opportunity to express any other
organizational characteristics that directly contributed to the development of an A+
sustainability report. Only thirteen of the twenty-one respondents provided a response to
this question. A common theme that was exuded by the majority of responses was that
sustainability and sustainability reporting were integral to the organization’s culture and
success:
Previously, the embedded culture we had built up over a decade, through internal diagnostics and training, and a strong message form the CEO that it was material. (Anonymous, personal communication) …sustainability, and reporting is integrated to the operation of the company…(Anonymous, personal communication) Private, family and employee-owned company with strong values (Anonymous, personal communication)

46
Our business strategy and plan is sustainable. (We don't have a separate sustainability stragey [sic]). This is why we produce one integrated report. (Anonymous, personal communication)
The importance of a persistent commitment to stakeholders was also expressed by
the participating organizations:
buy-in from all key stakeholders into our mission, core values, vision, and our commitment to sustainability and transparency (Anonymous, personal communication) The commitments to stakeholders listed in the report are contained in the Hera Balanced Scorecard (the incentive system for executives). This is to provide guarantees of consistency and coherence among the various instruments used for management and achievement of the Group strategy (Business Plan, Sustainability Report, management reporting, bonus system). (Anonymous, personal communication) Other organizations listed “pride”, “Organisational communication”, and “long
term experience” as elements within their organization that aided in their sustainability
reporting efforts. Furthermore, organizations also expressed that integrating their reports
and using a variety of mediums to disseminate their report were aspects that benefitted
their sustainability reporting initiative:
We decided to report Social and environment activities by the use of hard copy document, the Internet website and various electronic documents in order to reach different target of stakeholder and to make available snapshot information and dynamic ones. (Anonymous, personal communication) We are moving to 'integrated reporting' and as such are not producing separate 'sustainability' reports. The focus for reporting should be on all aspects that materially affect our stakeholders and so it makes sense to have this information all in one place. (Anonymous, personal communication) The aim of this subsection was to extract the main themes from the survey results.
The next subsection will provide discussion relative to the theoretical framework outlined
in Section 3.1, as well as discuss the implications of the survey results.

47
4.2. Discussion of Survey Results
Using the theoretical framework, illustrated by Figure 3.1, the independent
variables of management philosophy, resource availability, and market incentives are
used to further discuss the characteristics associated with sustainability report compliance.
This subsection will provide the implications and generalizations derived from the survey
responses previously presented.
4.2.1. Management Philosophy
The use of management philosophy as an independent variable in the theoretical
framework of this research was intended to evaluate the organizations’ management
structure and culture that are evident in the organizations’ daily operations. By
recognizing not only the explicit meaning but also the inferred meaning of the survey
responses, important implications can be derived that shed light on the critical aspects of
management philosophy that induce sustainability report compliance.
The most noteworthy principle relative to the management philosophy that can be
derived from this research is that the leadership of an organization (i.e. managers, general
manager, vice president, president/CEO, and the board of directors) dictates the success
of sustainability reporting within that organization. If the leadership within an
organization demonstrates a genuine awareness and commitment for sustainability
reporting, the resulting sustainability reporting (SR) efforts are not done in vain. The
participating A+ compliant organizations demonstrated this concept by considering an
individual at the manager or greater hierarchical position (i.e. general manager, vice
president, president/CEO, or the board of directors) as the responsible individual for

48
initiating SR, being the strongest advocate for continuing SR, and providing final
approval for SR publication. Furthermore, of the 49 position titles provided as being
responsible for designing and implementing the sustainability report, 42 or 86% were at a
manager position or above. The organization’s perception of their leadership’s sincerity
to commit to sustainability reporting establishes a culture that resonates throughout the
organization. This ability to mold a sustainability culture within an organization provides
a unique opportunity to institute SR expectations, thereby establishing significant weight
for SR initiatives and encouraging greater SR compliance.
It is also important to note that, if an organization incorporates the expectations of
its stakeholders, as it should for long-term prosperity, the real catalyst for establishing
sustainability reporting importance is the organization’s stakeholders. The amount of
influence held by the stakeholders is evidenced by the 62% of participating organizations
that specified stakeholder engagement as the number one motivation for voluntarily
developing a sustainability report. Also, 43% of the organizations acknowledged
stakeholder engagement as the main method for ensuring a response was given on each
core G3 and Sector Supplement indicator with due regard to the materiality principle.
Therefore, the desire to include the expectations of stakeholders on matters of materiality
ultimately positions stakeholders for affecting sustainability reporting in the greatest way.
Consequently, the real determinate of sustainability reporting compliance can be traced to
the expectations of the stakeholders and the execution of the organization’s leadership to
understand and sincerely commit to the stakeholders’ expectations.
Farneti and Guthrie (2007) discovered similar results during their interviews with
Australian public sector organizations. Farneti and Guthrie (2007) found that
49
sustainability reporting was supported or initiated predominately by “a key individual”
within the organization but was also influenced by internal stakeholders. According to
Skouloudis et al. (2009), the stakeholder’s desire for accountability and transparency
within an organization beyond traditional financial reports is not only present but also
abundant. Furthermore, Business in the Community et al. (2005) alluded to the necessity
of directors within an organization to establish a culture through values and standards that
meet their obligation to stakeholders. A brief evaluation of these results illustrates the
need for an organization’s leadership to effectively acknowledge and employ the
expectations of their stakeholders. Conversely, research focused on sustainability
reporting in the higher education sector revealed that a bottom-up approach was most
effective in initiating the development of sustainability reports (Fonseca, et al., 2010).
However, Fonseca (2010) also suggested that the leadership within the university was
able to validate the bottom-up initiatives through the implementation of supporting
policies.
4.2.2. Resource Availability
The use of resource availability as an independent variable in the theoretical
framework of this research was intended to evaluate the organizations’ financial, human,
and time resources that are readily available for the development of the organization’s
sustainability report. Understanding the resource availability of organizations with an A+
sustainability report provides insight on the ubiquity and consequences of resource
constraints.

50
The participating organizations reported a wide range of human resources utilized
to develop their sustainability report, which ranged from 4 full-time employees to 172
employees with a mean response of 42.25 employees. The organizations also reported
varying levels of financial resources committed to the development of their SR, which
ranged from $19,832 to $235,560 with an average budget of $88,454. However, the
results of this survey did not indicate that organizations able to achieve A+ sustainability
reports have adequate resource availability. In fact, the second most common challenge
expressed by the organizations was overcoming their resource constraints. Although the
organizations experienced financial, human, and time constraints, the organizations were
still able to produce an A+ sustainability report. Furthermore, 91% of the organizations
were able maintain or even increase sustainability reporting initiatives through difficult
financial times. The organizations capable of overcoming their resource availability
constraints rely on their reporting motivations and organizational culture to succeed.
Lamprinidi and Kubo (2008) determined that organizations experience an
inundation of reporting and the addition of a sustainability report proves taxing. However,
this research illustrates that the several of the participating organizations were able to
avoid the overwhelming quantity of reports through report integration. Participating
organizations explained a common overlap between information in their discrete reports
and the integration of their reports enabled them to reduce the information overlap and
concentrate efforts on a single report. Furthermore, experience proved to be another
important characteristic for developing an A+ GRI sustainability report, as 77% of
participating organizations had completed five or more GRI sustainability reports. Also, a
few organizations explicitly stated their experience in sustainability reporting aided in

51
reaching A+ compliance. The impact of experience on sustainability report compliance
could be anticipated because a key intention of the GRI application level was to provide a
graduated compliance structure for novice sustainability reporting organizations.
4.2.3. Market Incentives
The use of market incentives as an independent variable in the theoretical
framework of this research was intended to determine the organizations’ motivations for
developing a sustainability report. Recognizing why organizations voluntarily report
reveals organizational characteristics that influence the development of A+ compliant
sustainability reports.
The participating organizations provided several reasons for voluntarily
developing their sustainability report. The organizations were able to recognize the
market incentives that exist after developing a sustainability report, which have effects
beyond merely diagnosing the status of sustainability within the organization. The
motivations expressed by the participating organization, such as improving stakeholder
engagement, increasing transparency, strengthening company values and integrity, and
increasing brand value are all market incentives that benefit not only the organizations
but also society as a whole. KPMG (2008) acknowledged a contract that is established
between business and society as a byproduct of corporate responsibility. This resulting
contract stresses honesty, integrity, fairness, and respect for society’s rights (KPMG,
2008). The market incentives provide profound value to the organizations, which not only
encourage continued sustainability reporting but also further financial success.
52
It is also important to note that the motivations of an organization are not
mutually exclusive. For example, the genuine desire to create a sustainability report for
morality or integrity purposes would also contribute to the brand value of the
organization. The interdependent relationship between motivations was further
exemplified in the Vancity case study discussed earlier in Section 2.2, which brought a
300% return on investment and a 20% increase in membership rates due to their
sustainability initiatives (Bernhart, 2009). This demonstrates that pursuing sustainability
improvements within an organization can also increase brand value; thereby, increasing
profit margins.
4.3. Summary
Both the theoretical framework used in this research and the survey responses
highlight the organizational characteristics in sustainability reporting that contribute to
A+ GRI compliance. The theoretical framework’s independent variables of management
philosophy, resource availability, and market incentives had varying degrees of influence
on the participating organizations’ ability to develop an A+ compliant sustainability
report. While each independent variable evaluated had an impact on ensuring report
compliance, the management’s sustainability philosophy, with the culture that supervenes,
was the most effective variable at encouraging sustainability report compliance.
Furthermore, these results should not simply be taken at face value. In other words,
creating five or more SR, as 77% of the responding organizations did, spending the mean
amount of $88,454 on the development of a SR, and/or using several mediums to
dissemination a SR does not guarantee increased indicator compliance. However, if the

53
organization has the organizational characteristics outlined in this section, the culture
within an organization will be more sustainability-minded and compliance will be built
into daily operations.

54
CONCLUSIONS AND RECOMMENDATIONS SECTION 5.
This research study has investigated the organizational characteristics in
sustainability reporting that contribute to A+ GRI compliance. The research contained
here within includes an introduction to the research topic, a review of pertinent literature,
a description of the research’s theoretical framework and methodology, and the
presentation and discussion of research results. This section concludes the research study
by providing a summary of the research purpose, significance, and results. This section
also presents the researcher’s recommendations for research strategy improvements and
for the direction of future research.
5.1. Conclusions
Prior research that investigated the practice of sustainability reporting mainly
focused on the content of publicly available sustainability reports. The purpose of this
research was to provide the growing practice of sustainability reporting with disparate
research, which was used to determine the organizational characteristics in sustainability
reporting that contribute to A+ GRI compliance. By determining the organizational
characteristics that induced variance in sustainability report compliance, the researcher
was able to provide a beacon for organizations struggling with sustainability reporting
compliance, government policy-makers, and stakeholders.

55
The methodology utilized in this research included the dissemination of a fifteen-
question survey to 107 anonymous organizations that had submitted an A+ sustainability
report to the GRI in 2010. The voluntary responses to each of the fifteen questions were
collated and analyzed to determine important themes that were relevant to this research
study. As common themes were discovered, specific implications and generalities were
established relative to the research’s theoretical framework, which provided insight to the
organizational characteristics responsible for A+ GRI compliant sustainability reports.
After the evaluation and discussion of the research results, the organizational
characteristics that contribute to the development of A+ GRI compliant sustainability
reports were successfully identified. The results were evaluated with regard to the
theoretical framework’s independent variables, which were management philosophy,
resource availability, and market incentives. The management philosophy of an
organization had the most profound influence on sustainability report compliance. This
result was evidenced by the participating organizations disclosing that the leadership of
their organization (i.e. managers, general manager, vice president, president/CEO, and
the board of directors) dictated the success of sustainability reporting within their
organization. Furthermore, of the 49 position titles provided as being responsible for
designing and implementing the sustainability report, 42 (or 86%) were at a manager
position or above. The participating organizations also considered the leadership within
their organization as the initiators of sustainability reporting, as well as the individuals
with the authority to approve final sustainability report publication. The sincere
commitment of an organization’s leadership to sustainability reporting developed a
culture within the organization, which had sustainability integrated into the
56
organization’s values and daily operations. With 62% of participating organizations
specifying stakeholder engagement as the number one motivation for voluntarily
developing a sustainability report, the true determinate of sustainability reporting
compliance was traced to the expectations of the stakeholders and the execution of the
organization’s leadership to understand and sincerely commit to the stakeholders’
expectations.
Although the second-most common challenge expressed by the organizations was
overcoming their resource constraints (including financial, human, and time), 91% of the
organizations were able maintain or even increase sustainability reporting initiatives
through difficult financial times. The organizations found that an integrated sustainability
report decreased the amount of resources necessary for report completion when compared
to the amount of resources necessary to create several discrete reports. The organizations
capable of overcoming their resource availability constraints relied on their reporting
motivations and organizational culture to maximize indicator compliance.
The participating organizations were able to recognize the market incentives that
exist after developing a sustainability report, which have effects beyond merely
diagnosing the status of sustainability within the organization. The motivations expressed
by the participating organization, such as improving stakeholder engagement, increasing
transparency, strengthening company values and integrity, and increasing brand value are
all market incentives that benefit not only the organizations but also society as a whole.
These market incentives provide profound value to the organizations, which not only
encourage continued sustainability reporting but also further financial success.

57
During the analysis of the survey responses, an apparent subtext surfaced, which
suggested that the participating organizations did not strive for a particular GRI
compliance level. However, the participating organizations developed a genuine
sustainability culture and the sustainability report compliance level was a byproduct of
their sustainability commitment. Moreover, this research has determined that establishing
a pervasive sustainability culture, overcoming resource constraints, and recognizing
sustainability reporting market incentives facilitates A+ GRI sustainability report
compliance, which can also assist organizations struggling with sustainability reporting.
This research also has the potential to provide considerable insight to government policy-
makers and stakeholders for the development of effective policy that results in more
transparent, moral organizations.
5.2. Recommendations
While conducting this research, a great deal of reflection has lead to the
identification of various areas of improvement; these areas of improvement are provided
as recommendations in this section. The recommendations resulting from this research
study are provided as suggestions for methodology improvements fundamental for
replicating this research as well as suggestions for the direction of future sustainability
reporting research.
In the case of pursuing research that is similar to this study, certain considerations
would behoove the researcher by enhancing response quality and increasing
generalizability. The responses received from the participating organizations provided
tremendous awareness for determining the organizational characteristics that contribute

58
to GRI compliant sustainability reports. However, the pure anonymity that allowed
organizations to reply without reserve also eliminated the possibility for the researcher to
contact the responding organizations for response clarification. The ability to follow-up
on participant responses would allow more insightful information to be collected. The
ability to follow-up responses could be corrected by one of two means: 1) conducting the
data collection process using a semi-structured interview process, which would allow the
researcher to immediately clarify responses and/or 2) asking the survey respondents to
provide contact information for follow-up questions. The use of either, or both, of these
methodology corrections would allow the researcher to clarify the response meaning and
verify the accuracy of the researcher’s interpretation of the response. Another
consideration to improve the research methodology would be to increase the sample size
by targeting all A+ GRI applications regardless of location and/or the language used to
develop the sustainability report. By removing the location and sustainability report
language filters, the sample size would increase, thereby increasing the generalizability of
the results.
This research study and the sustainability reporting community, as a whole, would
benefit greatly from the pursuit of future research. For example, future research that
focuses on organizations that have not created an A+ GRI sustainability report would
effectually compliment this research study. Understanding the challenges, motivations,
management philosophy, resource availability, and market incentives of the organizations
that have not reached A+ GRI compliance would provide valuable insight. The
organizational characteristics of organizations that have not created an A+ GRI
sustainability report could then be compared to the results found in this research, which

59
could be used to determine more precise associations and implications for developing A+
GRI sustainability reports.
Also, a research study that utilized a random sampling method, such as a simple
random sampling or stratified random sampling, of all the sustainability reports submitted
to the GRI in 2010 would allow for the central limit theorem to be applied. With the use
of a random sampling method and the assumption of the central limit theorem, more
sophisticated statistics could be applied to the research results. The availability of more
sophisticated statistical methods would provide concrete, statistical significance beyond
the qualitative data analysis methods typically utilized in sustainability reporting research.
Consequently, these research results could determine correlations between organizational
characteristics and sustainability report compliance beyond those associated with only A+
sustainability reports.

LIST OF REFERENCES

60
LIST OF REFERENCES
Azapagic, A., & Perdan, S. (2000). Indicators of sustainable development for industry: A general framework. Institution of Chemical Engineers Trans IChemE, 78(B), 243-261.
Bernhart, M. (2009, October). The rules of the game. Communication World, 26(5), 25-
28. Business in the Community, FTSE Group, & Insight Investments, Effective Board Action
on Corporate Responsibility. (2005). Rewarding Virtue. London: Business in the Community.
EPA. (2011). EPA history. United States Environmental Protection Agency. Retrieved
from http://www.epa.gov/history/. Farneti, F., & Guthrie, J. (2007). Sustainability reporting by Australian public sector
organizations: Why they report?. Proceedings of the Financial Reporting & Business Communication Research Unit 11th Annual Conference. Financial Reporting & Business Communication Unit, Cardiff, Wales.
Fonseca, A., Macdonald, A., Dandy, E., & Valenti, P. (2010). The state of sustainability
reporting at Canadian universities. International Journal of Sustainability in Higher Education, 12(1), 22-40. doi: 10.1108/14676371111098285
Gallego, I. (2006). The use of economic, social and environmental indicators as a
measure of sustainable development in Spain. Corporate Social Responsibility and Environmental Management, 13, 78-97. doi: 10.1002/csr.094
Goodman, P. (2009, August 28). Reluctance to spend may be legacy of recession. The
New York Times. Retrieved from http://www.nytimes.com Guthrie, J., & Farneti, F. (2008). GRI sustainability reporting by Australian public sector
organizations. Public Money and Management, 28(6), 361-366. doi: 10.1111/j.1467-9302.2008.00670.x
GRI. (2005). Sector supplement for public agencies (Pilot Version 1.0) Amsterdam,
Netherlands: GRI.

61
GRI. (2006). G3 Sustainability Reporting Guidelines. Global Reporting Initiative. Amsterdam, Netherlands: GRI.
GRI. (2007). Global Reporting Initiative. Retrieved from http://www.globalreporting.org GRI. (2010). Global Reporting Initiative. Retrieved from http://www.globalreporting.org GRI (2011). GRI Reports List. [Data file]. Retrieved from
http://www.globalreporting.org/ReportServices/GRIReportsList/ KPMG. (2008). International survey of corporate responsibility reporting 2008.
Netherlands, Amsterdam: A. Slater. Labuschagne, C., Brent, A., & Erck, R.P.G. (2003). Assessing the sustainability
performances of industries. Journal of Cleaner Production, 13, 373-385. doi: 10.1016/j.jclepro.2003.10.007
Lamprinidi, S., & Kubo, N. (2008). Debate: The Global Reporting Initiative and public
agencies. Public Money and Management, 28(6), 326-329. Lozano, R., & Huisingh, D. (2011). Inter-linking issues and dimensions in sustainability
reporting. Journal of Cleaner Production, 19, 99-107. MacDonald, A., & Thomson, A. (2011, March 3). U.K. economic data turn negative as
more cuts loom. The Wall Street Journal. Retrieved from http://online.wsj.com McMichael, A. (2008). Population, human resources, health, and the environment:
Getting the right balance. Environment, 50(1), 46-59. National Environment Agency, Singapore Environment Institute. (2004). The worldwide
sustainability timeline. Retrieved fromhttp://www.nea.gov.sg/cms/sei/SEI sustainabilitytimeline.pdf
Sekaran, U., & Bougie, R. (2010). Research methods for business: A skill building
approach. Data collection methods (pp.180). Chichester, West Sussex: John Wiley & Sons Ltd.
Sherman, S. (2001, Nov/Dec). Environmental Truths [Review of the book Silent Spring,
by R. Carson]. Columbia Journalism Review, 40(4), 52-53. Skouloudis, A., Evangelinos, K., & Kourmousis, F. (2010). Assessing non-financial
reports according to the Global Reporting Initiative guidelines: Evidence from Greece. Journal of Cleaner Production, 18, 426-438.
WCED. (1987). Our common future. World Commission on Environment and
Development. Oxford: Oxford University Press.

62
Woods, M. (2003). The Global Reporting Initiative. CPA Journal, 73(6), 60-65.

APPENDICES

63
Appendix A. Distributed Survey Questions
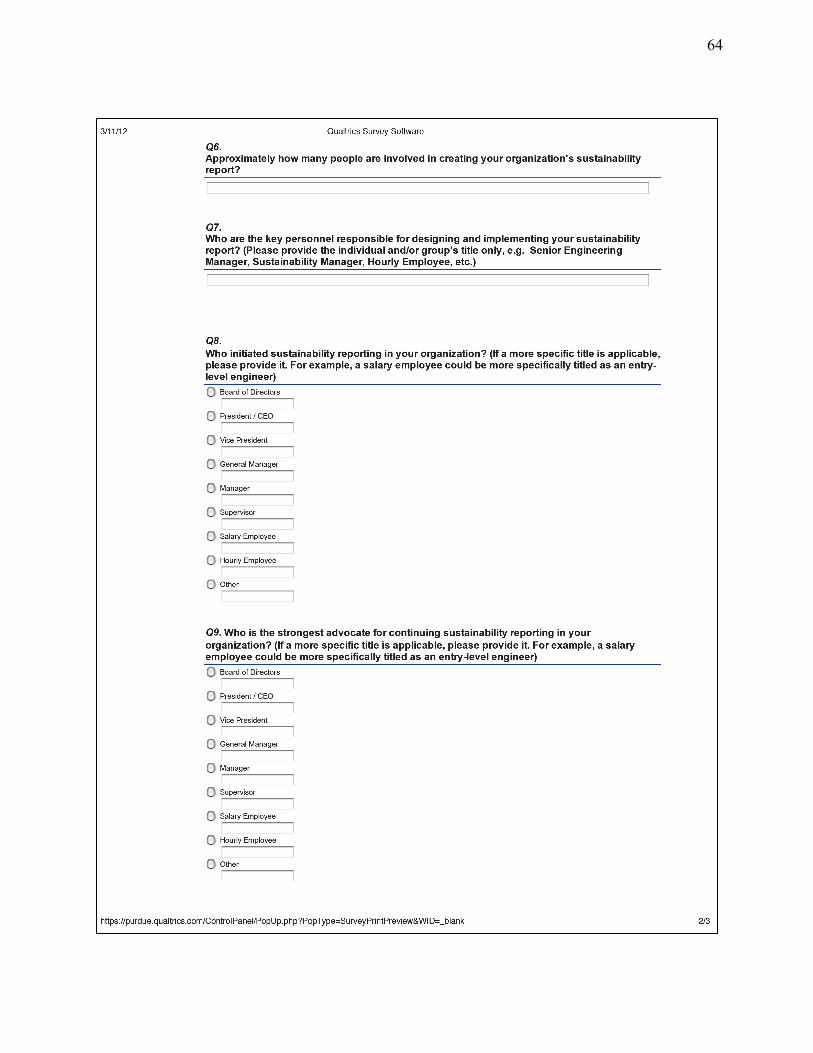
64

65

66
Appendix B. Email Correspondence

67
Appendix C. Short-Answer Analysis Method
Short-Answer Method Used on Survey Question 3.
Short-Answer Method Used on Survey Question 4.

68
Short-Answer Method Used on Survey Question 7.
Short-Answer Method Used on Survey Question 10.

69
Short-Answer Method Used on Survey Question 14:
Short-Answer Method Used on Survey Question 15.