the effects of napping on night shift performance · 2012-05-31 · in fact, both the long nap of 2...
TRANSCRIPT
DOT/FAA/AM-00/10
U.S. Departmentof Transpor tation
Federal AviationAdministration
Pamela S. Della RoccoCarlos ComperatoreLynn CaldwellCrystal Cruz
Civil Aeromedical InstituteFederal Aviation AdministrationOklahoma City, Oklahoma 73125
February 2000
Final Report
This document is available to the publicthrough the National Technical InformationService, Springfield, Virginia 22161.
Office of Aviation MedicineWashington, D.C. 20591
The Effects of Napping onNight Shift Performance

N O T I C E
This document is disseminated under the sponsorship ofthe U.S. Department of Transportation in the interest of
information exchange. The United States Governmentassumes no liability for the contents thereof.
i
Technical Report Documentation Page
1. Report No. 2. Government Accession No. 3. Recipient's Catalog No.
DOT/FAA/AM-00/104. Title and Subtitle 5. Report Date
The Effects of Napping on Night Shift Performance February 20006. Performing Organization Code
7. Author(s) 8. Performing Organization Report No.
Della Rocco, P.S., Comperatore, C., Caldwell, L., and Cruz, C.
9. Performing Organization Name and Address 10. Work Unit No. (TRAIS)
11. Contract or Grant No.
FAA Civil Aeromedical InstituteP.O. Box 25082Oklahoma City, OK 73125
12. Sponsoring Agency name and Address 13. Type of Report and Period Covered
Office of Aviation MedicineFederal Aviation Administration 14. Sponsoring Agency Code
800 Independence Ave., S.W.Washington, DC 2059115. Supplemental Notes
16. Abstract
This study represents a collaborative effort between the Federal Aviation Administration’s Civil Aeromedical Instituteand the US Army Aeromedical Research Laboratory to investigate the effects of napping on the midnight shift as apotential countermeasure to sleepiness during the shift. The purpose of the present paper was to examine the patterns ofperformance degradation along with the subjective measures of mood, sleep quality, and sleepiness as a function ofnapping condition and time on task during the midnight shift. Sixty Air Traffic Control Specialists (ATCSs) wererandomly assigned to one of the three midnight shift napping conditions: a long nap (LN) of 2 hours, a short nap (SN)of 45 minutes, and a no nap condition (NN). ATCSs completed a four-day protocol during which they worked threeearly morning shifts (0700-1500) followed by a rapid rotation to the midnight shift (2300-0700). Subjects completedthree 1.5 hour test sessions (one session before the nap and 2 sessions after the nap) during the midnight shift involvingtwo computer-based tasks: 1) the Air Traffic Scenarios Test (ATST), a task developed for selection of ATCSs, and 2)the Bakan, a test of vigilance. Data were analyzed using repeated measures analysis of variance and post-hoc multiplecomparisons. Both cognitive performance and subjective measures of sleepiness supported the use of naps during themidnight shift. In fact, both the long nap of 2 hours and the short nap of 45 minutes resulted in better performancethan no nap on the Bakan test at the end of the midnight shift. A dose-response relationship existed such that the longnap also resulted in better performance than the short nap. The ATST, on the other hand, was much less sensitive todifferences in napping condition and even to the natural circadian trough, which would have been expected to affect allgroups. Sleepiness ratings on the Stanford Sleepiness Scale suggested that, while sleepiness increased across the midnightshift for all groups, ratings were generally lower for the LN condition and were lower for males in the SN condition,when compared with the NN condition. The present study suggests that naps taken during the midnight shift could beuseful as a countermeasure to performance decrement and sleepiness on the midnight shift.
17. Key Words 18. Distribution Statement
Air Traffic Control Specialists, Naps, Shiftwork, NightShift, Performance, Vigilance, Sleepiness, Sleep Quality,Mood
Document is available to the public through theNational Technical Information Service,Springfield, Virginia 22161
19. Security Classif. (of this report) 20. Security Classif. (of this page) 21. No. of Pages 22. Price
Unclassified Unclassified 36Form DOT F 1700.7 (8-72) Reproduction of completed page authorized

1
THE EFFECTS OF NAPPING ON NIGHT SHIFT PERFORMANCE
Sleepiness on the first midnight shift of a workschedule is common among shiftworkers when theircircadian rhythms are day-oriented. Effective coun-termeasures for sleepiness are important for employ-ees in a safety critical job such as the Federal AviationAdministration’s (FAA) Air Traffic Control Special-ist (ATCS). The Human Factors Research Labora-tory (HFRL) at the Civil Aeromedical Institute(CAMI) was asked by the Miami Air Route TrafficControl Center to investigate sleepiness on the mid-night shift. They specifically requested informationabout the possibility of using a scheduled nap as amethod to reduce sleepiness and maintain alertnessduring this shift.
The shift schedules worked by ATCSs often mini-mize the employee’s exposure to the midnight shift(Cruz & Della Rocco, 1995). ATCSs generally workonly one or two midnight shifts in a row. Thus, acircadian adaptation strategy of shifting the biologicalclock to a night orientation is not practical in thispopulation because of the time courses required to shiftthe clock to a night orientation and return back to a dayorientation. An acutely administered coping strategy,such as scheduled napping, therefore, was a more rea-sonable candidate for a sleepiness countermeasure.
The purpose of this study was to determine theeffect of naps taken during a night shift on sleepinessand performance after awakening and throughoutthe duty hours following the nap. Issues related tosleep duration and sleep inertia were investigated.The study specifically compared two napping condi-tions, a Long Nap (2 hours) and a Short Nap (45minutes), to a No Nap condition. Performance wasexamined on two tasks, an air traffic scenarios task(high workload) and a vigilance task (low workload).
BACKGROUND
The problems associated with night and shift workhave been investigated by many researchers over thepast several years (Folkard, 1989; Wilkinson, 1992).These problems include physiological, psychologi-cal, and social difficulties experienced by people who
must change their sleep/wake schedule from dayactivity and night sleep to day sleep and night activity(Anch, Browman, Mitler, & Walsh, 1988).
Research indicates that a major problem amongshift workers is disturbed sleep. Daytime sleep isshorter than nighttime sleep and tends to be frag-mented (Torsvall, Akerstedt, Gillander, & Knutsson,1989; Tilley, Wilkinson, Warren, Watson, & Drud,1982). In addition, the order of slow wave sleep (SWS)and rapid eye movement (REM) sleep is disturbed, withmore REM sleep occurring at the beginning of the sleepperiod and more SWS occurring at the end, the oppositeof the natural SWS/REM pattern (Tilley et al., 1982).Due to the disturbance in sleep, research shows that shiftworkers nap more frequently than daytime workers tocompensate for the sleep loss (cf Rosa, 1993; Akerstedt& Torvsall, 1985).
Research also shows that night workers have in-creased sleepiness during work, with most sleepinessoccurring during the last half of the work shift(Akerstedt, Torsvall, & Gillberg, 1982). This in-crease in sleepiness during work leads to a decrease inperformance (Mitler, Carskadon, Czeisler, Dement,Dinges & Graeber, 1988), an increase in accidents(Ribak, Ashkenazi, Klepfish, Avgar, Tall, Kallner &Noyman, 1983), and an increase in spontaneous napson the job (Torsvall & Akerstedt, 1987; Torsvall etal., 1989). According to a report by the Association ofProfessional Sleep Societies’ Committee on Catas-trophes, Sleep and Public Policy, heart attacks, ve-hicular accidents, performance errors, and majordisasters are more likely to occur during the earlymorning hours of shift work (Mitler et al., 1988).Other researchers have reported increased accidentsdue to sleepiness in night workers (Hamelin, 1987;Ribak et al., 1983; Torsvall & Akerstedt, 1987).Abuse of substances such as nicotine, caffeine, andother stimulants to help maintain alertness, and sleep-ing pills to help obtain sleep also have been reported(cf Penn & Bootzin, 1990).
According to Czeisler and his colleagues (Czeisler,Kronauer, Allan, Duffy, Jewett, Brown & Ronda,1989; Czeisler, Johnson, Duffy, Brown, Ronda &

2
Kronauer, 1990), the problems associated with nightwork — sleep problems, fatigue and sleepiness, anddecreased performance — result from a desynch-ronization of the circadian cycle. Other problems inshift workers stem from the social and family disrup-tions associated with shift work (Penn & Bootzin,1990). Workers desiring to spend time with familyand friends may not sleep when the opportunitycomes, leading to more fatigue and lack of sleep dueto social and family activities.
Because of the problems inherent with night work,many interventions have been attempted to alleviatethe ill effects. Some of the methods undertakenduring the night shift to increase arousal and perfor-mance include rest breaks, social activity duringbreaks, increasing task demands, feedback about workperformance, exercise, bright lights, and naps (Penn& Bootzin, 1990; Bonnet, 1990). Napping seems tobe an effective, inexpensive way to help alleviate thesleepiness experienced during night work, particu-larly for those night workers whose schedules requireminimal exposure to night work and circadian adap-tation to a night shift is not desirable.
Naitoh, Englund, and Ryman (1982) indicate thatseveral variables must be considered when schedulingnaps during a prolonged work period. These variablesare as follows: 1) the extent of sleep loss prior to thework period (i.e., sleep deprivation), 2) the length ofthe nap, 3) the placement of the nap within thecircadian phase, and 4) the length of time betweenthe end of the nap and the work period.
Sleep deprivation. The length of the total sleepdeprivation period is an important factor when deter-mining whether a nap will be beneficial. Most datasuggest that the best time to nap is before significantsleep loss has occurred; however, naps do not com-pletely reverse the effects of sleep loss (Bonnet, 1991;Dinges, Orne, Whitehouse, & Orne, 1987). In astudy conducted by Bonnet (1991), subjects werekept awake for 52 hours. A nap taken before thecontinuous wake period was beneficial in keepingperformance and alertness from decreasing for up to24 hours of sleep loss, as compared to a No Napcondition. By the second night of sleep loss, thebenefit of the naps could not be reliably measured.Other studies have found similar results using only24 hours of sleep deprivation (Dinges et al., 1987;Gillberg, 1984; Nicholson, Pascoe, Roehrs, Roth,Spencer, Stone & Zorick, 1985; Bonnet, 1990). Thefindings from each of these studies indicate that a nap
taken before an extended sleep loss period, called“prophylactic naps”, will considerably attenuate thedecrease in performance during a night shift.
Length of nap. It is very difficult to compare manyof the nap studies due to variations in methodology,however, most studies indicate that naps from 1 hourto 8 hours will improve performance and alertnessduring continuous operations (Bonnet, 1991). In astudy by Naitoh and colleagues (1982), subjects weregiven a 3-hour nap after being awake for approxi-mately 24 hours. After the nap, they were required tostay awake an additional 20 hours. Results indicatedthat this 3-hour nap reduced the decline in perfor-mance over the additional work period.
Another study (Lumley, Roehrs, Zorick, Lamphere,& Roth, 1986) deprived subjects of sleep for 24hours, after which a nap of either 15, 30, 60, or 120minutes was given. The results indicated that alert-ness increased with the increase in nap length, withthe highest level of alertness occurring after the 60-minute nap. There was no difference between the 60-minute nap and the 120-minute nap, possibly due tofragmentation of the sleep in the longer nap. Theauthors concluded that the alerting effects of naps arerelated to the length of the nap.
The same relationship between nap length and per-formance was found in a study by Bonnet (1991) whichallowed subjects either a 2, 4, or 8-hour nap before 52hours of continuous operations. The results indicated adose-response relationship between the length of thenap and performance during the first 24 hours of sleepdeprivation. Based on this type of nap, Bonnet con-cluded that the nap one takes before an all-night shiftshould be as long as possible to have a maximum benefiton performance. He also states that a nap should ideallybe prophylactic, and not used to replace lost sleep fromthe regular sleep period. Prophylactic naps may be morebeneficial during a sleep deprivation period than a napduring the continuous wakefulness period (Mullaney,Kripke, Fleck, & Johnson, 1983; Gillberg, 1984;Nicholson et al., 1985; Carskadon & Dement, 1982;Haslam, 1985).
In a study by NASA (Graeber, Rosekind, Connell,& Dinges, 1990), one group of pilots was given a 40-minute rest period followed by a 20-minute recoveryperiod during a long-haul flight. Performance wasmaintained at consistent levels, and physiologicalalertness was higher during the last 90 minutes offlight. These naps were implemented with no evi-dence of compromised safety. In a group which was
3
not allowed a rest period, the occurrence of reducedphysiological alertness (micro-events) was five timeshigher than in the group who took a nap. Althoughcurrent regulations prohibit sleep in the cockpit, theresults of this study indicated that a planned restperiod during the cruise portion of long-haul flightsmay increase safety by reducing uncontrolled andinvoluntary napping and increase safety associatedwith higher alertness at the end of the flight.
Generally, studies conclude that a nap of 1 to 4hours in length prior to a night work period im-proved morning performance and alertness abovethat seen without a nap. As summarized by Bonnet(1990), results from many studies indicate that napsdo not totally eliminate the circadian dip seen in theearly morning (around 0500), but the degradation inboth cognitive performance and alertness is attenuated.
Circadian placement of nap. Much research hasbeen conducted to determine the circadian pattern ofsleep and alertness. Sleep tendency is highest whencore body temperature is in its trough, around 0300,and is lowest when core body temperature is at itspeak, around 1500 (Dinges, 1986). The effects ofnaps taken during the circadian trough are differentfrom the effects of naps taken during the circadianpeak. Research in which a 2-hour nap was given atfive different times within a 24-hour period indi-cated that a nap taken during the early morningreinforced the circadian rhythm of temperature,strengthening the normal fall and rise of core tem-perature (Matsumoto, 1981). A study by Naitoh,Englund, and Ryman (1982) indicated that a 3-hournap taken between 0400 and 0700 after 20 hours ofcontinuous wakefulness reduced the amount of per-formance degradation seen upon awakening whencompared to a no nap group. Gillberg (1984) exam-ined the effects of a 1-hour nap on subjects after only24 hours of sleep deprivation. Two nap times weretested — 2100 and 0430. Both naps improved per-formance the following morning when compared toa no nap group, especially the nap taken at 0430.Other studies indicated that early morning naps arebeneficial in restoring alertness and performance(Matsumoto, 1981; Naitoh, Englund, & Ryman,1982; Gillberg, 1984). Dinges and colleagues (Dinges,Whitehouse, Orne & Orne, 1988) found that a naptaken anywhere in the circadian cycle before a sleeploss period will be beneficial in maintaining perfor-mance across the sleep loss period.
Another use of naps is as an adjunct to the regularsleep period. There is substantial evidence that a naptaken during the day before an all-night work shift,but no sleep loss prior to the shift, will result in lessperformance decrement over the night than withoutthe nap. Schweitzer, Muehlback & Walsh (1992)measured performance and alertness in subjects whoreceived a 2- to 3-hour nap before the night shift.Although the usual circadian trough was seen in theearly morning, the nap attenuated the decline inperformance when compared to a night when no napwas taken prior to the shift.
A study by Matsumoto and Harada (1994) indi-cated that a nap taken during the night work periodcan help alleviate the fatigue caused by night work, apractice commonly used in Japan. A study by Rogers,Spencer, Stone, & Nicholson (1989) found that a 1-hour nap taken at 0200 during a work period hadlimited beneficial effects on performance comparedto a no nap condition.
Time between the nap and the work period.When scheduling a nap, one should consider whetherperformance is required immediately upon awaken-ing. Performance is generally low immediately uponawakening, but recovers usually after 15 to 30 min-utes (Dinges, Orne, & Orne, 1985). This decrease inperformance shortly after awakening is called “sleepinertia.” Several factors will lead to extensive sleepinertia: awakening from non-rapid eye movement(NREM) sleep, especially slow wave sleep (SWS);awakening within the first few hours of sleep; andsleep following a long period of sleep deprivation(Dinges, Orne, & Orne, 1985). Studies show thatpost-nap sleepiness is higher and performance islower when one is awakened from a nap during thecircadian trough as compared to a nap taken duringthe circadian peak (Dinges, Orne, & Orne, 1985).Lavie and Weler (1989) found that, after 32 hours ofsleep deprivation, a 2-hour nap taken at 1500 pro-duced less sleep inertia than a 2-hour nap taken at1900. However, the later nap was more successful inreducing sleepiness levels during the early morning(2300 to 0400) than the early nap. In a study byDinges and associates (1985), subjects deprived ofsleep for 54 hours were given 2-hour naps at varioustimes in the circadian cycle, corresponding to peaksand troughs in the cycle. The results indicated thatnaps taken during the circadian troughs led to greaterperformance decrements than did naps taken during

4
the circadian peaks. The authors concluded thatduring continuous performance operations, naps inthe circadian trough should be avoided, and napsshould be taken before a person’s sleep loss extendsbeyond 36 hours.
In summary, some research indicates that a napduring the night shift would be beneficial in reducingthe circadian trough in performance usually seen inthe early morning hours. When a person must returnto work immediately upon awakening, sleep inertiashould be considered. This decrease in performancedue to sleep inertia is worse when one is awakenedfrom slow wave sleep, during the circadian trough, orafter a long period of sleep deprivation.
Miami ARTCC ATCSs requested a study examin-ing the utility of naps taken on the night shift as a wayto alleviate sleepiness and maintain alertness. SinceATCSs are generally scheduled for only one or twonight shifts per work week, it is undesirable to shifttheir circadian rhythms to a night shift. Allowing anap during the work shift may serve to: 1) improvealertness and maintain performance, 2) strengthenthe normal rise and fall of the temperature curve, 3)provide an anchor sleep that could maintain stabilityin the sleep/wake cycle, and 4) decrease the amountof unscheduled napping by workers who have adifficult time staying awake, thus enhancing safetyduring the shift.
The present study examined the effects of twodifferent nap lengths scheduled prior to and into theapproximate circadian trough on the ability of bothmale and female ATCSs to maintain alertness andperformance levels during a night shift. The ques-tions addressed were as follows: 1) Does a nap takenduring a night shift decrease subsequent sleepinessand maintain performance during the remainder ofthe shift when compared with alertness and perfor-mance without a nap? 2) Do the effects of a 45-minute nap differ from the effects of a 120-minutenap on alertness and performance? 3) Are there gen-der differences in response to a nap taken during thenight shift? The two types of performance tasks, thelow fidelity air traffic control (ATC) simulation andthe vigilance task, were used to assess performancerelevant to ATC.
METHODS
The study compared naps of two different dura-tions to a No Nap (NN) condition. The long-nap(LN) was 120 minutes. The short-nap (SN) was 45minutes. The protocol involved 9 days of subjectparticipation. During the first five days, subjectswere asked to wear wrist activity monitors and tomaintain a sleep/wake cycle ensuring day-orientationof the circadian rhythms. On the fifth day (Sundayevening), subjects reported to the sleep laboratory atthe U.S. Army Aeromedical Research Laboratory inFt. Rucker, Alabama where they maintained resi-dence for the remainder of the study. The laboratoryprotocol involved three days of synthetic work (com-puterized test battery) on an early morning schedule(0700-1500) followed by a quick-turn-around (8hours off duty) to a night shift (2300-0700). Subjectswere trained on the computerized test battery duringthe three day shifts. The effects of napping wereassessed on the night shift.
SubjectsSubject recruitment and reimbursement. Army
participants were recruited through the Commander’soffice of the 1-11th Aviation Regiment. The studywas coordinated with the FAA Office of Air TrafficProgram Management (ATZ-1). FAA participantswere recruited through active assistance of the Na-tional Air Traffic Controllers Association (NATCA)and coordination with FAA Regional Air TrafficOffices. Information regarding the study was distrib-uted to FAA Air Traffic Regional Vice Presidents. Acontact in each region was established to coordinateparticipation in the study with CAMI staff. Individu-als interested in participating provided their name tothe regional contact person. CAMI staff contactedvolunteers to conduct screening and to obtain in-formed consent to participate in the study. In addi-tion to their normal salary for a 40-hour work weekfor the 5-day period of travel and participation, FAAATCSs received 5 hours of overtime pay, 2 hours ofSunday premium pay, and 8 hours of midnight shiftdifferential. All travel expenses and per diem werepaid by the FAA.
Subject selection. FAA ATCSs were required tohold FAA medical certification. Army air trafficcontrollers underwent a brief medical examination
5
by the USAARL medical monitor to ensure that theymet Class II standards. Volunteers were excluded for1) hypertension, 2) taking medication which couldnot be discontinued during study participation, 3)use of tobacco products, 4) high caffeine consump-tion (more than 3 cups of coffee or 6 colas containingcaffeine, or 6 cups or glasses of tea per day), or 5) anymedical disorder which sleep deprivation may exag-gerate. All subjects were selected between the ages of20 and 40. One female ATCS was included eventhough she turned 41 prior to being scheduled toparticipate.
A total of 65 air traffic controllers completed thestudy protocol. Four of the controllers were membersof the Army 1-11th Aviation Regiment and workedin a tower. The remaining 61 controllers were em-ployed by the FAA. Two additional FAA ATCSsbegan participation but withdrew from the studybefore completing the protocol. One of these partici-pants experienced insomnia during the first twonights of the protocol. The other participant whowithdrew from the study did not like wearing theEEG electrodes. The FAA ATCSs were from bothterminal and enroute facilities, representing all geo-graphic regions of the United States. Subjects wererandomly assigned to Nap Condition by Genderresulting in the following groups: 1) Short Nap male(SNM), 2) Short Nap female (SNF), 3) Long Napmale (LNM), 4) Long Nap female (LNF), 5) No Napmale (NNM), and 6) No Nap female (NNF).
Data from 59 participants are reported here. Datafrom six of the 65 were not included in these analyses.Of those six, four subjects’ computer files for themidnight shift performance on the Air Traffic Sce-narios Test were unrecoverable, and two subjectsassigned to the No Nap Condition were determinedby EEG scoring to have taken naps of at least 30minutes in length on the midnight shift. The result-ing groups were as follows: 1) SNM, (n=10), 2) SNF,(n=10), 3) LNM, (n=10), 4) LNF, (n=10), 5) NNM,(n=8), and 6) NNF, (n=11).
Subject demographics. The average age of the 59volunteers was 33.4 years (sd=3.9 years). The femaleparticipants were slightly younger on average (M=32.2years, sd=4.0 years) than the male participants(M=34.8 years, sd=3.3 years). The majority of par-ticipants (n=54, 91.5%) were Caucasian; two (3.4%)
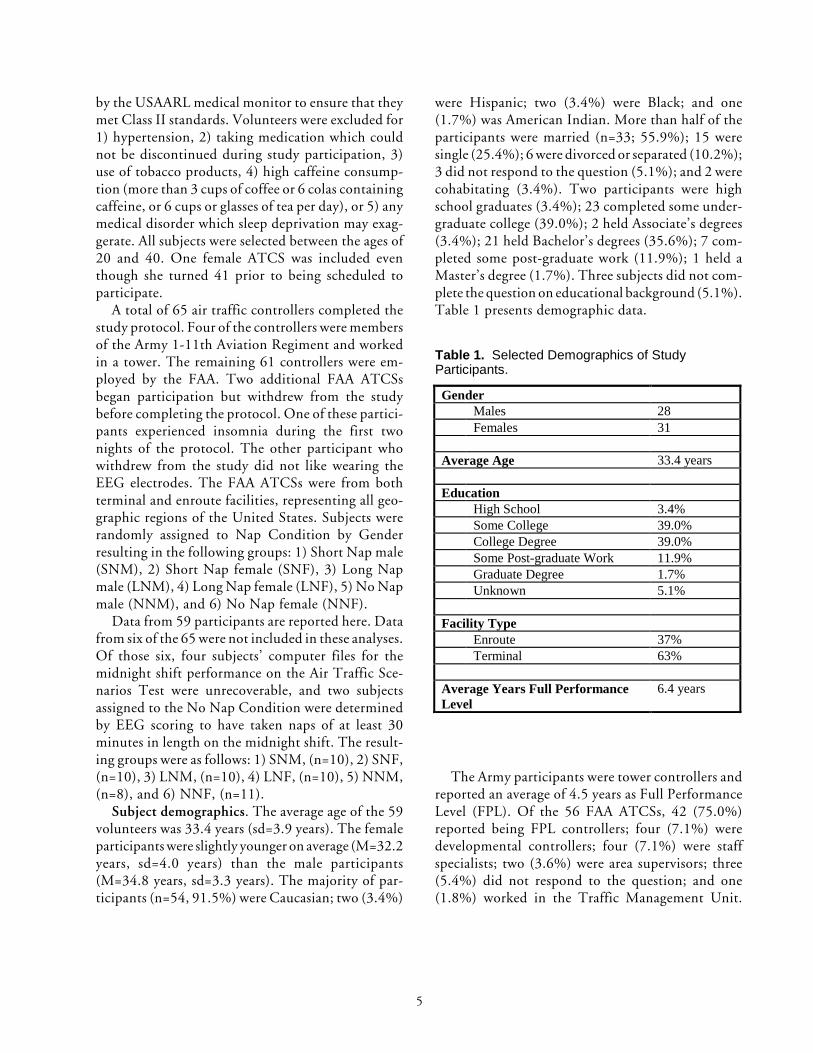
were Hispanic; two (3.4%) were Black; and one(1.7%) was American Indian. More than half of theparticipants were married (n=33; 55.9%); 15 weresingle (25.4%); 6 were divorced or separated (10.2%);3 did not respond to the question (5.1%); and 2 werecohabitating (3.4%). Two participants were highschool graduates (3.4%); 23 completed some under-graduate college (39.0%); 2 held Associate’s degrees(3.4%); 21 held Bachelor’s degrees (35.6%); 7 com-pleted some post-graduate work (11.9%); 1 held aMaster’s degree (1.7%). Three subjects did not com-plete the question on educational background (5.1%).Table 1 presents demographic data.
The Army participants were tower controllers andreported an average of 4.5 years as Full PerformanceLevel (FPL). Of the 56 FAA ATCSs, 42 (75.0%)reported being FPL controllers; four (7.1%) weredevelopmental controllers; four (7.1%) were staffspecialists; two (3.6%) were area supervisors; three(5.4%) did not respond to the question; and one(1.8%) worked in the Traffic Management Unit.
Table 1. Selected Demographics of StudyParticipants.
GenderMales 28Females 31
Average Age 33.4 years
EducationHigh School 3.4%Some College 39.0%College Degree 39.0%Some Post-graduate Work 11.9%Graduate Degree 1.7%Unknown 5.1%
Facility TypeEnroute 37%Terminal 63%
Average Years Full PerformanceLevel
6.4 years

6
Twenty-two were from the enroute option and thirty-seven were from the terminal option. The partici-pants in the study reported having an average of 9.2years experience as air traffic controllers and 6.4 yearsof experience as FPL controllers. Table 2 provides abreakdown by Gender and geographic region for theparticipants included in the data analysis.
In previous studies the Digit Span from theWechsler Adult Intelligence Scale (WAIS) (Wechsler,1955) and the Shipley Institute of Living Scale(Zachary, 1986) have been administered for purposesof matching non-ATCS volunteers with ATCSs.These tests were administered to support selection ofnoncontroller subjects in case an insufficient numberof Army or FAA ATCSs volunteered for the study.Although enough ATCSs volunteered, the data fromthese measures are presented in Table 3.
MeasuresCognitive performance measures. Evaluations of
performance were measured by two tests, the AirTraffic Scenarios Test (ATST) (Broach & Brecht-Clark, 1994), and a modified version of the Bakanvigilance test (Dollins, Lynch, Wurtman, Deng,Kischka, Gleason, & Lieberman, 1993). The ATSTwas a low fidelity simulation of radar-based air trafficcontrol used by the FAA for a couple of years in thePre-Training Screen (PTS) test battery to screen airtraffic controllers before they were hired. The modifiedversion of the Bakan previously has been shown to besensitive to alertness degradation (Dollins et al., 1993).
The ATST software used in this study was fromthe DOS-based, International Air Traffic ControlSpecialist (termed Eurotest) version of the PTS battery(Broach, Enos & Moore, 1994). The ATST served as
Table 2. Breakdown of Study Participants by Region and Gender.
Region Males Females TOTAL
Army (Ft. Rucker, AL) 3 0 3Southern Region 2 4 6Eastern Region 2 4 6New England Region 3 2 5Alaska Region 3 1 4Great Lakes Region 2 11 13Southwest Region 6 5 11Central Region 2 3 5Western Pacific Region 2 0 2Northwest Mountain 3 1 4
Total 28 31 59
Table 3. Descriptive Statistics from Digit Span and Shipley Institute of Living Scale Tests.
Males Females Total(N=28) (N=31) (N=59)
Mean SD Mean SD Mean SDDigit Span
Forward 10.5 2.3 10.4 2.3 10.5 2.3Backward 7.8 2.1 8.1 2.5 8.0 2.3
Shipley Institute of Living ScaleVerbal 34.2 2.4 33.3 3.2 33.7 2.9Abstract 34.2 3.5 34.3 3.1 34.3 3.3Combined 68.3 5.0 67.7 4.6 68.0 4.8WAIS-R Equivalent 109.9 4.6 109.6 4.5 109.7 4.5

7
a computer-administered, low fidelity work samplethat required the subject to control a predeterminednumber of aircraft within a simplified synthetic air-space, directing them to their destinations accordingto a small set of rules. A computer-based instructionmodule provided standardized training. Twenty-twopractice scenarios and seven test scenarios were ad-ministered. The scenarios escalated in complexity byincreasing the number of aircraft and changing theduration of the scenarios. The practice problemsranged from 11 aircraft in 16 minutes to 45 aircraftin 28 minutes. The test scenarios all involved 45aircraft in 27-28 minutes. The sequence of the prac-tice and test problems was modified from the Eurotestversion (Broach, Enos, & Moore, 1994). During thepractice sessions, two additional practice scenarioswere added by duplicating scenario 10 and 12 toprovide an 8-hour synthetic work day for 3 days. Theseven test scenarios were administered in the follow-ing order: EX1, EX4, EX2, EX5, EX3 EX6, and EX1.
Measures included from the ATST were in twocategories: errors and delays. Errors included incor-rect landing speed and level, incorrect gate speed andlevel, destination errors, separation errors, and crashes.All of these added together were analyzed as TotalErrors. The errors were divided into Procedural andSafety Errors. Safety errors included crashes andseparation errors. Procedural errors included incor-rect landing speed and level, incorrect gate speed andlevel, and destination errors. Delays were a measureof time (in minutes) required to handle the aircraft.Handoff Delays were computed from the time anaircraft, requiring acceptance of the handoff, waspresented on the screen to the time the controlleraccepted the handoff. For Enroute Delays, the systemcomputed the difference between the actual time toreach destination for each aircraft and the time re-quired if the aircraft had flown the optimum flightpath. Total Delays were the sum of Handoff andEnroute Delays.
The modified Bakan test had two components: astimuli comparison and an estimation task. A se-quence of three-digit numbers was presented on aCRT screen every 1.5 seconds for 30 minutes. Whena three-digit number was repeated in sequence, de-pressing the space bar on the keyboard indicated acorrect response. In addition to the three-digit stimuli,a single digit or letter was presented simultaneouslyto the right of the three-digit stimuli. At the end ofeach 5-minute block of trials, subjects were required
to indicate the proportion of numbers to letterspresented during that block. Six blocks of 200 trialswere presented in each session, which lasted approxi-mately 30 minutes.
Sleep EEG measures. Polysomnography was re-corded using Oxford Instruments ambulatoryMedilog electroencephalograph (EEG). Ag-AgClGrass electrodes were fixed to the scalp with collo-dion, and plugged into the Medilog unit. Poly-somnography records were recorded from scalp sitesC3 and C4 with the low-pass filter at 35 and the high-pass filter at 0.3. For the electrooculograms (EOGs),the low-pass filter was set at 5 and the high-pass filterwas 0.003. Electromyograms (EMG) were measuredwith the low-pass filter set at 120 and the high-passfilter set at 1.
Subjective measures. The Stanford Sleepiness Scale(SSS) (Hoddes, Zarcone, Smythe, Phillips, & De-ment, 1973) and the Positive and Negative AffectSchedule (PANAS) (Watson, Clark, & Tellegen,1988) were used to assess sleepiness and mood atvarious times throughout the protocol. The SSS wascomposed of seven statements ranging from “Feelingactive and vital; wide awake” to “Almost in reverie;sleep onset soon; losing struggle to remain awake.”The PANAS was composed of 20 adjectives (10representing positive affect [PA] and 10 representingnegative affect [NA]) and a five point scale rangingfrom “Very slightly or not at all” to “Extremely.” A 4-item sleep quality questionnaire was used to assesssleep quality in terms of difficulty falling asleep,depth of sleep, difficulty arising from sleep, and levelof restedness (Cruz & Della Rocco, 1995).
The subjective measures were collected in dailylogbooks. In addition, the logbooks were used tocollect self reports of sleep times, awakenings, physi-cal symptoms, meals, beverages, activities, and com-ments. The daily logbook was modified from thosedeveloped by the National Aeronautics and SpaceAdministration (Gander, Myhre, Graeber, Andersen,& Lauber, 1989).
Activity measures. Activity monitors (AMA 32C,version 8.6) from Precision Control Design wereused to study the rest/activity cycles of participants.Rest/activity data were analyzed to document eachparticipant’s sleep schedule for the 5 days beforecoming to the laboratory. The data collected at thelaboratory was used as a secondary measure to theEEG data for sleep duration and immobility.

8
The activity monitor was an 8-bit (expandable to16-bit), lithium battery-powered microprocessor with32 kB of nonvolatile RAM. The battery power wassufficient for 10-14 days of continuous operation.The monitor was approximately 44 mm x 33 mm x 13mm, made of water-resistant metal, and was worn onthe nondominant arm. It contained a piezoelectricmotion sensor and a real-time clock. Depending onthe parameters chosen, the monitor has a recom-mended operating range of accelerations from 0.3 to2.0 Gs, however it can handle as much as 10 Gs. Themonitor compares each signal against a threshold ofdetection. The activity monitor was used in thethreshold crossing mode. In this mode, a count wasregistered for each occurrence of a signal greater thanthe threshold of detection. Counts were accumulatedfor the duration of the user selected epoch (60 sec-onds) and were then stored in memory. This modeprovided a measure of frequency of movement. It wasprogrammed to operate for the duration of the study.Upon the participants’ arrival and departure from thelaboratory, data were transferred to permanent stor-age in a personal computer and analyzed off-line.
ProceduresThe protocol was reviewed and approved by the
USAARL Human Use and Scientific Review Com-mittees. Subjects were briefed about the study byCAMI or USAARL staff over the phone, and theinformed consent form was discussed in detail at least5 days prior to the study. Subjects signed the consentforms and returned them to CAMI. At least five daysprior to arriving at the USAARL laboratory, partici-pants received and were briefed on how to wear theWrist Activity Monitor. Monitors were worn 24-hours per day for the duration of the study, with theexception of during showers.
Participants arrived at the laboratory on Sundayevening and departed on Thursday afternoon. Theycompleted three day shifts (0700-1500) and onemidnight shift (2300-0700). Up to five subjectscould participate at the same time. A total of nineteengroups were required to complete data collection.Upon arrival Sunday evening, subjects checked inand were oriented to the laboratory. They completedbiographical questionnaires, the Shipley Institute ofLiving Scale, and the Digit Span tests. All subjectswere assigned to a semi-private bedroom and showerarea. Subjects were required to retire to their bed-rooms at 2230, and lights out was no later than 2300.Subjects were awakened each morning at 0530. Theywere allowed time to shower, dress, and eat breakfastbefore the first training session of the day. Napsduring the day were not allowed.
On Monday morning, subjects began training onthe cognitive tasks. Training sessions were adminis-tered for the 3 day shifts, with the test sessionsbeginning the night of day 3 and ending the morningof day 4. Table 4 presents the schedule for thetraining days.
Following the final training session at 1500 onDay 3, subjects were allowed to break but not allowedto nap before the midnight shift. Electrode place-ment for the midnight shift was initiated at approxi-mately 2100. The night shift began at 2300. Table 5presents the protocol schedule for the midnight shift.
All groups received a 30-minute break followingthe first test session (0030-0100) after which a 30minute ATST problem was administered to all groups.Subjects were informed about their napping condi-tion assignments at 0130. At 0145, the 120-minutenap was initiated. Short Nap subjects were placed onbreak at 0130 and in bed by 0300 and awakened by0345. The No Nap group was placed on break at
Table 4. Study Protocol.
Training Sessions for All Napping Conditions
Training Day 1 Training Day 2 Training Day 30700-0830 Orientation 0700-0830 Training 1 0700-0830 Training 10830-0900 Break 0830-0900 Break 0830-0900 Break0900-1030 Training 1 0900-1030 Training 2 0900-1030 Training 21030-1100 Break 1030-1100 Break 1030-1100 Break1100-1230 Training 2 1100-1230 Training 3 1100-1230 Training 31230-1330 Lunch 1230-1330 Lunch 1230-1330 Lunch1330-1500 Training 3 1330-1500 Training 4 1330-1500 Training 4

9
0130 and returned for testing at 0345. During thebreak for the Short Nap and No Nap groups, subjectsrelaxed in the break area. The subjects were notallowed to sleep during their break, but were permit-ted to read, watch television, or interact with othersubjects during the break time. Test Session 2 wasadministered within 5 minutes after awakening fromthe nap, but no later than 0345. Subjects in all theconditions received a 15-minute break after TestSession 2 (0515-0530). At 0530, the final test sessionbegan. Upon completing Session 3, subjects wereallowed to eat a light meal and return to their bed-rooms to sleep/rest for five hours. After a lunch break,subjects completed a final ATST scenario from 1330to 1400. Finally, subjects were debriefed and allowedto return to their homes.
The investigators controlled timing and contentof meals. Breakfast, lunch, and dinner were sched-uled at 0600, 1230, and 1800, respectively, duringthe day shifts. A snack before the first test session onthe midnight shift was allowed at 2200. The subjectswere allowed to consume light snacks during sched-uled breaks. No foods or beverages were allowedduring the testing period. Only light snacks and non-caffeinated beverages were allowed at any time duringthe night shift. One caffeinated beverage was allowedwith breakfast if the subject normally consumedcaffeine. No alcohol consumption was allowedthroughout the laboratory protocol. All food anddrink intake was recorded in the daily log book.
Cognitive performance. During orientation, sub-jects completed the computer-based instruction onthe ATST and four practice sessions. They were alsoinstructed on the Bakan. Subjects were provided
feedback about performance after each training test.Each session on the computerized test battery lastedapproximately 90 minutes and consisted of two 27 or28-minute ATST scenarios, separated by 30 minutesof the Bakan. The participants were given a total of 11practice sessions on the three day shifts and three fulltest sessions on the night shift. A single ATST prob-lem was administered just prior to notifying partici-pants about their napping conditions. A final sessionwas administered after a rest period following thenight shift to diminish the potential end-of-studyeffect on performance.
Sleep EEG. The electrodes were attached theevening before the second night of sleep. Subjectsslept with sensors attached to their scalp beginningthe second night in the laboratory (Monday night).To attach the EEG electrodes, the scalp was measuredaccording to the International 10-20 system for properlocation of sites C3 and C4. Each placement site wasrubbed with acetone to clean the scalp. Electrodeswere placed on the site and secured with collodion.After each electrode was secured, it was filled withelectrode paste. All impedances were maintained be-low 7-10 Kohms. EEG electrodes were referenced tothe contralateral mastoid. The EOG and EMG siteswere cleaned with acetone and the electrodes werefilled with electrode cream, placed on the cleanedsites, and secured with tape. EOG was recorded fromelectrodes placed approximately 2 cm below the outercanthus of the left eye and 2 cm above the outercanthus of the right eye. Both eye electrodes werereferenced to the left mastoid. Muscle tone wasmeasured by submental electrodes. Only the EOGand EMG electrodes were removed each morning.
Table 5. Midnight Shift Schedule for Each Nap Condition.
TIME No Nap Group Short Nap Group Long Nap Group2300-0030 ATST-Bakan-ATST ATST-Bakan-ATST ATST-Bakan-ATST0030-0100 Break Break Break0100-0130 ATST ATST ATST0130-0145 Break Break Break0145-0300 Break Break Nap0300-0345 Break Nap Nap0345-0520 ATST-Bakan-ATST ATST-Bakan-ATST ATST-Bakan-ATST0520-0530 Break Break Break0530-0700 ATST-Bakan-ATST ATST-Bakan-ATST ATST-Bakan-ATST0700-1200 Sleep Sleep Sleep1300-1330 ATST ATST ATST
10
These were reattached before bedtimes each night,before testing on day 3, and before the midnightshift. The stages of sleep were determined by guide-lines set forth by Rechtschaffen and Kales (1968).
Subjective measures. Subjects rated sleep qualityupon arising each day and upon arising from the nap.The PANAS was administered upon arising, at thebeginning of the workday, at the end of the workday,and at bedtime. The SSS was administered duringeach workday including the night shift before andafter each test battery session.
Data AnalysisSleep EEG and Wrist Activity Monitor measures.
Data were used to: 1) assess sleep quality before thenight shift, 2) determine the quality of the nap andensure that the No Nap subjects did not sleep, 3)determine sleep stage at the termination of the napand 4) to examine alertness during performance onthe last day shift and the night shift. The EEG datawill be reported elsewhere; however, nap data wereexamined to ensure that each of the participantsactually met napping condition criteria. Data fromthe wrist activity monitors were used to determinethe subject’s activity before coming to the laboratoryand were analyzed to determine sleep during the napwhen EEG data were unavailable.
Records of participants in the Short Nap conditionwere scored for sleep from approximately 0245-0345,while records from subjects in the Long and No Napconditions were scored from 0145-0345. EEG recordswere visually examined to identify and determine thetime of day for analysis. The actual beginning of thetime period varied from subject to subject because it wasset to the time in which EEG and EMG channelsexhibited a clear reduction in muscle activity as thesubject sat on the bed and lay down to sleep. Sleep stageswere identified using Rechtshaffen and Kales (1968) asimplemented in the Oxford polysomnography analysissoftware. Five records could not be scored automaticallybecause of faults in the electromagnetic storage me-dium. In these cases an experienced polysomnographyscorer visually scored the records using Rechtshaffenand Kales’ guidelines. Records of subjects in the No Napcondition were screened for evidence of sleep of 30 ormore minutes in duration. Two subjects’ records werefound to meet this criteria, but no other records werefound to have evidence of sleep. Data from subjectswhich exhibited sleep episodes lasting 30 or more min-utes were excluded from the analysis of performance.
Study design and analyses. The experimental de-sign was a 3 (Nap Condition) x 2 (Gender) x 3(Session) mixed factorial design with repeated mea-sures. Data from the three Test Sessions on themidnight shift were analyzed using SPSS version 7.5for Windows General Linear Model for repeatedmeasures. Pillai’s Trace multivariate analysis of vari-ance results were used to test the within-subjectseffects. Significant interaction and main effects wereanalyzed with post hoc multiple comparisons forbetween groups and within subjects per Toothaker(1991). Comparisons of the repeated factor(s), eitherwithin groups or collapsed over groups, were con-ducted using two correlated-sample t-tests and Dunncritical values (CV). Between-group comparisons,either within Session or collapsed over Session, wereconducted based on the t-statistics, tG and tG@T,where G equals group and T equals time, using TukeyCVs as described by Toothaker.
Cognitive performance measures. Analyses andhandling of missing data were conducted for theATST and Bakan as follows:
ATST — A total of 7 ATST scenarios were admin-istered on the midnight shift. Only those scenariosthat were included in a complete Session of ATST-Bakan-ATST were analyzed here. The third scenariowas administered as a single problem prior to thenapping conditions being announced and was notincluded in these analyses. A 3 (Nap Condition) X 2(Gender) X 3 (Session) X 2 (Pre-Post Bakan) factorialdesign with repeated measures on Session and Pre-post was analyzed for Enroute Delay (ERD), HandoffDelay (HOD), Total Delay (TD), Procedural Errors(PE), Safety Errors (SE) and Total Errors (TE) foreach of six ATST scenarios on the midnight shift.The ATST scenarios before and after each Bakan taskwere considered Pre- and Post-Bakan in the model.
Examination of the ATST data revealed 4 subjectswith data consistently identified as outliers on anumber of ATST measures. These subjects wereexcluded from the ATST analyses. The number ofsubjects in each group for analyses of the Errormeasures were as follows: 1) SNM, n=9; 2) SNF,n=10; 3) LNM, n=9; 4) LNF, n=9; 5) NNM, n=7;and 6) NNF, n=11. Data were lost for the Delay times(Enroute, Handoff and Total) for an additional 4subjects. Because this occurred for all of the scenarioson the night shift, they were dropped from theanalyses and no attempt was made to estimate values.The remaining number of subjects in each group for
11
analyses of the Delay times were as follows: 1) SNM,n=8; 2) SNF, n=10; 3) LNM, n=8; 4) LNF, n=9; 5)NNM, n=7; and 6) NNF, n=9.
Bakan — A 3 (Nap Condition) X 2 (Gender) X 3(Session) factorial design with repeated measures onSession was analyzed for 1) Correct Responses, 2)False Responses, and 3) Number/Letter Ratio Esti-mation. A total of three 30-minute Bakan Sessionswere administered and analyzed for the midnightshift. To investigate the effects of time on task, eachBakan Session was broken down into six 5-minuteblocks, resulting in a full model with two between-subjects factors (Nap Condition and Session) andtwo within-subjects factors (Session and Block).Planned multiple comparisons examined changeswithin and between groups for each Session.
Files for two subjects’ performance data on theBakan were corrupted, and therefore lost for theanalyses. This included the second midnight shiftsession for one subject in the NNM group and thefirst three of the five-minute blocks during the firstmidnight shift session for one subject in the NNFgroup. Both cases were handled by substituting themissing values with the NNM and NNF group aver-ages for those particular data points, respectively.
Subjective ratings. Analyses were conducted forthree subjective measures, Sleep Quality Ratings(SQR), the PANAS, and the Stanford SleepinessScale (SSS). Subjective ratings of the four sleep qual-ity dimensions and for the Overall Sleep Qualityscore were analyzed for the nap on the midnight shiftin a 3 (Nap Condition) x 2 (Gender) factorial model.For the scores on the PANAS, subjective ratings ofNA and PA for the beginning of the midnight shiftand the end of the midnight shift were analyzed in a3 (Nap Condition) x 2 (Gender) x 2 (Time) modelwith repeated measures on Time. One subject in theLNM group failed to respond to one adjective on thePANAS at the beginning of the midnight shift. Themissing rating was replaced with the mean of all of thesubject’s own ratings for that adjective. SSS subjectiveratings of sleepiness over the course of the midnightshift were analyzed in a 3 (Nap Condition) x 2(Gender) x 3 (Session) x 2 (Pre-Post) model withrepeated measures on Session and Pre-Post. A total ofseven subjects failed to respond to the SSS question-naire following the last work session of the midnightshift (1 NNF, 1 SNF, 1 SNM, 2 LNM, and 2 LNF).Scores were replaced for these individuals by groupmean substitution.
RESULTS
EEG AnalysesTwo NNM subjects were excluded from these analy-
ses because they exhibited one sleep episode for a periodof 30 minutes or greater during their break on themidnight shift. The remaining No Nap subjects did notexhibit sleep episodes during the break. Data fromsubjects in both Nap Conditions revealed sleep episodesconsistent with the assigned Nap Condition.
Air Traffic Scenarios Test (ATST) ResultsResults from this low fidelity air traffic control
simulation were reported for six measures from theATST: Enroute Delay (ERD), Handoff Delay(HOD), Total Delay (TD), Safety Errors (SE), Pro-cedural Errors (PE), and Total Errors (TE).
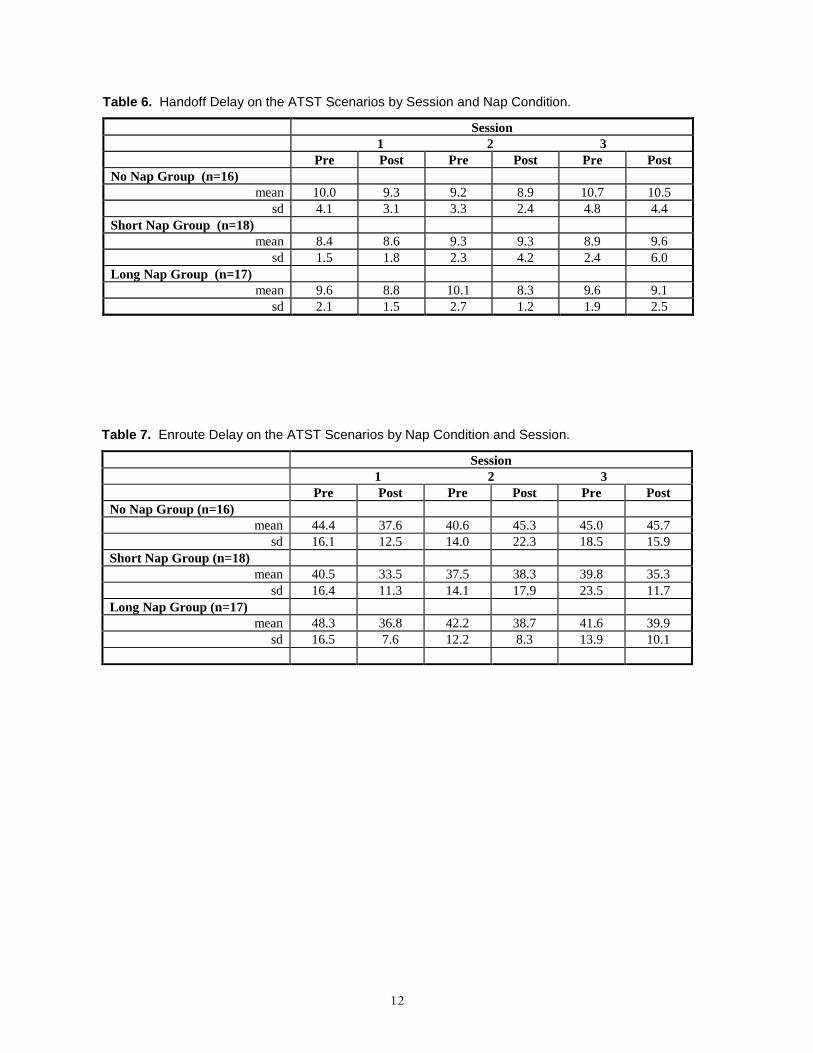
Delay time. Analyses revealed significant Sessionby Nap Condition interactions for both HOD,F(4,90)=3.03, p=.022, and ERD, F(4,90)=2.51,p=.047. There were no significant findings for TotalDelay or for Gender on any of the Delay measures.Tables 6 and 7 and Figures 1 and 2 present descriptiveinformation for HOD and ERD by Nap Conditionand Session, respectively, collapsed across Gender.
Multiple comparisons to investigate differencesbetween Nap Conditions at each level of Sessionrevealed no significant differences in HOD. The NoNap group (M=45.7) was found to have a signifi-cantly higher ERD on the last scenario at the end ofthe midnight shift than the Short Nap group(M=35.3), t=2.03, p<.05.
ATST errors. Results of the analyses of the threeerror measures — SE, PE, and TE — revealed noeffects of Nap Condition. However, a significantinteraction of Session by Gender was present for SE,F(2,48)=4.19, p=.021. Table 8 and Figure 3 presentdescriptive statistics for SE by Gender and Session.
Bakan ResultsThe Bakan provided a measure of vigilance. Three
measures on the Bakan <Bullet>— Correct Responses,False Responses, and Number/Letter Ratio Estimation— were analyzed. Results from the three sessions on thenight shift were as follows:
Correct responses. Results of the analysis revealed asignificant interaction for Nap Condition by Session,F(4.106)=5.097, p=.001. Table 9 and Figure 4 presentdescriptive information for Correct Responses by NapCondition and Session.
12
Table 6. Handoff Delay on the ATST Scenarios by Session and Nap Condition.
Session1 2 3
Pre Post Pre Post Pre PostNo Nap Group (n=16)
mean 10.0 9.3 9.2 8.9 10.7 10.5sd 4.1 3.1 3.3 2.4 4.8 4.4
Short Nap Group (n=18)mean 8.4 8.6 9.3 9.3 8.9 9.6
sd 1.5 1.8 2.3 4.2 2.4 6.0Long Nap Group (n=17)
mean 9.6 8.8 10.1 8.3 9.6 9.1sd 2.1 1.5 2.7 1.2 1.9 2.5
Table 7. Enroute Delay on the ATST Scenarios by Nap Condition and Session.
Session1 2 3
Pre Post Pre Post Pre PostNo Nap Group (n=16)
mean 44.4 37.6 40.6 45.3 45.0 45.7sd 16.1 12.5 14.0 22.3 18.5 15.9
Short Nap Group (n=18)mean 40.5 33.5 37.5 38.3 39.8 35.3
sd 16.4 11.3 14.1 17.9 23.5 11.7Long Nap Group (n=17)
mean 48.3 36.8 42.2 38.7 41.6 39.9sd 16.5 7.6 12.2 8.3 13.9 10.1

13
Figure 1 . Handoff Delay Times by Nap Condition and Session.
ATST Hand-off DelaySession by Nap Condition
6
7
8
9
10
11
12
pre post pre post pre post
No Nap Short Nap Long Nap
Session 1 Session 2 Session 3
Figure 2. Enroute Delay Times by Nap Condition and Session.
ATST En Route Delay TimeSession by Nap Condition
30
35
40
45
50
pre post pre post pre post
No Nap Short Nap Long Nap
Session 1 Session 2 Session 3

14
Figure 3. ATST Safety Errors by Gender and Session.Multiple comparisons to investigate the differences between Gender at each level of Sessionrevealed that the males (M=0.4) had 1.2 fewer errors on average than the females (M =1.6) inthe last scenario of the midnight shift, t=3.09, p<.05.
ATST Safety ErrorsSession by Gender
0
0.5
1
1.5
2
pre post pre post pre post
Session 2
Males Females
Session 1 Session 3
Table 8. Safety Errors on the ATST Scenarios by Gender and Session.
Session1 2 3
Pre Post Pre Post Pre PostMales (n=25)
mean 0.8 1.2 1.9 1.0 1.4 0.4sd 1.9 1.2 2.1 1.6 1.7 1.0
Females (n=30)mean 1.3 0.9 1.5 0.8 1.4 1.6
sd 2.0 1.2 1.8 1.0 1.6 2.1
Table 9. Correct Responses on the Bakan by Nap Condition and Session.
Session 1 Session 2 Session 3No Nap (n=19)
mean 125.8 109.1 96.5sd 4.5 17.1 28.3
Short Nap (n=20)mean 118.7 118.1 109.7
sd 14.7 11.8 19.0Long Nap (n=20)
mean 125.1 123.4 115.7sd 7.1 7.9 16.9

15
Multiple comparisons to investigate cell meandifferences within each level of Session and NapCondition revealed a pattern of decline in perfor-mance in all of the nap groups. The No Nap groupdemonstrated a consistent, significant pattern of de-cline at each Session from M=125.8 in Session 1 toM=96.5 in Session 3. Within both of the Nap Con-ditions, only the performance on the third Sessionwas found to be significantly lower than Sessions 1and 2. Thus, both Nap Conditions protected perfor-mance on Correct Responses in the Session followingthe nap, but some decrement was observed in thefinal Session of the midnight shift. Results of themultiple comparisons were as follows:
No Nap Group (CV(18,3)=2.64):•Session 1 was significantly higher than Session 2,
t(18)=4.46, p<.05•Session 1 was significantly higher than Session 3,
t(18)=4.67, p<.05•Session 2 was significantly higher than Session 3,
t(18)=3.16, p<.05
Short Nap Group (CV(19,3)=2.62):•Session 1 was significantly higher than Session 3,
t(19)=4.30, p<.05•Session 2 was significantly higher than Session 3,
t(19)=3.93, p<.05
Long Nap Group (CV(19,3)=2.62):•Session 1 was significantly higher than Session 3,
t(19)=3.05, p<.05•Session 2 was significantly higher than Session 3,
t(19)=3.15, p<.05
Multiple comparisons between groups at each levelof Session revealed a pattern in which the Long Napcondition protected performance compared to theShort Nap and No Nap groups. Results revealed thefollowing significant differences.
•LN Session 2 was significantly higher than NNSession 2, t=2.78, p<.05
•LN Session 3 was significantly higher than NNSession 3, t=2.14, p<.05
•LN Session 3 was significantly higher than SNSession 3, t=2.57, p<.05
Figure 4. Bakan Correct Responses by Nap Condition and Session.
Bakan Session Total Correct ResponsesNap Condition by Session
90
100
110
120
130
1 2 3
Session
No Nap Short Nap Long Nap
16
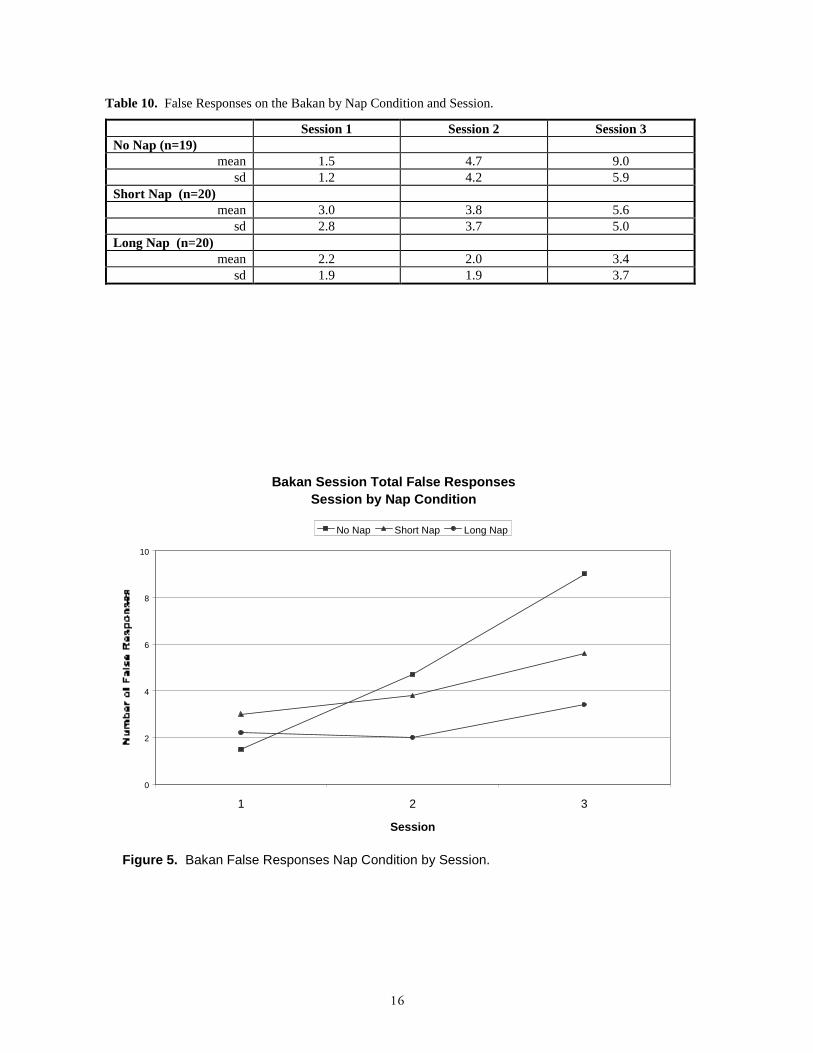
Figure 5. Bakan False Responses Nap Condition by Session.
Bakan Session Total False ResponsesSession by Nap Condition
0
2
4
6
8
10
1 2 3
Session
No Nap Short Nap Long Nap
Table 10. False Responses on the Bakan by Nap Condition and Session.
Session 1 Session 2 Session 3No Nap (n=19)
mean 1.5 4.7 9.0sd 1.2 4.2 5.9
Short Nap (n=20)mean 3.0 3.8 5.6
sd 2.8 3.7 5.0Long Nap (n=20)
mean 2.2 2.0 3.4sd 1.9 1.9 3.7

17
False responses. Results of the analysis of falseresponses revealed a significant Session by Nap Con-dition interaction, F(4,106)=4.085, p=.004 and asignificant Session by Gender interaction,F(2,52)=3.425, p=.04. Table 10 and Figure 5 presentdescriptive statistics for false responses by Sessionand Nap Condition.
Multiple comparison procedures to investigatecell mean comparisons within each level of Sessionand Nap Condition revealed the anticipated patternof significant decrement in performance from sessionto session across the midnight shift for the No Napcondition. As with the data for the Short Nap groupon correct responses, performance was protectedduring the session following the nap (Session 2), butsome increases in false responses were observed by thefinal session of the shift (Session 3). For the SNgroup, mean false responses for the first two Sessionswere 3.0 and 3.8, respectively. SN false responsesincreased to 5.6 by Session 3. There were no signifi-cant increases in false responses in the Long Napgroup revealing protection of performance on falseresponses for the entire shift. The results of themultiple comparisons were as follows:
No Nap Group (CV(18,3)=2.64:•Session 1 was significantly lower than Session 2,
t(18)=3.68, p<.05•Session 1 was significantly lower than Session 3,
t(18)=5.85, p<.05•Session 2 was significantly lower than Session 3,
t(18)=4.49, p<.05
Short Nap Group (CV(19,3)=2.62:•Session 1 was significantly lower than Session 3,
t(19)=2.80, p<.05•Session 2 was significantly lower than Session 3,
t(19)=2.67, p<.05
Long Nap Group (CV(19,3)=2.62:•No significant differences between Sessions.
Multiple comparisons between groups at each levelof Session revealed significant protection of perfor-mance for both the Long Nap and Short Nap groupscompared to the No Nap group. Multiple compari-sons resulted in the following significant differences.
•LN Session 2 was significantly lower than NNSession 2, t=2.25, p<.05
•SN Session 3 was significantly lower than NNSession 3, t=2.81, p<.05
•LN Session 3 was significantly lower than NNSession 3, t=4.66, p<.05
Table 11 and Figure 6 present descriptive statisticsfor false responses related to the significant Sessionby Gender interaction.
Multiple comparison procedures to investigatecell mean comparisons within each level of Genderand Session revealed a pattern of declining perfor-mance across the midnight shift for both males andfemales. The females, however, did not show a sig-nificant decline until the final Session of the mid-night shift.
Males (CV(27,3)=2.56:•Session 1 was significantly lower than Session 2,
t(27)=2.68, p<.05•Session 1 was significantly lower than Session 3,
t(27)=4.01, p<.05•Session 2 was significantly lower than Session 3,
t(27)=3.00, p<.05
Females (CV(30,3)=2.54:•Session 1 was significantly lower than Session 3,
t(30)=3.91, p<.05•Session 2 was significantly lower than Session 3,
t(30)=4.70, p<.05Multiple comparisons between Gender at each
level of Session revealed no significant differences.
Number/Letter Ratio Estimation. Analyses con-ducted on the Bakan number/letter ratio estimationtask revealed no significant differences.

18
Time on Task. To better understand the protec-tive effects of naps revealed by the previous analyses,the Bakan data were examined for the changes inperformance with time-on-task within each BakanSession. Each 30-minute Bakan session was analyzedby the six 5-minute blocks for each of the three Bakanmeasures (Correct Responses, False Responses, andNumber/Letter Ratio Estimation). The model in-cluded two between-subjects factors (Nap Conditionand Session) and two within-subjects factors (Session
Table 11. False Responses on the Bakan by Gender and Session.
Session 1 Session 2 Session 3Males (n=28)
mean 2.25 3.99 5.43sd 2.24 3.67 4.09
Females (n=31)Mean 2.19 3.03 6.48
sd 2.10 3.34 6.29
Figure 6. Bakan False Responses by Gender and Session.
Bakan Session Total False ResponsesSession by Gender
0
1
2
3
4
5
6
7
1 2 3
Session
Males Females
and Block). Planned comparisons involved examin-ing the changes within Session. Results of the analy-ses for False Responses and Number/Letter RatioEstimation revealed no significant findings for Block.
Correct ResponsesResults of this analysis revealed a significant three-
way Nap Condition by Session by Block interaction,F(20,90)=2.59, p=.001. The following section pre-sents results for each Session.

19
Session 1 correct responses. Descriptive statisticsfor Session 1 correct responses on the Bakan test byNap Condition and Block are presented in Table 12and Figure 7.
Multiple comparisons within each group, basedon Dunn (n-1, C) and a paired t-test, revealed nosignificant differences. Multiple comparisons betweenNap Condition groups revealed that even though theShort Nap group did not show a significant declineon the within subject comparisons, they averaged
Figure 7. Bakan Correct Responses for Nap Condition by Block for Session 1.
Bakan Correct Responses (Session 1)Nap Condition by 5-minute Block
18
19
20
21
22
1 2 3 4 5 6
5-minute Block
No Nap Short Nap Long Nap
Table 12. Bakan Correct Responses for Session 1 by Nap Condition and 5-minute Block.
Block 1 Block 2 Block 3 Block 4 Block 5 Block 6No Nap
mean 21.2 21.0 21.1 21.2 20.8 20.5sd 1.0 1.1 1.1 1.5 1.4 1.7
Short Napmean 20.8 20.9 19.6 19.7 19.1 18.8
sd 1.2 1.4 2.9 3.7 3.9 4.7Long Nap
mean 21.6 21.3 20.7 20.4 20.8 20.30.6 1.1 3.1 2.1 1.5 1.9
significantly lower Correct Responses than both theLong Nap and No Nap groups on Block 5 and lowerthan the NN on Block 6. The following values werecomputed for the multiple comparisons:
•SN Block 5 was significantly lower than NNBlock 5, t=2.08, p,.05
•SN Block 5 was significantly lower than LN Block5, t=2.15, p<.05
•SN Block 6 was significantly lower than NNBlock 6, t=2.06, p<.05

20
Table 13. Bakan Test Correct Responses for Session 2 by Nap Condition and 5-minute Block.
Block 1 Block 2 Block 3 Block 4 Block 5 Block 6No Nap
Mean 20.2 19.3 17.5 17.7 17.4 17.0sd 2.3 3.8 4.2 3.4 2.9 4.9
Short NapMean 21.1 20.8 20.35 19.3 18.3 18.5
sd 1.3 1.5 1.9 2.6 3.4 3.4Long Nap
Mean 21.2 20.5 20.6 20.6 20.4 20.2sd 1.1 2.0 1.2 2.1 2.0 2.1
Figure 8. Bakan Correct Responses for Nap Condition by Block for Session 2.
Bakan Correct Responses (Session 2)Nap Condition by 5-minute Block
16
17
18
19
20
21
22
1 2 3 4 5 6
5-minute Block
No Nap Short Nap Long Nap
21
Session 2 correct responses. Descriptive statisticsfor Session 2 correct responses on the Bakan test arepresented in Table 13 and Figure 8.
Multiple comparison procedures to investigatewithin Nap Condition cell mean comparisons foreach level of Block in Session 2 revealed the begin-ning of performance decrements by Block 5 acrossthe session for the No Nap and Short Nap groups. Nosignificant differences were found in the Long Napgroup. The following significant differences wereobserved:
No Nap Group (CV(18,30)=3.69:•Block 1 was significantly higher than Block 5,
t(18)=4.35, p<.05
Short Nap Group (CV(19,30)=3.66:•Block 1 was significantly higher than Block 5,
t(19)=4.15, p,.05•Block 1 was significantly higher than Block 6,
t(19)=3.92, p<.05•Block 2 was significantly higher than Block 5,
t(19)=3.89, p<.05•Block 2 was significantly higher than Block 6,
t(19)=3.79, p<.05•Block 3 was significantly higher than Block 5,
t(19)=4.23, p<.05•Block 3 was significantly higher than Block 6,
t(19)=3.75, p<.05
Long Nap Group (CV(19,30)=3.66:•No significant differences between Blocks.
Multiple comparisons between Nap Conditionsrevealed that although the Short Nap group’s perfor-mance demonstrated a significant decline across theSession, they performed better than the NN group atBlock 3. The Long Nap protected performance com-pared to both the Short Nap and No Nap groups inthe last three blocks of the Session. The followingsignificant differences were observed:
•SN Block 3 was significantly higher than NNBlock 3, t=3.46, p<.05
•LN Block 3 was significantly higher than NNBlock 3, t=3.70, p<.05
•LN Block 4 was significantly higher than SNBlock 4, t=2.21, p<.05
•LN Block 4 was significantly higher than NNBlock 4, t=3.45, p<.05
•LN Block 5 was significantly higher than SNBlock 5, t=2.65, p<.05
•LN Block 5 was significantly higher than NNBlock 5, t=3.49, p<.05
•LN Block 6 was significantly higher than SNBlock 6, t=2.15, p<.05
•LN Block 6 was significantly higher than NNBlock 6, t=3.83, p<.05
22
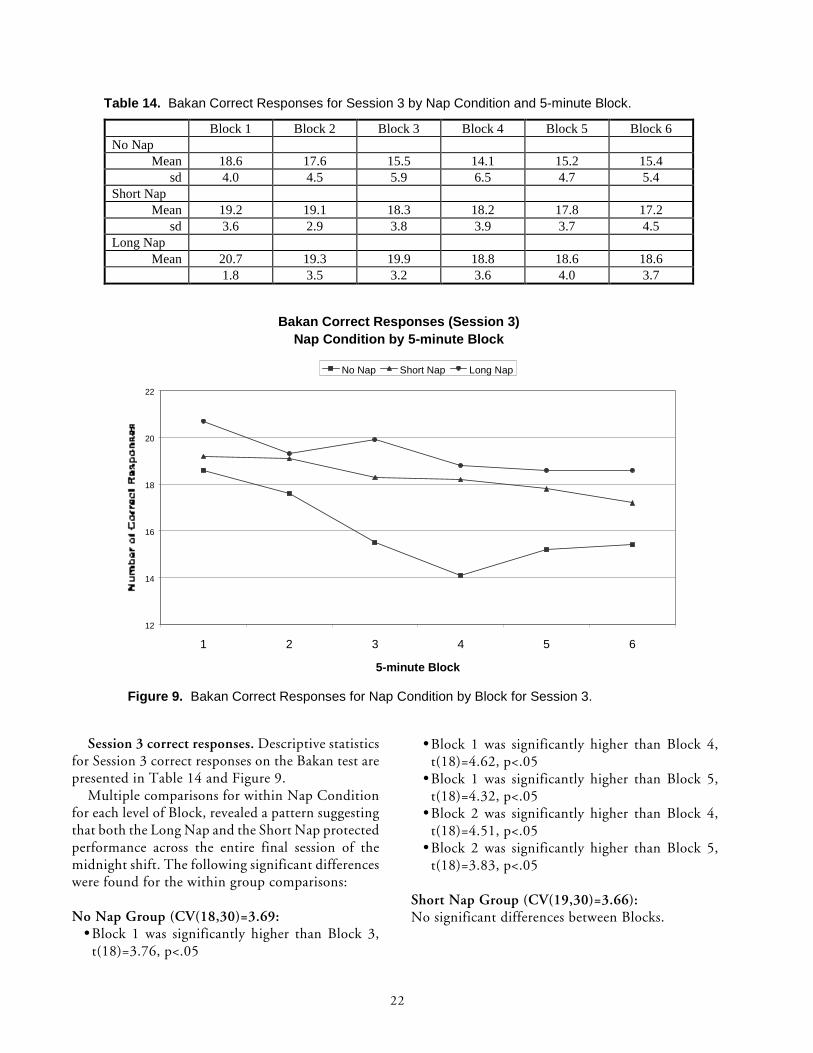
Table 14. Bakan Correct Responses for Session 3 by Nap Condition and 5-minute Block.
Block 1 Block 2 Block 3 Block 4 Block 5 Block 6No Nap
Mean 18.6 17.6 15.5 14.1 15.2 15.4sd 4.0 4.5 5.9 6.5 4.7 5.4
Short NapMean 19.2 19.1 18.3 18.2 17.8 17.2
sd 3.6 2.9 3.8 3.9 3.7 4.5Long Nap
Mean 20.7 19.3 19.9 18.8 18.6 18.61.8 3.5 3.2 3.6 4.0 3.7
Figure 9. Bakan Correct Responses for Nap Condition by Block for Session 3.
Bakan Correct Responses (Session 3)Nap Condition by 5-minute Block
12
14
16
18
20
22
1 2 3 4 5 6
5-minute Block
No Nap Short Nap Long Nap
Session 3 correct responses. Descriptive statisticsfor Session 3 correct responses on the Bakan test arepresented in Table 14 and Figure 9.
Multiple comparisons for within Nap Conditionfor each level of Block, revealed a pattern suggestingthat both the Long Nap and the Short Nap protectedperformance across the entire final session of themidnight shift. The following significant differenceswere found for the within group comparisons:
No Nap Group (CV(18,30)=3.69:•Block 1 was significantly higher than Block 3,
t(18)=3.76, p<.05
•Block 1 was significantly higher than Block 4,t(18)=4.62, p<.05
•Block 1 was significantly higher than Block 5,t(18)=4.32, p<.05
•Block 2 was significantly higher than Block 4,t(18)=4.51, p<.05
•Block 2 was significantly higher than Block 5,t(18)=3.83, p<.05
Short Nap Group (CV(19,30)=3.66):No significant differences between Blocks.
23
Long Nap Group (CV(19,30)=3.66):No significant differences between Blocks.
Results of the multiple comparisons between NapConditions revealed the following significant differ-ences:
•LN Block 1 was significantly higher than NNBlock 1, t=2.48, p,.05
•LN Block 3 was significantly higher than NNBlock 3, t=5.17, p<.05
•SN Block 3 was significantly higher than NNBlock 3, t=3.32, p<.05
•LN Block 4 was significantly higher than NNBlock 4, t=4.84, p<.05
•SN Block 4 was significantly higher than NNBlock 4, t=5.56, p<.05
•LN Block 5 was significantly higher than NNBlock 5, t=4.06, p<.05
•SN Block 5 was significantly higher than NNBlock 5, t=3.04, p<.05
•LN Block 6 was significantly higher than NNBlock 6, t=3.81, p<.05
•SN Block 6 was significantly higher than NNBlock 6, t=2.07, p,.05
False responses and number/letter ratio estima-tion. Results of the analyses revealed no interactionsor main effects of the Block factor.
Subjective Measures The subjective measures included sleep quality,
PANAS mood scale, and Stanford Sleepiness Scale ratings.
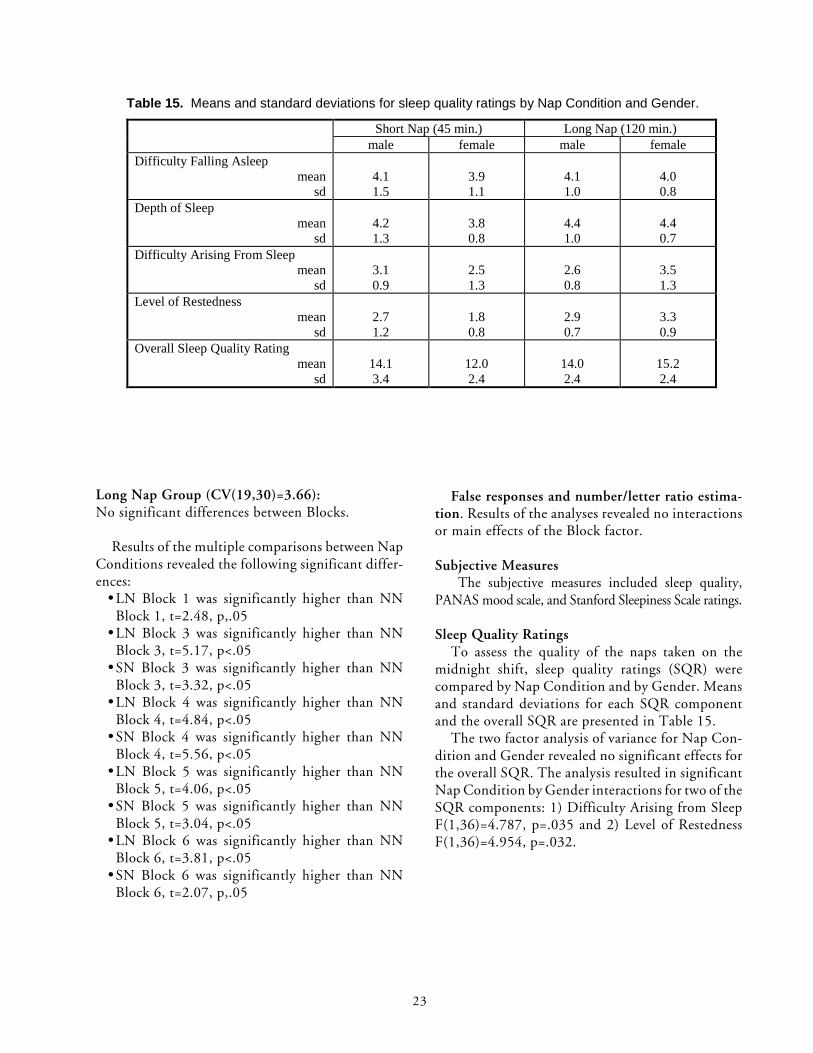
Sleep Quality RatingsTo assess the quality of the naps taken on the
midnight shift, sleep quality ratings (SQR) werecompared by Nap Condition and by Gender. Meansand standard deviations for each SQR componentand the overall SQR are presented in Table 15.
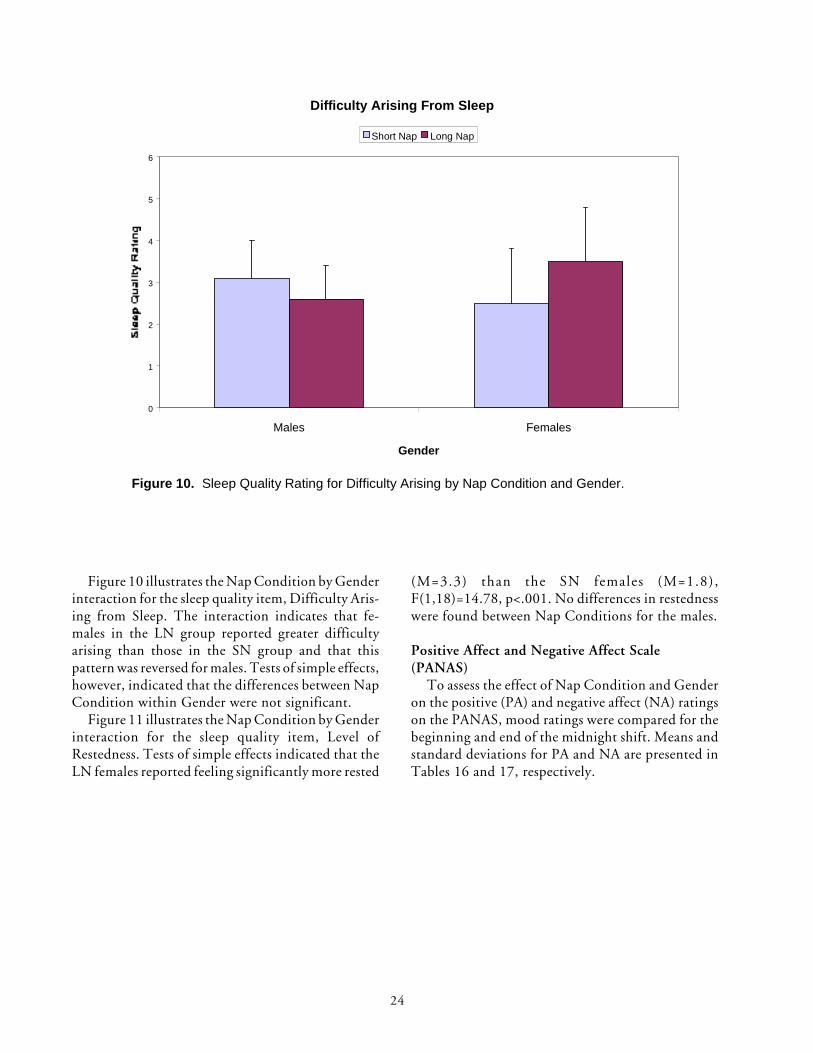
The two factor analysis of variance for Nap Con-dition and Gender revealed no significant effects forthe overall SQR. The analysis resulted in significantNap Condition by Gender interactions for two of theSQR components: 1) Difficulty Arising from SleepF(1,36)=4.787, p=.035 and 2) Level of RestednessF(1,36)=4.954, p=.032.
Table 15. Means and standard deviations for sleep quality ratings by Nap Condition and Gender.
Short Nap (45 min.) Long Nap (120 min.)male female male female
Difficulty Falling Asleepmean
sd4.11.5
3.91.1
4.11.0
4.00.8
Depth of Sleepmean
sd4.21.3
3.80.8
4.41.0
4.40.7
Difficulty Arising From Sleepmean
sd3.10.9
2.51.3
2.60.8
3.51.3
Level of Restednessmean
sd2.71.2
1.80.8
2.90.7
3.30.9
Overall Sleep Quality Ratingmean
sd14.13.4
12.02.4
14.02.4
15.22.4
24
Figure 10 illustrates the Nap Condition by Genderinteraction for the sleep quality item, Difficulty Aris-ing from Sleep. The interaction indicates that fe-males in the LN group reported greater difficultyarising than those in the SN group and that thispattern was reversed for males. Tests of simple effects,however, indicated that the differences between NapCondition within Gender were not significant.
Figure 11 illustrates the Nap Condition by Genderinteraction for the sleep quality item, Level ofRestedness. Tests of simple effects indicated that theLN females reported feeling significantly more rested
(M=3.3) than the SN females (M=1.8),F(1,18)=14.78, p<.001. No differences in restednesswere found between Nap Conditions for the males.
Positive Affect and Negative Affect Scale(PANAS)
To assess the effect of Nap Condition and Genderon the positive (PA) and negative affect (NA) ratingson the PANAS, mood ratings were compared for thebeginning and end of the midnight shift. Means andstandard deviations for PA and NA are presented inTables 16 and 17, respectively.
Figure 10. Sleep Quality Rating for Difficulty Arising by Nap Condition and Gender.
Difficulty Arising From Sleep
0
1
2
3
4
5
6
Males Females
Gender
Short Nap Long Nap

25
Figure 11. Sleep Quality Rating for Level of Restedness by Nap Condition and Gender.
Level of Restedness
0
0.5
1
1.5
2
2.5
3
3.5
4
4.5
Males Females
Gender
Short Nap Long Nap
Table 16. Means and standard deviations for Positive Affect (PA) ratings Before and After theMidnight Shift by Nap Condition and Gender.
Before Midnight Shift After Midnight ShiftNap Condition Males Females Males Females
No Napmean 24.6 17.0 15.5 11.5
sd 8.8 5.8 8.8 3.1Short Nap
mean 22.6 16.2 14.6 12.0sd 9.7 6.5 6.6 3.6
Long Napmean 22.9 17.8 19.1 14.3
sd 9.9 6.1 8.4 4.4
Table 17. Means and standard deviations for Negative Affect (NA) ratings Before and After theMidnight Shift by Nap Condition and Gender.
Before Midnight Shift After Midnight ShiftNap Condition Males Females Males Females
No Napmean 11.8 11.0 12.4 12.5
sd 1.8 2.1 1.9 2.4Short Nap
mean 10.3 10.8 12.3 13.6sd 0.7 0.9 2.8 3.6
Long Napmean 11.9 10.9 13.0 11.9
sd 3.0 1.6 3.7 2.5
26
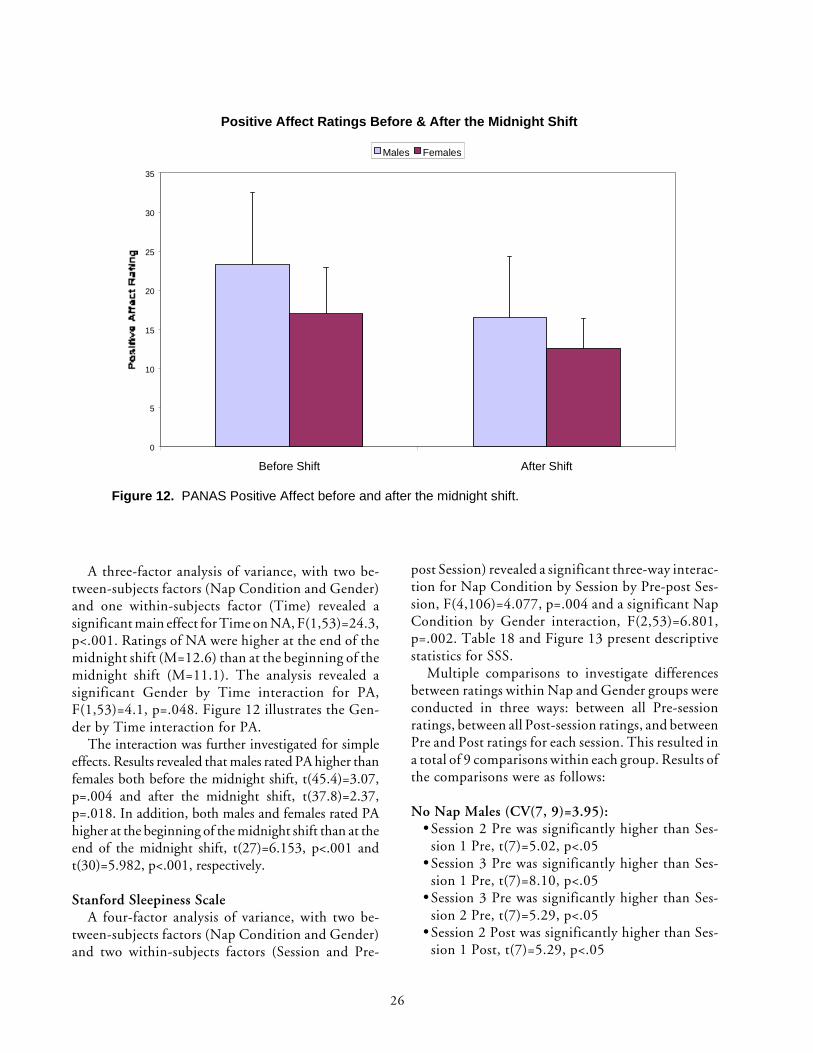
A three-factor analysis of variance, with two be-tween-subjects factors (Nap Condition and Gender)and one within-subjects factor (Time) revealed asignificant main effect for Time on NA, F(1,53)=24.3,p<.001. Ratings of NA were higher at the end of themidnight shift (M=12.6) than at the beginning of themidnight shift (M=11.1). The analysis revealed asignificant Gender by Time interaction for PA,F(1,53)=4.1, p=.048. Figure 12 illustrates the Gen-der by Time interaction for PA.
The interaction was further investigated for simpleeffects. Results revealed that males rated PA higher thanfemales both before the midnight shift, t(45.4)=3.07,p=.004 and after the midnight shift, t(37.8)=2.37,p=.018. In addition, both males and females rated PAhigher at the beginning of the midnight shift than at theend of the midnight shift, t(27)=6.153, p<.001 andt(30)=5.982, p<.001, respectively.
Stanford Sleepiness ScaleA four-factor analysis of variance, with two be-
tween-subjects factors (Nap Condition and Gender)and two within-subjects factors (Session and Pre-
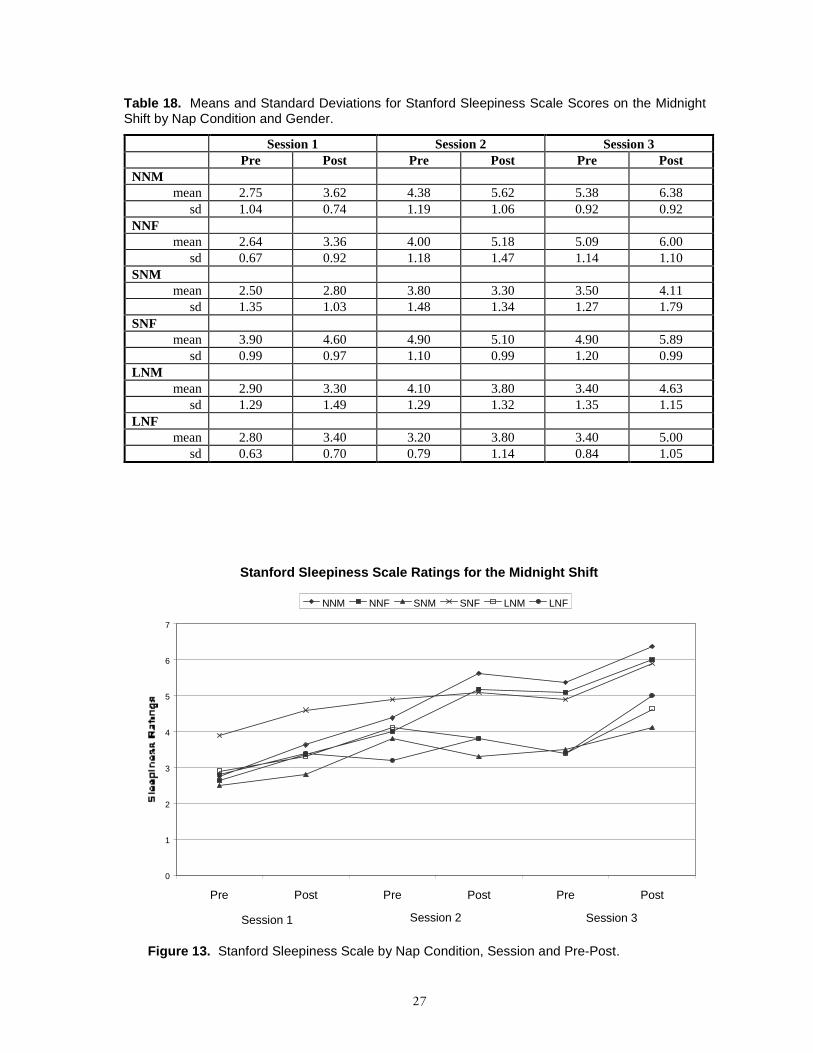
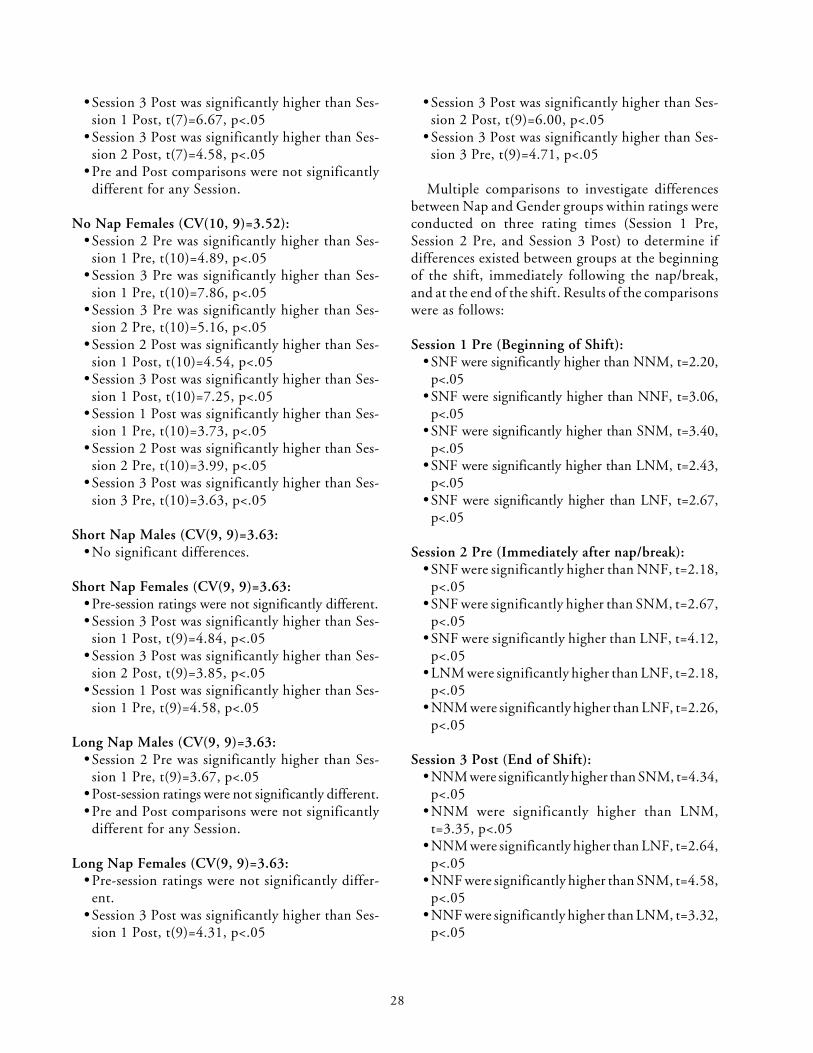
post Session) revealed a significant three-way interac-tion for Nap Condition by Session by Pre-post Ses-sion, F(4,106)=4.077, p=.004 and a significant NapCondition by Gender interaction, F(2,53)=6.801,p=.002. Table 18 and Figure 13 present descriptivestatistics for SSS.
Multiple comparisons to investigate differencesbetween ratings within Nap and Gender groups wereconducted in three ways: between all Pre-sessionratings, between all Post-session ratings, and betweenPre and Post ratings for each session. This resulted ina total of 9 comparisons within each group. Results ofthe comparisons were as follows:
No Nap Males (CV(7, 9)=3.95):•Session 2 Pre was significantly higher than Ses-
sion 1 Pre, t(7)=5.02, p<.05•Session 3 Pre was significantly higher than Ses-
sion 1 Pre, t(7)=8.10, p<.05•Session 3 Pre was significantly higher than Ses-
sion 2 Pre, t(7)=5.29, p<.05•Session 2 Post was significantly higher than Ses-
sion 1 Post, t(7)=5.29, p<.05
Figure 12. PANAS Positive Affect before and after the midnight shift.
Positive Affect Ratings Before & After the Midnight Shift
0
5
10
15
20
25
30
35
Before Shift After Shift
Males Females
27
Figure 13. Stanford Sleepiness Scale by Nap Condition, Session and Pre-Post.
Stanford Sleepiness Scale Ratings for the Midnight Shift
0
1
2
3
4
5
6
7
Pre Post Pre Post Pre Post
Session 2
NNM NNF SNM SNF LNM LNF
Session 1 Session 3
Table 18. Means and Standard Deviations for Stanford Sleepiness Scale Scores on the MidnightShift by Nap Condition and Gender.
Session 1 Session 2 Session 3Pre Post Pre Post Pre Post
NNMmean 2.75 3.62 4.38 5.62 5.38 6.38
sd 1.04 0.74 1.19 1.06 0.92 0.92NNF
mean 2.64 3.36 4.00 5.18 5.09 6.00sd 0.67 0.92 1.18 1.47 1.14 1.10
SNMmean 2.50 2.80 3.80 3.30 3.50 4.11
sd 1.35 1.03 1.48 1.34 1.27 1.79SNF
mean 3.90 4.60 4.90 5.10 4.90 5.89sd 0.99 0.97 1.10 0.99 1.20 0.99
LNMmean 2.90 3.30 4.10 3.80 3.40 4.63
sd 1.29 1.49 1.29 1.32 1.35 1.15LNF
mean 2.80 3.40 3.20 3.80 3.40 5.00sd 0.63 0.70 0.79 1.14 0.84 1.05
28
•Session 3 Post was significantly higher than Ses-sion 1 Post, t(7)=6.67, p<.05
•Session 3 Post was significantly higher than Ses-sion 2 Post, t(7)=4.58, p<.05
•Pre and Post comparisons were not significantlydifferent for any Session.
No Nap Females (CV(10, 9)=3.52):•Session 2 Pre was significantly higher than Ses-
sion 1 Pre, t(10)=4.89, p<.05•Session 3 Pre was significantly higher than Ses-
sion 1 Pre, t(10)=7.86, p<.05•Session 3 Pre was significantly higher than Ses-
sion 2 Pre, t(10)=5.16, p<.05•Session 2 Post was significantly higher than Ses-
sion 1 Post, t(10)=4.54, p<.05•Session 3 Post was significantly higher than Ses-
sion 1 Post, t(10)=7.25, p<.05•Session 1 Post was significantly higher than Ses-
sion 1 Pre, t(10)=3.73, p<.05•Session 2 Post was significantly higher than Ses-
sion 2 Pre, t(10)=3.99, p<.05•Session 3 Post was significantly higher than Ses-
sion 3 Pre, t(10)=3.63, p<.05
Short Nap Males (CV(9, 9)=3.63:•No significant differences.
Short Nap Females (CV(9, 9)=3.63:•Pre-session ratings were not significantly different.•Session 3 Post was significantly higher than Ses-
sion 1 Post, t(9)=4.84, p<.05•Session 3 Post was significantly higher than Ses-
sion 2 Post, t(9)=3.85, p<.05•Session 1 Post was significantly higher than Ses-
sion 1 Pre, t(9)=4.58, p<.05
Long Nap Males (CV(9, 9)=3.63:•Session 2 Pre was significantly higher than Ses-
sion 1 Pre, t(9)=3.67, p<.05•Post-session ratings were not significantly different.•Pre and Post comparisons were not significantly
different for any Session.
Long Nap Females (CV(9, 9)=3.63:•Pre-session ratings were not significantly differ-
ent.•Session 3 Post was significantly higher than Ses-
sion 1 Post, t(9)=4.31, p<.05
•Session 3 Post was significantly higher than Ses-sion 2 Post, t(9)=6.00, p<.05
•Session 3 Post was significantly higher than Ses-sion 3 Pre, t(9)=4.71, p<.05
Multiple comparisons to investigate differencesbetween Nap and Gender groups within ratings wereconducted on three rating times (Session 1 Pre,Session 2 Pre, and Session 3 Post) to determine ifdifferences existed between groups at the beginningof the shift, immediately following the nap/break,and at the end of the shift. Results of the comparisonswere as follows:
Session 1 Pre (Beginning of Shift):•SNF were significantly higher than NNM, t=2.20,
p<.05•SNF were significantly higher than NNF, t=3.06,
p<.05•SNF were significantly higher than SNM, t=3.40,
p<.05•SNF were significantly higher than LNM, t=2.43,
p<.05•SNF were significantly higher than LNF, t=2.67,
p<.05
Session 2 Pre (Immediately after nap/break):•SNF were significantly higher than NNF, t=2.18,
p<.05•SNF were significantly higher than SNM, t=2.67,
p<.05•SNF were significantly higher than LNF, t=4.12,
p<.05•LNM were significantly higher than LNF, t=2.18,
p<.05•NNM were significantly higher than LNF, t=2.26,
p<.05
Session 3 Post (End of Shift):•NNM were significantly higher than SNM, t=4.34,
p<.05•NNM were significantly higher than LNM,
t=3.35, p<.05•NNM were significantly higher than LNF, t=2.64,
p<.05•NNF were significantly higher than SNM, t=4.58,
p<.05•NNF were significantly higher than LNM, t=3.32,
p<.05

29
•NNF were significantly higher than LNF, t=2.43,p<.05
•SNF were significantly higher than SNM, t=4.32,p<.05
•SNF were significantly higher than LNM, t=3.06,p<.05
•SNF were significantly higher than LNF, t=2.16,p<.05
•LNF were significantly higher than SNM, t=2.16,p<.05
DISCUSSION
The findings from this study revealed that both along nap of 2 hours duration and a shorter nap of 45minutes duration can significantly protect perfor-mance during a midnight shift. The long nap, how-ever, resulted in more consistent findings. The resultsin this study were most evident in the Bakan vigilancetask and subjective ratings. The findings were impor-tant in demonstrating the effectiveness of napping asa countermeasure to performance decrement andsleepiness on the midnight shift on tasks requiringskills and abilities similar to those required in safetycritical jobs such as Air Traffic Control Specialist.
The ATST and Bakan were selected because theyassessed different abilities. The ATST simulated ATCtasks. The workload was high to simulate a scenarioin which a napping ATCS would be asked to resumeair traffic control duties during high workload condi-tion. The Bakan was selected because it imposed aboring, low workload, vigilance condition. The Bakanhad been demonstrated to be sensitive to variations inalertness and sleepiness (Dollins et al., 1993).
The findings from the Bakan revealed the antici-pated performance decrement across the midnightshift in the No Nap group in both Correct Responsesand False Responses. The decrements in the No Napgroup between the first and last Session representeda decrease of 23% in Correct Responses and anincrease in false responding of 600% from an averageof 1.5 in Session 1 to 9.0 in Session 3. Therefore, thetest was demonstrated in this study to be sensitive tosustained wakefulness and possibly the circadiantrough in the performance rhythm.
The Long Nap provided the best protection on theBakan in this study. Performance on both CorrectResponses and False Responses was better for theLong Nap group than the No Nap group for bothsessions after the nap. The Long Nap group performed
better than the Short Nap group for Correct Re-sponses in the final Session of the midnight shift.Examination of the 5-minute Blocks within each 30minute Session revealed no significant decrementswithin any of the sessions for the Long Nap group.Results from the Short Nap group were less robust inthe protection provided. No consistent significantdifferences on Correct Responses were found be-tween the Short Nap group and the No Nap group onthe Session level until the end of the midnight shift.This difference was revealed by the analysis of Blockswhere the final 3 Blocks were significantly better forthe Short Nap group. A significant decrement inperformance in the final session of the midnight shiftwas observed for both the Long Nap and Short Napon Correct Responses and for the Short Nap on FalseResponses. However, these decrements representedan 8% decline in Correct Responses for both groupsand less than double the number of False Responsesfrom an average of 3.0 to an average of 5.6 for theShort Nap group when Session 1 is compared toSession 3. This represented substantial protectioncompared to the No Nap group.
Results from the ATST revealed that the test wasless sensitive than the Bakan to the sustained wake-fulness induced by the protocol in the No Nap group,the circadian trough expected to affect all groups, orthe napping conditions. The only nap condition-related finding was a shorter average Enroute Delaytime for the Short Nap compared to the No Napgroup on the last scenario. There are a number offactors which may have contributed to the ATST’slack of sensitivity to the factors which frequentlyinduce decrements in performance. First, the ATSTwas selected as a quasi-work sample. All of the sub-jects were active Air Traffic Controllers. Even thoughthe ATST was a low fidelity simulation, the skillsrequired to perform the task may have been wellpracticed in this sample and were very robust. Inaddition, many of the participants were or had beenrequired to work midnight shifts during their careersand many may have brought coping strategies to thisstudy. Second, the ATST scenarios were designed topresent a fairly high workload. The high workloadmay have had an alerting effect for all groups andmaintained performance. Third, participants were se-lected from all types of facilities, from Level 1 FAATowers to Level 3 Enroute Centers. Because of differencesin job duties and traffic workload at their facilities,participants came to the study with a wide variation
30
of skill levels within the air traffic control occupa-tion. Participants from the Level 1 Towers, for ex-ample, did not use radar separation on their job; andthey were probably not trained in radar procedures.In contrast, Enroute controllers use radar separationprocedures daily in their jobs. This difference in skillsmay have introduced extraneous variability into theseanalyses. Four, the within group comparisons wereconfounded with the scenarios. Different problemswere administered for each test scenario. Even thoughthe scenarios had a similar number of aircraft andduration, it was not possible to equate the complexityof scenarios. The best method would be to obtainnormative data for the problems from a large numberof FPL controllers. Such data was unavailable. There-fore, the degree to which scenario complexity andexperimental factors were confounded was not ad-equately assessed. Finally, even though some ATSTmeasures, such as Handoff Delays, might appear tobe a measure which would be affected by fatigueanalogous to a reaction time measure, the nature ofcontrolling air traffic may not be as directly sensitiveto fatigue effects. Individual controllers may havecompensated for the effects of fatigue in a number ofways in which they controlled the scenario trafficwhich were not reflected in the ATST measures inthis study.
It was encouraging that performance on the ATSTfailed to demonstrate sensitivity to such factors ascircadian trough, sustained wakefulness, and naps. Thisis especially true in light of the decrements on the Bakan.The ATST with high workload scenarios was selectedfor the study to simulate a situation where an ATST whowas napping would be required to arise and immediatelyreturn to the radar to work traffic.
As with the cognitive findings, results of the sub-jective measures supported the use of naps during themidnight shift. Specifically, the analysis of sleepinessratings across the midnight shift indicated that napscould result in reduced sleepiness at the end of theshift. With the exception of the females in the shortnap group (M=3.9), sleepiness was rated similarly byeach of the other groups at the beginning of the shift(M=2.5 to 2.9). Over the course of the midnightshift, however, both the males and females in the nonap conditions rated their sleepiness increasinglyhigher so that by the end of the midnight shift, the nonap groups were significantly more sleepy than malesor females in the long nap group or males in the short
nap group. Females in the short nap group continuedto rate their sleepiness higher than the other nappingcondition groups throughout the entire shift.
In addition to lower ratings of sleepiness as a resultof napping, ratings of mood on the PANAS moodscale were not adversely or differentially affected bynapping condition. Analysis of sleep quality ratingsrevealed that participants felt that naps were fairlyeasy to obtain. They also indicated that sleep duringthe naps was deep. All participants in the nappingconditions found it moderately difficult to arise fromsleep and reported low to moderate feelings ofrestedness, with short nap females reporting feelingthe least rested and long nap females feeling the mostrested.
The placement of the naps in this study wasdesigned to occur just prior to or during the circadiantrough in temperature and performance rhythmssuch that performance would be measured during the“red zone.” Because circadian rhythms were not mea-sured, they could only be implied to result from thesleep/wake cycle and subsequent exposure to daylightimposed by the experimental schedule. The Bakandata for the no nap group would suggest that theexperimental design which included early morningshifts, combined with a prohibition of napping at anytime induced a significant level of fatigue.
The present study would tend to support the workof Matsumoto and Harada (1994), which indicatedthat a nap taken during a night work period canalleviate fatigue. Rogers, Spencer, Stone, & Nicholson(1989), however, found that a 1-hour nap taken at0200 during a work period had limited beneficialeffects on performance compared to a no nap condi-tion. Dinges and associates (1985) indicated thatnaps taken during the circadian troughs led to greaterperformance decrements than did naps taken duringthe circadian peaks. This study showed post-napsleepiness was higher and performance was lowerwhen subjects were awakened from a nap during thecircadian trough as compared to a nap taken duringthe circadian peak. Dinges advocates prophylacticnapping and taking naps before a person’s sleep lossextends beyond 36 hours. This advice is also appli-cable for ATCSs or other personnel in safety criticalor aviation-related jobs. These work forces should beadvised to nap prior to arriving at work for a mid-night shift.

31
The protection of performance on the Bakan sug-gests that naps during the midnight shift would beuseful as a countermeasure to performance decre-ment and sleepiness on the midnight shift during lowworkload conditions. From these data, the 2-hournap appeared to be more protective. Future studiesshould examine a comparison between a prophylacticnap and a nap during the midnight shift.
REFERENCES
Akerstedt, T. (1977). Inversion of the sleep wakeful-ness pattern: Effects on circadian variations inpsychophysiological activation. Ergonomics, 20(5), 459-74.
Akerstedt, T., & Torsvall, L. (1985). Napping in shiftwork. Sleep, 8 (2), 105-9.
Akerstedt, T., Torsvall, L., & Gillberg, M. (1982).Sleepiness and shift work: Field studies. Sleep, 5,S95-S106.
Anch, Browman, Mitler, & Walsh (1988). Sleep: AScientific Perspective. Englewood Cliffs, NewJersey: Prentice Hall.
Bonnet, M. (1991). The effect of varying prophylacticnaps on performance, alertness and mood through-out a 52-hour continuous operation. Sleep, 14(4), 307-15.
Bonnet, M. (1990). Dealing with shift work: physicalfitness, temperature, and napping. Work and Stress,4 (3), 261-74.
Broach, D. & Brecht-Clark, J. (1994). Validation ofthe Federal Aviation Administration air trafficcontrol specialist pre-training screen (DOT/FAA/AM-94/4). Washington, DC: Federal AviationAdministration, Office of Aviation Medicine.
Broach, D., Enos, R., & Moore, C. (1994). Interna-tional Air Traffic Control Specialist Pre-TrainingScreen v3.1 Administrator’s Guide, Washington,DC: Federal Aviation Administration, Office ofAviation Medicine.
Carskadon, M. & Dement, W. (1982). Nocturnaldeterminants of daytime sleepiness. Sleep, 5,S73-S81.
Cruz, C. & Della Rocco, P. (1995). Sleep patterns in airtraffic controllers working rapidly rotating shifts:A field study (DOT/FAA/AM-95/12). Washing-ton, DC: Federal Aviation Administration, Of-fice of Aviation Medicine.
Czeisler, C., Allan, J., Strogatz, S., Ronda, J., Sanchez,R., Rios, C., Freitag, W., Richardson, G., &Kronauer, R. (1986). Bright light resets the hu-man circadian pacemaker independent of the tim-ing of the sleep-wake cycle. Science, 233, 667-71.
Czeisler, C., Johnson, M., Duffy, J., Brown, E., Ronda,J., & Kronauer, R. (1990). Exposure to brightlight and darkness to treat physiologic maladapta-tion to night work. The New England Journal ofMedicine, 322 (18), 1253-1291.
Czeisler, C., Kronauer, R., Allan, J., Duffy, J., Jewett,M., Brown, E., & Ronda, J. (1989). Brightlight induction of strong (type O) resetting ofthe human circadian pacemaker. Science, 244,1328-33.
Dinges, D. (1986). Differential effects of prior wake-fulness and circadian phase on nap sleep. Electro-encephalography and Clinical Neurophysiology, 64,224-7.
Dinges, D., Orne, M., & Orne, E. (1985). Assessingperformance upon abrupt awakening from napsduring quasi-continuous operations. BehaviorResearch Methods, Instruments, & Computers, 17(1), 37-45.
Dinges, D., Orne, M., Whitehouse, W., & Orne, E.(1987). Temporal placement of a nap for alert-ness: Contributions of circadian phase and priorwakefulness. Sleep, 10 (4), 313-29.
Dinges, D., Whitehouse, W., Orne, E., & Orne, M.(1988). The benefits of a nap during prolongedwork and wakefulness. Work and Stress, 2 (2),139-53.
Dollins, A., Lynch, H., Wurtman, R., Deng, M.,Kischka, K., Gleason, R., & Lieberman, R. (1993).Effects of pharmacological daytime doses of me-latonin on human mood and performance. Psy-chopharmacology, 122, 490-6.

32
Folkard, S. (1989). Shiftwork—A growing occupa-tional hazard. Occupational Health, 41 (7), 182-6.
Gander, P., Myhre, G., Graeber, R., Andersen, H., &Lauber, J. (1989). Adjustment of sleep and thecircadian temperature rhythm after flights acrossnine time zones. Aviation, Space, and Environ-mental Medicine, 60, 733-43.
Gillberg, M. (1984). The effects of two alternativetimings of a one-hour nap on early morningperformance. Biological Psychology, 19, 45-54.
Graeber, R., Rosekind, M., Connell, L., & Dinges,D. (1990). Cockpit napping. ICAO Journal,45, 6-10.
Hamelin, P. (1987). Lorry driver’s time habits in workand their involvement in traffic accidents. Ergo-nomics, 30 (9), 1323-33.
Haslam, D. R. (1985). Sleep deprivation and naps.Behavior Research Methods, Instruments, & Com-puters, 17 (1), 46-54.
Hoddes, E., Zarcone, V., Smythe, E., Phillips, R., &Dement, W. (1973). Quantification of sleepi-ness: A new approach. Psychophysiology, 10 (4),431-6.
Lavie, P., & Weler, B. (1989). Timing of naps:Effects on post-nap sleepiness levels. Electro-encephalography and Clinical Neurophysiology,72, 218-24.
Lumley, M., Roehrs, T., Zorick, F., Lamphere, J., &Roth, T. (1986). The alerting effects of naps insleep-deprived subjects. Psychophysiology, 23 (4),403-8.
Matsumoto, K. (1981). Effects of nighttime naps onbody temperature changes, sleep patterns, andself-evaluation of sleep. Journal of Human Ergology,10, 173-84.
Matsumoto, K., & Harada, M. (1994). The effect ofnight-time naps on recovery from fatigue follow-ing night work. Ergonomics, 37 (5), 899-907.
Mitler, M., Carskadon, M., Czeisler, C., Dement, W.,Dinges, D., & Graeber, R. (1988). Catastrophes,sleep, and public policy: Consensus report. Sleep,11 (1), 100-9.
Monk, T. H. (1986). Advantages and disadvantages ofrapidly rotating shift schedules — A circadianviewpoint. Human Factors, 28 (5), 553-7.
Monk, T., & Moline, M. (1989). The timing of bed-time and waketime decisions in free-running sub-jects. Psychophysiology, 26 (3), 304-10.
Mullaney, D., Kripke, D., Fleck, P., & Johnson, L.(1983). Sleep loss and nap effects on sustainedcontinuous performance. Psychophysiology, 20 (6),643-51.
Naitoh, P., Englund, C., & Ryman, D. (1982). Restor-ative power of naps in designing continuous workschedules. Journal of Human Ergology, 11 (Suppl.),259-78.
Nicholson, A., Pascoe, P., Roehrs, T., Roth, T., Spen-cer, M., Stone, B., & Zorick, F. (1985). Sustainedperformance with short evening and morningsleeps. Aviation, Space, and Environmental Medi-cine, 56, 105-14.
Penn, P., & Bootzin, R. (1990). Behavioral techniquesfor enhancing alertness and performance in shiftwork. Work & Stress, 4 (3), 213-26.
Rechtschaffen, A., & Kales, A. (1968). A manual ofstandardized terminology, techniques, and scor-ing system for sleep stages of human subjects.Washington, DC: U.S. Government PrintingOffice.
Ribak, J., Ashkenazi, I., Klepfish, A., Avgar, D., Tall, J.,Kallner, B., & Noyman, Y. (1983). Diurnal rhyth-micity and Air Force flight accidents due to piloterror. Aviation, Space, and Environmental Medi-cine, 54 (12), 1096-9.
Rogers, A., Spencer, M., Stone, B., & Nicholson, A.(1989). The influence of a 1 h nap on perfor-mance overnight. Ergonomics, 32 (10), 1193-1205.
Rosa, R. (1993). Napping at home and alertness onthe job in rotating shift workers. Sleep, 16 (8),727-35.
Santy, P., Faulk, D., & Davis, J. (1994). Strategiesfor the preflight circadian shifting of spaceshuttle crews. Journal of Clinical Pharmacology,34, 535-42.
33
Schweitzer, P., Muehlback, M., & Walsh, J. (1992).Countermeasures for night work performancedeficits: The effect of napping or caffeine oncontinuous performance at night. Work and Stress,6 (4), 355-65.
Tepas, D., & Mahan, R. (1989). The many meaningsof sleep. Work and Stress, 3 (1), 93-102.
Tilley, A., Wilkinson, R., Warren, P., Watson, W., &Drud, M. (1982). The sleep and performance ofshift workers. Human Factors, 24 (6), 629-41.
Toothaker, L. (1991). Multiple comparisons for re-searchers. Newbury Park: Sage Publications.
Torsvall, L., & Akerstedt, T. (1987). Sleepiness on thejob: Continuously measured EEG changes intrain drivers. Electroencephalography and ClinicalNeurophysiology, 66, 502-11.
Torsvall, L., Akerstedt, T., Gillander, K., & Knutsson,A. (1989). Sleep on the night shift: 24-hour EEGmonitoring of spontaneous sleep/wake behavior.Psychophysiology, 26 (3), 352-8.
Watson, D., Clark, L., & Tellegen, A. (1988). Devel-opment and validation of brief measures of posi-tive and negative affect: The PANAS scale. Jour-nal of Personality and Social Psychology, 54 (6),1063-70.
Webb, W. B. (1982). Sleep and biological rhythms. InW. B. Webb (Ed.), Biological rhythms, sleep, andperformance (pp. 87-110). Chinchester, England:John Wiley & Sons Ltd.
Wechsler, D. (1955). Manual for the Wechsler AdultIntelligence Scale. New York: The PsychologicalCorporation.
Wilkinson, R. (1992). How fast should the night shiftrotate? Ergonomics, 35 (12), 1425-46.
Zachary, R. (1986). Shipley Institute of Living ScaleRevised Manual. Los Angeles: Western Psycho-logical Services.

34