the effects of metformin on obesity-induced diabetic
TRANSCRIPT

THE EFFECTS OF METFORMIN ON OBESITY-INDUCED DIABETIC RETINAS
A Thesis
by
JEESU KIM
Submitted to the Office of Graduate and Professional Studies of Texas A&M University
in partial fulfillment of the requirements for the degree of
MASTER OF SCIENCE
Chair of Committee, Gladys Ko Committee Members, Louise Abbott Chaodong Wu Head of Department, Jane Welsh
August 2017
Major Subject: Biomedical Sciences
Copyright 2017 Jeesu Kim
ii
ABSTRACT
Diabetic retinopathy is a major secondary complication of type 2 diabetes. To
regulate blood glucose levels in type 2 diabetic patients, metformin is popularly
prescribed as an oral drug in mono- and combination therapies. Metformin was used as a
responsive and preventative drug on high-fat diet (HFD) induced obese mice that
emulate type 2 diabetes. Body weight was monitored weekly and systemic glucose levels
including resting blood glucose levels, the glucose tolerance test, and the insulin
resistance test were measured monthly. The electroretinogram (ERG) was used to
measure the retinal light responses, immunohistochemistry to quantify changes in retinal
protein expression, western blot to assess inflammatory markers, and fluorescein
angiography to measure neovascularization.
HFD-fed mice became hyperglycemic after 2 months of feeding regimen.
Metformin treatment following hyperglycemia slowed body weight gain and restored
systemic glucose levels to control levels. Retinal function measured by ERG showed
decreased amplitudes and delayed implicit times in oscillatory potentials after 1 month
of HFD and decreased amplitudes and delayed implicit times in a-wave, b-wave, and
oscillatory potentials starting 2 months of HFD. Metformin treatment after 2 months of
HFD was not able to restore ERG responses in HFD-fed mice. Furthermore, metformin
treatment was not able to recover HFD-induced neovascularization. However, metformin
treatment for the last 4 months in mice fed a HFD for 6 months was able to reduce
inflammatory marker expression and the immunofluorescent proteins affected by HFD-

iii
feeding. HFD-fed mice treated with metformin from the beginning of feeding regimen as
a preventative strategy not only showed slower weight gain but also do not become
hyperglycemic. However, this preventative strategy did not prevent the HFD-induced
retinal dysfunction measured by ERG even after 3 months of treatment. Furthermore,
some HFD-induced changes in retinal protein expression began after 1 month of HFD-
treatment, but metformin treatment concurrent with HFD was not able to prevent HFD-
induced changes.

iv
CONTRIBUTORS AND FUNDING SOURCES
Contributors
This work was supervised by a thesis committee consisting of Associate
Professor Gladys Ko of the Department of Veterinary Integrative Biosciences [advisor],
Professor Louise Abbott of the Department of Veterinary Integrative Biosciences,
Associate Professor Chaodong Wu of the Department of Nutrition and Food Science,
and Professor Evelyn Tiffany-Castiglioni of the Department of Veterinary Integrative
Biosciences.
Dr. Liheng Shi and Janet Chang assisted in handling mice. Kathryn Klotz
assisted with technical data collection. All other work for the thesis was completed
independently by the student.
Funding Sources
Graduate study was supported by a teaching assistantship from the Department of
Veterinary Integrative Biosciences. This work was made possible in part by the U.S.
National Institute of Health/National Eye Institute Grant NIHR21EY023339 to Dr.
Gladys Ko.

v
TABLE OF CONTENTS
Page
ABSTRACT ....................................................................................................................... ii
CONTRIBUTORS AND FUNDING SOURCES ............................................................ iv
TABLE OF CONTENTS ................................................................................................... v
CHAPTER I INTRODUCTION.. ..................................................................................... 1
CHAPTER II MATERIALS AND METHODS.. ............................................................. 4
Animals .......................................................................................................................... 4Glucose tolerance and insulin resistance tests ............................................................... 5In vivo electroretinogram ............................................................................................... 5Immunofluorescent staining .......................................................................................... 6Fluorescein angiography ................................................................................................ 8Western immunoblot analysis ........................................................................................ 9Statistical analyses ......................................................................................................... 9
CHAPTER III RESULTS ............................................................................................... 11
Metformin decelerated body weight gain and reversed hyperglycemia in HFD-induced diabetic animals .............................................................................................. 11HFD-induced retinal dysfunction began with dampened oscillatory potential responses ...................................................................................................................... 12Metformin treatment did not improve the HFD-induced decreases in retinal light responses ...................................................................................................................... 12Metformin restored cell-signaling proteins in the retina that were affected by HFD .. 13Metformin treatment did not rescue HFD-induced neovascularization in the retina .. 14Metformin treatment decreased inflammation ............................................................. 14Treatment with metformin concurrently with the HFD regimen from the beginning delays body weight gain and prevents hyperglycemia in HFD-mice .......................... 15Concurrent treatment of metformin does not prevent HFD-induced retinal dysfunction ................................................................................................................... 161 month of concurrent metformin treatment does not prevent HFD-induced changes in cell signaling in the retina .......................................................................... 16
CHAPTER IV DISCUSSION AND CONCLUSION.....................................................18
REFERENCES ................................................................................................................ 29

vi
APPENDIX ...................................................................................................................... 40
*Reprinted with permission from Kim AJ, Chang JY-A, Shi L, Chang RC-A, Ko ML,Ko GY-P. The effects of metformin on obesity-induced dysfunctional retinas. Invest Ophthalmol Vis Sci. 2017;58:106-118. Copyright 2017 Association for Research in Vision and Ophthalmology
1
CHAPTER I
INTRODUCTION*
Diabetic retinopathy (DR) is one of the major secondary complications of
diabetes and a leading cause of blindness worldwide. 1 Glycemic control is a critical
strategy for diabetic patients to prevent the development of secondary complications 2.
The Diabetes Control and Complications Trial showed that long-term extensive control
of blood glucose reduces the incidence and progression of diabetic complications such as
retinopathy, nephropathy, and neuropathy. 3 One drug that effectively controls systemic
glycemia is metformin. 4, 5 Metformin has been used as an anti-hyperglycemic agent in
diabetic patients, 6 and it is recommended in combination therapies to control the level of
glycated hemoglobin (HbA1c) in patients with ineffective monotherapy, 7 The
effectiveness of metformin as an anti-hyperglycemic agent is based on its ability to
suppress gluconeogenesis in the liver. 5, 8 In addition to its use as an anti-hyperglycemic
agent, one beneficial effect from metformin is mild weight loss. 9-11 The action of
metformin on insulin signaling has made metformin viable for treating non-alcoholic
fatty liver disease 12 and polycystic ovary syndrome. 13 Furthermore, the effectiveness of
metformin to treat other diabetic complications, such as nephropathy 14 and neuropathy
has been investigated. 15 However, whether metformin is able to prevent or reverse DR
is not known.___________________
2
In the US, obesity associated type 2 diabetes has reached epidemic proportions
with more than 68% of American adults considered overweight or obese
(http://win.niddk.nih.gov/statistics/index.htm). More than 60% of type 2 diabetic
patients will develop DR. 16, 17 The high-fat-diet (HFD) mouse model is used to study
type 2 diabetes due to the development of obesity, glucose intolerance, and insulin
resistance. 18 Unlike other mouse models of metabolic syndromes and type 2 diabetes
that utilize genetic mutations to induce insulin resistance and obesity, 19 the HFD model
is a diet-induced obesity model that resembles human obesity-associated type 2 diabetes.
The HFD mice develop hyperglycemia, hyperinsulinemia, hyperlipidemia, and chronic
inflammation after several months of HFD regimen and are suitable to study long-term
diabetic complications. 20, 21 These HFD mice show similar phenotypical deficits found
in other DR animal models, such as lesions in the retinal vasculature and thickening of
Bruch’s membrane. 22 Furthermore, mice fed with a HFD containing 42% fat calories
for 12 months have significantly greater numbers of atrophic capillaries and pericyte
ghosts compared to mice fed with a normal diet. 23 HFD mice emulate the systematic
dysfunction that occurs in type 2 diabetes and further show retinal symptoms found in
DR, thus making HFD-mice a suitable animal model to study type 2 diabetes and
diabetic retinopathy.
Previously, we reported that mice fed with a HFD (59% fat calories) develop
obesity, hyperglycemia, insulin resistance, glucose intolerance, and decreased retinal
light sensitives. 24 These mice have retinal neovascularization after 7 months of HFD
regimen. 25 Since metformin is able to maintain normal systemic glycemia in diabetic

3
animals and patients, 4, 5 in this study, we examined whether metformin was able to
reverse or minimize HFD-induced retinal dysfunction. We combined electroretinogram
(ERG) recordings, immunofluorescent staining, fluorescein angiography (FA), and
western blotting to determine the effects of metformin in HFD-induced diabetic retina.
Furthermore, metformin has been studied in clinical trials to prevent the incidence of
type 2 diabetes in individuals who are prediabetic. 26, 27 Therefore, we examined whether
concurrent treatment of metformin before hyperglycemia was able to prevent the
development of HFD-induced retinal dysfunction and changes in retinal protein
expression through means of ERG recordings and immunofluorescent staining,
respectively.

*Reprinted with permission from Kim AJ, Chang JY-A, Shi L, Chang RC-A, Ko ML,Ko GY-P. The effects of metformin on obesity-induced dysfunctional retinas. Invest Ophthalmol Vis Sci. 2017;58:106-118. Copyright 2017 Association for Research in Vision and Ophthalmology
4
CHAPTER II
MATERIALS AND METHODS*
Animals
Four week old male C57BL/6J mice were purchased from Harlan (Houston, TX,
USA) and the Jackson Laboratory (Bar Harbor, Maine, USA). All animal experiments
were approved by the Institutional Animal Care and Use Committee of Texas A&M
University (AUP# 2014-0285) and were performed in compliance with the ARVO
Statement for the Use of Animals in Ophthalmic and Vision Research. Mice were
housed under temperature and humidity-controlled conditions with 12:12 hour light–
dark cycles. All mice were given food and water ad libitum. At 5 weeks of age (body
weight at 20 g), mice were fed with a standard laboratory chow (control; 10% fat
calories, 20% protein calories, and 70% carbohydrate calories; Research Diets, Inc.,
New Brunswick, NJ, USA) or a high fat diet (HFD; 59.4% fat calories, 18.1% protein
calories, and 22.5% carbohydrate calories; TestDiet®, St. Louis, MO, USA). After 2
months of HFD regimen, some HFD-mice were given daily metformin treatments at a
dosage of 150 mg/Kg through oral gavage as the HFD+Met group. Some HFD mice
were given daily oral gavage of metformin at 200 mg/kg concurrently from the
beginning of the feeding regimen as the HFD+Pre-met group. Body weight and food
intake were measured weekly. Non-fasting blood glucose levels, glucose tolerance, and____________________

5
insulin resistance were measured monthly by taking blood from the tail vein. Glucose
levels were measured using the Clarity Plus Blood Glucose Monitoring System
(Diagnostic Test Group, Boca Raton, FL, USA).
Glucose tolerance and insulin resistance tests
Mice were fasted for 8 hours and given a single intraperitoneal (i.p.) injection of
D-glucose (Sigma-Aldrich, St. Louis, MO, USA) at a dosage of 2 g per kg body weight
for the glucose tolerance test or insulin (Gibco/Life Technologies, Grand Island, NY,
USA) at a dosage of 1 unit per kg body weight for the insulin resistance test. Blood
glucose levels were measured from the tail vein using the Clarity Plus Blood Glucose
Monitoring System (Diagnostic Test Group) at 0, 30, 60, 90, and 120 minutes following
the glucose injection during the glucose tolerance test. Blood glucose levels were
measured at 0, 15, 30, 45, and 60 minutes following the insulin injection during the
insulin resistance test.
In vivo electroretinogram
The in vivo electroretinogram (ERG) recordings of retinal light responses were
performed as described previously. 24 Mice were dark adapted for a minimum of 3 hours
and anesthetized with an i.p. injection of Avertin (2% 2,2,2-tribromoethanol, 1.25% tert-
amyl alcohol; Fisher Scientific, Pittsburgh, PA, USA) solution (12.5 mg/ml) at a dosage
of 500 µl per 25 g body weight. Pupils were dilated using a single drop of 1%
tropicamide / 2.5% phenylephrine mixture for 5 minutes. Mice were placed on a heating

6
pad to maintain body temperature at 37°C. The ground electrode was placed on the tail
and the reference electrode placed under the skin in the cheek below the eye. A thin
drop of Goniovisc (Hub Pharmaceuticals, Rancho Cucamonga, CA, USA) was applied
on the surface of the cornea to keep it moist, and a threaded recording electrode
conjugated to a mini contact lens (Ocuscience, Henderson, NV, USA) was placed on top
of the cornea. All preparatory procedures were done under dim red light, and the light
was turned off during the recording. A portable ERG device (OcuScience) was used to
measure scotopic ERG recordings at light intensities of 0.1, 0.3, 1, 3, 10, and 25 cd·s/m2.
Responses to four light flashes were averaged at the lower light intensities (0.1, 0.3, 1.0,
and 3.0 cd·s/m2) while only one light flash was applied for the higher light intensities
(10 and 25 cd·s/m2). A one minute recovery period was programmed between different
light intensities. The amplitudes and implicit times of the a-wave, b-wave, and
oscillatory potentials (OPs) were recorded and analyzed using the ERGView 4.4
software (OcuScience). Both eyes were included in the analyses and their values were
averaged.
Immunofluorescent staining
Mice were put under deep anesthesia through isoflurane (Zoetis, Parsippany, NJ,
USA) and cervical dislocation was performed. Mouse eyes were excised and prepared as
previously described. 24 In brief, eyes were fixed with Zamboni fixative and processed
for paraffin sectioning at 4 µm. Each glass slide contained single paraffin sections from
the control and experimental groups. After deparaffinization and antigen retrieval,
7
sections were washed in PBS, blocked with 10% goat serum for 2 hours at room
temperature, and then incubated overnight with primary antibodies at 4 °C. The next
day, sections were washed with PBS several times and incubated with fluorescent
conjugated secondary antibodies for 2 hours at room temperature and mounted with
ProLong Gold antifade reagent containing 4’,6-diamidino-2-phenylindole (DAPI;
Invitrogen/Life Technologies, Grand Island, NY, USA). The primary antibodies used
were anti-phospho-protein kinase B (pAKTThr308; 1:100; Cell Signaling Technology,
Danvers, MA, USA), anti-AKT (total AKT, 1:100; Cell Signaling Technology), anti-di-
phospho-extracellular signal-regulated kinase (pERK, 1:100 Sigma-Aldrich, St. Louis,
MO, USA), anti-ERK (total ERK, 1:100, Santa Cruz Biochemicals, Dallas, TX, USA),
anti-phospho-AMPK (pAMPKThr172, 1:100, Cell Signaling Technology), anti-AMPK
(total AMPK, 1:100, Cell Signaling Technology), anti-phosphorylated NF-κB (nuclear
factor κ-light-chain enhancer of activated B cells complex) P65 at Ser536 (pP65; Cell
Signaling Technology), NF-κB P65 (Total P65; Cell Signaling Technology, 1:100, Cell
Signaling Technology), anti-Cav1.3α1D (L-type voltage gated calcium channel α1D
subunit, 1:100, Chemicon International, Temecula, CA, USA). The secondary
antibodies used were Alexa Fluor 488 goat anti-rabbit IgG (1:150; Molecular
Probes/Life Technologies, Grand Island, NY, USA) and Cy5 goat anti-mouse IgG
(1:150; Abcam, Cambridge, MA, USA). The images were taken under a Zeiss Stallion
microscope (Carl Zeiss AG, Oberkochen, Germany). Each fluorescent image from the
control and other experimental groups were taken under identical settings, including the
same exposure time and magnification. Image analysis: In the control, HFD, and

8
HFD+Met group, 3 fluorescent images (n=3) after 7 months treatment were selected and
analyzed from each retinal tissue section, which included all of retinal layers (from the
photoreceptor outer segment to the ganglion cell layer). In the control, HFD, and
HFD+Pre-met groups, 4 fluorescent images (n=1) after 1 month treatment were selected
and quantified for the inner segments of the photoreceptors and also across all the retinal
layers (from the outer segments of photoreceptors to the ganglion cell layer). The
averaged fluorescent intensity per pixel for each image was quantified without any
modification using the luminosity channel of the histogram function in the Adobe
Photoshop 6.0 software (Adobe Systems, San Jose, CA, USA), and the green or red
fluorescent intensities were measured on a scale of 0-255.
Fluorescein angiography
Mice were anesthetized with an i.p. injection of Avertin (12.5 mg/ml) at a dosage
of 500 µl per 25 g body weight. Pupils were dilated using a single drop of 1%
tropicamide / 2.5% phenylephrine mixture for 5 minutes. Immediately following pupil
dilation, 10% sodium fluorescein (Akorn, Lake Forest, Illinois, USA) was i.p. injected at
a dosage of 50 µl per 25 g body weight. Images were taken using the iVivo Funduscope
for small animals (Ocuscience). The vascular parameters were further analyzed with
Adobe Photoshop 6.0 (Adobe Systems) and the AngioTool software, a free software
developed by the National Cancer Institute of National Institutes of Health (NCI/NIH,
Bethesda, MD, USA) 28. Square areas of 289 x 289 pixel2 in the central retina (400
pixels from the optic nerve), as well as in the peripheral retinal region (800 pixels from
9
the optic nerve) were cropped with Adobe Photoshop. For each FA cropped image, at
least 2 areas from the central and peripheral retinal regions were obtained to analyze the
microvascular density (the percentage of vascular area to the retinal area), vessel area,
vessel branch points, and the average non-vascular area (avg. lacunarity) using
AngioTool. The primary retinal arteries and veins were not included in the analyses.
Western immunoblot analysis
Retina samples were collected as previously described. 24, 25 In brief, 2 retinas
from a single mouse were pooled and counted as one sample. Intact retinas were
homogenized in a Tris lysis buffer (50 mM Tris, 1 mM EGTA, 150 mM NaCl, 1%
Triton X-100, 1% β-mercapto-ethanol, 50 mM NaF, 1 mM Na3VO4; pH = 7.5). Samples
were separated on 10% sodium dodecyl sulfate-polyacrylamide gels by electrophoresis
and transferred to nitrocellulose membranes. The primary antibodies used were anti-
phosphorylated NF-κB (nuclear factor κ-light-chain enhancer of activated B cells
complex) P65 at Ser536 (pP65; Cell Signaling Technology) and NF-κB P65 (Total P65;
Cell Signaling Technology). Blots were visualized by using appropriate secondary
antibodies conjugated to horseradish peroxidase (Cell Signaling Technology) and an
enhanced chemiluminescence detection system (Pierce, Rockford, IL, USA).
Statistical analyses
All data are presented as mean ± standard error of mean (SEM). Statistical
analyses were carried out using the Origin 8.6 software (OriginLab, Northampton, MA,

10
USA). Student’s t-test was used for statistical analyses between the control and HFD
group. One-way analysis of variance (ANOVA) followed by Tukey’s post hoc test was
used for statistical analyses between the control, HFD, and HFD+Met/ Pre-met groups.
Throughout, the sample size “n” was the number of animals per group included in the
analyses. p < 0.05 was regarded as significant.

*Reprinted with permission from Kim AJ, Chang JY-A, Shi L, Chang RC-A, Ko ML,Ko GY-P. The effects of metformin on obesity-induced dysfunctional retinas. Invest Ophthalmol Vis Sci. 2017;58:106-118. Copyright 2017 Association for Research in Vision and Ophthalmology
11
CHAPTER III
RESULTS*
Metformin decelerated body weight gain and reversed hyperglycemia in HFD-
induced diabetic animals
Mice fed with a HFD for 2 weeks (open circle) already had a significant weight
gain compared to control mice (open square; Fig. 1A). Treatment with metformin in
HFD-induced obese mice (gray triangle) significantly slowed down their weight gain
compared to HFD-mice without metformin intervention (Fig. 1A). Mice under the HFD
regimen for 2 months developed hyperglycemia (Fig. 1B), but after metformin treatment
for only 1 month, the non-fasting blood glucose level of these HFD-mice returned to
normal levels (Fig. 1B). The glucose tolerance test performed after 1 month of
metformin treatment further verified the effectiveness of metformin in anti-
hyperglycemia and reversing the glucose intolerance in HFD-obese mice back to the
control level (Fig. 1C). Furthermore, the insulin resistance test performed after 1 month
of metformin treatment also showed metformin’s ability to recover insulin resistance in
HFD-obese mice (Fig. 1D). Hence, metformin was effective in controlling systemic
glycemia and weight gain.
____________________

12
HFD-induced retinal dysfunction began with dampened oscillatory potential
responses
We previously showed that retinal light responses decreased after mice were fed
a HFD for 3 months. 24 To further determine when HFD-induced obesity caused retinal
dysfunction, we measured the retinal light sensitivities with scotopic ERG recordings
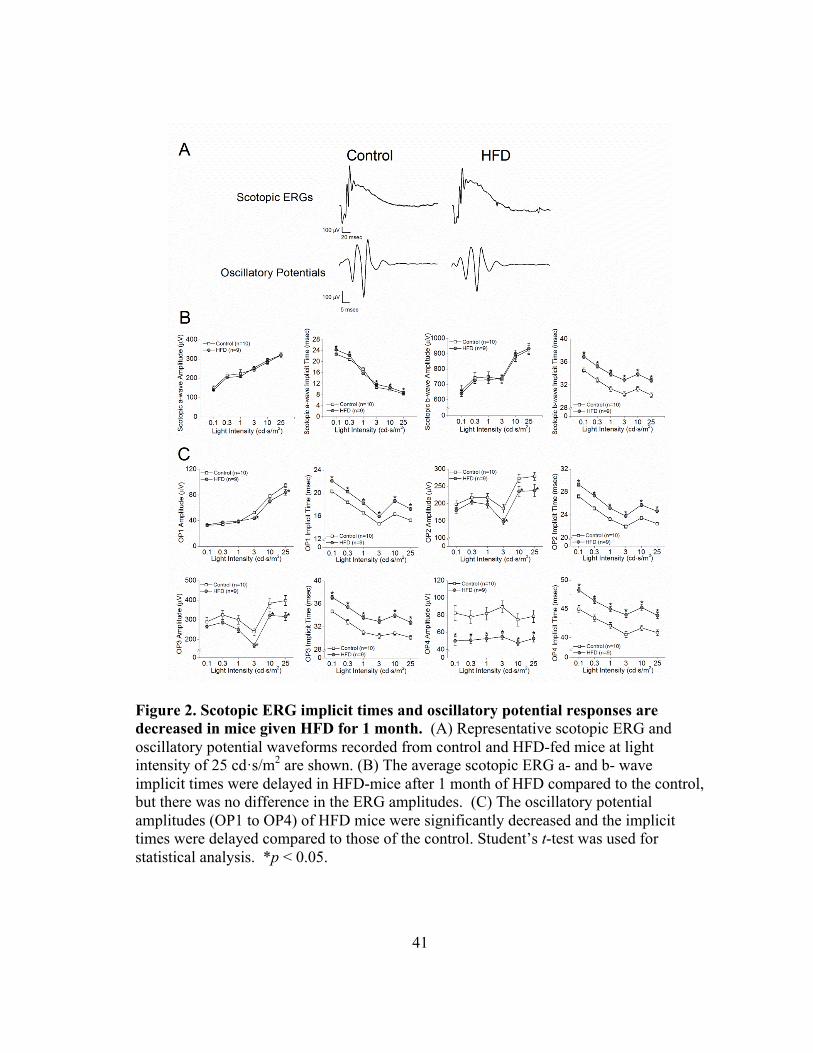
after the mice were fed with the HFD for only 1 month. We found that the amplitudes of
ERG a- and b-waves were similar between the HFD-mice (gray circle) and the control
(open square; Fig. 2A, 2B), but the HFD-mice had longer a- and b-wave implicit times
(Fig. 2B). These HFD-mice also had significantly decreased OP amplitudes and delayed
OP implicit times compared to the control mice (Fig. 2A, 2C), which indicates a possible
early sign of obesity-induced retinal dysfunction, since a delayed OP latency is the first
sign of an early diabetic retina in both rodents and humans. 29-31
Metformin treatment did not improve the HFD-induced decreases in retinal light
responses
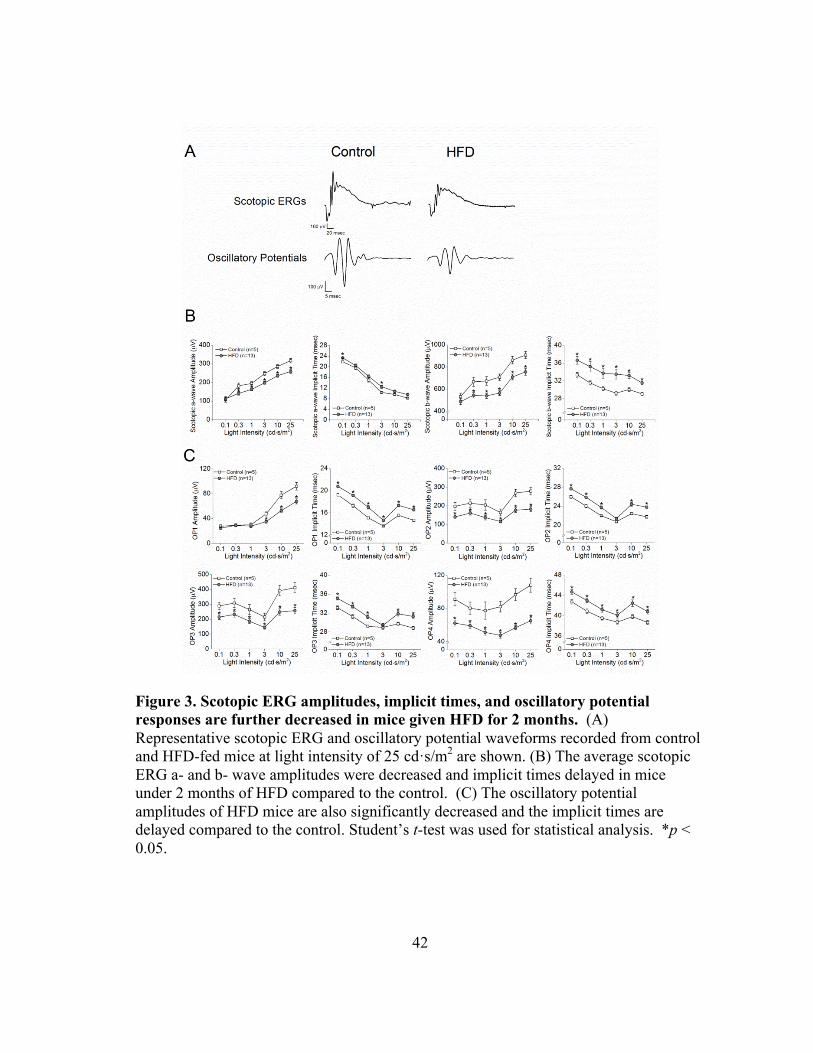
After 2 months of HFD, the retinal light responses in HFD-mice (gray circle) were
further deteriorated (Fig. 3). Compared to the control mice (open square), these HFD-
mice had decreased a- and b-wave amplitudes (Fig. 3A and 3B) in addition to the
functional deficits previously observed after 1 month of HFD (Fig. 3A and 3C). After 5
months of HFD, the retinal light responses in these HFD-mice (open circle) were worsen
and significantly lower than the control mice (open square; Fig. 4). However, the retinal
light responses in HFD-mice treated with metformin (HFD + Met; gray triangle) did not

13
improve as measured by ERG a- and b-waves (Fig. 4A and 4B), and their OPs were
further aggravated (Fig. 4A and 4C), even though these HFD-mice had been treated with
metformin for the last 3 months (Fig. 4D).
Metformin restored cell-signaling proteins in the retina that were affected by HFD
Although metformin did not recover HFD-induced retinal dysfunction, we next
examined whether oral administration of metformin impacted the retina of HFD-mice at
the molecular level. We determined the activation/phosphorylation of AKT, 32, 33,34,35, 36
ERK, 37 and AMPK 38 signaling, since these kinases are critical in cell metabolism,
growth, and survival. Mice under HFD for 6 months (HFD) had a decrease in the
phosphorylation of AKT (pAKT) and AMPK (pAMPK) but an increase in activated
ERK (pERK) in the retina, and there was no apparent change in the total amount of
AKT, ERK, and AMPK in the HFD-retina compared to control mice (Con; Fig. 5). The
retinas from HFD-mice (under a HFD for 6 months) that were treated with metformin
for 4 months (HFD+Met) had a recovery in these signaling molecules: pAKT was no
longer dampened and similar to the control, pAMPK had increased compared to the
control, and the level of pERK was decreased and comparable to the control level (Fig.
5). Interestingly, the retinas from these metformin-treated HFD-mice (HFD+Met) had
an apparent up-regulation of total AMPK and pAMPK compared to control mice, which
indicated that metformin might have a direct effect on AMPK in the neural retina, since
metformin is known to up-regulate the expression and activation of AMPK in the
kidney, 39 adipose tissue, 40, 41 and heart. 42

14
Metformin treatment did not rescue HFD-induced neovascularization in the retina
We recently demonstrated that after 6 months of HFD, these HFD-mouse retinas
develop neovascularization with an apparent increase of microaneuryism-like structures,
25 so we examined whether metformin treatments could stop the process of
neovascularization in the HFD-mouse retina. We used FA and AngioTool 28 to compare
changes in the central and peripheral retinal vasculature of the control, HFD, and HFD +
Met mice (Fig. 6A). In the central retina, there were no differences in any vascular
parameters between the three experimental groups (Fig. 6B). However, in the peripheral
retina, mice under HFD for 6 months (HFD) had a significant increase in vascular
density, vessel area, and the number of branch points compared to the control mice (Fig.
6C), while the average retinal area without detectable vasculature (avg. lacunarity) was
decreased in HFD mice (HFD) and HFD-mice treated with metformin (Fig. 6C). Thus,
mice under HFD for 6 months had retinal neovascularization, but treatment with
metformin for 4 months (HFD+Met) did not improve HFD-caused retinal
neovascularization (Fig. 6C). No differences in neovascularization in HFD-mice were
observed at 5 months of feeding-regimen compared to control mice (data not shown).
Metformin treatment decreased inflammation
Since metformin has anti-inflammatory properties, 43 we determined if
metformin could reverse HFD-induced retinal inflammation. Western blot analysis
showed a significantly higher expression of phosphorylated P65 (pP65), a subunit of
nuclear factor κ-light-chain-enhancer of activated B cells (NF-κB) transcription complex

15
and a biomarker for inflammation, 44 in HFD-mouse retina (HFD) compared to controls
(Con), but the retina of HFD-mice treated with metformin (HFD+Met) had less pP65
compared to the HFD-mouse retina (Fig. 7A). These data provided evidence that
metformin indeed reduced retinal inflammation in HFD-mice.
Treatment with metformin concurrently with the HFD regimen from the beginning
delays body weight gain and prevents hyperglycemia in HFD-mice
Metformin is widely used as a preventative medicine for type 2 diabetes as well
as cancer. 45-47 Instead of treatment with metformin 2 months after HFD-feeding and the
presence of hyperglycemia, metformin was administered at the beginning of HFD-
feeding to determine whether metformin was able to prevent HFD-induced retinal
dysfunction. Mice fed with a HFD for two weeks showed a significant weight gain
compared to control (Fig. 8A, *). However, mice fed a HFD and treated with metformin
concurrently (HFD + Pre-met) did not show a significant weight gain until week 9 (Fig.
8A, #), and this group had a significantly lower body weight from weeks 11-19
compared to HFD-mice without the metformin intervention (Fig. 8A, &). In addition,
HFD-mice treated with metformin concurrently did not become hyperglycemic (Fig. 8B)
and did not show glucose intolerance (Fig. 8C), nor display insulin resistance (Fig. 8D)
compared to the HFD-mice after 3 months of the feeding-regimen.

16
Concurrent treatment of metformin does not prevent HFD-induced retinal
dysfunction
Retinal light responses were measured 3 months after mice were fed normal
chow (control), a HFD, and a HFD with daily metformin treatment concurrently from
the beginning (HFD + Pre-met). As previously observed, HFD-mice show decreased a-
and b- wave amplitudes and delayed a- and b-wave implicit times compared to control
mice (Fig. 9A). HFD-mice that were treated with metformin from the beginning
(HFD+Pre-met) also had decreased a- and b-wave amplitudes and delayed a- and b-wave
implicit times compared to control mice (Fig. 9A). The oscillatory potential responses
for both HFD and HFD-mice treated with metformin (HFD + Pre-met) were worsen after
3 months of HFD-feeding regimen (Fig. 9C).
1 month of concurrent metformin treatment does not prevent HFD-induced
changes in cell signaling in the retina
Previously, we showed that HFD mice with metformin treatment starting after 2
months of the diet regimen and subsequently treated with metformin for another 4
months (HFD + Met group) had reversed changes in cell signaling molecules that were
caused by HFD in the retina (Fig. 5). We examined what early changes in cell signaling
that HFD regimen would induce, and if treatment of metformin concurrently with HFD
from the beginning would prevent the HFD-induced changes in the retina after HFD-
regimen for only 1 month. We quantified the changes in the inner segments of
photoreceptors and across the retinal layers (from the outer segment of photoreceptors to

17
the ganglion cell layer) in the retinal sections from mice fed with standard chow (Con), a
HFD, and a HFD with daily metformin treatment (HFD + Pre-met). There was no
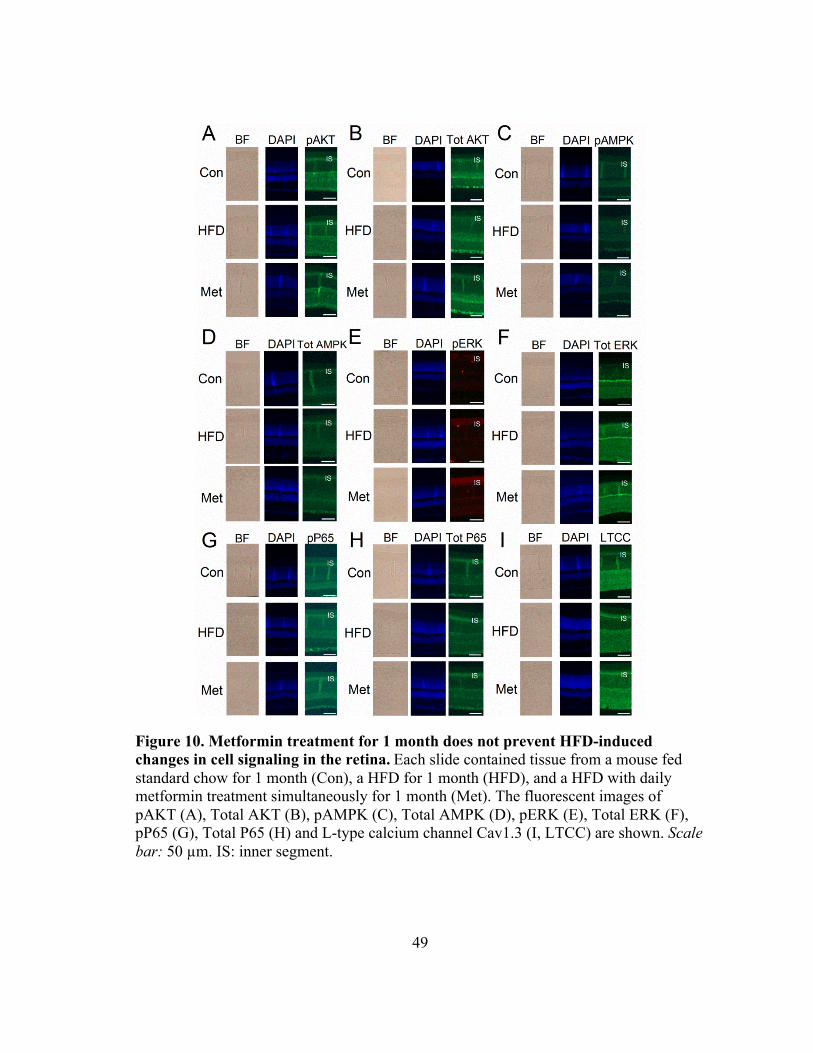
significant difference in the fluorescent intensities of pAKT (Fig. 10A, 11A), Total AKT
(Fig. 10B, 11B), pAMPK (Fig. 10C, 11C), and Total ERK (Fig. 10F, 11F) among the
three groups (Fig. 11A, B, C, F). The fluorescent intensities for Total AMPK (Fig. 10D)
were increased in the HFD+Pre-met group in the inner segment compared to control
mice (Fig. 11D, left panel). The fluorescent intensities for pERK (Fig. 10E, 11E), pP65
(Fig. 10G, 10G), Total P65 (Fig. 10H, 11H) and the L-type voltage-gated calcium
channel Cav1.3 (LTCC; Fig. 10I, 11I) were increased in both the HFD and HFD+Pre-
met groups in the inner segment compared to control mice (Fig. 11E, G, H, I). There was
no significant difference in fluorescent intensities among the three groups when the
fluorescent intensities were analyzed across all retinal layers (Fig. 11).
*Reprinted with permission from Kim AJ, Chang JY-A, Shi L, Chang RC-A, Ko ML,Ko GY-P. The effects of metformin on obesity-induced dysfunctional retinas. Invest Ophthalmol Vis Sci. 2017;58:106-118. Copyright 2017 Association for Research in Vision and Ophthalmology
18
CHAPTER IV
DISCUSSION AND CONCLUSION*
We examined the effects of administering metformin, an anti-hyperglycemic
agent, as a preventative and recovery drug on retinal function and physiology in HFD-
induced diabetic mice. We hypothesized that controlling systemic glycemia with
metformin could recover HFD-induced retinal dysfunction. To simulate clinical settings
of human diabetic patients, we started the metformin treatments in these HFD-mice after
hyperglycemia was detected. As seen in human patients where the ERG OPs are more
sensitive to diabetic stress, 48, 49 we observed that one month after HFD regimen, the
HFD-mice had decreased OPs and delayed OP implicit times, even though these HFD-
mice had not yet developed systemic hyperglycemia. These data indicate that retinal
function might be compromised during pre-diabetic conditions preceding systemic
hyperglycemia. With the development of diabetes, both ERG a- and b-waves were
dampened after 2 months of HFD, which were concurrent with the development of
hyperglycemia. Treatment with metformin significantly decelerated weight gain and
controlled systemic blood glucose levels in HFD-mice, but it was not able to restore
retinal function. The ERG OP amplitudes were further decreased and implicit time was
further delayed in metformin-treated HFD-mice (HFD+Met) compared to HFD-mice
without metformin intervention. ____________________

19
In a recent report, 23 mice fed with a HFD containing 42% fat calories developed
diabetes by 6 months of the diet regimen, and by 12 months, decreased OPs with delayed
OP implicit times, as well as vascular complications including atrophic capillaries and
pericyte ghosts are apparent. Interestingly, there was no significant change in the ERG
a- and b-waves recorded from these HFD-mice. 23 We consistently observe that mice
fed with a HFD containing 59.4% fat calories develop glucose intolerance and insulin
resistance at the end of 3 months of the HFD regimen, 24, 25 which is consistent with
other reports using the HFD with the same fat calories. 50-53 These HFD-mice have
significant weight gain only 2 weeks after the diet regimen compared to control mice.
As we previously reported, 24, 25 the ERG a- and b-waves in these HFD-mice have
decreased amplitudes and delayed implicit times. We further demonstrated that OPs
were affected in the HFD-mice even prior to systemic hyperglycemia. These results
indicate that the dietary fat content affects the temporal progression of DR. Mice fed a
HFD with 42% fat calories show decreased OPs after 1 year, while we show that OP
deficiencies are evident only after 1 month of HFD with 59.4% fat calories. More studies
are necessary to show whether the increased fat concentration in diet speeds up obesity
and type 2 diabetes or if the fat percentage has a direct impact on the neural retina.
Despite the inability to recover retinal function, metformin had significant effects
on several cell-signaling proteins in the retina that were altered by HFD. In context of
the pathogenesis of DR, the phosphoinositide 3-kinase-AKT (PI3K-AKT) pathway has
been shown to regulate angiogenesis. 54 Previously, we showed that HFD-induced type 2
diabetic retinas have reduced pAKT that is also seen in STZ-induced type 1 diabetic

20
mice. 55 We found that metformin treatments restored pAKT and increased AMPK and
pAMPK in HFD-mouse retinas. AMPK is a cellular energy sensor, and activated
AMPK further stimulates catabolic processes for increasing ATP production. 38 In
muscles, AMPK activates the PI3K-AKT pathway that leads to increased glucose uptake
into the muscle cells. 56 We previously showed that activation of AMPK leads to
activation of AKT and its downstream signaling in the avian retina. 57 Metformin is
known to up-regulate the expression and activation of AMPK in the kidney, 39 adipose
tissue, 40, 41 and heart. 42 Hence, the effects of metformin on pAKT could be a
downstream effect from its activation of AMPK-dependent signaling.
In addition, increased activation/phosphorylation of ERK (pERK) is correlated
with the presence of pro-inflammatory cytokines. 58 Activation of ERK is involved in
the up-regulation of VEGF, an angiogenic protein that causes microvascular
complications and neovascularization in DR. 59, 60 We showed that phosphorylation of
ERK was increased in the retinas of HFD-mice, and treatment with metformin reduced
pERK in HFD-mouse retina. Furthermore, HFD mouse retinas had increased expression
of pP65 compared to controls, which was reduced in retinas of metformin treated HFD-
mice. Obesity is known to induce systemic inflammation, 61-63 but induction of systemic
inflammation does not correlate with retinal inflammation. 64 Previously, we also
analyzed the status of intra-ocular inflammation from the vitreous and lens. 65 The
expression of pro-inflammatory cytokines in HFD-mice was increased, and metformin
was able to reverse HFD-induced intra-ocular inflammation. Although it was unable to

21
reverse HFD-induced retinal dysfunction and neovascularization, metformin was able to
reverse intra-ocular inflammation and HFD-induced effects on retinal proteins.
In addition, metformin has successfully acted as a protective drug in various
disease models when used to pre-treat animals prior to the induction of diseases,
including acute kidney injury 66 and cerebral forebrain ischemia. 67, 68 Since metformin
treatment following hyperglycemia was unable to reverse numerous HFD-induced
changes in the retina, we hypothesized that metformin is more effective given at a pre-
diabetic or non-diabetic stage as a preventive strategy rather than as a treatment for
diabetic retinas. Treatment with metformin in the beginning concurrent with HFD not
only caused a delayed weight gain in HFD-mice, but also prevented the development of
hyperglycemia. Nevertheless, both HFD mice and HFD-mice treated with metformin
concurrently (HFD + Pre-met) showed deficiencies in retinal light responses even after 3
months of treatment. These data show that decreased retinal light responses as measured
by ERG are not a result of hyperglycemia, but rather due to other obesity-induced
changes such as dyslipidemia or inflammation. Furthermore, immunohistochemical
staining of retinas from mice with 1 month of HFD or HFD with metformin treatment
(HFD + Pre-met) showed that metformin was unable to reverse HFD-induced changes in
cell signaling. 1 month of HFD-feeding showed increases in pERK, pP65, Total P65,
and LTCC Cav1.3 expressions in the retinal photoreceptors. However, treatment of
metformin for 1 month was not able to act as a protective agent for these changes. The
increases in pP65 and Total P65 indicate the presence of inflammation in the retina even
when blood glucose levels are controlled by metformin, showing that inflammation is

22
not an effect of hyperglycemia. It is possible that it will take a longer time for
metformin treatments to reverse HFD-induced retinal inflammation, while metformin
could effectively reverse or prevent systemic hyperglycemia within 1 month. While
metformin is not metabolized in the body, it is quickly excreted from the body, but after
long-term treatments with metformin, it may accumulate in the body and requires longer
clearance times. 69, 70
Lastly, after 1 month treatment with metformin, we observed an increase in the
fluorescent intensities of total AMPK in the photoreceptors. AMPK acts as an energy
sensor by being activated or inactivated depending on the AMP to ATP ratio in the cell.
71 Metformin has been identified as an activator of the AMPK pathway in numerous cell
types including hepatocytes, 72, 73 endothelial cells, 74 cardiomyocytes, 75 cancer cells, 76
and adipose tissue. 41 In photoreceptors, we found that the expression of total AMPK
was increased after 1 month of metformin treatment, while there is a significant increase
in pAMPK after 4 months of metformin treatment. A recent study shows that metformin
administration through intraperitoneal injection also increases pAMPK in the mouse
retinas.77 Thus, the activation of AMPK by metformin in the neural retina is a primary
effect, since metformin is able to reach the neural retina through blood circulation
regardless of its routes of administration.
In summary, long-term treatment with metformin successfully reversed
hyperglycemia and decreased retinal inflammation in HFD-mice, but was unable to
restore retinal light responses. Early treatment with metformin prevented HFD-mice
23
from becoming hyperglycemic, but it did not prevent HFD-induced retinal dysfunction
and changes in cell signaling.
Following chronic hyperglycemia, changes in the normal metabolic state
including inflammation, oxidative stress, and dyslipidemia have been hypothesized as
major contributors to proliferative diabetic retinopathy.78, 79 Besides its main function as
an anti-hyperglycemia agent, metformin addresses these secondary metabolic
disturbances in addition to controlling systemic blood glucose levels within a single
treatment. Our data shows metformin effectively reduces intra-ocular inflammation, but
retinal function was unable to be recovered and its dysfunction could not be prevented
with prior treatment. This evidence challenges predominant theories that a pro-
inflammatory state in the retina is driving the downstream metabolic changes leading to
neovascularization and proliferation. Despite metformin’s beneficial effects on the
overall metabolic state of the retina, retinal dysfunction was unable to be prevented. Our
specific use of metformin was to target hyperglycemia, the initiator of metabolic
dysfunction. However, our data showed that recovery of hyperglycemia did not recover
retinal function and further demonstrated that mice that never become hyperglycemic
still acquire retinal dysfunction. This data proposes that hyperglycemia and
inflammation may not be the causes for retinal dysfunction caused by obesity. Attempts
to stall the development of DR pathogenesis have been widely unsuccessful, largely
because numerous metabolic changes occur following chronic hyperglycemia. Targeting
single downstream signaling pathways have failed to prevent angiogenesis, and we show
that controlling two major proposed contributors in hyperglycemia and inflammation
24
through metformin does not prevent retinal dysfunction. There is a critical need to
pinpoint the source of retinal dysfunction and neovascularization or targeting a
metabolic mechanism that can deter the pathogenesis of DR.
In a high-fat-diet obesity model, another potential contributor in driving retinal
dysfunction and neovascularization is oxidative stress. Metformin administered to
diabetic rats reduces oxidative stress in plasma, the aorta, and the kidney.80 Although
metformin does show capabilities in reducing oxidative stress, further experiments are
necessary to verify its anti-oxidative capabilities specifically in the retina. Since
mitochondrial oxidative phosphorylation and the nicotinamide adenine dinucleotide
phosphate- (NADPH) oxidase (NOX) system are the two major sources of oxidative
stress, it would be beneficial to know if metformin also has an effect on limiting the
production of reactive oxygen species from these metabolic producers. Immediate
experiments such as IHC staining of key markers such as superoxide dismutase 2
(SOD2) and NADPH-oxidase 2 (NOX2) on metformin treated HFD-mice may indicate
metformin’s potential on reducing oxidative stress. In addition, experiments using the
Seahorse XF analyzer would be able to measure energy production produced from
oxidative phorphorylation and glycolysis. Using the Seahorse XF analyzer, experiments
with photoreceptors and/or endothelial cells in high glucose conditions (30 mM) can be
treated with metformin to see if supplementation with this drug can reduce the
overproduction of reactive oxygen species as a byproduct of mitochondrial oxidative
phosphorylation. Furthermore, fluorescence ROS assays can be done on cultured

25
photoreceptors and/or endothelial cells with and without metformin treatment to measure
the presence of different types of reactive oxygen species through fluorescence.
Although our data indicates that 4 months of metformin treatment does not have
a statistical difference in neovascularization in the peripheral eye compared to high-fat-
diet fed mice, it is possible we are making a statistical type II error because the amount
of mice included in our analysis is only n=4. Although, the ANOVA p-value comparing
the HFD and HFD+metformin group is 0.2 and we fail to reject the null hypothesis, the
range of values especially in the # of branch points parameter shoes a tight range of
values in the metformin treated mice group compared to the HFD group indicating that
metformin is having some effect on delaying or decreasing neovascularization.
Metformin has been reported to reduce VEGFR2 activation in Strepzotocin(STZ)-
induced diabetic mice.81 We have also shown that the amount of VEGF in the lens and
vitreous of mice treated with metformin is comparable to control levels and decreased
compared to HFD mice. 65 Despite having conflicting reports in cancer-related
angiogenesis, 82 metformin has shown to have anti-angiogenic effects in the oxygen-
induced retinopathy mouse model with reduced vasculature and expression of VEGFR2.
83 Further experiments are necessary to observe if the high-fat-diet model with
metformin treatment also has similar effects of VEGF and VEGFR2 expression after
metformin treatment. Before in vivo experiments with metformin treatments are done to
check the possibility of a type II statistical error, western blot or IHC experiments
probing for VEGF and VEGFR2 protein expression would show if metformin treatment
similarly has effects in reducing VEGFR2 in the high-fat-diet model and thus be

26
potentially alleviating angiogenesis. Metformin treatment on endothelial cells has
previously been completed, but the conditions of high-fat-diet have not been replicated.
Further in vitro experiments on endothelial cells can be done to see if a high-fat-diet like
conditions shows proliferation and migration in endothelial cells. Using high glucose
conditions or administration of palmitate to emulate the increase of glucose levels or free
fatty acids in HFD conditions, experiments on endothelial cells such as the MTT assay
or scratch assay can be done with or without metformin treatment to see if metformin
could have anti-angiogenic effects specifically on endothelial cells in HFD-like
conditions.
Despite metformin’s numerous beneficial effects on the retina, a potential reason
why the overall function in the retina does not recover is due to a phenomenon called
“metabolic memory.” Metabolic memory is the persistence of hyperglycemia-induced
changes even after reversing back to normoglycemia. 84 Metabolic memory was first
observed in dogs, 85 but it has also been documented in STZ-induced diabetic rats. 86, 87
Here we show that metformin was able to reverse blood glucose levels back to the
normal level in HFD-mice, but continued treatments with metformin could not restore
the retinal function, which indicates that retina might have a strong “metabolic memory”
to be overcome. Although metformin was able to reverse systemic glucose levels and
inflammation, it is possible that reversal of hyperglycemia and inflammation might not
be able to completely stop or restore HFD-induced dysfunctional retina. Hence, it may
require a combination therapy in addition to anti-hyperglycemic, anti-inflammatory, plus
other treatments to reverse obesity-induced DR.

27
In addition, vascular endothelial growth factor (VEGF) is a growth factor that is
mainly implicated in its role on endothelial cells in stimulating angiogenesis. After
binding to its tyrosine kinase receptors, VEGF stimulates the RAS-ERK and PI3K-AKT
pathways for cell proliferation. The immunohistochemistry data after 4 months of
metformin treatment indicates decreased ERK activation compared to only HFD-fed
mice. However, HFD-fed mice had decreased AKT activation and metformin treated
HFD-mice had further increased AKT activation back to control levels. In regards to
angiogenesis, this increased AKT activation may be contributing to increased
angiogenesis in metformin treatment and interfering with other anti-angiogenic
responses such as decreased ERK signaling activation. To verify that activation of the
PI3K-AKT pathway in metformin treated mice is not restricting metformin’s potential in
limiting angiogenesis, HFD and HFD + metformin treatment can be administered to
endothelial specific AKT knockout mice and similarly tested for neovascularization
through fluorescein angiography. If these AKT knockout mice given HFD and
metformin treatment show significantly decreased neovascularization compared to HFD-
mice, metformin plus AKT pathway inhibitors may be a potential route for treatment or
prevention of angiogenesis.
The data presented in this thesis challenges the common conception that
controlling hyperglycemia and/or inflammation will deter the progression of diabetic
retinopathy. Metformin is shown to control systemic hyperglycemia and reduce intra-
ocular inflammation but do not show statistically significant improvements in retinal
function or neovascularization. Further experiments on metformin’s effects on the retina

28
can reveal what signaling pathways were unaffected or exacerbated through metformin
treatment and provide insight into potential new therapies in preventing or delaying
diabetic retinopathy.

29
REFERENCES
1. Wild S, Roglic G, Green A, Sicree R, King H. Global prevalence of diabetes:
estimates for the year 2000 and projections for 2030. Diabetes Care 2004;27:1047-1053.
2. American Diabetes A. Standards of medical care in diabetes--2013. Diabetes
Care 2013;36 Suppl 1:S11-66.
3. The effect of intensive treatment of diabetes on the development and progression
of long-term complications in insulin-dependent diabetes mellitus. The Diabetes Control
and Complications Trial Research Group. N Engl J Med 1993;329:977-986.
4. Effect of intensive blood-glucose control with metformin on complications in
overweight patients with type 2 diabetes (UKPDS 34). UK Prospective Diabetes Study
(UKPDS) Group. Lancet 1998;352:854-865.
5. Song S, Andrikopoulos S, Filippis C, Thorburn AW, Khan D, Proietto J.
Mechanism of fat-induced hepatic gluconeogenesis: effect of metformin. Am J Physiol
Endocrinol Metab 2001;281:E275-282.
6. Inzucchi SE, Bergenstal RM, Buse JB, et al. Management of hyperglycaemia in
type 2 diabetes: a patient-centered approach. Position statement of the American
Diabetes Association (ADA) and the European Association for the Study of Diabetes
(EASD). Diabetologia 2012;55:1577-1596.
7. Yu S, Schwab P, Bian B, Radican L, Tunceli K. Use of add-on treatment to
metformin monotherapy for patients with type 2 diabetes and suboptimal glycemic
control: a U.S. database study. J Manag Care Spec Pharm 2016;22:272-280.
30
8. Stumvoll M, Nurjhan N, Perriello G, Dailey G, Gerich JE. Metabolic effects of
metformin in non-insulin-dependent diabetes mellitus. N Engl J Med 1995;333:550-554.
9. Malin SK, Kashyap SR. Effects of metformin on weight loss: potential
mechanisms. Curr Opin Endocrinol Diabetes Obes 2014;21:323-329.
10. Diabetes Prevention Program Research G. Long-term safety, tolerability, and
weight loss associated with metformin in the Diabetes Prevention Program Outcomes
Study. Diabetes Care 2012;35:731-737.
11. Diabetes Prevention Program Research G, Knowler WC, Fowler SE, et al. 10-
year follow-up of diabetes incidence and weight loss in the Diabetes Prevention Program
Outcomes Study. Lancet 2009;374:1677-1686.
12. Guigas B, Bertrand L, Taleux N, et al. 5-Aminoimidazole-4-carboxamide-1-beta-
D-ribofuranoside and metformin inhibit hepatic glucose phosphorylation by an AMP-
activated protein kinase-independent effect on glucokinase translocation. Diabetes
2006;55:865-874.
13. Valsamakis G, Lois K, Kumar S, Mastorakos G. Metabolic and other effects of
pioglitazone as an add-on therapy to metformin in the treatment of polycystic ovary
syndrome (PCOS). Hormones (Athens) 2013;12:363-378.
14. Alhaider AA, Korashy HM, Sayed-Ahmed MM, Mobark M, Kfoury H, Mansour
MA. Metformin attenuates streptozotocin-induced diabetic nephropathy in rats through
modulation of oxidative stress genes expression. Chem Biol Interact 2011;192:233-242.
31
15. Wile DJ, Toth C. Association of metformin, elevated homocysteine, and
methylmalonic acid levels and clinically worsened diabetic peripheral neuropathy.
Diabetes Care 2010;33:156-161.
16. Cunha-Vaz J, Ribeiro L, Lobo C. Phenotypes and biomarkers of diabetic
retinopathy. Prog Retin Eye Res 2014;41:90-111.
17. Fong DS, Aiello L, Gardner TW, et al. Retinopathy in diabetes. Diabetes Care
2004;27 Suppl 1:S84-87.
18. Winzell MS, Ahren B. The high-fat diet-fed mouse: a model for studying
mechanisms and treatment of impaired glucose tolerance and type 2 diabetes. Diabetes
2004;53 Suppl 3:S215-219.
19. Fellmann L, Nascimento AR, Tibirica E, Bousquet P. Murine models for
pharmacological studies of the metabolic syndrome. Pharmacol Ther 2013;137:331-340.
20. Ahren B, Simonsson E, Scheurink AJ, Mulder H, Myrsen U, Sundler F.
Dissociated insulinotropic sensitivity to glucose and carbachol in high-fat diet-induced
insulin resistance in C57BL/6J mice. Metabolism 1997;46:97-106.
21. Weisberg SP, McCann D, Desai M, Rosenbaum M, Leibel RL, Ferrante AW, Jr.
Obesity is associated with macrophage accumulation in adipose tissue. J Clin Invest
2003;112:1796-1808.
22. Vinores SA, Campochiaro PA, May EE, Blaydes SH. Progressive ultrastructural
damage and thickening of the basement membrane of the retinal pigment epithelium in
spontaneously diabetic BB rats. Exp Eye Res 1988;46:545-558.
32
23. Rajagopal R, Bligard GW, Zhang S, Yin L, Lukasiewicz P, Semenkovich CF.
Functional deficits precede structural lesions in mice with high-fat diet-induced diabetic
retinopathy. Diabetes 2016;65:1072-1084.
24. Chang RC, Shi L, Huang CC, et al. High-Fat Diet-Induced Retinal Dysfunction.
Invest Ophthalmol Vis Sci 2015;56:2367-2380.
25. Shi L, Kim AJ, Chang RC, et al. Deletion of miR-150 exacerbates retinal
vascular overgrowth in high-fat-diet induced diabetic mice. PLoS One
2016;11:e0157543.
26. Knowler WC, Barrett-Connor E, Fowler SE, et al. Reduction in the incidence of
type 2 diabetes with lifestyle intervention or metformin. N Engl J Med 2002;346:393-
403.
27. Zinman B, Harris SB, Gerstein HC, et al. Preventing type 2 diabetes using
combination therapy: design and methods of the CAnadian Normoglycaemia Outcomes
Evaluation (CANOE) trial. Diabetes Obes Metab 2006;8:531-537.
28. Zudaire E, Gambardella L, Kurcz C, Vermeren S. A computational tool for
quantitative analysis of vascular networks. PLoS One 2011;6:e27385.
29. Pardue MT, Barnes CS, Kim MK, et al. Rodent hyperglycemia-induced inner
retinal deficits are mirrored in human diabetes. Transl Vis Sci Technol 2014;3:6.
30. Shirao Y, Kawasaki K. Electrical responses from diabetic retina. Prog Retin Eye
Res 1998;17:59-76.
31. Yonemura D, Aoki T, Tsuzuki K. Electroretinogram in diabetic retinopathy.
Arch Ophthalmol 1962;68:19-24.
33
32. Dilly AK, Rajala RV. Insulin growth factor 1 receptor/PI3K/AKT survival
pathway in outer segment membranes of rod photoreceptors. Invest Ophthalmol Vis Sci
2008;49:4765-4773.
33. Li G, Rajala A, Wiechmann AF, Anderson RE, Rajala RV. Activation and
membrane binding of retinal protein kinase Balpha/Akt1 is regulated through light-
dependent generation of phosphoinositides. J Neurochem 2008;107:1382-1397.
34. Chang L, Chiang SH, Saltiel AR. Insulin signaling and the regulation of glucose
transport. Mol Med 2004;10:65-71.
35. Barros LF, Deitmer JW. Glucose and lactate supply to the synapse. Brain Res
Rev 2010;63:149-159.
36. Lopez L, Sannita WG. Glucose availability and the electrophysiology of the
human visual system. Clin Neurosci 1997;4:336-340.
37. Cobb MH. MAP kinase pathways. Prog Biophys Mol Biol 1999;71:479-500.
38. Hardie DG. AMP-activated/SNF1 protein kinases: conserved guardians of
cellular energy. Nat Rev Mol Cell Biol 2007;8:774-785.
39. Kim D, Lee JE, Jung YJ, et al. Metformin decreases high-fat diet-induced renal
injury by regulating the expression of adipokines and the renal AMP-activated protein
kinase/acetyl-CoA carboxylase pathway in mice. Int J Mol Med 2013;32:1293-1302.
40. Li A, Zhang S, Li J, Liu K, Huang F, Liu B. Metformin and resveratrol inhibit
Drp1-mediated mitochondrial fission and prevent ER stress-associated NLRP3
inflammasome activation in the adipose tissue of diabetic mice. Mol Cell Endocrinol
2016.

34
41. Luo T, Nocon A, Fry J, et al. AMPK activation by metformin suppresses
abnormal adipose tissue extracellular matrix remodeling and ameliorates insulin
resistance in obesity. Diabetes 2016.
42. Lai YC, Tabima DM, Dube JJ, et al. SIRT3-AMP-activated protein kinase
activation by nitrite and metformin improves hyperglycemia and normalizes pulmonary
hypertension associated with heart failure with preserved ejection fraction. Circulation
2016;133:717-731.
43. Saisho Y. Metformin and inflammation: its potential beyond glucose-lowering
effect. Endocr Metab Immune Disord Drug Targets 2015;15:196-205.
44. Karin M, Greten FR. NF-kappaB: linking inflammation and immunity to cancer
development and progression. Nat Rev Immunol 2005;5:749-759.
45. Akinyeke T, Matsumura S, Wang X, et al. Metformin targets c-MYC oncogene
to prevent prostate cancer. Carcinogenesis 2013;34:2823-2832.
46. Doggrell SA. Metformin & lifestyle intervention prevent Type 2 diabetes:
lifestyle intervention has the greater effect. Expert Opin Pharmacother 2002;3:1011-
1013.
47. Louro TM, Matafome PN, Nunes EC, da Cunha FX, Seica RM. Insulin and
metformin may prevent renal injury in young type 2 diabetic Goto-Kakizaki rats. Eur J
Pharmacol 2011;653:89-94.
48. Bresnick GH, Palta M. Predicting progression to severe proliferative diabetic
retinopathy. Arch Ophthalmol 1987;105:810-814.

35
49. Bresnick GH, Palta M. Oscillatory potential amplitudes. Relation to severity of
diabetic retinopathy. Arch Ophthalmol 1987;105:929-933.
50. Guo T, Woo SL, Guo X, et al. Berberine ameliorates hepatic steatosis and
suppresses liver and adipose tissue inflammation in mice with diet-induced obesity. Sci
Rep 2016;6:22612.
51. Woo SL, Xu H, Li H, et al. Metformin ameliorates hepatic steatosis and
inflammation without altering adipose phenotype in diet-induced obesity. PLoS One
2014;9:e91111.
52. Ying W, Tseng A, Chang RC, et al. MicroRNA-223 is a crucial mediator of
PPARgamma-regulated alternative macrophage activation. J Clin Invest 2015;125:4149-
4159.
53. Zhuang G, Meng C, Guo X, et al. A novel regulator of macrophage activation:
miR-223 in obesity-associated adipose tissue inflammation. Circulation 2012;125:2892-
2903.
54. Ackah E, Yu J, Zoellner S, et al. Akt1/protein kinase Balpha is critical for
ischemic and VEGF-mediated angiogenesis. J Clin Invest 2005;115:2119-2127.
55. Jiang T, Chang Q, Cai J, Fan J, Zhang X, Xu G. Protective effects of melatonin
on retinal inflammation and oxidative stress in experimental diabetic retinopathy. Oxid
Med Cell Longev 2016;2016:3528274.
56. Sajan MP, Bandyopadhyay G, Miura A, et al. AICAR and metformin, but not
exercise, increase muscle glucose transport through AMPK-, ERK-, and PDK1-
36
dependent activation of atypical PKC. Am J Physiol Endocrinol Metab 2010;298:E179-
192.
57. Huang CC, Shi L, Lin CH, Kim AJ, Ko ML, Ko GY. A new role for AMP-
activated protein kinase in the circadian regulation of L-type voltage-gated calcium
channels in late-stage embryonic retinal photoreceptors. J Neurochem 2015;135:727-
741.
58. Busik JV, Mohr S, Grant MB. Hyperglycemia-induced reactive oxygen species
toxicity to endothelial cells is dependent on paracrine mediators. Diabetes
2008;57:1952-1965.
59. Hu J, Li T, Du S, et al. The MAPK signaling pathway mediates the GPR91-
dependent release of VEGF from RGC-5 cells. Int J Mol Med 2015;36:130-138.
60. Jin J, Yuan F, Shen MQ, Feng YF, He QL. Vascular endothelial growth factor
regulates primate choroid-retinal endothelial cell proliferation and tube formation
through PI3K/Akt and MEK/ERK dependent signaling. Mol Cell Biochem
2013;381:267-272.
61. Kim MS, Yamamoto Y, Kim K, et al. Regulation of diet-induced adipose tissue
and systemic inflammation by salicylates and pioglitazone. PLoS One 2013;8:e82847.
62. Ying W, Kanameni S, Chang CA, et al. Interferon tau alleviates obesity-induced
adipose tissue inflammation and insulin resistance by regulating macrophage
polarization. PLoS One 2014;9:e98835.
63. Ying W, Tseng A, Chang RC, et al. miR-150 regulates obesity-associated insulin
resistance by controlling B cell functions. Sci Rep 2016;6:20176.

37
64. Tamura H, Kiryu J, Miyamoto K, et al. In vivo evaluation of ocular inflammatory
responses in experimental diabetes. Br J Ophthalmol 2005;89:1052-1057.
65. Kim AJ, Chang JY, Shi L, Chang RC, Ko ML, Ko GY. The effects of metformin
on obesity-induced dysfunctional retinas. Invest Ophthalmol Vis Sci 2017;58:106-118.
66. Li J, Gui Y, Ren J, et al. Metformin protects against cisplatin-induced tubular cell
apoptosis and acute kidney injury via AMPKalpha-regulated autophagy induction. Sci
Rep 2016;6:23975.
67. Ashabi G, Khalaj L, Khodagholi F, Goudarzvand M, Sarkaki A. Pre-treatment
with metformin activates Nrf2 antioxidant pathways and inhibits inflammatory responses
through induction of AMPK after transient global cerebral ischemia. Metab Brain Dis
2015;30:747-754.
68. Ghadernezhad N, Khalaj L, Pazoki-Toroudi H, Mirmasoumi M, Ashabi G.
Metformin pretreatment enhanced learning and memory in cerebral forebrain ischaemia:
the role of the AMPK/BDNF/P70SK signalling pathway. Pharm Biol 2016;1-9.
69. Graham GG, Punt J, Arora M, et al. Clinical pharmacokinetics of metformin.
Clin Pharmacokinet 2011;50:81-98.
70. Kajbaf F, Bennis Y, Hurtel-Lemaire AS, Andrejak M, Lalau JD. Unexpectedly
long half-life of metformin elimination in cases of metformin accumulation. Diabet Med
2016;33:105-110.
71. Lage R, Dieguez C, Vidal-Puig A, Lopez M. AMPK: a metabolic gauge
regulating whole-body energy homeostasis. Trends Mol Med 2008;14:539-549.

38
72. Cao J, Meng S, Chang E, et al. Low concentrations of metformin suppress
glucose production in hepatocytes through AMP-activated protein kinase (AMPK). J
Biol Chem 2014;289:20435-20446.
73. Meng S, Cao J, He Q, et al. Metformin activates AMP-activated protein kinase
by promoting formation of the alphabetagamma heterotrimeric complex. J Biol Chem
2015;290:3793-3802.
74. Yu JW, Deng YP, Han X, Ren GF, Cai J, Jiang GJ. Metformin improves the
angiogenic functions of endothelial progenitor cells via activating AMPK/eNOS
pathway in diabetic mice. Cardiovasc Diabetol 2016;15:88.
75. Hu M, Ye P, Liao H, Chen M, Yang F. Metformin protects H9C2
cardiomyocytes from high-glucose and hypoxia/reoxygenation injury via inhibition of
reactive oxygen species generation and inflammatory responses: role of AMPK and
JNK. J Diabetes Res 2016;2016:2961954.
76. Sun Y, Tao C, Huang X, et al. Metformin induces apoptosis of human
hepatocellular carcinoma HepG2 cells by activating an AMPK/p53/miR-23a/FOXA1
pathway. Onco Targets Ther 2016;9:2845-2853.
77. Athanasiou D, Aguila M, Opefi CA, et al. Rescue of mutant rhodopsin traffic by
metformin-induced AMPK activation accelerates photoreceptor degeneration. Hum Mol
Genet 2017.
78. Roy S, Kern TS, Song B, Stuebe C. Mechanistic insights into pathological
changes in the diabetic retina: implications for targeting diabetic retinopathy. Am J
Pathol 2017;187:9-19.
39
79. Chatziralli IP. The role of dyslipidemia control in the progression of diabetic
retinopathy in patients with type 2 diabetes mellitus. Diabetes Ther 2017;209.
80. Rosen P, Wiernsperger NF. Metformin delays the manifestation of diabetes and
vascular dysfunction in Goto-Kakizaki rats by reduction of mitochondrial oxidative
stress. Diabetes Metab Res Rev 2006;22:323-330.
81. Yi QY, Deng G, Chen N, et al. Metformin inhibits development of diabetic
retinopathy through inducing alternative splicing of VEGF-A. Am J Transl Res
2016;8:3947-3954.
82. Dallaglio K, Bruno A, Cantelmo AR, et al. Paradoxic effects of metformin on
endothelial cells and angiogenesis. Carcinogenesis 2014;35:1055-1066.
83. Joe SG, Yoon YH, Choi JA, Koh JY. Anti-angiogenic effect of metformin in
mouse oxygen-induced retinopathy is mediated by reducing levels of the vascular
endothelial growth factor receptor Flk-1. PLoS One 2015;10:e0119708.
84. Zhang L, Chen B, Tang L. Metabolic memory: mechanisms and implications for
diabetic retinopathy. Diabetes Res Clin Pract 2012;96:286-293.
85. Engerman RL, Kern TS. Progression of incipient diabetic retinopathy during
good glycemic control. Diabetes 1987;36:808-812.
86. Kowluru RA, Chan PS. Metabolic memory in diabetes - from in vitro oddity to in
vivo problem: role of apoptosis. Brain Res Bull 2010;81:297-302.
87. Kowluru RA, Kanwar M, Kennedy A. Metabolic memory phenomenon and
accumulation of peroxynitrite in retinal capillaries. Exp Diabetes Res 2007;2007:21976.

40
APPENDIX
Figure 1. Metformin slows the rate of weight gain and controls diet-induced hyperglycemia in HFD mice. Mice were fed a normal chow diet (Control [open square]) or HFD (open circle). Two months after the diet regimen, half of the HFD mice were given daily oral metformin treatments (gray triangle). (A) Mice fed a HFD had significant weight gain starting 1 week after HFD-feeding compared to control mice (*). The HFD-fed mice given daily metformin (HFD+Met) showed decelerated weight gain compared to the HFD mice without metformin intervention (HFD). # indicates statistical significance between the control and HFD+Met groups. & indicates statistical significance between the HFD and HFD+Met groups. (B) HFD-fed mice had an increase of non-fasting blood glucose after 2 months of the diet regimen. Following 1 month of metformin treatment, the resting blood glucose levels of HFD+Met mice were back to control levels. (C) The glucose tolerance test and (D) insulin resistance test shows the ability of metformin to control HFD-induced hyperglycemia. *,#,&P < 0.05.
41
Figure 2. Scotopic ERG implicit times and oscillatory potential responses are decreased in mice given HFD for 1 month. (A) Representative scotopic ERG and oscillatory potential waveforms recorded from control and HFD-fed mice at light intensity of 25 cd·s/m2 are shown. (B) The average scotopic ERG a- and b- wave implicit times were delayed in HFD-mice after 1 month of HFD compared to the control, but there was no difference in the ERG amplitudes. (C) The oscillatory potential amplitudes (OP1 to OP4) of HFD mice were significantly decreased and the implicit times were delayed compared to those of the control. Student’s t-test was used for statistical analysis. *p < 0.05.
42
Figure 3. Scotopic ERG amplitudes, implicit times, and oscillatory potential responses are further decreased in mice given HFD for 2 months. (A) Representative scotopic ERG and oscillatory potential waveforms recorded from control and HFD-fed mice at light intensity of 25 cd·s/m2 are shown. (B) The average scotopic ERG a- and b- wave amplitudes were decreased and implicit times delayed in mice under 2 months of HFD compared to the control. (C) The oscillatory potential amplitudes of HFD mice are also significantly decreased and the implicit times are delayed compared to the control. Student’s t-test was used for statistical analysis. *p < 0.05.

43
Figure 4. Metformin treatment for 3 months does not improve HFD-induced retinal deficiencies. The control mice were fed standard chow for 5 months (control). HFD mice were given HFD for 5 months (HFD). The HFD + metformin mice were given HFD for 5 months and metformin for the last 3 months. (A) Representative scotopic ERG and oscillatory potential waveforms recorded from control, HFD mice, and HFD-mice treated with metformin at light intensity of 25 cd·s/m2 are shown. (B) HFD mice have decreased a- and b-wave amplitudes and delayed b-wave implicit times compared to the control (*). The HFD + metformin mice have decreased a-wave and b-wave amplitudes and delayed b-wave implicit times compared to the control (#). The HFD + metformin mice had delayed b-wave implicit times compared to those of HFD mice (&), but there was no statistical difference between the HFD and the HFD + metformin groups in a-wave amplitudes, b-wave amplitudes, and a-wave implicit times. (C) The oscillatory potential amplitudes were decreased and implicit times delayed in HFD mice compared to the control (*). The oscillatory potential amplitudes were decreased and implicit times delayed in HFD + metformin mice compared of the control (#). Furthermore, HFD + metformin mice had decreased OP amplitudes and delayed implicit times compared to the HFD mice (&). (D) Maximal scotopic a- and b-wave amplitudes are unchanged in control mice over time. However, maximal scotopic a- and b-wave amplitudes of HFD mice are decreased after 2 months and further decreased after 5 months of the diet regimen. Treatments with metformin for 3 months (HFD + Met) did not reverse the a- and b-wave amplitudes to the control level. *, #, &p < 0.05.

44
Figure 5. Metformin reverses HFD-induced effects on the immunofluorescent intensities of several proteins in mice retina. Mouse retinal sections (4 µm) were processed for immunofluorescent staining. Control mice (Con) were given standard chow for 7 months. The HFD mice (HFD) were given a HFD for 7 months. The HFD + metformin (HFD + Met) mice were given HFD for 7 months and treated with metformin for the last 5 months. (A-C) The fluorescent images of pAKT (A) and total AKT (B), and the statistical analyses of the fluorescent intensities in the control, HFD, and the HFD+Met retinas (C) are shown. The pAKT fluorescent intensity of HFD-retinas is significantly lower (*) than the other two groups. (D-F) The fluorescent images of pERK (D) and total ERK (E), and the statistical analyses of the fluorescent intensities in the control, HFD, and the HFD+Met retinas (F) are shown. The fluorescent intensity of pERK in the HFD mouse retina is significantly higher (*) compared to the control and the HFD+Met retinas. (G-I) The fluorescent images of pAMPK (G) and total AMPK (H), and the statistical analyses of the fluorescent intensities in the control, HFD, and the HFD+Met retinas (I) are shown. The fluorescent intensity of pAMPK in the HFD-retinas is significantly lower (*) compared to the control and HFD+Met retinas (*), while pAMPK is significantly higher in the HFD+Met mouse retina (#) compared to that of the control and HFD-retinas. The fluorescent intensity of total AMPK is significantly higher in the HFD+Met retina (#) compared to the other two groups. Scale bar = 50 µm. ONL, outer nuclear layer; OPL, outer plexiform layer; INL, inner nuclear layer; IPL, inner plexiform layer. (C, F, and I) The box-plots represent the distribution of fluorescent intensities within the specific group. The black line represents the median, and the gray line represents the mean of the specific group. N is the animal number of the group. *, #p < 0.05.

45
Figure 6. Metformin does not reverse HFD-induced neovascularization. Fluorescein angiography was used to determine the retinal vasculature in mice fed with normal chow (control), HFD for 6 months (HFD), or HFD mice treated with metformin (HFD+metformin). (A) The AngioTool software was used to determine the vascular parameters including vascular density, vessel area, the number of vessel branch points, and the average non-vascular space (avg. lacunarity). (B) There is no statistical difference in vascular density, vessel area, the number of branch points, and avg. lacunarity between control, HFD, and HFD + metformin (HFD+Met) mice in the central region of retinas. (C) In the peripheral regions of retinas, HFD-mice (HFD) and HFD-mice treated with metformin (HFD+Met) have statistical differences compared to the control (*) in vascular density, vessel area, number of branch points, and avg. lacunarity. The box-plots represent the distribution of fluorescent intensities within the specific group. The black line represents the median, and the gray line represents the mean of the specific group. N is the animal number of the group. *, #p < 0.05.
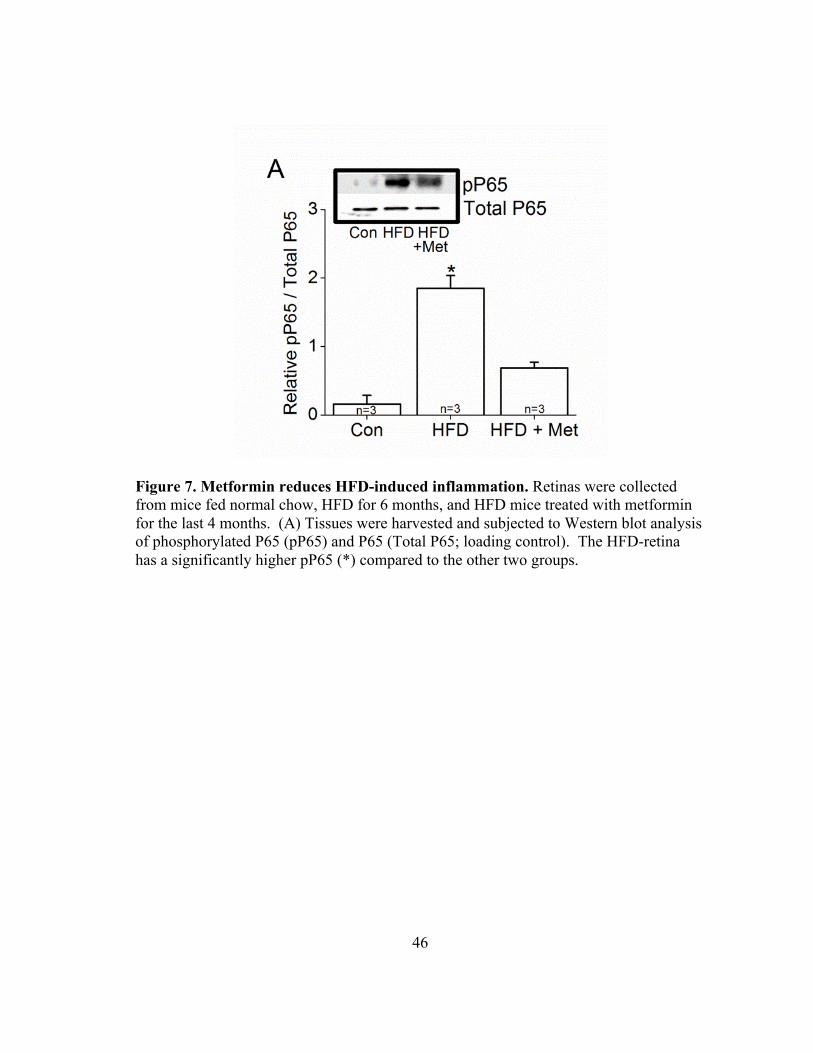
46
Figure 7. Metformin reduces HFD-induced inflammation. Retinas were collected from mice fed normal chow, HFD for 6 months, and HFD mice treated with metformin for the last 4 months. (A) Tissues were harvested and subjected to Western blot analysis of phosphorylated P65 (pP65) and P65 (Total P65; loading control). The HFD-retina has a significantly higher pP65 (*) compared to the other two groups.

47
Figure 8. Metformin treatment delays body weight gain and prevent development of hyperglycemia in HFD-mice. Mice were fed a normal diet (Control), HFD, or a HFD with daily oral metformin treatment simultaneously (HFD + Pre-met). (A) Mice fed HFD had significant weight gain starting two weeks after HFD compared to the control (*). Mice fed a HFD and treated with metformin (HFD + Pre-met) did not have a significant weight gain until 9 weeks of HFD-feeding compared to the control (#). HFD mice treated with metformin (HFD + Pre-met) do not gain as much body weight as the HFD mice from weeks 11-19 (&). (B) HFD-fed mice had an increase of fasting blood glucose levels after 2 months of the diet regimen (*). However, HFD-fed mice treated with metformin do not develop hyperglycemia. (C) Treatment with metformin simultaneously with HFD-regimen from the beginning(HFD + Pre-met) prevents the development of glucose intolerance after 3 months of HFD. (D) HFD mice treated with metformin concurrently (HFD + Pre-met) show significant differences in insulin resistance compared to HFD-mice (&). *, #, &P < 0.05.

48
Figure 9. Concurrent metformin treatment does not prevent HFD-induced retinal dysfunction. Mice were fed a standard chow for 3 months (control), a HFD for 3 months (HFD), or a HFD with daily metformin treatments for 3 months (HFD+Pre-met). (A) HFD mice have decreased a- and b-wave amplitudes and delayed a- and b-wave implicit times compared to control mice (*). The HFD+Pre-met mice also have delayed a- and b- wave amplitudes and delayed a-wave implicit times compared to the control (#). However, HFD+Pre-met mice have improved b-wave implicit times compared to HFD mice (&). (B) The oscillatory potentials amplitudes were decreased and implicit times delayed in HFD- mice compared to controls (*) and also with HFD+Pre-met mice compared to controls (#). *, #, &P < 0.05.
49
Figure 10. Metformin treatment for 1 month does not prevent HFD-induced changes in cell signaling in the retina. Each slide contained tissue from a mouse fed standard chow for 1 month (Con), a HFD for 1 month (HFD), and a HFD with daily metformin treatment simultaneously for 1 month (Met). The fluorescent images of pAKT (A), Total AKT (B), pAMPK (C), Total AMPK (D), pERK (E), Total ERK (F), pP65 (G), Total P65 (H) and L-type calcium channel Cav1.3 (I, LTCC) are shown. Scale bar: 50 µm. IS: inner segment.
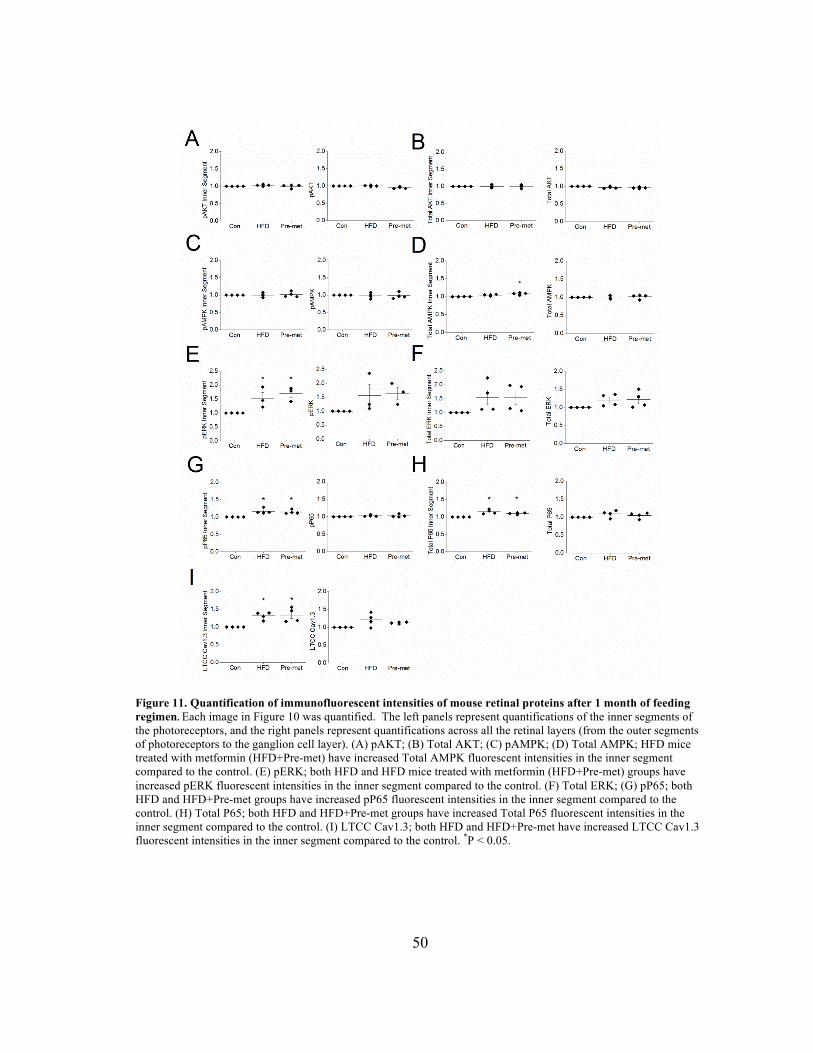
50
Figure 11. Quantification of immunofluorescent intensities of mouse retinal proteins after 1 month of feeding regimen. Each image in Figure 10 was quantified. The left panels represent quantifications of the inner segments of the photoreceptors, and the right panels represent quantifications across all the retinal layers (from the outer segments of photoreceptors to the ganglion cell layer). (A) pAKT; (B) Total AKT; (C) pAMPK; (D) Total AMPK; HFD mice treated with metformin (HFD+Pre-met) have increased Total AMPK fluorescent intensities in the inner segment compared to the control. (E) pERK; both HFD and HFD mice treated with metformin (HFD+Pre-met) groups have increased pERK fluorescent intensities in the inner segment compared to the control. (F) Total ERK; (G) pP65; both HFD and HFD+Pre-met groups have increased pP65 fluorescent intensities in the inner segment compared to the control. (H) Total P65; both HFD and HFD+Pre-met groups have increased Total P65 fluorescent intensities in the inner segment compared to the control. (I) LTCC Cav1.3; both HFD and HFD+Pre-met have increased LTCC Cav1.3 fluorescent intensities in the inner segment compared to the control. *P < 0.05.