the effects of magnitude and direction of stimulus change on auditory event-related potentials...
TRANSCRIPT

BIOLOGICAL PSYCHOLOGY
ELSEVIER Biological Psychology 37 (1994) 219-234
The effects of magnitude and direction of stimulus change on auditory event-related potentials elicited
by deviant signal stimuli
Allan Nash, Lynne Peralme ‘, Paul Jasiukaitis 2
Department of Psychology, Florida Atlantic University, Boca Raton, FL 33431, USA
Received 6 May 1991; revised 30 March 1993; accepted 22 October 1993
Abstract
The present study sought to identify components of the auditory event-related potential (ERP) elicited by stimuli that serve as signals for overt discriminative responses. Sokolov’s view of a selective neural filter for deviant stimuli predicts that responses to deviant signal stimuli will be graded in proportion to the amount of change from the standard and independent of the direction of that change. The demonstration of a bi-directional and graded ERP response requires at least two levels of stimulus change in each direction. The present study incorporated two deviants that were lower in pitch (lowest, low) and two that were higher in pitch (high, highest) in order to evaluate the degree (linear, quadratic, etc.) of the function relating ERP response to tonal deviance. Stimulus changes on both the direction and magnitude dimensions were also varied on a trial-by-trial, rather than on a block-by-block, basis which eliminated potential confounds with block or session differ- ences, and discriminative responses were required to both standard and deviant tones, thereby investing both categories of stimuli with signal value.
The amplitude of the P3 component associated with deviant stimuli showed close correspondence to the (quadratic) function predicted from the selective filter model. A late negative slow wave (NSW) at Fz and a positive slow wave (PSW) at Pz differentiated deviant tones from the standard but did not distinguish between the deviants themselves. A fronto-central NSW observed at Fz and Cz for initial standard tones was greater than the
predominantly frontal NSW elicited by the deviant tones. The topographical differences in NSW elicited by the initial standard tone and by all deviant tones suggest that different
processes are reflected in the NSW response to these stimuli.
’ Present address: Department of Psychology, The Florida State University, Tallahassee, FL 32306,
USA. P?esent address: Department of Psychiatry and Behavioral Sciences, Stanford University School of
Medicine, Stanford, CA 94305, USA.
0301-0511/94/$07.00 0 1994 Elsevier Science B.V. All rights reserved SSDI 0301.0511(93)00931-9

220 A. Nash et al. /Biological Psychology 37 (1994) 219-234
Key words: Selective filtering; Pitch change; P3; Slow wave
1. Introduction
Numerous investigators have studied the effects of changes in pitch on the components of the auditory event-related potential (ERP) using what NZGnen (1990) has called the “active (attend)” oddball paradigm in which a rare, deviant stimulus is either covertly counted or overtly responded to with some behavior such as pushing a button. The general finding has been that, as the magnitude of the difference between the standard and deviant tones increases, the latency of the N2 and P3 components of the auditory ERP decreases while the amplitude of P3
. . . . (and, in some instances, Nl) increases (Ford, Roth & Kopell, 1976; Naatanen, Hukkanen & Jgrvilehto, 1980; NBBt%nen, Simpson & Loveless, 1982; Fitzgerald & Picton, 1983; Sams, Paavilainen, Alho & NZitanen, 1985; Polich, 1989).
The dominant theoretical perspective for interpreting the effects of stimulus change on the ERP has been provided by Sokolov (1963, 1975), who postulates that response habituation to a repeated standard stimulus and the orienting response (OR) to a deviant stimulus are due to the growth of a “neuronal model” of the standard stimulus. The emergence of this model is manifest by selective filtering of the OR to an habituated stimulus, i.e. the OR is suppressed to a subset of points along the relevant physical dimensions of the stimulus, specifically those points that are associated with the habituated stimulus (Sokolov, 1960, 1990). This view of selective filtering predicts that the magnitude of the OR will be propor- tional to the distance between the deviant and habituated stimuli along the physical dimension of the eliciting stimulus and independent of the direction of change on this dimension.
Previous investigations of the effects of stimulus deviance on the ERP have not provided conclusive evidence for a selective filtering effect since stimulus changes have been either uni-directional (increases or decreases along a physical dimen- sion, but not both) or, when bi-directional deviant stimuli were used, the magni- tude of the bi-directional changes was not systematically varied. A convincing demonstration of selective filtering would require at least two levels of stimulus deviance in both directions with respect to the standard stimulus (two deviants of differing magnitude below the standard and two above the standard). The princi- pal goal of the present study was to investigate the effects of multiple, graded increases and decreases in pitch on the ERP in order to determine which components, if any, would show symmetric, proportional responses indicative of selective filtering.
Another, methodological, issue addressed by the present experiment was whether stimulus change would be a between- or within-block manipulation. Both the direction and the magnitude of stimulus change were allowed to vary on a trial-by-trial basis in the present study, thereby eliminating potential confounds with inter-block differences in the subject’s state of general arousal, motivation,

attention and, perhaps most important, processing strategies which might utilize the information that certain dimensions of the stimulus would not change within blocks.
Although Sokofov’s neuronal mode1 was deveIoped to account for the acquisi- tion, habituation and reinstatement of the OR to stimulus novelty, independent of any special significance associated with the stimulus, he also included the OR as an intrinsic part of conditioned reflexes to signal stimuli, i.e. stimuli which act as signals for specific behavioral responses (Sokolov, 1963, pp. 291-292). Since overt di~rjmj~ative responses to stimuli that vary in relative frequency of occurrence are common in the natural environments the present investigation sought to determine if selective filtering effects on the ERP would be manifest along a stimulus dimension when both standard and deviant stimuli required a behavioral response. Under such response requirements, the effects of stimulus deviation on the ERP may be assessed independently of effects due to differences in the allocation of attention, to early processing decisions of stimulus retevance, to the processing of response-retated information or to the production of the response itself. In the present investigation, four levels of rare pitch change were selected (lowest, low, high, highest), centered on a standard tone of intermediate pitch. Differential key presses for both standard and deviant stimuli were required to ensure that the subject would attend to, process, and make an overt discriminative response to both classes of stimuli.
It should be noted that neuronaf modefs for ERP responses to stimulus change have also been proposed to account for the mismatch negativity (MMN), a slow negative shift in the ERP which may be present when an auditory stimulus deviates in any physical characteristic from a repetitive background stimulus (NaatHnen & Gaillard, 1983). The MMN, however, is not readily observed under active oddbalf conditions and is reduced for tonger interstimulus intervals (for a review, see NlhtHnen, 1990% Since the focus of the present study was on changes in the ERP that are associated with attended, overt responses to both standard and deviant signal stimuli, an attempt was made to reduce the potential contribu- tion of MMN to measured changes in other components of the ERP that overlap the MMN in time by adopting a relatively long interstimulus interval (ISI) of 3.5 s.
2. Method
The subjects were 18 volunteer students from Florida AtIantic University. Nine of the subjects were males and the other nine were females. Their mean age was 23 years. Fourteen of the subjects were selected from an undergraduate subject pool and received class credit for their participation. Four of the subjects were psychology graduate students with varying amounts of previous experience in eIeetro-encephalogram (EEG) experiments.

222 A. Nash et al. /Biological Psychology 37 (1494) 219-234
2.2. Apparatus and procedure
The subject sat in a recliner inside a dimly lit, sound- attenuated chamber and was instructed to minimize eye and body movements during stimulus presenta- tions. Sinusoidal tone bursts of approximately 85 ms duration (40 ms rise-time followed by a sustained 40 ms on-time followed by an exponential decay) were generated and amplified by a Polyfusion frequency synthesizer and delivered binaurally through electrically shielded headphones every 3.5 s at a constant intensity of 71 dB SPL. Standard tones were 1000 Hz while deviants were either 950 Hz (lowest), 975 Hz (low), 1025 Hz (high) or 1050 Hz (highest).
A test session consisted of four blocks of 256 trials subdivided into 13 series of 20 trials per series (the last series within each block consisted of only 16 trials). The first three trials of each series were always standard tones. Each of the remaining trials was, in random order, either a standard tone (p = 0.80) or one of the four equally probable deviant tones (p = 0.05 each). A restriction on the random order required that at least three standard tones separate any two deviant tones. On each trial the subject pressed one micro-switch with the ring finger of the preferred hand to indicate detection of the standard and pressed a second micro-switch with the index finger to indicate detection of any deviant. The subject was instructed to respond to the stimulus tone as quickly as possible without sacrificing response accuracy. The time interval between each series was approxi- mately 10 s, and a 5 min rest period was given between each of the four blocks of trials.
2.3. EEG recording and averaging
The EEG was recorded at Fz, Cz and Pz, with Ag/AgCl electrodes, referenced to the linked earlobes. A grounding plate electrode was attached to the inside of the left forearm. The (differential) electro-oculogram (EOG) was recorded from two electrodes placed on the medial orbital ridge and the lower lateral corner of the subject’s right eye. The EEG and EOG were amplified by a Grass model 79 polygraph with 7P511 amplifiers (high and low pass limits were set at 0.1 and 100 Hz, respectively, one-half amplitude) and stored on magnetic tape for off-line analysis by a Nicolet model 1170 signal-averaging computer. A one-second epoch of EEG activity was obtained on each trial consisting of 1 sample point per 4 ms, beginning 250 ms prior to the delivery of the stimulus (used to establish the EEG baseline) and extending to 750 ms post-stimulus. There was no digital filtering of the analog EEG signal after conversion to digital form. In addition to automatic on-line rejection of any trials in which the amplified EOG channel showed clipping, individual records were also visually inspected prior to averaging and trials containing alpha, movement or EOG artifact in excess of 50 PV were rejected. The ERPs were averaged at each electrode site for each of the following trial classifications: initial standard, pre-deviant standard, lowest deviant, low deviant, high deviant, and highest deviant.

A. Nash et al. /Biological Psychology 37 (1994) 219-234 223
2.4. Data reduction and statistical analysis
The data from four of the 18 subjects were excluded from the analysis because of excessive EOG and/or alpha contamination. ~plitudes of the Nl, P2, N2 and P3 components of the ERP were defined for each subject under each trial classification as the most negative (or positive, for positive components) peak amplitude in the specified interval following stimulus onset: Nl (80-150 ms), P2 (150-250 ms), N2 (170-300 ms) and P3 (250-550 ms). All amplitude measures were referred to the mean EEG activity in the 250 ms interval preceding the stimulus. MMN was estimated for each deviant tone by subtracting the mean of the standard tone waveform averaged over the interval between peak Nl and peak N2 from the mean of the deviant waveform averaged over the same interval. The data acquisition system did not permit the computation of the difference wave- forms over the entire trial interval which would be required for conventional graphic presentation of the MMN, The measure used to estimate MMN in the present study, however, is equivalent to the difference waveform (deviant minus standard) integrated over the interval from peak Nl to peak N2. The slow wave (SW) components were defined for all subjects as the baseline corrected mean EEG amplitude at each electrode site averaged over the interval from 550-748 ms.
Analyses involving contrasts between the deviant and pre-deviant standard tone classifications were carried out using orthogonal trend contrasts on each ERP or behavioral measure with tonal frequency as the ordered variable. Of particular interest were any ERP components whose amplitude (positive or negative) in- creased as a quadratic function of pitch since this trend component would indicate effects of pitch change that were J-shaped, V-shaped or U-shaped functions of deviation from the standard (or their inverted counterparts). Analyses of variance that did not use trend contrasts (such as the analysis of MMN which was defined only for the four deviant tones) handled possible violations of the assumption of circularity in the data by using the Huynh and Feldt adjustment to the residual error degrees of freedom when the statistical hypothesis under test involved more than one degree of freedom in the numerator (Kirk, 1982). The magnitude of the adjustment, 8, is reported for each of these analyses. To determine whether there were differences in the scalp topography of SW measures elicited by initial standard, pre-deviant standard and all deviant tones, the data were normalized according to a procedure recommended by McCarthy & Wood (1985). A differ- ence in the topography of the SW distribution on the scalp is indicated in the analysis of variance of the normalized SW amplitude by a significant interaction between the electrode location and stimulus condition factors (also see Ritter, Simson & Vaughan, 1988).
3. Results
Table 1 presents the mean (averaged across subjects) peak amplitudes and latencies of Nl, P2, N2, and P3 of the auditory ERP, along with the mean

224
Table 1
A. Nash et al. /Biological Psychology 37 (1994) 219-235
Mean amplitude &V) and latency (ms) of auditory evoked potentials classified by stimulus frequency
(Hz) and relative position within a series of trials
ERP meas- Deviant tones Standard tones Deviant tones ures
Pre-deviant
Nl Fz
CZ
Pz
(950 Hz) (975 Hz) (1000 Hz) Lowest Low Initial
- 11.2 f116) -11.2~116) - 12.4 (126) - Il.9 (114) - 11.4 (114) - 15.0 (125)
- 7.1 (114) -6.4(111) -9.8 (118)
- 10.0 (114)
- 10.3 (113)
-5.3 (113)
( 1025 Hz) (10.50 Hz) High Highest
- 10.3 (118) - 10.X (119) - 10.2 (114) - 10.9 (115)
-5.4 (114) -6.1 (112)
P2 Fz 0.5 (188) 1.0 (190) 2.9 (202) 0.7 (189) 0.0 (188) - 0.7 (190) cz 2.8 (188) 4.4 (188) 5.9 (202) 4.4 (190) 4.1 (187) 2.3 (1901 Pz 3.6 (188) 5.1 (192) 5.7 (201) 4.7 (192) 5.3 (192) 3.2 (189)
N2 Fz - 5.2 (237) - 5.4 (248) - 0.7 (248) -4.6 (258) -4.7 (261) - 6.2 (245) CZ - 4.2 (2373 - 3.7 (250) 1.5 <250) - 2.8 (265) -3.8 (261) - 5.2 (253) PZ - 0.5 (234) 0.2 (241) 3.7 (244) 1.7 (247) 0.3 (262) - 1.0 (241)
P3 Fz 6.8 (363) 5.1 (365) 8.0 (33% 1.0 (359) 2.1 (378) 5.6 (372) CZ 12.6 (362) 10.1 (376) 7.8 (328) 3.4 (357) 5.5 (382) 1 I .4 (377) Pz 16.8 (388) 14.1 (385) 12.0 (3341 6.7 (345) 9.7 (394) 15.5 (401)
MMNFZ
CZ
Pz
-0.8
- 1.9
-2.0
SW FZ -3.2 CZ 0.4 PZ 5.1
-0.4
-1.2
-0.6
-3.5
0.7
5.5
_
-0.4
-0.5
-0.7
-1.3
- 2.0
-1.4
-5.5 -1.8 -3.4 -3.2
-5.0 - 0.2 1.5 1.5
0.3 1.3 6.7 7.2
amplitudes of the interval measures, MMN and SW, at each electrode site, classified by stimulus type. Since most analyses produced the same results at all three electrode sites regarding the effects of the experimental manipulations on the ERP, the statistical tests that follow (except when noted otherwise) report the results for location Cz only. The outcomes of statistical tests were declared significant when the probability of the test statistic (p) was less than 0.01.
3.1. Nl, P2, N2 and P3 components
Figure 1 presents the ERP waveforms averaged across subjects at Fz, Cz and Pz for each of the four deviant tones (lowest, low, high, highest) and for the pre-deviant standard tone. It can be seen that the most prominent effect of deviation in pitch relative to the standard tone (observed for both increments and decrements in pitch) was an increase in positivity at Cz and Pz occurring approxi- mately 350-500 ms after the onset of the stimulus and identified as P3. The P3 itself was clearly seen in individual records as a positive peak, separate from an extended interval of slower, predominantly parietal positivity; however, in averag- ing over subjects, P3 and positive slow wave (PSW) overlapped under some conditions and are not always graphically distinguishable, especially at Pz. This

A. Nash et al. /Biological Psychology 31(1994) 219-234
STIMULUS TONES: Highest ---___
High - - Standard -
_.-._ . . . . . . . . . . .
225
Fig. 1. Auditory event-related potentials recorded at Fz, Cz and Pz, averaged across subjects. The waveforms are shown for the standard and for four deviant tones that differed in both direction and magnitude from the pitch of the pre-deviant standard tone WOO Hz). The probability of the standard was .80 and the probability of each of the deviants was 0.05. The arrow indicates the onset of the tone.
overlap with the PSW tends to obscure the mean peak latency of P3 as displayed in Fig. 1. Figure 2 presents the mean amplitudes for the Nl, P2, N2 and P3 components of the ERP at Cz for each of the deviant and pre-deviant standard tones.
Trend analysis of mean Nl amplitude showed a significant linear trend, F(1, 13) = 9.76, p < .Ol, as well as a significant quadratic trend, 8X1, 13) = 11.37, p < -01. These trends can be seen in Fig. 2 as a general tendency for Nl to diminish in amplitude as a Iinear function of pitch, superimposed on a quadratic function in which the Nl amplitude associated with the extreme deviants (lowest and highest tones) was slightly larger than the Nl amplitude observed for either the pre-deviant standard tone or their respective proximal deviants (low and high tones).
The mean amplitude of both the P2 and N2 components of the ERP appear in
226 A. Nash et al. /Biological Psychoiogy 37 (1994) 219-234
(-J..____ _.... ___.opj,
0 a P2
0- 1000 940 9t5 1060 10;5 1050
NITIAL LOWE= STANDARD
LOW ~~~~~~~ HIGH HIGHEST
STIMULUS TONES (Hz)
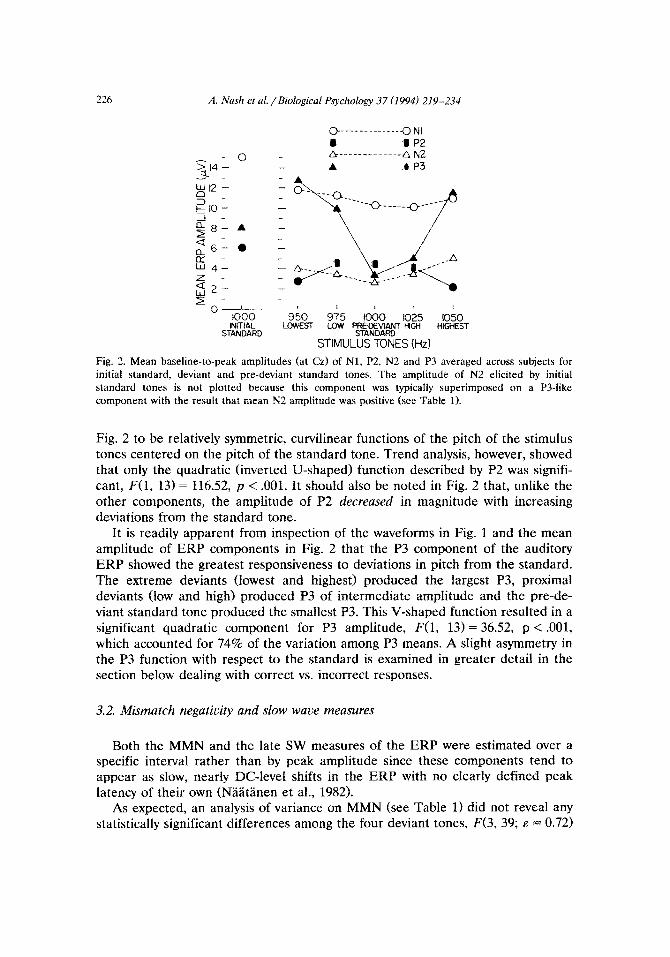
Fig. 2. Mean baseline-to-peak amplitudes (at Cz) of Nl, P2, N2 and P3 averaged across subjects for
initial standard, deviant and pre-deviant standard tones. The amplitude of N2 elicited by initial
standard tones is not plotted because this component was typically superimposed on a P34ike
component with the result that mean N2 amplitude was positive (see Table 1).
Fig. 2 to be relatively symmetric, curvilinear functions of the pitch of the stimulus tones centered on the pitch of the standard tone. Trend analysis, however, showed that only the quadratic (inverted U-shaped) function described by P2 was signifi- cant, F(1, 13) = 116.52, p < .OOl. It should also be noted in Fig. 2 that, unlike the other components, the amplitude of P2 decreu~d in magnitude with increasing deviations from the standard tone.
It is readily apparent from inspection of the waveforms in Fig. 1 and the mean amplitude of ERP components in Fig. 2 that the P3 component of the auditory ERP showed the greatest responsiveness to deviations in pitch from the standard. The extreme deviants (towest and highest) produced the largest P3, proximal deviants (low and high) produced P3 of inte~ediate amplitude and the pre-de- viant standard tone produced the smallest P3. This V-shaped function resulted in a significant quadratic component for P3 amplitude, F(1, 13) = 36.52, p < .OOl, which accounted for 74% of the variation among P3 means. A slight asymmetry in the P3 function with respect to the standard is examined in greater detail in the section below dealing with correct vs. incorrect responses.
3.2. Mismatch negativity and slow waue measures
Both the MMN and the late SW measures of the ERP were estimated over a specific interval rather than by peak amplitude since these components tend to appear as slow, nearly DC-level shifts in the ERP with no clearly defined peak latency of their own (NaLtanen et al., 1982).
As expected, an analysis of variance on MMN (see Table 1) did not reveal any statistically significant differences among the four deviant tones, F(3, 39; E = 0.72)

A. Nash et al. /Biological Psychology 37 (1994) 219-234 227
1000 INITIAL
STANDARD
950 LOWEST
975 LOW
/ I
1000 1025 PRE-DEVIANT HIGH
STANDARD
1050 HIGHEST
STIMULUS TONES (Hz)
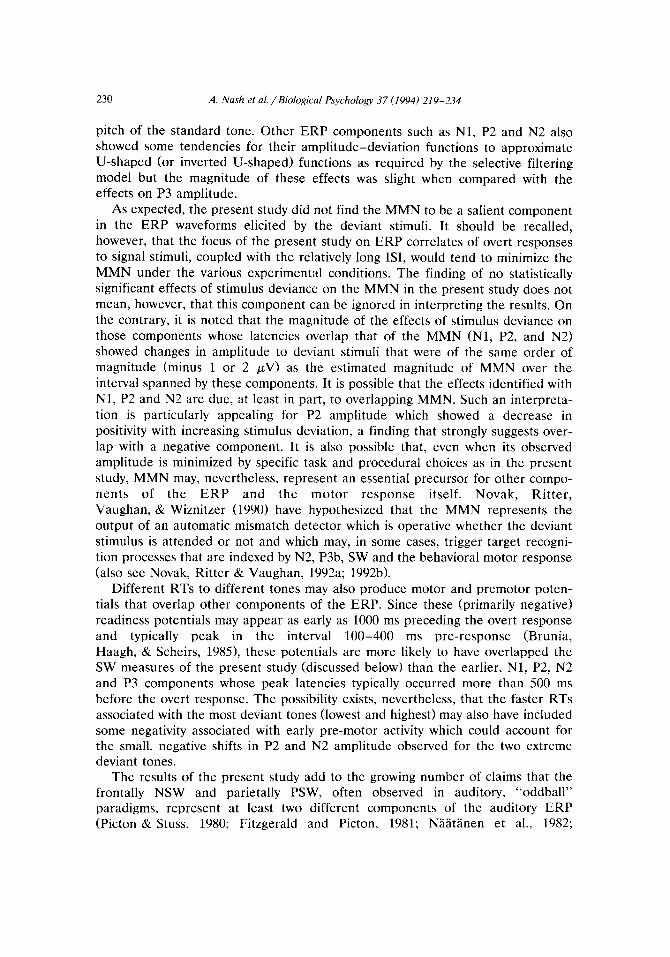
Fig. 3. Mean amplitude of SWs (at Fz, Cz and Pz) averaged across subjects for initial standard, deviant
and pre-deviant standard tones.
= 2.29, p > .lO; the three electrode locations, F(2, 26; E = 0.91) = 3.08, p > .06; nor for the interaction of deviant tones and electrode location, F(6, 78; E = 0.81) = 0.99, p > .40.
In Fig. 1 the effect of the SW activity associated with deviant tones may be seen as an interval of extended negativity at Fz with a latency of onset of approximately 500 ms and as an interval of extended positivity at Pz with a latency of onset of approximately 400 ms.
Unlike the Nl, P2, N2, and P3 components of the ERP, which showed similar effects of stimulus change at all electrode locations differing only in the relative magnitude of these effects, the SW measures of mean EEG activity over the interval from 550 to 748 ms post-stimulus depended on the specific electrode location. The interaction between stimulus tones and electrode location was significant, F(8, 104; E = 546) = 12.47, p < .Ol. It can be seen in Fig. 3 that all deviant tones showed an increase in negative slow wave (NSW) at Fz relative to the pre-deviant standard but NSW did not distinguish among the deviant tones themselves. A PSW was observed at Pz, which showed even larger differences between deviant tones and the pre-deviant standard tone than did NSW, although there was some evidence that PSW also included a pitch-specific effect, as the magnitude of PSW at Pz tended to increase with the frequency (Hz) of the tone. SW at Cz was small in amplitude but also showed pitch-specific effects, similar to the PSW noted at Pz.
The amplitude measures of Nl, P2, P3 and SW were significantly larger for initial standards than for pre-deviant standards (Figs. 2 and 3). Further, the SW

228 A. Nash et al. /Biological Psychology 37 (1994) 219-234
O----ON I D----AN2 ri3
L
o- I I
1000 950 975 lOb0 I
1025 IOk0 INITIAL LOWEST LOW PRE.DEVIANT HIGH HIGHEST
STANDARD STANDARD
STIMULUS TONES (Hz)
Fig. 4. Mean RT and peak latencies (at Cz) of Nl, P2, N2 and P3 components of the auditory
event-related potentials, averaged across subjects, for initial standard, deviant and pre-deviant standard
measures showed a negative, fronto-central response to the initial standard tone (Fig. 3), which was absent for the pre-deviant standard tone and also differed from that elicited by the deviant tones (for which NSW was of smaller amplitude and observed only at Fz). An analysis of the normalized SW measures at the three scalp locations for initial and pre-deviant stimulus tones, however, fell just short of producing a statistically significant interaction between the scalp location and the stimulus classification factors at the conservative .Ol level adopted for these analyses, F(2, 26; E = 1.0) = 5.30, .Ol <p < .02. Analysis of the normalized SW measures for the initial and deviant tones found a significant interaction between scalp location and the stimulus classification factors, F(8, 104; E = 0.62) = 4.49, p < .Ol, indicating that the topological distribution of SW for initial tones (promi- nent fronto-central response) differed from that of the deviant tones (reduced response at Fz, minimal response at Cz, prominent response at Pz).
3.3. Latencies and performance measures
The only significant trend component found for ERP latencies was a significant quadratic trend associated with N2 latency, F(1, 13) = 11.78, p < .Ol, which was due to a slight tendency for N2 latency to decrease with increasing deviation of the stimulus from the standard (Fig. 4). Also shown in Fig. 4 is mean reaction time (RT) which produced a significant quartic (“gull wing”) trend component, F(1, 13) = 10.59, p < .Ol, which was superimposed on a strong linear trend, F(1, 13) = 31.73, p < .OOl. The linear trend was due to the tendency for the discrimina- tive response to higher pitch tones to be associated with longer RTs than to lower pitch tones, regardless of their classification as standard or deviants while the gull-wing quartic component showed that RT to proximal deviants (low and high) tended to be higher than RT to extreme deviants (lowest and highest).

A. Nash et al. /Biological Psychology 37 (I 994) 219-234 229
The response error rates for identifying the tones as standard or deviant were: lowest (2%), low (7%), pre-deviant standard (6%), high (25%), and highest (5%). The relatively high rate of incorrect identifications of the high tone proved to be due to seven subjects who had difficulty in discriminating the high tone (1025 Hz) from the standard tone (1000 Hz). When mean P3 amplitude was estimated from correct (high) trials only, the value obtained (10.1 PV) was found to be nearly identical to the value obtained for the low tone (10.2 FV>, which was averaged over both correct and incorrect responses but which had a relatively low error rate (7%). The effect of pooling correct and incorrect high tone trials of the subjects in averaging the waveforms, therefore, was to reduce the estimate of symmetry (relative to the standard tone) of the mean P3 response elicited by low and high deviants as shown in Fig. 2. Although the data acquisition system did not permit the separate computation of RTs for hit and miss trials, it is likely that miss trials also produced longer RTs and may have contributed to the relatively high mean RT associated with the high deviant tones (Fig. 4).
4. Discussion
The present study was motivated by Sokolov’s (1960, 1990) proposal that the neuronal model of a repeated standard stimulus produces a selective filtering of the stimulus input, such that only departures from the model are permitted to activate response processes and that the magnitude of the activation will be proportional to the magnitude of the deviation from the standard stimulus and independent of the direction of change. It was of particular interest to determine which components of the auditory ERP, if any, would show the predicted response to bi-directional deviation from the standard tone when both standard and deviant tones required a discriminative response, thereby investing both tones with signal value and reducing, if not completely eliminating, effects that might be attributed to differential allocation of attention and/or to early processing decisions of task relevance. The results of the present study confirm earlier studies (Ford et al., 1976; Naatanen et al., 1980; Naatanen et al., 1982; Fitzgerald & Picton, 1983; Sams et al., 1985) that have reported the amplitude of P3 to be a sensitive indicator of the degree of mismatch between a frequent standard tone and infrequent tones that differ from the standard in pitch. The present study supports the view that, when both standard and deviant tones serve as signal stimuli, the amplitude of P3 elicited by a deviant stimulus conforms closely to predictions based on a neuronal model of the standard stimulus.
P3 amplitude was found to be a U-shaped function of pitch deviation, centered on the pitch of the standard tone. An asymmetry observed between the P3 responses of the proximal deviants (low and high pitch tones) was explained by the greater difficulty of discriminating the high pitch tone from the standard. When P3 amplitude was estimated from only the “hit” trials of the high deviant tone it was nearly identical to P3 amplitude elicited by the low pitch tone and the resulting P3 amplitude-deviance function showed a very high degree of symmetry around the
230 A. Nash et al. /Biological Psychology 37 (1994) 219-234
pitch of the standard tone. Other ERP components such as Nl, P2 and N2 also showed some tendencies for their amplitude-deviation functions to approximate U-shaped (or inverted U-shaped) functions as required by the selective filtering model but the magnitude of these effects was slight when compared with the effects on P3 amplitude.
As expected, the present study did not find the MMN to be a salient component in the ERP waveforms elicited by the deviant stimuli. It should be recalled, however, that the focus of the present study on ERP correlates of overt responses to signal stimuli, coupled with the relatively long ISI, would tend to minimize the MMN under the various experimental conditions. The finding of no statistically significant effects of stimulus deviance on the MMN in the present study does not mean, however, that this component can be ignored in interpreting the results. On the contrary, it is noted that the magnitude of the effects of stimulus deviance on those components whose latencies overlap that of the MMN (Nl, P2, and N2) showed changes in amplitude to deviant stimuli that were of the same order of magnitude (minus 1 or 2 pV> as the estimated magnitude of MMN over the interval spanned by these components. It is possible that the effects identified with Nl, P2 and N2 are due, at least in part, to overlapping MMN. Such an interpreta- tion is particularly appealing for P2 amplitude which showed a decrease in positivity with increasing stimulus deviation, a finding that strongly suggests over- lap with a negative component. It is also possible that, even when its observed amplitude is minimized by specific task and procedural choices as in the present study, MMN may, nevertheless, represent an essential precursor for other compo- nents of the ERP and the motor response itself. Novak, Ritter, Vaughan, & Wiznitzer (1990) have hypothesized that the MMN represents the output of an automatic mismatch detector which is operative whether the deviant stimulus is attended or not and which may, in some cases, trigger target recogni- tion processes that are indexed by N2, P3b, SW and the behavioral motor response (also see Novak, Ritter & Vaughan, 1992a; 1992b).
Different RTs to different tones may also produce motor and premotor poten- tials that overlap other components of the ERP. Since these (primarily negative) readiness potentials may appear as early as 1000 ms preceding the overt response and typically peak in the interval 100-400 ms pre-response (Brunia, Haagh, & Scheirs, 19851, these potentials are more likely to have overlapped the SW measures of the present study (discussed below) than the earlier, Nl, P2, N2 and P3 components whose peak latencies typically occurred more than 500 ms before the overt response. The possibility exists, nevertheless, that the faster RTs associated with the most deviant tones (lowest and highest) may also have included some negativity associated with early pre-motor activity which could account for the small, negative shifts in P2 and N2 amplitude observed for the two extreme deviant tones.
The results of the present study add to the growing number of claims that the frontally NSW and parietally PSW, often observed in auditory, “oddball” paradigms, represent at least two different components of the auditory ERP (Picton & Stuss, 1980; Fitzgerald and Picton, 1981; Naatlnen et al., 1982;

A. Nash et al. /Biological Psychology 37 (1994) 219-234 231
Rohrbaugh & Gaillard, 1983; Ruchkin & Sutton, 1983; Friedman, 1984; Loveless, Simpson & Naatanen, 1987). In the present study, NSW was observed exclusively at Fz in response to the deviant tones (see Fig. 3). Other investigators have interpreted the frontal NSW as an index of various processing stages, including identification of task-relevant stimuli (Fitzgerald and Picton, 1981; Naatanen et al., 1982), non-specific cortical activation associated with alerting, orienting, arousal or activation mechanisms (Jarvilehto, Hari & Sams, 1978; Rohrbaugh, Syndulko & Lindsley, 1979) the programming of action regarding possible conse- quences (Loveless, 1983), and response processing (Friedman, 1984). This slow negativity might also reflect a readiness potential associated with the motor responses to the tones, although the present study did not include electrode locations laterally distributed over the cerebral hemispheres that would have helped to clarify this possibility (Brunia et al., 1985). Our finding, however, that NSW was of similar amplitude for all deviant tones, regardless of differences in their discriminability from the standard tone as measured by percent errors and RT, favors an interpretation of the NSW elicited by deviant tones similar to that proposed by Rohrbaugh et al. (1979) which emphasizes transient, cortically non- specific changes in reactive state that are stimulus elicited and serve an alerting function that is largely independent of stimulus evaluation, subsequent processing demands, or the selection of a specific response.
The topography of the NSW associated with initial and deviant stimuli suggests that this is not the same potential for the two stimuli. The NSW elicited by the standard tones that initiated each series of trials was of greater magnitude than that elicited by deviant tones and also showed a substantial vertex component that was virtually absent in the ERP response to deviants. Jarvilehto et al. (1978) identified two types of negative sustained potentials, one of which was observed for the first stimulus of a series and was largest at Cz (a frontal electrode was not used) and a second which appeared to be related to the specific modality of the eliciting stimulus, possibly reflecting more specific processing in the primary projection areas of the sensory cortex. The results of the present study support such a distinction between NSW elicited by deviant vs. initial stimuli.
PSW was found to be a predominantly parietal response to deviant tones but was also observed, to a much lesser extent, at Cz. This component has been attributed to extended processing (Friedman, 1984) indicating the subject’s aware- ness that a stimulus change has occurred (Sams et al., 1985), and possibly reflecting a “mobilization of effort” that is inversely related to stimulus equivocation (Ruch- kin & Sutton, 1983). These views of PSW are generally supported by the present results. Most of the observed variance in PSW was, like that in NSW, attributable to the distinction between the standard and deviant stimuli without regard to differences between the deviant tones themselves. In other words, NSW and PSW may both be involved in the ERP response to deviant stimuli but the magnitude of these SWs appears unrelated to the magnitude of stimulus deviation from the standard. In contrast to the graded response of P3, the SW measures appear to reflect an all-or-none event, such as the commitment of the limited capacity central processor in Ohman’s (1979) model of the OR. A small part of the PSW variance,

232 A. Nash et al. /Biological Psychology 37 (I 994) 219-234
however, was associated with the specific pitch of the deviant tones in that higher pitch deviants produced greater PSW than lower pitch deviants. This pitch-specific effect on PSW may have been due to the higher-pitch tones (high and highest) being perceived as less deviant from the standard than lower-pitch tones (low and lowest), thereby requiring additional processing of the higher tones. Such an effect would be in accordance with the well-known psychophysical principle that subjec- tive sensory response, pitch, is a nonlinear function of the physical stimulus dimension, frequency (Hz). It would also account for the significant linear trend components observed for Nl amplitude, N2 latency, and RT as a function of stimulus frequency.
It should be noted that the NSWs and PSWs reported in this study for deviant auditory stimuli do not appear to correspond to the PSWs and NSWs reported for tasks that require different degrees of perceptual or conceptual processing of visual stimuli (Ruchkin, Johnson, Mahaffey & Sutton, 1988) since the SWs re- ported by these investigators showed a different scalp distribution-a late negativ- ity over the centro-posterior scalp and positivity over the frontopolar scalp (also see Riisler & Heil, 1991, and Rosier, Heil & Glowalla, 1993, for their interpreta- tion of the functional significance of SWs in the visual stimulus/mental arithmetic paradigm).
In summary, of those ERP components studied, P3 amplitude was shown to increase in direct proportion to the deviation in pitch from the standard and this effect held for both increases and decreases in pitch as would be expected if there is a selective perceptual filtering of stimulus input. Deviant tones also elicited late NSWs and late PSWs, possibly indicating the activation of alerting processes or subsequent cognitive evaluation, but these SWs did not distinguish between the different types of deviants.
Acknowledgements
Portions of this study were used by the second author in partial fulfilment of the M.A. degree requirements in psychology at Florida Atlantic University. The authors are indebted to Dawn Fordham and Lisa Odierna for their assistance in analyzing the data.
References
Brunia, C., Haagh, S., & Scheirs, J. (1985). Waiting to respond: electrophysiological measurements in
man during preparation for a voluntary movement. In H. Heuer (Ed.), Motor Behavior: Program- ming, control, and acquisition (pp. 35-77). Berlin: Springer.
Fitzgerald, P., & Picton, T. (1983). Event-related potentials recorded during the discrimination of
improbable stimuli. Biological Psychology, 17, 241-276. Ford, J., Roth, W., & Kopell, B. (1976). Auditory evoked potentials to unpredictable shifts in pitch.
Psychophysiology, 13, 32-39.

A. Nash et al. /Biological Psychology 37 (1994) 219-234 233
Friedman, D. (1984). P300 and slow wave: The effects of reaction time quartile. Biological Psychology, 18, 49-71.
Jarvilehto, T., Hari, R., & Sams, M. (1978). Effect of stimulus repetition on negative sustained
potentials elicited by auditory and visual stimuli in the human EEG. Biological Psychology, 7, 1-12. Kirk, R. (1982). Experimental design. Monterey: Brooks/Cole. Loveless, N. (1983). The orienting response and evoked potentials in man. In D. Siddle (Ed.), Orienting
and habituation: Perspectives in human research (pp. 71-108). New York: Wiley. Loveless, N., Simpson, M., & NLItInen, R. (1987). Frontal negative and parietal positive components of
the slow wave dissociated. Psychophysiology, 24, 340-345. McCarthy, G., & Wood, C. (1985). Scalp distributions of event-related potentials: An ambiguity associ-
ated with analysis of variance models. Electroencephalography and Clinical Nemophysiology, 62, 203-208.
Niiitanen, R. (1990). The role of attention in auditory information processing as revealed by event-re-
lated potentials and other brain measures of cognitive function. Behavioral and Brain Sciences, 13 (21, 201-287.
Naitinen, R., Hukkanen, S., & Jarvilehto, T. (1980). Magnitude of stimulus deviance and brain
potentials. In H. Kornhuber & L. Deecke (Eds.), Motivation, motor and sensory processes of the brain, progress in brain research (pp. 337-342). Amsterdam: North-Holland.
Niiiitanen, R., Simpson, M., & Loveless, N. (1982). Stimulus deviance and evoked potentials. Biological Psychology, 14, 53-98.
Naiitanen, R., & Gaillard, A. (1983). The orienting reflex and the N2 deflection of the event-related
potential. In A.W.K. Gaillard & W. Ritter (Eds.), Tutorials in EBP research: Endogenous components (pp. 119-141). Amsterdam: North-Holland.
Novak, G., Ritter, W., Vaughan, H., & Wiznitzer, M. (1990). Differentiation of negative event-related
potentials in an auditory discrimination task. Electroencephalography and Clinical Neurophysiology, 75, 255-275.
Novak, G., Ritter, W., &Vaughan, H. (1992a). Mismatch detection and the latency of temporal
judgments. Psychophysiology, 29, 398-411. Novak, G., Ritter, W., & Vaughan, H., (1992b). The chronometry of attention-modulated processing
and automatic mismatch detection. Psychophysiology, 29, 412-430. Ohman, A. (1979). The orienting response, attention and learning: An information processing perspec-
tive. In H.D. Kimmel, E.H. van Olst & J.F. Orlebeke (Eds.), The orienting reflex in humans (pp.
443-472). Hillsdale: Lawrence Erlbaum.
Picton, T., & Stuss, D. (1980). The component structure of the human event-related potentials. In H.
Kornhuber & L. Deecke (Eds.), Motiuation, motor and sensory processes of the brain, progress in brain research (pp. 17-49). Amsterdam: North-Holland.
Polich, J. (1989). Habituation of P300 from auditory stimuli. Psychobiology, 17, 19-28. Ritter, W., Simson, R., &Vaughan, H., Jr. (1988). Effects of the amount of stimulus information
processed on negative event-related potentials. Electroencephalography and Clinical Neurophysiol- ogy, 69, 244-258.
Rohrbaugh, J., & Gaillard, A. (1983). Sensory and motor aspects of the contingent negative variation. In A. Gaillard & W. Ritter (Eds.), Tutorials in event-related potential research: Endogenous compo- nents (pp. 269-310). Amsterdam: North-Holland.
Rohrbaugh, J., Syndulko, K., & Lindsley, D. (1979). Cortical slow negative waves following non-paired
stimuli: effects of modality, intensity and rate of stimulation. Electroencephalogruphy and Clinical Neurophysiology, 46, 416-427.
Rdsler, F., & Heil, M. (1991). Toward a functional categorization of slow waves: taking into account
past and future events. Psychophysiology, 28, 344-358. Rosier, F., Heil, M., & Glowalla, U. (1993). Monitoring retrieval from long-term memory by slow
event-related brain potentials. Psychophysiology, 30, 170-182. Ruchkin, D., Johnson, R., Mahaffey, D., & Sutton, S. (1988). Toward a functional categorization of slow
waves. Psychophysiology, 25, 339-354. Ruchkin, D., & Sutton, S. (1983). Positive slow wave and P300: Association and disassociation. In A.
Gaillard & W. Ritter (Eds.), Tutorials in euent-related potential research: Endogenous potentials (pp. 233-250). Amsterdam: North-Holland.

234 A. Nash et al. /Biological Psychology 37 (1994) 219-234
Sams, M., Paavilainen, P., Alho, K., & Naitanen, R. (1985). Auditory frequency discrimination and event-related potentials. Electroencephalography and Clinical Neurophysiology, 62, 437-448.
Sokolov, E. (1960). Neuronal models and the orienting reflex. In M.A.B. Brazier (Ed.), The central nercous system and behavior (pp. 187-212). Madison, NJ: Josiah Macey Jr. Foundation.
Sokolov, E. (1963). Perception and the conditioned rejlex. Oxford: Pergamon.
Sokolov, E. (1975). The neuronal mechanisms of the orienting reflex. In E. Sokolov & 0. Vinogradova
(Eds.), Neuronal mechanisms of the orienting reflex (pp. 217-295). New York: Wiley. Sokolov, E.N. (1990). The orienting response and future directions of its development. Paclocian
Journal of Biological Science, 25, 142-150.