the effects of implementing a lean six sigma tool, visual - aran
TRANSCRIPT

Provided by the author(s) and NUI Galway in accordance with publisher policies. Please cite the published
version when available.
Downloaded 2017-10-19T06:44:17Z
Some rights reserved. For more information, please see the item record link above.
TitleThe effects of implementing a Lean Six Sigma tool, VisualProcess Controls, to improve month-end activities in a financedepartment - An Empirical Case Study
Author(s) Fitzmaurice, Ian
PublicationDate 2010-08-31
PublicationInformation
Fitzmaurice, I. (2010), 'The effects of implementing a Lean SixSigma tool, Visual Process Controls, to improve month-endactivities in a finance department - An Empirical Case Study'Unpublished master's thesis, National University of IrelandGalway, Galway, Ireland
Item record http://hdl.handle.net/10379/1682

The effects of implementing a Lean Six Sigma tool, Visual Process Controls, to improve month-end activities in a finance department – An Empirical Case Study
By:
Ian Fitzmaurice
A Research Dissertation submitted in partial fulfilment for the Degree of Master of Science in Technology Management of the
National University of Ireland, Galway
College of Business, Public Policy and Law – School of Business & Economics
Submission: September 2010
Research Supervisor: Dr. Philip McGovern Department of Management
Institute of Technology Tallaght
i
Certificate of Authorship
Dissertation Submission
MSc Technology Management National University of Ireland, Galway
Student Name: Ian Fitzmaurice
E-mail: [email protected]
Date of Submission: 31 August 2010
Title of Submission: The effects of implementing a Lean Six Sigma tool, Visual Process Controls, to improve month-end activities in a finance department – An Empirical Case Study
Supervisor Name: Dr. Philip McGovern
Certification of Authorship:
I hereby certify that I am the author of this document and that any assistance I received in its
preparation is fully acknowledged and disclosed in the document. I have also cited all sources from
which I obtained data, ideas or words that are copied directly or paraphrased in the document. Sources
are properly credited according to accepted standards for professional publications. I also certify that
this paper was prepared by me for the purpose of partial fulfilment of requirements for the Degree
Programme.
Signed: _______________________________________ Date: 31 August 2010

ii
Acknowledgements
I wish to take this opportunity to thank Dr. Philip McGovern, my supervisor, for his help, guidance and
encouragement in completing this dissertation.
Also, I wish to thank the management and staff of Pfizer’s Grange Castle and Newbridge Finance
departments for giving their time and insights in the completion of this dissertation.
To my mother and father, Bill and Pauline, I am eternally grateful for your tireless guidance and
support. And Dad, thanks for doing a job that is the envy of Microsoft.
To Michael, Leah and Ciara, you might get some extra time with Daddy now that he isn’t locked away
upstairs!
Finally Marie (DQ), my best friend and wife who has supported and encouraged me through this three
year journey, I can never thank you enough for your patience and love.

iii
Table of Contents 1 Introduction......................................................................................................................................1
1.1 Research Objectives........................................................................................................... 1 1.2 Structure of Dissertation .................................................................................................... 1
1.2.1 Literature Review....................................................................................................... 1 1.2.2 Method of Research ................................................................................................... 2 1.2.3 Findings Chapter........................................................................................................ 3 1.2.4 Conclusions and Further Research............................................................................. 3
2 Literature Review.............................................................................................................................5
2.1 Introduction........................................................................................................................ 5 2.2 Lean.................................................................................................................................... 5
2.2.1 Defining Lean ............................................................................................................ 6 2.2.2 Principles of Lean ...................................................................................................... 8 2.2.3 Value .......................................................................................................................... 9 2.2.4 Waste........................................................................................................................ 10 2.2.5 Characteristics of Lean ............................................................................................ 13 2.2.6 Lean Tools/Techniques............................................................................................ 13 2.2.7 Decision Making...................................................................................................... 20
2.3 Lean Thinking.................................................................................................................. 20 2.3.1 Lean Office .............................................................................................................. 21
2.4 Lean Six Sigma................................................................................................................ 23 2.4.1 Six Sigma................................................................................................................. 23 2.4.2 Define Measure Analyse Improve Control (DMAIC) ............................................. 24 2.4.3 Benefits of Merging Lean and Six Sigma................................................................ 25
2.5 Lean Six Sigma – the Holy Grail? ................................................................................... 27 2.6 Conclusion ....................................................................................................................... 27
3 Research methodology...................................................................................................................29
3.1 Introduction...................................................................................................................... 29 3.2 Overview of Research Design ......................................................................................... 30 3.3 Problem Definition........................................................................................................... 31 3.4 Research Questions and Objectives ................................................................................. 31 3.5 Research Design............................................................................................................... 32
3.5.1 Primary and Secondary Research Data.................................................................... 33 3.5.2 Qualitative vs. Quantitative Data Collection Methods ............................................ 33 3.5.3 Data Collection Method........................................................................................... 35 3.5.4 Reasoning for Semi-Structured Interviews.............................................................. 36
3.6 Preparation for Semi-Structured Interviews .................................................................... 36 3.6.1 Sampling .................................................................................................................. 37
3.7 The Interview................................................................................................................... 38 3.7.1 Pilot Phase Interviews.............................................................................................. 38 3.7.2 The Final Interview.................................................................................................. 38
3.8 Analysis of Data............................................................................................................... 39 3.8.1 Operational Definition for ‘Effective’ rating........................................................... 39
3.9 Limitations ....................................................................................................................... 41

iv
3.9.1 Observer Bias........................................................................................................... 41 3.9.2 Ethical Considerations ............................................................................................. 42 3.9.3 Data Interpretation ................................................................................................... 42
3.10 Conclusion ....................................................................................................................... 42
4 Research Findings..........................................................................................................................44
4.1 Introduction...................................................................................................................... 44 4.2 Participant ‘A’ and summary of Visual Process Controls findings ................................. 45
4.2.1 Findings in response to questions relating to the impact of introducing Visual Process Controls....................................................................................................... 45
4.2.2 Findings in response to questions relating to the effectiveness and clarity of the month-end visual process control board .................................................................. 47
4.3 Participant ‘B’ and summary of Visual Process Controls findings ................................. 49 4.3.1 Findings in response to questions relating to the impact of introducing Visual
Process Controls....................................................................................................... 49 4.3.2 Findings in response to questions relating to the effectiveness and clarity of the
month-end visual process control board .................................................................. 50 4.4 Participant ‘C’ and summary of Visual Process Controls findings ................................. 52
4.4.1 Findings in response to questions relating to the impact of introducing Visual Process Controls....................................................................................................... 52
4.4.2 Findings in response to questions relating to the effectiveness and clarity of the month-end visual process control board .................................................................. 54
4.5 Participant ‘D’ and summary of Visual Process Controls findings ................................. 56 4.5.1 Findings in response to questions relating to the impact of introducing Visual
Process Controls....................................................................................................... 56 4.5.2 Findings in response to questions relating to the effectiveness and clarity of the
month-end visual process control board .................................................................. 57 4.6 Participant ‘E’ and summary of Visual Process Controls findings.................................. 59
4.6.1 Findings in response to questions relating to the impact of introducing Visual Process Controls....................................................................................................... 59
4.6.2 Findings in response to questions relating to the effectiveness and clarity of the month-end visual process control board .................................................................. 60
4.7 Participant ‘F’ and summary of Visual Process Controls findings.................................. 62 4.7.1 Findings in response to questions relating to the impact of introducing Visual
Process Controls....................................................................................................... 62 4.7.2 Findings in response to questions relating to the effectiveness and clarity of the
month-end visual process control board .................................................................. 63 4.8 Participant ‘G’ and summary of Visual Process Controls findings ................................. 65
4.8.1 Findings in response to questions relating to the impact of introducing Visual Process Controls....................................................................................................... 65
4.8.2 Findings in response to questions relating to the effectiveness and clarity of the month-end visual process control board .................................................................. 66
4.9 Participant ‘H’ and summary of Visual Process Controls findings ................................. 68 4.9.1 Findings in response to questions relating to the impact of introducing Visual
Process Controls....................................................................................................... 68 4.9.2 Findings in response to questions relating to the effectiveness and clarity of the
month-end visual process control board .................................................................. 69 4.10 Participant ‘I’ and summary of Visual Process Controls findings................................... 71

v
4.10.1 Findings in response to questions relating to the impact of introducing Visual Process Controls....................................................................................................... 71
4.10.2 Findings in response to questions relating to the effectiveness and clarity of the month-end visual process control board .................................................................. 72
4.11 Participant ‘J’ and summary of Visual Process Controls findings .................................. 74 4.11.1 Findings in response to questions relating to the impact of introducing Visual
Process Controls....................................................................................................... 74 4.11.2 Findings in response to questions relating to the effectiveness and clarity of the
month-end visual process control board .................................................................. 75 4.12 Participant ‘K’ and summary of Visual Process Controls findings ................................. 77
4.12.1 Findings in response to questions relating to the impact of introducing Visual Process Controls....................................................................................................... 77
4.12.2 Findings in response to questions relating to the effectiveness and clarity of the month-end visual process control board .................................................................. 78
4.13 Participant ‘L’ and summary of Visual Process Controls findings.................................. 80 4.13.1 Findings in response to questions relating to the impact of introducing Visual
Process Controls....................................................................................................... 80 4.13.2 Findings in response to questions relating to the effectiveness and clarity of the
month-end visual process control board .................................................................. 81 4.14 Conclusion ....................................................................................................................... 83
5 Conclusions and Further Research.................................................................................................84
5.1 Introduction...................................................................................................................... 84 5.2 Focus of Research............................................................................................................ 84 5.3 Assessment of Research to Objective One ...................................................................... 84 5.4 Assessment of Research to Objective Two...................................................................... 87 5.5 Candidate observations requiring further analysis........................................................... 90 5.6 Conclusions...................................................................................................................... 91 5.7 Limitations of Research ................................................................................................... 91 5.8 Further Research .............................................................................................................. 92
References.........................................................................................................................................93
Appendix A – Letter of Introduction and Consent ...........................................................................98
Appendix B – Final Interview Questionnaire .................................................................................100

vi
List of Tables
Table 1 Conceptual Mode of Lean Manufacturing…………………………………………12
Table 2 Examples of DMAIC Tools………………………………………………………..24
Table 3 Distinctions between quantitative and qualitative data…………………………….34
Table 4 Sample for semi structured interview……………………………………………...37
Table 5 Scoring used to Calculate Effective Rating………………………………………..40
Table 6 Calculations of Scoring for Effective Rating for Respondent A…………………..47
Table 7 Calculations of Scoring for Effective Rating for Respondent B…………………...51
Table 8 Calculations of Scoring for Effective Rating for Respondent C…………...………54
Table 9 Calculations of Scoring for Effective Rating for Respondent D…………………..58
Table 10 Calculations of Scoring for Effective Rating for Respondent E…………………...61
Table 11 Calculations of Scoring for Effective Rating for Respondent F…………………...64
Table 12 Calculations of Scoring for Effective Rating for Respondent G…………………..67
Table 13 Calculations of Scoring for Effective Rating for Respondent H…………………..70
Table 14 Calculations of Scoring for Effective Rating for Respondent I……………………73
Table 15 Calculations of Scoring for Effective Rating for Respondent J……………………76
Table 16 Calculations of Scoring for Effective Rating for Respondent K…………………..79
Table 17 Calculations of Scoring for Effective Rating for Respondent L…………………...82
Table 18 Effective Rating for the use of Visual Process Controls…………………………...87
Table 19 Summary of Scores for Individual Questions…………………..…….……………88

vii
List of Figures
Figure 1 The Lean Enterprise versus Traditional Mass Production……………......................7
Figure 2 The Seven Wastes of the Toyota Production System……………………………...11
Figure 3 Ishikawa’s Six-Step PDCA Cycle…………………………………………………19
Figure 4 Similarities and Differences between Six Sigma and Lean………………………..25
Figure 5 The Research Process……………………………………………………………...29
Figure 6 Interview Methods……………………………………………………...………….35

viii
Abstract
The world that companies operate in today forces them to continually seek out and strive for new
cost savings and where possible create a competitive advantage. Lean, Lean Thinking and Lean
Six Sigma has seen tools and methods applied in manufacturing environments over the years that
have proved effective.
This dissertation takes one of these tools, Visual Process Controls, and seeks to establish the
effects of implementing it so that there is an improvement to month-end activities in an accounting
environment.
Following extensive research of Lean, Lean Thinking and Lean Six Sigma literature the following
two research objectives have been identified for further investigation:
Research Objective One: To explore the impact of introducing Visual Process Controls on
Pfizer’s Grange Castle and Newbridge accounting departments’ month-end processes
Research Objective Two: To ascertain if Visual Process Controls in use in Grange Castle and
Newbridge accounting departments provide clarity of use and clarity of process, and if the month-
end visual process control board is an effective process improvement tool for an accounting
department environment.
The data collection method chosen by the author is qualitative as there is a need to take into
account the experiences and views of the analysts, accountants and management within the
accounting departments. Semi-structured interviews were carried out with respondents
appropriately spread between the various sub-functions of the accounting department to give a fair
reflection of the impact and effective use of the month-end visual process control board.
The data analysis was both qualitative and quantitative as the author found it necessary to have
defined rules for scoring in order to arrive at a conclusion – that the use of Visual Process Control
tools within an accounting environment was effective.
The researcher achieved research objective one, to explore the impact of introducing visual process
controls on the month-end processes within the accounting departments of Grange Castle and

ix
Newbridge. The research findings indicate many positive impacts across six distinct areas – the
month-end process; the finance leadership team; the finance team; team behaviours; tools, systems
or processes; and team communication.
The research for research objective two, to ascertain if Visual Process Controls in use in the
accounting departments of Grange Castle and Newbridge provide clarity of use and clarity of
process, and if the month-end visual process control board is an effective process improvement
tool for an accounting department environment, have also been achieved. From the twelve
respondents interviewed, ten or 83% have deemed the use of the month-end visual process control
board to be an effective tool for this environment, based on the defined scoring criteria.
x
Glossary
APICS The Association for Operations Management
DMAIC Define, Measure, Analyse, Improve, Control
SMED Small Medium Exchange of Dies
SOX Sarbanes Oxley Act
SUR Setup Reduction
Takt The longest period which can be spent manufacturing each unit while still meeting a
set level of demand. Derived from the German word taktzeit which translates to
cycle time
TPM Total Productive Maintenance
TPS Toyota Production System

1
1 Introduction
1.1 Research Objectives
This dissertation seeks to establish the effects of implementing a Lean Six Sigma tool, Visual
Process Controls, to improve month-end activities in a finance department.
Following extensive research of the literature the following two research objectives have been
identified for further investigation:
Research Objective One: To explore the impact of introducing visual process controls on Grange
Castle and Newbridge accounting departments’ month-end processes
Research Objective Two: To ascertain if visual process controls that are in use in Grange Castle
and Newbridge accounting departments provide clarity of use and clarity of process, and if the
month-end visual process control board is an effective process improvement tool for an accounting
department environment.
1.2 Structure of Dissertation
1.2.1 Literature Review Chapter two will examine the body of knowledge of Lean Six Sigma methodology under the
following main headings:
• Lean
• Lean Thinking
• Lean Six Sigma
It will consider and search the available body of knowledge pertaining to Lean, Lean Thinking and
Lean Six Sigma tools and methods and will detail how these tools and methods are applied.
From the literature review there is clear knowledge and research into the use of Lean Six Sigma
tools and methods in a manufacturing environment, but very little research as to their specific use,

2
success and applicability within non-manufacturing areas such as administrative and accounting
environments.
According to Dinero (2005) Lean Thinking has evolved from Lean philosophy as applied to
manufacturing organisations. Lean Thinking is the change in focus of the improvement process
from manufacturing areas to the whole organisation.
Therefore, the focus of this dissertation was to look at the effects of using one of these Lean Six
Sigma tools, Visual Process Controls, in an accounting environment. The focus for the researcher
will be to find out if this is an effective process improvement tool in this specific environment – an
accounting department.
1.2.2 Method of Research The objectives of chapter three, the research methodology chapter, is to provide an account of how
the research process was developed and to set out the research design that has been developed to
achieve the research objectives of this dissertation. According to Yin (2008) research design is a
logical plan for getting from beginning to end, where the beginning can be defined as the initial set
of questions to be answered, and the end is some set of conclusions (answers) about these
questions.
The study will be exploratory in nature, Robson (2002) explaining that exploratory research is to
find out what is happening, identify new insights, inquire into and assess phenomena in different
circumstances. The data collection method chosen by the author is qualitative. The justification for
this is the need to take into account the experiences and views of the analysts, accountants and
management within the accounting departments on using visual process controls as a process
improvement tool. Qualitative research was chosen over quantitative as it is a better method in
making sense of statements and opinions that are collected from the interviewees. Silverman (2006)
makes the point that qualitative research’s main strength is its ability to study phenomena which
are not available elsewhere, particularly areas of social reality which statistics cannot measure.
3
The data analysis was both qualitative and quantitative as the author found it necessary to have
defined rules for scoring in order to arrive at a conclusion – that the use of Visual Process Control
tools within an accounting environment was effective.
1.2.3 Findings Chapter The objective of the research findings chapter, chapter four, was to interview respondents who
were selected based on purposive sampling. This allowed the author to select interviewees who
were able to answer the research questions and allow the study to meet its research objectives. The
respondents were chosen from the accounting departments of Pfizer’s Grange Castle and
Newbridge sites.
The interviews were semi-structured in nature, the strength of this method allowing the interviewer
to enquire for further detail or ask an additional question depending on the responses of each
candidate. The respondents were appropriately spread between the various sub-functions of the
accounting department to give a fair reflection of the impact and effective use of the month-end
visual process control board.
1.2.4 Conclusions and Further Research The objective of this chapter (five) was to compare, contrast and arrive at conclusions based on the
findings of the primary research that has been undertaken in chapter four.
The researcher achieved Research Objective One, to explore the impact of introducing visual
process controls on the month-end processes within the accounting departments of Grange Castle
and Newbridge. The research findings indicate many positive impacts across six distinct areas –
the month-end process; the finance leadership team; the finance team; team behaviours; tools,
systems or processes; and team communication.
The research for Research Objective Two was also achieved: i.e. to ascertain if visual process
controls in use in the accounting departments of Grange Castle and Newbridge provide clarity of
use and clarity of process, and if the month-end visual process control board is an effective process
improvement tool for an accounting department environment. From the twelve respondents

4
interviewed, ten or 83% have deemed the use of the month-end visual process control board to be
effective based on the defined scoring criteria. However, there were two areas that are achieving
below average results when compared to the other findings. These are the status of each activity,
and the overall experience of the introduction of Visual Process Controls.
The author has detailed and reviewed the negative impacts that were perceived by the respondents,
but concluded that these are a failing of an effective all encompassing framework to support the
tool in helping to continually improve and control the process that is clearly adding value based on
the respondents’ answers in this study.

5
2 Literature Review
2.1 Introduction
The literature review will examine the body of knowledge of Lean Six Sigma methodology under
the following main headings:
• Lean
• Lean Thinking
• Lean Six Sigma
The literature review will consider and search the available body of knowledge pertaining to Lean,
Lean Thinking and Lean Six Sigma tools and methods. It will detail how these tools and methods
are applied in manufacturing and non-manufacturing environments.
Tischler (2006) found that the application of Lean principles in the office can result in real, visible
and quantifiable savings for service departments and the organisation as a whole.
2.2 Lean
Liker (1997) refers to mass production and lean production as a way of thinking about how
production should occur within a specific factory, more specifically how solutions are arrived at on
how people, equipment, material and funds are organised to build products that people will pay a
price for. Mass production, which originated from the Ford production system, reflected the
culture of that time. Similarly, a new method evolved from post World War II Japanese
manufacturing industry which sought to find further efficiencies on an effective mass operation.
This resulted in a new solution to the manufacturing question, the Lean Solution.
Lean evolved from the Toyota Production System, the development of which has been accredited
to Sakichi Toyoda, who founded the Toyoda Group in 1902, Kiichiro Toyoda who headed the
automobile manufacturing operation between 1936 and 1950, Eiji Toyoda, Managing Director
between 1950 and 1981 and Chairman between 1981 and 1994, and Taiichi Ohno, the Father of
the Kanban System (Becker, 2009).

6
2.2.1 Defining Lean
All we are doing with the Lean philosophy according to Ohno (1988) is looking at the time line
from the moment the customer gives a purchase order to the point when the cash is collected, this
time line is reduced by removing the non-value-added wastes. Lean is the elimination of waste
from all aspects of the operations system and process, it was originally devised to remove wastes
and add value to key business metrics – lead time and inventory.
This thinking is supported by Krafcik (1988) who refers to traditional production systems as
buffered manufacturing which has large volumes of inventories and work in progress, long
machine downtime for maintenance and large lot sizes. Lean production is in contrast to this with
low inventory levels, methods that quickly highlight quality issues, flexible work arrangements,
and small maintenance areas and lot sizes.
Womack et al (1990) support this definition of Lean when they describe lean production as Lean
because it uses less of everything when compared to a traditional mass production environment. It
uses half of: – the human effort in the factory; manufacturing space; investment in tools and new
product development. It requires keeping less inventory on site and results in less defects and
produces a greater variety of products.
Graban and Michael (2008) state that providing a definition of Lean that is both concise and
comprehensive is a complex issue. Within the industry of medical care they described Lean as a set
of principles, methods and tools that will improve patient care by creating an environment that
allows management to fully engage employees in a continuous improvement process to find
perfection, allows work methods to be precisely defined without stifling creativity. This results in
quality and cost improvements without employees being asked to work harder. A comparison of
lean and mass production approaches is shown in Figure 1 – The Lean Enterprise versus
Traditional Mass Production.
It should be noted that Lean is not a magic wand or silver bullet that will transform processes or
companies (Graban and Michael, 2008).

7
The Lean Enterprise versus Traditional Mass Production
Mass Production Lean Enterprise
Primary
business
A product-centric strategy. Focus is on
exploiting economies of scale of stable
product designs and non-unique
technologies
A customer-focused strategy.
Focus is on identifying and
exploiting shifts in competitive
advantage.
Organisational
structure
Hierarchical structures along functional
lines. Encourages functional alignments
and following orders. Inhibits the flow of
vital information that highlights defects,
operator errors, equipment abnormalities,
and organisational deficiencies.
Flat, flexible structures along lines
of value creation. Encourages
individual initiative and the flow
of information highlighting
defects, operator errors,
equipment abnormalities, and
organisational deficiencies.
Operational
framework
Application of tools along divisions of
labour, Following of orders, and few
problem solving skills.
Application of tools that assume
standardized work. Strength in
problem identification, hypothesis
generation, and experimentation.
Figure 1
Source: Sayer & Williams, 2007.

8
2.2.2 Principles of Lean
The principles of Lean detail the method that should be used to implement Lean. Womack and
Jones (1996) first documented their Five Steps, which was later expanded by Liker (2004).
2.2.2.1 Five Steps
The principles of Lean as documented by Maskell and Baggaley (2003) which were derived from
Womack and Jones (1996) are:
1. Value: Lean starts with a precise definition of what constitutes value from the customer
point of view in terms of the product features and characteristics that are valued by
the customer
2. Value Stream: The sequence of processes through which a product is transformed from
raw material to delivery at the customer’s site
3. Flow and pull: The production process is designed to maximise the flow of product
through the value stream, initiated by the pull of customer demand
4. Perfection: Defined as 100 percent quality flowing in unbroken flow at the pull of the
customer
5. Empowerment: The system of measurements and controls that provides each employee
with the information and authority to take the necessary action at the time
it is required
2.2.2.2 Principles of the Toyota Way
Liker (2004) expanded on Womack and Jones (1996) principles, which are:
1. Base your management decisions on a long term philosophy, even at the expense of short
term financial goals.
2. Create continuous process flow to bring problems to the surface
3. Use “pull” systems to avoid overproduction
4. Level out the workload (work like the tortoise, not the hare)
5. Build a culture of stopping to fix problems, to get quality right the first time
6. Standardised tasks are the foundation for continuous improvement and employee
empowerment

9
7. Use visual control so that no problems are hidden
8. Use only reliable, thoroughly tested technology that serves your people and processes
9. Grow leaders who thoroughly understand the work, live the philosophy, and teach it to
others
10. Develop exceptional people and teams who follow your company philosophy
11. Respect your extended network of partners and suppliers by challenging them and helping
them improve
12. Go and see for yourself to thoroughly understand the situation
13. Make decisions slowly by consensus, thoroughly considering all options; implement
decisions rapidly
14. Become a learning organisation through relentless reflection and continuous improvement
According to Liker (2004) an organisation is on its way to sustainable competitive advantage when
they follow the Toyota Production System (TPS) by implementing and practicing the above set of
Toyota Way principles. To fully appreciate this philosophy, value and waste needs to be
understood from a Lean perspective.
2.2.3 Value
Value is the price that a customer is willing to pay for goods, services or information which is
produced or provided by the manufacturer, producer or service provider. Womack and Jones (2003)
state that it is only possible for the final customer or consumer to define this value. Therefore, it is
only meaningful when defined value is expressed in terms of specific product, goods, services or
both, which meet what the customer requires at a specific price and time.
Murman (2002) describes value as either worth, utility, benefit or reward that is derived, by a
stakeholder, from some organisational action. Murman (2002) states that while it is easy to identify
stakeholders, it is very difficult to understand what provides value to stakeholders. This is because
they do not see value through the eyes of a consumer in terms of the product, service or
improvement provided. Stakeholders only see value that is hidden in the value stream, as in the
case of stakeholders in the finance, human resources or information systems functions of a
business, who never get near the physical product, but add benefit along the way. In Lean, if it is
not adding value, it is waste.

10
2.2.4 Waste
Muda, is a Japanese word for waste. Womack and Jones (2003) refer to waste as human activities
which absorb resources but do not create value. There are many examples of this such as:
• Mistakes which require rectification or rework
• Make to stock orders which produces items no one wants so that inventories and work
in-progress goods pile up
• Processing activities which are not required
• The movement of employees and transport of goods from one place to another without
any purpose
• Groups of people in a downstream activity standing around waiting because an
upstream activity has not delivered on time
• Goods and services which don’t meet the needs of the customer.
2.2.4.1 Categorisation of Waste
According to Taylor and Brunt (2001) Taiichi Ohno identified seven areas of waste in the Toyota
Production System. Figure 2 documents the different categories of waste and details the nature of
each waste:

11
The Seven Wastes of the Toyota Production System Waste Category Nature of Waste
1. Overproduction Smooth flow of goods and piles of work in progress
Target and achievement is unclear
Excessive lead-time and storage times
2. Waiting Operators waiting
Operators slower than line
Operators watching equipment and operation
3. Transportation Stacking and un-stacking of components
Conveyors and Widely spaced equipment
Many busy forklifts
4. Inappropriate
processing
Variation between operators’ methods
Variation between standard and actual operation
Processes that are not statistically capable
5. Inventory Prescribed storage volume exceeded
Deteriorating material with old dates
Sophisticated stores system
6. Motion Components and controls outside easy reach
Layout not standardised causing double handling
Widely spaced equipment and operators bending
7. Defects Poor material yield
Large rework area and work in scrap bin
Difficult assembly with high inspection levels
Irregularity of work with high customer complaints Figure 2 Source: Taylor and Brunt 2001, pp.80-81.

12
Kaufman Group (2000) developed a conceptual model of Lean Manufacturing, which is illustrated
in Table 1 – Conceptual Mode of Lean Manufacturing. The seven wastes identified by Taiichi
Ohno in the Toyota Production System are categorised by the sources of waste – People; Quantity
and Quality. The model also details what waste reduction approach can be used for source of waste,
the most appropriate tools and the desired results in each case.
Conceptual Mode of Lean Manufacturing
Category
of Waste Type of Waste
Waste Reduction
approach Tools Desired Results
People Processing
Motion
Waiting
Workplace
Management
Standardisation
Workplace
organisation (5S)
Kaizen
Highly efficient
Safe work areas
with high
output
Quantity Inventory
Making too
much
Moving
things
Just In Time Kanban
Levelling
Quick set up
(SMED)
TPM
What you need
When you need
it
Quality Defects Built in
Quality
Error Proofing Good Quality
Table 1 Source: Kaufman Group, 2000.

13
2.2.5 Characteristics of Lean
According to Maskell and Baggaley (2003) Lean Enterprise Thinking includes the following
characteristics:
• Widespread use of Lean methods throughout every aspect of the business
• Deeply ingrained Lean culture supporting the lean tools and those who use them
• Understanding of the wider value streams leading to close partnership relationships with
customers, suppliers and other business partners
• Passion for perfection leading to a seemingly self-critical approach to ongoing continuous
improvement
2.2.6 Lean Tools/Techniques
The lean tools can be used by organisations to help identify and remove non-value adding
activities or muda. These tools can be used individually or collectively, depending on the specifics
of the process or issue that is the focus of the specific project. The tools and techniques that have
been developed are:
2.2.6.1 Just in Time (JIT)
According to Ohno (1988) Just in Time can be described as getting the required parts and quantity
of those parts at the required assembly area when they are needed, this will ultimately allow
organisations who establish these processes to approach zero inventory levels.
2.2.6.2 Autonomous Control (Jidoka)
Smith and Hawkins (2004) state that Jidoka means autonomous control, also known as
autonomation. Jidoka is achieved when ideas are generated that will stop the manufacture of a
product or service that does not conform to specification. Kubiak and Benbow (2009) report that
the use of intelligent features on machines which can be used as control mechanisms to start, stop,
change and even signal when specific parameters are reached is indicated.
Black and Hunter (2003) state that autonomous control allows workers in lean factories to inspect
their own work and the work of their colleagues, so that the quality and quantity of the work is

14
controlled at source. Liker (2004) concurs with this thinking saying that Jidoka keeps control of
quality as a defect is never let pass to the next station which frees people from their machines,
which Liker (2004) refers to as automation with a human touch.
2.2.6.3 Visual Control
According to Liker (1997) visual controls can provide employees and managers with simple but
effective ways of understanding current working conditions, which allow for corrective actions to
be taken. Womack and Jones (2003) also support this thinking, while referring to it as transparency,
specifically to highlight the need for everyone to view all the activities that occur along a value
stream which flows throughout departments and organisations. Hirano (1994) also states that
visual control highlights if a situation is adding value or waste. George (2003) is also supportive,
but refers to it as visual management.
Perhaps the simplest way to understand the importance of visual controls is the analogy provided
by Mann (2005, p.37) – “if takt time is the heart of lean production, visual controls and the process
surrounding them represent the nervous system”.
Visual process controls involve using various displays, such as posters and charts, or visual
markers, such as flags and floor markings, which are conspicuously displayed for work team or
department so that everyone is aligned. Visual process controls have many beneficial qualities as
they establish and communicate what the work priorities are; display what the target is and if the
targets have been met; the process is displayed which shows all dependent relationships and any
process bottleneck processes and milestones; the process issues can be flagged, and quickly
addressed with an understanding of the knock-on effect; show details of the standardised work
methods; feedback to and from management can be detailed and it eliminates the need for
meetings (George et al, 2005).
15
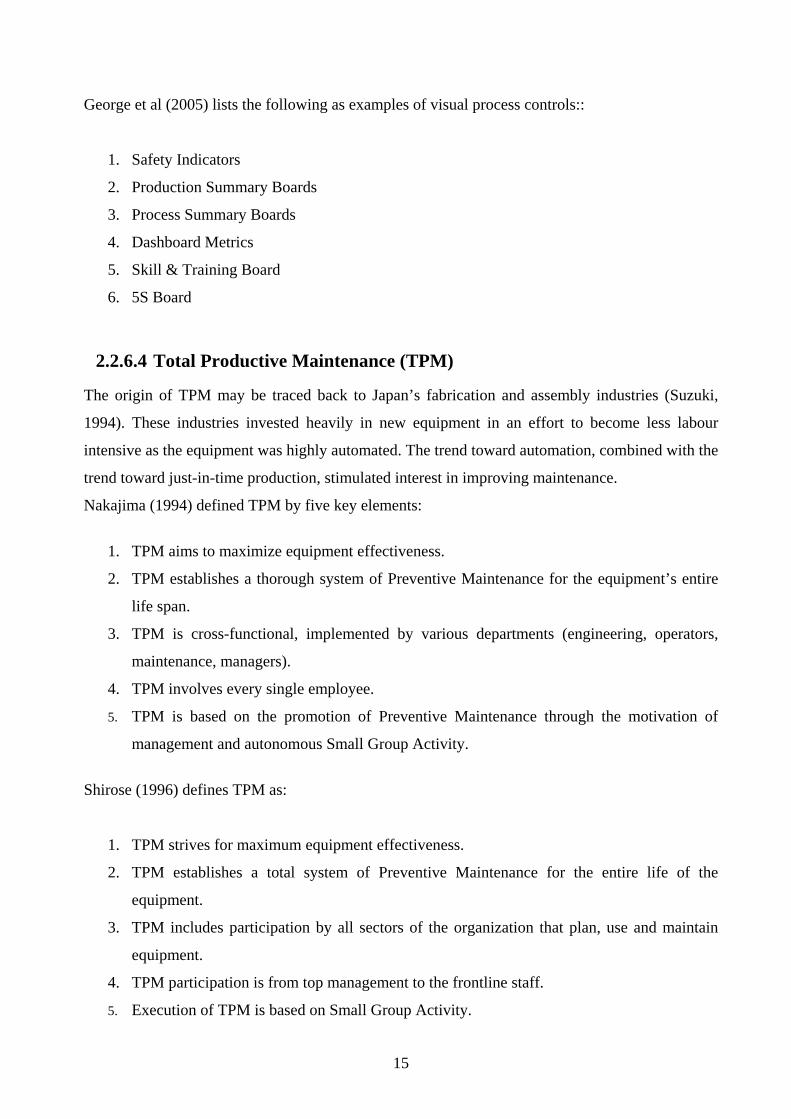
George et al (2005) lists the following as examples of visual process controls::
1. Safety Indicators
2. Production Summary Boards
3. Process Summary Boards
4. Dashboard Metrics
5. Skill & Training Board
6. 5S Board
2.2.6.4 Total Productive Maintenance (TPM)
The origin of TPM may be traced back to Japan’s fabrication and assembly industries (Suzuki,
1994). These industries invested heavily in new equipment in an effort to become less labour
intensive as the equipment was highly automated. The trend toward automation, combined with the
trend toward just-in-time production, stimulated interest in improving maintenance.
Nakajima (1994) defined TPM by five key elements:
1. TPM aims to maximize equipment effectiveness.
2. TPM establishes a thorough system of Preventive Maintenance for the equipment’s entire
life span.
3. TPM is cross-functional, implemented by various departments (engineering, operators,
maintenance, managers).
4. TPM involves every single employee.
5. TPM is based on the promotion of Preventive Maintenance through the motivation of
management and autonomous Small Group Activity.
Shirose (1996) defines TPM as:
1. TPM strives for maximum equipment effectiveness.
2. TPM establishes a total system of Preventive Maintenance for the entire life of the
equipment.
3. TPM includes participation by all sectors of the organization that plan, use and maintain
equipment.
4. TPM participation is from top management to the frontline staff.
5. Execution of TPM is based on Small Group Activity.

16
2.2.6.5 Single Minute Exchange of Dies (SMED)
SMED was developed by Shigeo Shingo over a nineteen year period (Shingo & Dillon, 1985). The
development resulted from the examination of the theoretical and practical aspects of setup
improvement. Shingo identified that analysis and implementation are fundamental to the SMED
system and must be part of any improvement program.
According to Christensen et al (2007) the goal of SMED is to provide an efficient, but rapid, way
of converting a manufacturing process from running the current product to running the next
product. Christensen (2007) also refers to SMED as Setup Reduction (SUR). SUR involves quick
changeover or rapid exchange to tooling and dies, the time taken for each changeover should be
less than ten minutes.
There are a number of steps to reducing setup time using the SMED method as outlined by Shingo
& Dillon (1985):
1. Separate the internal and external activities. Internal activities are those that can only be
performed while the process is stopped. The external activities can be done while the
machine/process is in operation
2. Convert internal activities to external activities, where possible
3. Streamline the remaining internal activities
4. Streamline the external activities so that they are of similar scale to the internal activities
5. Document the new procedure
6. Repeat the above steps
2.2.6.6 Leveling
Liker (2004) asserts that focusing on waste is the most common approach to implementing lean
tools, because it is easy to identify and eliminate it. But what many companies fail to do is the
most difficult process of stabilising the system and creating evenness – a true balanced lean flow
of work. Leveling is also referred to as Heijunka, this is the leveling of production by both volume
and mix (Liker, 2004).

17
The benefits when the schedule is heijunka are:
1. Flexibility to make what the customer wants when they want it
2. Reduced risk of unsold goods
3. Balanced use of labour and machines (resources)
4. Smoothed demand on upstream processes and suppliers to the process
2.2.6.7 Kanban
Kanban means visual control. Ohno (1988) describes Kanban systems as a means of controlling
inventory and production scheduling in just in time environments. The kanban system uses cards
or signals to govern the flow of materials through the manufacturing facility. While traditional
push systems continue to pile up inventory when there is a downstream problem, Kanban systems
automatically stop the flow and thus focus attention at the source of the problem. Ohno (1998)
states that there are two pillars of the Toyota production system – just-in-time and automation with
a human touch, or as Ohno refers to “autonomation”. The tool used to operate this system is
Kanban.
Six rules have been devised by Irwin (1997) to keep Kanban effective:
1. Do not send defective product to the subsequent process
2. The customer (subsequent process) withdraws only what is needed
3. Produce only the exact quantity withdrawn by the customer (subsequent process)
4. Level production
5. Kanban as a means of fine tuning
6. Stabilise and rationalise the process
2.2.6.8 Kaizen
Kai means to “take apart” and zen means to “make good”. Kaizen is used as a method to accelerate
the pace of a process improvement, by focusing on a continuous stream of small incremental
improvements (Imai, 1986). For Brunet and New (2003) Kaizen epitomises the mobilisation of an
organisation’s workforce by providing a mechanism for employees to positively develop their
organisation which has three key concepts:

18
1. It is continuous as it is embedded within the organisation on a never ending journey
striving for improved quality and efficiency;
2. Incremental in nature; and
3. Participative in nature as it involves the intelligence of the entire workforce
Imai (1986) further expanded Kaizen into an umbrella concept for a large number of business
practices which exist within the Kaizen toolkit which include but are not limited to: Customer
orientation, Total Quality Control, QC circles, Suggestion system, Kanban, Zero defects, Small
group activities and productivity improvements.
2.2.6.9 Workplace Organisation (5S)
The Five S method was developed by Takashi Osada (1991). Osada (1991) defined 5S as method
to organise the workplace, to keep it neat and clean, to maintain standards and to sustain the
discipline that is needed to do a good job. 5S are the initials of five Japanese words seiri, seiton,
seiso, seiketsu, and shitsuke. In English they mean sort, set in order, shine, standardise and sustain.
Osada (1991) acknowledges that the 5S discipline while easy to understand is difficult to
implement.
Sort (seiri) focuses on eliminating any unnecessary items from the work place; this can be
facilitated by Red Tagging (Dennis & Shook, 2007) which involves attaching red tags to items
during the sort phase that need to be removed. Set (seiton) in order is about organising the tools
and equipment that are left so that everything has a place and there is a place for everything. Shine
(seiso) involves cleaning and tiding dirt that is now visible as a result of the sort and set phases
including cleaning tools, equipment and work areas. Standardise (seiketsu) is about setting
standards for the first three steps, what is needed and not needed, what should be left and what
needs to be cleaned and when. Sustain (shitsuke) involves getting the 5S process embedded into
the normal day to day activity of this business. The methods to achieve this are promotion,
communication and training.

19
2.2.6.10 Standardisation
Standardisation was first introduced through Taylor’s (Taylor, 1923) scientific factory
management approaches in the early 1900’s. Taylor’s (AUA, 2004) objective was to standardise
work units and make them interchangeable, he continuously searched for the best way to do tasks
in the shortest time possible by removing decision making from employees and embedding a top-
down rigid hierarchical command structure. Deming (1995) created the improvement process Plan-
Do-Check-Act, a four step model. It is a control mechanism used to supervise, govern, regulate or
restrain a system. Lewis (1998) explains that Deming’s improvement process defines the objective
of a process, develops a plan to meet the objective, executes the plan and the results are reviewed
to see if they are as expected. If the results are different to what was expected the plan is modified
to fulfil those objectives. This approach allows waste to be continuously identified and removed.
Ishikawa (1985) further expanded Deming’s (1995) four step model into six steps, which are:
1. Determine goals and targets
2. Determine methods of reaching goals
3. Engage in education and training
4. Implement work
5. Check the effects of implementation
6. Take appropriate action
Ishikawa’s Six Step PDCA Cycle
Figure 3
Source: Ishikawa, 1985.

20
2.2.7 Decision Making
The previous section has provided an overview of the tools and techniques that exist within the
Lean toolbox, but how are they applied to assist with decision making within the work
environment? One of the methods used, that was developed at Toyota as part of their fourteen
principles (Liker, 2004), is nemawashi. Nemawashi translates “to prepare a tree for planting”.
When nemawashi is used decisions are made slowly via a group consensus, considering all options,
but once a decision is made implementation is rapid, but cautious. According to Liker (2004) the
process of nemawashi involves discussing problems and potential solutions with all those effected.
The process, while time consuming, results in a broader search for solutions.
The main purpose of nemawshi is to get the maximum benefit from the human assets within the
organsiation (Jackson & Tomioka, 2004). Kogut (1993) characterises this form of decision making
as decentralised and bottom-up consenses seeking, which has proved to be very effective in
domestic Japanese organisations.
2.3 Lean Thinking
According to Dinero (2005) Lean thinking, has evolved from Lean philosophy as applied to
manufacturing organisations. Lean thinking is the change in focus of the improvement process
from manufacturing areas to the whole organisation. Womack and Jones (1996) refer to this as the
Lean Enterprise, and detailed five steps for Lean business logic which are the output of their
research of fifty companies around the world in a variety of industries.
The five steps are:
1. Define value precisely from the perspective of the end customer in terms of a specific
product with specific capabilities offered at a specific price and time.
2. Identify the entire value stream for each product or product family and eliminate waste
3. Make the remaining value-creating steps flow
4. Design and provide what the customer wants only when the customer wants it
5. Pursue perfection

21
Murman (2002) refers to Lean thinking as an enterprise wide process that strives to remove waste
with the goal of creating value through a dynamic and knowledge-driven process which is heavily
customer focused. A common thread is visible through Murman’s definition and the five steps of
Womack and Jones (1996), that is customer focused, eliminates waste and creates value. Lean
thinking was utilized by Toyota after the failure of their highly automated Tahara plant. They
returned to much lower levels of automation in final assembly and a reorganization of the
assembly line so that related activities – for example the electrical system - are installed and tested
in one focused area. This shows that the use of cross functional co-located teams improve the
process (Womack & Jones, 2003).
2.3.1 Lean Office
Lean office (Tapping, 2002) evolved from Lean manufacturing processes. Lean office utilises the
same techniques and tools that have been designed for Lean Manufacturing. Tischler’s (2006)
found that with the application of lean principles in the office can result in real, visible and
quantifiable savings for service departments and the organisation as a whole. According to
Tischler (2006) Lean is a better methodology because:
• Fewer initial tools must be learned by each participant in the improvement process
• The improvement process can be accomplished very quickly
• The results can be more powerful that any single traditional quality improvement effort
• The value stream is a richer concept than the process, as built into the value stream is a
focus on customer value and the idea of a stream or flow of activities
The output of Tischler’s (2006) lean office project saw real benefits realised. These included the
time from the beginning of the process to the end being reduced from two or three weeks to less
than one day, and the admissions directorate, a highly paid faculty were no longer involved. This
allowed faculty to focus on teaching and research rather than making phone calls, thus improving
the university’s quality of education and image. Most inquirers received a call within hours or
minutes of sending their inquiry and the campus mail system was less burdened which also
resulted in $500 worth of paper saved annually.
There are many positive effects of applying Lean principles in an office environment; these
positive effects include changing the manner in which work is done. For example, financial month

22
end occurs every month. Why is there a rush in every company at this time to get things done,
activities left unchecked until after ‘the books have closed’ – Why? Take batch processing, that is,
business processes that are carried out just once a month. Why not carry them out once a week, or
multiple times a week, or even every day? The third step in Womack and Jones (1996) five steps to
Lean Enterprise – Make the remaining value-creating steps flow means that performing a task or
activity once a month is not adhering to the third step that the process should flow.
Also, an effect of working in a batch mode results in work building up across the month; this
means that there are large amounts of wait time, and large amounts of work in progress. If the
activities are done more frequently, or the work is levelled across the month wait time and work in
progress reduce, and information quality improves.
According to Locher (2007) impressive improvement is realised when there is a successful
implementation of Lean processes within the business, these improvements can see a 90%
reduction in lead time and up to a 40% decrease in process time.

23
2.4 Lean Six Sigma
Lean Six Sigma is an evolution of the methods employed by Lean and Six Sigma; it can also be
referred to as Six Sigma Lean (Byrne et al, 2007). They assert that Lean Six Sigma improvements
are not just about doing things better, but about doing better things. It is not just about getting data
right the first time, being accurate and having a streamlined process, it is also about asking the
right questions, ‘should we do this?’, ‘is this necessary?’, ‘what does the customer want?’ and
‘how does the customer want it?
Jing (2009) states that Lean and Six Sigma convey a wide scope of meaning as they are used
differently depending on the context, such as initiates, programmes, processes, systems, methods,
tools or simply activity. According to Rampersad and El-Homsi (2007) the Six Sigma
methodology is a structured around understanding the customer needs, while identifying key
processes linked to the customer needs. Statistical and quality tools are used to reduce variations in
the key process which can sustain the process over time. Improvement projects utilising Six Sigma
methodologies follow the Define, Measure, Analyse, Improve and Control improvement process,
or DMAIC (Rampersad and El-Homsi, 2007).
2.4.1 Six Sigma As has been extensively documented by the previous literature, Lean (Ohno, 1988) is an
improvement approach primarily focused on reducing waste and improving efficiency. According
to Jing (2009) Six Sigma is an improvement methodology that is primarily aimed at improving
process capability by reducing variation, variation is reduced by being consistent.
Magnusson et al (2003) define Six Sigma as a business process that allows them to monitor
everyday business activities and design ways that minimise waste and number of resources which
will improve their profitability, and all while increasing customer satisfaction.
Antony (2006) discussing Six Sigma with reference to service processes is of the opinion that the
term sigma is a measure indicating the deviation in the performance characteristic of a service
from its mean performance. Therefore, the basic goal of a Six Sigma strategy is to reduce variation
within the tolerance or specification limits of a service performance characteristic.

24
2.4.2 Define Measure Analyse Improve Control (DMAIC) The methodology used to improve an existing process in Six Sigma is the DMAIC process, which
is divided into five stages:
Stage Process
Define Which process or product that needs improvement
The most suitable team members to work wit the improvement
The customers of the process, their needs and requirements, and create an as-is map
of the process that should be improved
Measure Identify the key factors that have the most influence on the process, and decide
upon how to measure them
Analyse The factors that need improvement
Improve Design and implement the most effective solution. Cost-benefit analyses should be
used to identify the best solution
Control Verify if the implementation was successful and ensure that the improvement
sustains over time
There are many tools that are used during each phase of the DMAIC process; some have been
documented in Table 2 – Examples of DMAIC tools.
Examples of DMAIC Tools
Define Measure Analyse Improve Control
Project Selection
Tools
Operational
Definitions
Pareto Charts Brainstorming Control Charts
PIP Management
Process
Data Collection
Plan
C&E Matrix Benchmarking Standard Operating
Procedures
Value Stream
Map
Pareto Chart Fishbone
diagrams
Total Preventive
Maintenance
Mistake Proofing
Financial
Analysis
Histogram Brainstorming 5S Plan-Do-Check-Act
Cycle
Project Charter Box Plot Detailed As-Is
process maps
Kaizen Implementation
Plan
Table 2
Adapted from George, 2003.

25
2.4.3 Benefits of Merging Lean and Six Sigma
Together Lean and Six Sigma combine their independent approaches to form a Lean Six Sigma
approach that seeks to improve efficiency and capability primarily by removing wastes and
variation (Jing, 2009). Liebesman (2009) supports this definition of Lean Six Sigma, finding that
the basic goals of LSS (Lean Six Sigma) are a simplification of the processes by removing non-
value added activities and a reduction in variability and defectives during operations. Leibesman
also found that combining Lean and Six Sigma improves the bottom line of a company and
provides value to its customers.
Similarities and Differences between Six Sigma and Lean
Concepts Six Sigma Lean
Origin The quality revolution in Japan and
Motorola
The Quality revolution in Japan
and Toyota
Theory No Defects Remove Waste
Process View Reduce variation and improve processes Improve flow in processes
Approach Project management Project management
Methodologies Define
Measure
Analyse
Improve (or design)
Control (or verify)
Understanding customer value
Value stream analysis
Flow
Pull
Perfection
Tools Advanced statistical and analytical tools Analytical tools
Primary effects Save money Reduce lead time
Secondary
effects
Achieves business goals and improves
financial performance
Reduces inventory
Increases productivity and
customer satisfaction
Criticism Does not involve everybody
Does not improve customer satisfaction
Does not have a system view
Reduces flexibility
Causes congestion in the supply
chain
Not applicable in all industries
Figure 4
Adapted from Andersson, 2006.

26
Andersson et al (2006) found that the concepts of Lean and Six Sigma are complementary; they
are excellent road-maps that can be used one by one or combined. George et al (2003 cited in
Andersson et al 2006) state that Lean Six Sigma continues to help companies flourish in a new
world where customers expect zero defects and fast delivery at the minimal cost. The similarities
and differences between Lean and Six Sigma have been documented in Figure 4 – Similarities and
Differences between Six Sigma and Lean.
Bhuiyan and Baghel (2005) point out that Lean and Six Sigma separately cannot achieve
improvements at the rate that Lean Six Sigma can. Lean Six Sigma also addresses important issues
that are overlooked by Six Sigma and Lean manufacturing individually: the steps in the process
that should be first tackled; the order in which they should be applied and to what extent and the
ways in which significant improvements can be made in terms of cost, quality and lead times. The
fusion of the two helps organisations maximise their potential for improvement.
An analysis of Caterpillar’s use of the Lean Six Sigma methodology, carried out by Byrne et al
(2007) highlighted a number of characteristics that distinguished their approach to the program
from that of other companies. These distinguishing characteristics included:
• An innovation vision based on factual customer and market insights
• Their leadership was committed to perpetual innovation
• Alignment of effort across the extended enterprise
• Growth of capabilities within the organisation that made innovation routine
This positive feedback on the harmonisation of Lean and Six Sigma methodologies is also shown
by George (2002) when he found that the combination of Lean and Six Sigma focussing on the
highest-value projects and supported by tight performance improvement infrastructure would
produce remarkable results and is the most powerful engine available today for sustained value
creation by not speeding up the workers or the machines, but by reducing unneeded wait time
between value added steps.

27
Devane (2004) has detailed the advantages of combining the two philosophies, Lean and Six
Sigma, instead of selecting one:
• The speed of implementation increases
• More improvement projects can occur in parallel, which increases profits faster
• Senior management expend less time and energy, than if implemented individually
• Faster and more effective adaptation to external events
2.5 Lean Six Sigma – the Holy Grail?
Is Lean Six Sigma the Holy Grail of improvement methodologies for organisations? Devane (2004)
believes this not to be the case, as he proposes taking a further step in the development of the ideal
improvement methodology – Lean Six Sigma and High-Performance Organisations.
Devane (2004) believes that the combination of Lean Six Sigma and High-Performance
Organisation can achieve sustainable and dramatic results by integrating the simple improvement
principles and tools of Lean which focus on the elimination of waste; reduce variation by using Six
Sigma’s statistical methods; plus the cultural focus, creation of accountability, energy and
ownership through a new structure and principles that High-Performance Organisations will
provide.
The combined disciples have not yet been widely implemented, but there have been a number of
successful implementations, such as StorageTek’s implementation in 1995 which saw increased
group productivity of four combined departments by sixty percent (Devane, 2004).
2.6 Conclusion
From the literature review there is clear knowledge and research of the use of Lean Six Sigma
tools and methods in a manufacturing environment, but very little research into their specific use,
success and applicability within non-manufacturing environments such as administration and
accounting.

28
Therefore, the focus of this dissertation will be to look at the effects of using one of these Lean Six
Sigma tools, Visual Process Controls, in an accounting environment. The focus for the researcher
will be to find out if this is an effective process improvement tool in this specific environment – an
accounting department.
The next chapter will look at the research methods that will be used to understand if this tool,
originally designed for use in a manufacturing environment, is effective in an accounting
environment.

29
3 Research methodology
3.1 Introduction
The objective of this chapter is to provide an account of how the research process was developed;
to set out the research design that has been developed to achieve the research objectives of the
dissertation. Kumar (2005) states a researcher has an obligation to conduct a study using an
appropriate methodology, as it is unethical to use a method that is inappropriate – i.e. using a
highly biased sample.
The Research Process
Figure 5
Adapted from Saunders et al, 2007.
30
Through this chapter the author will detail the research methodology used and the analytical
process which influenced this study. The author will then detail how the research problem was
identified, how the data was collected and prepared, and how the data was analysed detailing the
methods used.
Burgess (1984) states that research process is all about the learning experience, while Bernard
(2006) indicates the reporting and presentation of research actually clean up what is a very messy
process. Figure 5, The Research Process, steps out and details the research process followed by the
author for this case study.
3.2 Overview of Research Design
According to Yin (2008) research design is a logical plan from getting from beginning to end,
where the beginning can be defined as the initial set of questions to be answered, and the end is
some set of conclusions (answers) about these questions. Saunders et al (2007) support this
thinking as they state it is the general plan that the researcher follows in answering the research
question or questions.
The author has adopted the following research plan:
1. Research problem
2. Defining the research question
3. Defining the research objectives
4. Methodology
a. Research Design
b. Data Collection
5. Presentation and interpretation of findings
6. Conclusion
The above plan identifies each stage of the research design, and the position of each stage within
the overall process.

31
3.3 Problem Definition
Kumar (2005) said that the most important step of the research process is formulating a research
problem, as it serves as the foundation of the study that follows.
The author has carried out an extensive literature review in the area of Lean, Lean Thinking, and
Lean Six Sigma. In reviewing this literature the author has identified that there is no specific
research looking at how Visual Process Controls, which is a tool utilised in the Control part of the
DMAIC (Rampersad and El-Homsi, 2007) process, are applied in an accounting/finance
department and if it is an effective tool for this environment.
3.4 Research Questions and Objectives
The research question will emerge from the research problem. Corbin and Strauss (2008) state that
the research question will help to set boundaries of what the researcher wants to study as it is
impossible for a researcher to cover all aspects of a problem, therefore, making appropriate
question design an imperative. McNiff and Whitehead (2000) state that the research question may
not be obvious at the start, emerging only after the research process has begun. They refer to this
as progressive illumination.
The main area of research that was explored in the literature focused on the Lean, Lean Thinking,
and Lean Six Sigma process improvement methodologies and their tools. The main research
objective that emerges from the literature and the research problem is:
• To find out the effects of implementing a Lean Six Sigma tool, visual process controls, to
improve month-end activities in two of Pfizer’s manufacturing plant accounting
departments. The two sites are Grange Castle in Clondalkin Dublin, and Newbridge in
County Kildare.
As detailed in the literature review Byrne et al (2007) state that Lean Six Sigma improvements are
not just about doing things better, but about doing better things. It is not just about getting data
right the first time, being accurate and having a streamlined process, it is also about asking the
right questions, ‘should we do this?’, ‘is this necessary?’, ‘what does the customer want?’ and
‘how does the customer want it?’. Therefore, the research will be guided by the following two
research objectives:

32
1. To explore the impact of introducing visual process controls on Grange Castle and
Newbridge accounting departments month-end processes
2. To ascertain if visual process controls that are in use in Grange Castle and Newbridge
accounting departments provide clarity of use and clarity of process, and if the month-end
visual process control board is an effective process improvement tool for an accounting
department environment.
3.5 Research Design
According to Kumar (2005) a research design is a procedural plan or blueprint, that is adopted by
the researcher to answer questions validly, objectively, accurately and economically. Kerlinger
(1986) also states that the plan is the complete program for the research, and will include an
outline of the preliminary steps right through to the final analysis of the data.
The research being undertaken is centred on the effects of utilising visual process controls as a
process improvement tool for accounting month-end activities and to assess the impact of utilising
the tool which will also specify if the tool is effective for use in the defined environment, an
accounting department.
The type of research that will be used involves an empirical investigation of the use of visual
process controls within the context of month-end accounting activities. The study will be
exploratory in nature, Robson (2002) explaining that exploratory research is to find out what is
happening, identify new insights, inquire and assess phenomena in different circumstances.
Saunders et al (2007) state that exploratory studies allow for three main methods of conducting the
study:
• Searching the literature
• Interviewing subject matter experts
• Focus group interviews
Adams and Schvaneveldt (1991) state that even though there is flexibility within an exploratory
study, it does not mean that there is a lake of direction for the study.

33
3.5.1 Primary and Secondary Research Data According to Saunders et al (2007) primary data is collected specifically for a specific study, while
secondary data is the reanalysing of data that has previously been collected for alternative purposes.
Primary data is used to understand the area that the study is being carried out on. The information
that is collected from original sources would include answers to interview questions and responses
to questionnaires. Questionnaires are very popular methods for gathering primary research data
due to their flexibility, which allows them to be custom designed to meet the objectives of any
research project (McNabb, 2002).
Kervin (1999) states that secondary data can include both raw (which has not been processed) or
compiled data that has had some basis of selection and summarising. Saunders et al (2007) state
that within business and management research this kind of data, secondary, is used most frequently
for case study research strategies and can be split into three main headings – Documentary; Survey
based; and Multi-source.
The primary research that has been carried out, in the following chapters, has enabled the author to
become familiar with the impact and effect of using the Lean Six Sigma tool – visual process
controls, within the accounting departments of the Pfizer plants at Grange Castle and Newbridge.
For the purpose of this study no secondary research material will be used as there has been no
study of the use of this tool in an accounting environment.
3.5.2 Qualitative vs. Quantitative Data Collection Methods There are two methods that may be used to collect data, qualitative and quantitative. Ackroyd and
Hughes (1992) state that neither the qualitative nor quantitative method is markedly superior to the
other; in many studies it is necessary to combine the data from the two methods.
Qualitative is any data collection method or data analysis procedure that results in non-
numeric data
Quantitative is any data collection method or data analysis procedure that results in
numerical data or data that could be usefully quantified to assist in answering the research
question

34
The main distinctions between qualitative and quantitative data collection methods are documented
in Table 3 – Distinctions between Quantitative and Qualitative data.
Distinctions between Quantitative and Qualitative data
Quantitative Data Qualitative Data
Based on meanings derived from numbers Based on meanings expressed through
words
Collection results in numerical and
standardised data
Collection results in non-standardised data
requiring classification into categories
Analysis conducted through the use of
diagrams and statistics
Analysis conducted through the use of
conceptualisation
Table 3
Adapted from Dey, 1993.
Saunders et al (2007) state that qualitative data can be found in many forms (secondary) such as
organisational documentation, reports, emails, newspapers and non-written such as audio and
video recordings.
Quantitative data is quantifiable and is measured numerically.
3.5.2.1 Qualitative Data Collection Research Justification The method of data collection that has been chosen by the author for this study is qualitative. The
justification for this is that the research which was undertaken was focused on understanding the
impact of implementing one of the Lean Six Sigma process improvement tools, visual process
controls, on an accounting department’s month-end activities, and also to understand if it is an
effective improvement tool in an accounting department environment.
The research is required to be qualitative as it needs to take into account the experiences and views
of the analysts, accountants and management within the accounting departments on using visual
process controls as a process improvement tool. Qualitative research was chosen over quantitative
as it is a better method in making sense of statements and opinions that are collected from the

35
interviewees. Silverman (2006) makes the point that qualitative researches’ main strength is its
ability to study phenomena which are not available elsewhere, particularly areas of social reality
which statistics cannot measure.
3.5.3 Data Collection Method As previously mentioned in this chapter, the author decided to use the qualitative research data
collection method for collecting the data for this study. Three methods of research have been
considered by the author which is interviews, focus groups and participant observation. However,
having reviewed the pros and cons of each of the methods and the time pressures related to this
study the author focused on the interview method for data collection.
Figure 6 shows a picture of the different types of interview methods that are available. Saunders et
al (2007) state that interviews can be highly formalised and structured, these types of interviews
use standardised questions for each respondent, alternatively they can be unstructured. Saunders
goes on to say that more than one interviewing method can be utilised while Kahn and Cannell
(1957) state that an interview is a purposeful discussion between people.
Interview Methods
Interviews
Standardised Non-standardised
One-to-One One-to-many
Face to face interviews
Telephone interviews
Internet and intranet-
medicatedGroup interviews
Internet & Internet-mediated group interviews
Focus groups Focus groupsInterviewer administered
questionnaires
Figure 6
Source: Saunders et al, 2007.

36
One of these interviewing methods will be utilised by the author as a method of primary research,
which will be non-standardised face to face interviews.
3.5.4 Reasoning for Semi-Structured Interviews The author is basing this study on data derived through qualitative means; therefore the
interviewing methods used will be non-standardised, also referred to as semi-structured by Healey
and Rawlinson (1993). Saunders et al (2007) refer to non-standardised interviews as methods to
gather data and analyse qualitatively.
In semi-structured interviews the author will have a list of themes or/and questions which will not
necessarily be identical for each interviewee. The theme of the questions will be relevant to the
area that the researcher wants to explore and there is also the flexibility to introduce new questions
depending on how the interview evolves around the topic area. New questions are necessary as “it
is the interviewee’s perceptions that guide the conduct of the interview” (Saunders et al, 2007,
p.312).
Saunders et al (2007) also said that the following situations favour non-standardised semi-
structured interviews:
• Where it is necessary for the researcher to understand the reasons for their interviewees’
attitudes and opinions, the interview affords the researcher the opportunity to probe
answers for further detail and clarity
• Where the element of trust with the data provided is of primary concern
• Where there are a large number of questions; or the questions are open ended or complex;
or the order of the questions needs to be altered
3.6 Preparation for Semi-Structured Interviews
As part of the preparation for this study the author has carried out a broad literature review in the
area of Lean, Lean Thinking and Lean Six Sigma process improvement methodology and
techniques, and a detailed literature review specifically on visual process controls. The review
included both academic and practitioner articles.

37
The author being familiar with both organisations and departments, and the additional information
gained from the literature review, prepared the questions for the interviews that were appropriate
and relevant to the study.
3.6.1 Sampling Hanson (1953) defines a sample as “a subset of a population selected to obtain information”. This
is necessary as it is not practical to interview everybody in the finance department of two large
pharmaceutical plants. As this study is based on qualitative methods, the sample has relevance to
the individuals that will be chosen for interview.
The sampling method that will be used is purposive sampling. Kumar states that purposive
sampling is based on the judgement of the researcher as to who can provide the best information to
achieve the objectives of the study (2005). This will allow the author to select interviewees who
will be able, relevantly, to answer the research questions, allowing the study to meet its objectives.
Table 4 details the list of respondent’s, some details are omitted to protect their anonymity.
Sample for Semi Structured Interview
Respondent Respondent Profile
A Business & Process Manager
B Senior Finance Leader
C Cost & Inventory Accountant
D Cost & Inventory Accountant
E Finance Manager
F Cost Accountant
G Finance Manager
H General Ledger Accountant
I General Ledger Accountant
J Cost & Inventory Accountant
K Finance Manager
L Finance Manager
Table 4

38
The study population is twenty, while the sample that was used was twelve, or sixty percent. The
sample used can be further broken down into fifty percent from the Finance departments’ middle
and senior management, and fifty percent from the ranks of the operational accountants. The
sample used will allow for conclusions to be balanced, not favouring or detracting either group.
3.7 The Interview
3.7.1 Pilot Phase Interviews The pilot interview questionnaire had detailed seventeen main questions, some with sub-sections.
The researcher carried out two pilot interviews with real candidates. Based on the feedback from
these candidates and the information gained by the researcher during the sample interview, the
final questionnaire had two questions deleted entirely and minor wording changed in others. This
resulted in a total of fifteen main questions remaining for the main research gathering
questionnaire which can be reviewed in the Appendix.
Also, the interviews were initially planned to last for thirty minutes, but this proved unrealistic
during the pilot phase as they ran to between forty and forty-five minutes. The author amended the
planned time for the interview to one hour to give the candidates a realistic time frame of what will
be needed.
3.7.2 The Final Interview One to one semi-structured interviews was the primary data gathering method for this study,
therefore the researcher needed to get the answers to the two research objectives solely based on
the responses in these interviews. The researcher had the opportunity to interview twelve of the
Grange Castle and Newbridge accounting departments’ twenty individuals. They were
appropriately spread between the various sub-functions of the accounting department to give a fair
reflection of the impact and effective use of the month-end visual process control board.
The researcher did gain approval in advance from the Chief Financial Officer of Ireland to carry
out the interviews. A number of weeks prior to the interviews being scheduled the researcher sent
an introductory email to all of the colleagues of the accounting department introducing the author,
the reasons behind the future request for interview and the topic that would be discussed at the

39
interview. This allowed each candidate time to think about the use of the visual process control
board ahead of the interview, and to advise if they did not want to take part. One week later
candidates received meeting requests via email for the interview. No respondent declined the
request outright but some interview meetings did have to be rescheduled due to personal and
professional constraints.
The researcher held the interviews mid month, so as not to impact the busy last week and first
week of month cycle for financial period close activities. Each interviewee was thanked at the
outset of each interview for accepting the request and giving up their time for the purpose of this
study. Also, each interviewee was given an interview consent form to review and sign which
granted permission for the interview to occur and the data collected used in the findings of this and
possible future studies. A copy of the consent form can be found in the Appendix. The interviews
were structured around the interview questionnaire that can be found in the Appendix, thus
ensuring that the same format and appropriate questions got asked to each candidate.
Interview times had a small variance, with the shortest lasting fifty minutes and the longest one
hour fifteen minutes. Eleven of the interviews occurred in one session, with one being interrupted
and completed at the second session. The interruption was due to an urgent business issue which
needed to be dealt with immediately.
3.8 Analysis of Data
As the author has previously detailed the data collection method has been qualitative, however, the
data analysis methods used will be both qualitative and quantitative. The quantitative analysis will
be used to rate how effective or not the respondents perceive the use of the visual process control
board to be. The following subsection will detail how this quantitative scoring will be applied and
calculated.
3.8.1 Operational Definition for ‘Effective’ rating For the purpose of this study, the term ‘effective’ has been given the following operational
definition:

40
• Visual Process Controls will be deemed to be an effective process improvement tool for
an accounting department environment if after the summation calculation using the
scoring illustrated in Table 5 – Scoring used to Calculate Effective Rating, based on the
respondent answers from questions eleven, twelve, thirteen, fourteen and sixteen in the
interview equals or is above a score of sixty.
Scoring used to Calculate Effective Rating
Adjustment Question Calculation of Score for
Effective Rating
Score
Yes No
11 Very Ineffective
Ineffective
No Change
Effective
Very effective
–20
–15
0
15
20
N/A
12 Yes
No
Unsure
20
0
15
–20
0
0
0
–15
0
13 Very Unclear
Unclear
Not Sure
Clear
Very Clear
–20
–15
0
15
20
–10
–15
0
–15
–20
20
15
0
0
0
14 Very Unclear
Unclear
Not Sure
Clear
Very Clear
–20
–15
0
15
20
20
15
0
–15
–20
–15
–15
0
0
0
16 Very Poor
Poor
Neutral
Good
Very Good
–20
–15
0
15
20
N/A
Table 5

41
The researcher has included an adjustment score in the calculation of the affective rating. This is to
remove any positive or negative score that was already the case prior to the implementation of the
month-end visual process control board, e.g. if the answer to question fourteen had been ‘Very
Clear’, but the respondent stated that this had also been the case prior to the implementation of the
month-end visual process control board, then there has been no positive effect. The above scoring
criteria would reflect this, twenty points for ‘Very Clear’ minus twenty points for it already being
‘Very Clear’ equals a score of zero.
3.9 Limitations The researcher has given a guarantee, detailed in the interview consent form, that the identity of
the interviewees will remain confidential and will not be disclosed verbally or written in this study.
The researcher has adhered to this throughout the dissertation study and research gathering phase.
3.9.1 Observer Bias Saunders et al (2007) state that as we cannot avoid observer bias we must seek to control it.
Delbridge and Kirkpatrick (1994) agree that this threat is real; they state that we cannot detach
ourselves from the world that we live in; therefore the interpretation of the data collected will
reflect the author’s world.
One method that the author employed to counter this is to use informant verification, which is a
form of triangulation. This will involve presenting back the written notes from the unstructured
interviews and participant observations, and any conclusions from the author to the interviewees to
allow them to verify the content.
Also, Burton and Bartlett (2005) state that there is real danger of an inexperienced researcher
reading an opinion from data that is not supported by the question. For example, a question that
asks to rate your overall experience of the introduction of Visual Process Controls in a finance
environment on a scale of one (very poor) to five (very good) may result in an average response of
three. It is possible for the researcher to conclude that this is a positive response; however, the
candidate may have specific issues with Visual Process Controls which the question does not allow

42
them to express. The researcher has catered for this phenomenon in the question design by asking
the candidate to explain or elaborate on why their rating is at a particular level.
3.9.2 Ethical Considerations A major obstacle to any study starting is gaining access to the building and respondents. Difficulty
of access to Pfizer’s Grange Castle and Newbridge accounting departments did not arise, as the
author is a close partner to both organisations, so removing usual research obstacles such as
physical access and cooperation.
Prior to the commencement of this study the author met with the Wyeth Ireland’s Chief Financial
Officer (CFO) and the Manager for Financial Business Processes and Systems (BPS). At this
meeting the author advised of the participation in a master’s degree course and requested
permission to do a study on how Grange Castle and Newbridge finance departments have been
using the Lean Six Sigma tool visual process controls. Consent to the study being carried out was
given with the proviso that there would be no negative impact on year-end or month-end
accounting activities and timelines.
3.9.3 Data Interpretation
This is an area, according to Saunders et al (2007) which has a large possibility of the researcher
making logic leaps and false assumptions, as the researcher converts large amounts of data to a set
of conclusions that are articulated coherently. To prevent this, the researcher has designed a
scoring framework which will provide the answer for each candidate if visual process controls is
an effective process improvement tool for an accounting department environment. The
scoring framework utilises the answers from five separate questions; eleven, twelve, thirteen,
fourteen and sixteen, which are individually scored and then totalled.
3.10 Conclusion
This chapter has highlighted the process that the researcher followed to gather the data necessary
for the successful completion of this study. The researcher has chosen qualitative data gathering
method which will follow a semi-structured interview. The strength of this method allows the

43
interviewer to enquire for further detail or ask an additional question depending on the responses
of each candidate. The analysis of the data will be based on qualitative and quantitative methods
which have been outlined.
The next chapter will detail the findings of the twelve respondents. These findings will be based on
the two stated research objectives which are to explore the impact of introducing visual process
controls on the accounting departments of Grange Castle and Newbridge, and to ascertain if visual
process controls that are in use in these accounting departments provide clarity of use and clarity
of process, and if the month-end visual process control board is an effective process improvement
tool for such an environment.

44
4 Research Findings
4.1 Introduction
The objective of this chapter is to analyse the semi-structured interviews that were undertaken as
part of the research study. The interview questions were developed based on studies of chapters
one, two and three.
This analysis will address on a per interviewee basis three subsections, which include:
1. Interviewee background, this will identify the organisation they are based in and the role
they fulfil within that organisation. The author will also detail if the participant was aware
of the implementation of the Lean Six Sigma tool – Visual Process Control board for
month-end activities within the department, and the author will detail if the candidate has
used this tool before.
2. The second subsection will identify the findings in response to questions relating to the
impacts that the interviewees had perceived as a result of the introduction of the month-end
Visual Process Control board on:
• The month-end process
• The finance leadership team
• The finance operations and shared services team.
• Team behaviours
• Tools, systems or processes
• Team communication (Horizontal and/or Vertical)
3. The third and final subsection will identify the findings in response to questions relating to
the clarity of the month-end visual process control board, and if the month-end visual
process controls board is an effective process improvement tool for an accounting
department.

45
4.2 Participant ‘A’ and summary of Visual Process Controls findings
Participant A was based at the Grange Castle facility, with some time spent at the Newbridge
facility each week, and had responsibility for implementing process improvements across both the
Grange Castle and Newbridge organisations. The respondent has extensive knowledge of Lean Six
Sigma and its use within different departments of both organisations. The respondent was fully
aware of the implementation of Visual Process Control Board for month-end accounting activities,
but had not used this Lean Six Sigma tool before within Pfizer or another organisation.
4.2.1 Findings in response to questions relating to the impact of introducing Visual Process Controls
In response to the question on the impact on the month-end process, the respondent said that
dialogue has started in trying to fully understand the inputs and outputs of each task and their
associated interconnectivities of tasks which were viewed as having the greatest positive impact. It
has provided a high-level checklist and can be used for process improvement activities or impact
assessments. If it didn’t exist the initial assessment of potential process improvements would have
made it unclear whether to proceed or not. This candidate saw one negative impact of team
cynicism to the use of visual mapping tools.
In response to the question on the impact on the finance leadership team, the respondent
stated positive impacts included being able to see what tasks colleagues were doing and if
reprioritisation was necessary. It also allowed them to get an overview of the status of month-end
very quickly and to ask the right questions to the right people. Most important for this candidate
was that “it gave confidence to leaders that the revised month-end schedule could be achieved, as it
was prepared by the individuals carrying out the activities”. This candidate saw one negative
impact in that there was an assumption that everything is alright because it is there.
In response to the question on the impact on the finance team, the respondent stated positive
impacts included colleagues now looking at the interconnectivity of their tasks, which also gives a
better view of schedule than just a list with no consequences of changes which is viewed as having
the largest positive impact. Individuals who are not meeting deadlines are now highlighted as their
task deliverable is late. This candidate saw a number of negative impacts, the largest being that

46
there is no flagging where individuals are working long hours to stay on schedule and other
activities that do not affect month-end are not captured on the visual process control board. Also,
individuals don’t always see what is in it for them, and issue resolution has seen no engagement
from a team perspective.
In response to the question on the impact on team behaviours, the respondent deemed that the
largest positive impact is that there is dialogue about a process issue quicker and the personality of
the task owner is taken out of the issue. Also, it is easier to understand issues/delays without
bringing specific colleagues into it. One negative impact was perceived with the potential for
causing a rift between groups, when it is not fully clear what both groups are doing and/or the
causes for delays.
In response to the question on the impact on tools, systems or processes, the respondent stated
positive impacts include critical path and critical cut-offs being highlighted, which is perceived as
having the largest positive impact. Critical areas to focus on have been highlighted and visual
process management allows an understanding of what the next person in the process needs. This
candidate perceived negative impacts which can result in the chart becoming a picture if it is not
being setup to drive improvements. Also, and most importantly for this candidate is that it doesn't
drive proactive standardisation of systems between or across sites.
In response to the question on the impact on team communication, the respondent saw only
positive impacts which include the visual control board aligning the discussions among
management and team by having a consistent view and visually being able to pin-point the area of
issue. The largest positive impact is that this in turn saves time and avoids frustration due to
miscommunication which also helps to manage scope of discussions. This candidate perceived no
negative impacts.

47
4.2.2 Findings in response to questions relating to the effectiveness and clarity of the month-end visual process control board
When asked how effective the month-end visual process control board was the respondent
deemed the use of the month-end visual process control board to be effective. It was rated at this
level as there needs to be full management usage of the tool for coaching and driving process
improvements by team.
In response to the questions on the clarity of the month-end activities, activity sequencing,
and status of each activity the respondent stated that month-end activities are clear now to all
colleagues which was not the case prior to using the month-end visual process control board as
there was just a list of activities maintained on a folder imbedded in other folders which was
maintained individually and not shared. Activity sequencing was perceived as being very clear as
it is now built into the visual plan with swim lanes, time lines and accountability. The status of
each activity was perceived as being clear, which was not the case prior, as “individuals take
ownership for updating” which has been made simpler by the use of the visual board.
In response to rating the overall experience of the introduction of visual process controls in
their finance environment the respondent stated that it was good because it was possible now to
understand the end to end process and each task’s interconnectivity dependencies.
Calculation of Scoring for Effective Rating for Respondent A
Question Score Adjustment Total
11 15 N/A 15
12 20 0 20
13 20 0 20
14 15 0 15
16 15 N/A 15
Total 85
Table 6
The calculation of the score for respondent A (as illustrated by Table 6) which is used to deem the
month-end visual process control board as an effective process improvement tool for an

48
accounting department environment is 85. Therefore, based on the criteria outlined in the
Research Methodology chapter, the visual process controls that are in use in the Grange Castle and
Newbridge accounting departments are an effective process improvement tool for an accounting
department environment.

49
4.3 Participant ‘B’ and summary of Visual Process Controls findings
Participant B was based at the Grange Castle facility, is a member of the Finance Leadership
Team. The respondent has limited knowledge of Lean Six Sigma and its use within the
organisations. The respondent was fully aware of the implementation of Visual Process Control
board for month-end accounting activities, but had not used this Lean Six Sigma tool before within
Pfizer or another organisation.
4.3.1 Findings in response to questions relating to the impact of introducing Visual Process Controls
In response to the question on the impact on the month-end process, the respondent notes
positive impacts ‘that it makes the month-end process visible, which in turn raises awareness
which forces people to meet their objectives’. Raising awareness of the process had the greatest
positive impact for this candidate. This candidate saw no negative impacts.
In response to the question on the impact on the finance leadership team, the respondent noted
positive impacts included the leadership team being aware of all the activities that had to occur
which was also seen as having the greatest positive impact; the use of visual process control boards
being useful in other areas of finance and the assisting the Leadership team in meeting tighter
deadlines. This candidate saw no negative impacts.
In response to the question on the impact on the finance team, the respondent stated positive
impacts included individuals being more accountable for what they do and don’t do which is
perceived as having the highest positive impact; has helped to improve the process flow and reduce
the working hours. This candidate saw only one negative impact that some people don’t like the
visibility that it gives to the leadership team.
In response to the question on the impact on team behaviours, the respondent stated positive
impacts included short status meetings each morning which gives a good overview of how the
month-end is progressing; forces open communication of deadlines and status; knock on-effects of
delays are visible to whole team which has resulted in the number of delays dropping;
dependencies are known by all which has resulted in a greater effort by everyone to get tasks

50
completed, which is also perceived as having the greatest positive impact. This candidate saw no
negative impacts.
In response to the question on the impact on tools, systems or processes, the respondent
acknowledged positive impact that the visual process control board highlights problems and issues
in the processes that are used. This candidate saw no negative impacts.
In response to the question on the impact on team communication, the respondent stated
positive impacts included the month-end visual process control board assisting the chief financial
officer in getting status updates at a glance. Also, it has promoted open discussion on missed or
late tasks and the reasons behind it so promoting future improvements which are seen as having
the greatest positive feedback. This candidate saw no negative impact.
4.3.2 Findings in response to questions relating to the effectiveness and clarity of the month-end visual process control board
When asked how effective the month-end visual process control board appeared the
respondent deemed the use of the month-end visual process control board to be effective, and
perceived no down side to its use within the finance department, but definitely thought that it could
be used even more effectively.
In response to the questions on the clarity of the month-end activities, activity sequencing,
and status of each activity the respondent reply was that the department month-end activities are
now clear, as “the visual process control board leads you to believe they are clear”. However, the
candidate perceived that the activities were clear before the introduction of the visual process
control board. The respondent also stated that the sequence of month-end activities was clear,
which was not the case before as “activities were not done in the correct sequence which hurt the
time it took to complete the close”. The status of each activity was perceived to be clear, which
was not the case prior to the introduction of the visual process control as the respondent felt “it was
vague and ambiguous”.
In response to rating the overall experience of the introduction of visual process controls in
their finance environment the respondent stated it was neutral as they perceived that much more
could be done with visual process controls within the department.

51
Calculation of Scoring for Effective Rating for Respondent B
Question Score Adjustment Total
11 15 N/A 15
12 20 -20 0
13 15 0 15
14 15 0 15
16 0 N/A 0
Total 45
Table 7
The calculation of the score for respondent B (as illustrated by Table 7) which is used to deem the
month-end visual process control board as an effective process improvement tool for an
accounting department environment is 45. Therefore, based on the criteria outlined in the
Research Methodology chapter, the visual process controls that are in use in the Grange Castle and
Newbridge accounting departments are not an effective process improvement tool for an
accounting department environment.
52
4.4 Participant ‘C’ and summary of Visual Process Controls findings
Participant C was based at the Grange Castle facility and is a member of the Finance Operations
team. The respondent has knowledge of Lean Six Sigma and its use within the organisation and
other organisations. The respondent was fully aware of the implementation of Visual Process
Control board for month-end accounting activities, and had knowledge of using this Lean Six
Sigma tool before within another organisation, such as Microsoft, but rated its use as poor because
it was not used at department level.
4.4.1 Findings in response to questions relating to the impact of introducing Visual Process Controls
In response to the question on the impact on the month-end process, the respondent notes
positive impacts ‘of having the interdependencies visible for all to see’, which gave clear deadlines
and a schedule that was known in advance. Deadlines known from the outset had the greatest
positive impact for this candidate. This candidate saw negative impacts as the process is not
promoting the right behaviour as individuals are using it inappropriately. Concerns and actions
tabled are not being followed up as there is no strong owner of the process. This candidate asked
“does the right group own the process”? The candidate also perceives that there is no proactive
behaviour to build on the existing framework. The greatest negative impact is that there is no
strong owner of the process.
In response to the question on the impact on the finance leadership team, the respondent
stated positive impacts included the leadership team being aware of the interdependencies within
the process; the scale of work being known which is seen having the greatest positive impact and
the individual effort by all during month-end which has resulted in more focus being placed on
month-end by the leadership team. This candidate saw negative impacts as it has and is
highlighting management and control weaknesses of the month-end process and that it has no
finance leadership owner of the Visual Process Control board which is resulting in it being
perceived as a “picture and ticking the box exercise”.
In response to the question on the impact on the finance team, the respondent noticed positive
impacts as some people have become very proactive in making sure that their deliverables are on
time by putting in remedial measures and/or starting the activity earlier. The entire operations and

53
shared services team are aware of the schedule and timelines which is perceived as having the
largest positive impact, and there is more focus to achieve the month-end closure goal. This
candidate sees a number of negative impacts on the finance team which are that the month-end
visual process control board is perceived by some to be non-value adding; that the month-end
visual process control board is an ambiguous chart which has no effect on behaviour which is
promoting the wrong type of behaviour – “ticking the box”, which is perceived as having the
largest negative impact; and it has created tension between sub-teams where interdependencies are
not being achieved effectively.
In response to the question on the impact on team behaviours, the respondent stated only one
positive impact – the visibility of interdependencies which has resulted in a greater effort to meet
the documented time lines. This candidate saw a number of negative impacts – perceived new
tensions between some colleagues and for others the individual goal of meeting the time of their
task is more important than the concerns raised in the process of achieving the results. This is also
seen as having the largest negative impact.
In response to the question on the impact on tools, systems or processes, the respondent said
that a positive impact was the improvement of variance analysis requiring descriptive explanation
which gets reviewed at the finance leadership spend review meeting. This candidate saw two
negative impacts as there is not enough time to review the final variance numbers to give a
comprehensive explanation which is seen as having the largest negative impact, and it was felt that
it was not necessarily the right people thinking the process through which has been applied to the
month-end visual process control board.
In response to the question on the impact on team communication, the respondent stated
positive impacts include improved communication as the interdependencies are known which is
resulting in these colleagues talking more to each other as it is now very clear who should be
talking to who which is seen as having the greatest positive impact; the leadership team can get a
status update on an ongoing basis from reviewing the control board, and the morning status check
gives an opportunity for all to voice concerns and raise issues. This candidate has perceived two
negative impacts which include issues being raised at the status check meeting not being assigned
an owner for follow-up and no minutes are taken so there is no close out of what is raised unless it
is sorted at the meeting. Also, there are no rules of engagement for the status check meeting – the
meeting has no terms of reference which is perceived as having the largest negative impact.

54
4.4.2 Findings in response to questions relating to the effectiveness and clarity of the month-end visual process control board
When asked how effective the month-end visual process control board was the respondent
deemed the use of the month-end visual process control board to be effective. However, the
respondent articulated that there is still room for improvement as the process lacks an owner at the
finance leadership level and that steps on the visual process control board are deemed of equal
importance.
In response to the questions on the clarity of the month-end activities, activity sequencing,
and status of each activity the respondent stated that the month-end activities are now clear; this
was not the case prior to the implementation of the month-end visual process control board. The
respondent also stated that the sequencing is now clear which is a change, however, “it (the
sequence) is visible, but lacks critical path identification and the scale of effect of an activity not
being done per schedule”. The respondent further said the clarity of status was unclear as the
“chart (visual process control board) being updated with the process in green was after the fact”.
In response to rating the overall experience of the introduction of visual process controls in
their finance environment the respondent thought it was good saying that there was potential for
benefits to be gained. However, the concerns raised by team members at the status check meetings
needed to be addressed.
Calculation of Scoring for Effective Rating for Respondent C
Question Score Adjustment Total
11 15 N/A 15
12 20 0 20
13 15 0 15
14 -15 15 0
16 15 N/A 15
Total 65
Table 8

55
The calculation of the score for respondent C (as illustrated by Table 8) which is used to deem the
month-end visual process control board as an effective process improvement tool for an
accounting department environment is 65. Therefore, based on the criteria outlined in the
Research Methodology chapter, the visual process controls that are in use in the Grange Castle and
Newbridge accounting departments are an effective process improvement tool for an accounting
department environment.

56
4.5 Participant ‘D’ and summary of Visual Process Controls findings
Participant D was based at the Grange Castle facility and is a member of the Finance Operations
team. The respondent has knowledge of Lean Six Sigma and its use within the organisation and
other organisations. The respondent was fully aware of the implementation of Visual Process
Control board for month-end accounting activities, and had knowledge of using this Lean Six
Sigma tool before within another organisation rating its use a good.
4.5.1 Findings in response to questions relating to the impact of introducing Visual Process Controls
In response to the question on the impact on the month-end process, the respondent
acknowledged positive impacts of the wider team understanding the knock-on impact of time lines
not being met. This candidate saw negative impacts as ‘the rate of change in the process and
business makes the month-end Visual Process Control board redundant quickly’. This was also
seen as having the largest negative impact. The perception of the increased attention from peers on
the time of task completion was seen as negative.
In response to the question on the impact on the finance leadership team, the respondent
stated positive impacts included the leadership team being more aware of what the team does;
greater awareness of the obstacles the team face which is also seen as having the greatest positive
impact; the knock-on impacts of delays or changes on the process. This candidate saw negative
impacts in there being no clear owner of the process in the leadership team; the schedule review
meetings during the close do not always happen; conflict between leadership and team during the
review meeting and management not being totally aware of what the team is doing is seen as
having the largest negative impact.
In response to the question on the impact on the finance team, the respondent said positive
impacts included individuals working more as a team at month-end; there is a better understanding
of what each other does, particularly shared services and operations; efficiencies have been created
through the better understanding of the end to end process and people now understand the knock
on effect of being late so tasks are moved earlier and completed on time which is perceived as
having the greatest positive impact. This candidate saw only one negative impact in that the

57
month-end visual process control board becomes redundant quickly as the business and process
change.
In response to the question on the impact on team behaviours, the respondent stated positive
impacts include improved morale as there is light hearted ‘banter’ during the status meetings
around the month-end visual process control board. This candidate perceives a number of negative
impacts which include some colleagues’ behaviour resistant to the changes that the month-end
visual process control board has brought, which is seen as having the greatest negative impact, and
some team members “moaned” as it changed their timelines.
In response to the question on the impact on tools, systems or processes, this respondent saw
no positive impacts. This candidate saw a negative impact as there has been no management
reaction to the long working hours of some colleagues as a result of the changes in the process
which has resulted in more workload condensed into a shorter timeframe.
In response to the question on the impact on team communication, the respondent said positive
impacts include horizontal communication among team members has increased; tasks get
discussed at the status check meeting with feedback provided by the subject matter experts which
is perceived as having the greatest positive impact; and everyone’s role is clearly understood by all
team members. This candidate perceived one negative impact being that management hear issues
but don’t really listen or try to get them resolved.
4.5.2 Findings in response to questions relating to the effectiveness and clarity of the month-end visual process control board
When asked how effective the month-end visual process control board was the respondent
deemed the use of the month-end visual process control board to be very effective. “From the onset
of its use it was very effective, information was up to date, and as the environment changed the
visual process control board ensured that the team changed with it”. However, the candidate
highlighted that the lack of an owner is seeing the initial positive effect decrease.
In response to the questions on the clarity of the month-end activities, activity sequencing,
and status of each activity the respondent stated that the month-end activities and sequencing are
now clear, which they were not prior to the implementation of the visual process control board.

58
“We all know what has to be done from the visual process control board”. However, the
respondent stated that the status of tasks is ‘very unclear’, and “relies on verbal communication”
which is what had been done by the respondent prior to the implementation of the visual process
control board.
In response to rating the overall experience of the introduction of visual process controls in
their finance environment the respondent acknowledged it was very good. The respondent stated
that the tool helped to manage process change, which was critical to its success, and it allowed
financial results to be provided to tight deadlines.
Calculation of Scoring for Effective Rating for Respondent D
Question Score Adjustment Total
11 20 N/A 20
12 20 0 20
13 15 0 15
14 -20 20 0
16 20 N/A 20
Total 75
Table 9
The calculation of the score for respondent D (as illustrated by Table 9) which is used to deem the
month-end visual process control board as an effective process improvement tool for an
accounting department environment is 75. Therefore, based on the criteria outlined in the
Research Methodology chapter, the visual process controls that are in use in the Grange Castle and
Newbridge accounting departments are an effective process improvement tool for an accounting
department environment.

59
4.6 Participant ‘E’ and summary of Visual Process Controls findings
Participant E was based at the Grange Castle facility and is a member of the Finance Leadership
team. The respondent had no previous knowledge of Lean Six Sigma or its use within other
organisations. The respondent was fully aware of the implementation of Visual Process Control
board for month-end accounting activities.
4.6.1 Findings in response to questions relating to the impact of introducing Visual Process Controls
In response to the question on the impact on the month-end process, the respondent stated
positive impacts included the new discipline of meeting deliverables on time; improved
communications; understanding the critical path activities of the month-end process and the
improved efficiencies with the team as everyone knows what they should and should not be doing.
Understanding the critical path activities was perceived as having the highest positive impact. This
candidate saw negative impacts as there are still people who are dubious of the process which is
resulting in different levels of engagement and enthusiasm which is seen as having the greatest
negative impact.
In response to the question on the impact on the finance leadership team, the respondent said
positive impacts included those detailed for the month-end process. This candidate saw negative
impacts as there are different levels of engagement and enthusiasm, which is seen as having the
largest negative impact, with some people doubtful of the value of the month-end visual process
control board.
In response to the question on the impact on the finance team, the respondent stated positive
impacts included increased communications among team members around their interrelated
activities; there is a better understanding of the dependencies and linkages with colleague’s tasks
and an increased awareness of individual milestones. This candidate saw only one negative impact
related to the differing levels of engagement from team members.
In response to the question on the impact on team behaviours, the respondent observed
positive impacts included a “one team” feeling that didn’t exist before between operations and

60
shared services and there is a new level of preparedness for key meetings and status checks which
wasn’t the case before the month-end visual process control board process. This candidate
perceives no negative impacts.
In response to the question on the impact on tools, systems or processes, the respondent
acknowledged positive impacts included the improvements in terms of accuracy and completeness
in time for the review meeting, which was seen as having the greatest positive impact. Also, there
had been a number of successful streamlining activities for some of the accrual journals, such as
utilities. This candidate saw no negative impact.
In response to the question on the impact on team communication, the respondent said positive
impacts include the greatly improved horizontal communication amongst team members as the
critical inputs for different milestones are better understood which is seen as giving the greatest
positive impact. This has also been helped by knowledge sharing by team members which gives a
better holistic understanding of the process for the whole team. This candidate saw no negative
impact.
4.6.2 Findings in response to questions relating to the effectiveness and clarity of the month-end visual process control board
When asked how effective the month-end visual process control board was the respondent
deemed the use of the month-end visual process control board to be effective. “It has given an
early warning of delay, and increased efficiencies as people can plan what needs to happen in the
right sequence”. The respondent also stated that it has facilitated the building of cross functional
knowledge between operation and shared services teams.
In response to the questions on the clarity of the month-end activities, activity sequencing
and status of each activity the respondent stated that the month-end activities and the status of
activities are now clear, “each person knows what their key deliverables are and each milestone
has an identified owner to each activity”. The sequence of activities was rated as ‘very clear’,
which was not previously the case. “The current process is much more efficient”.
In response to rating the overall experience of the introduction of visual process controls in
their finance environment the respondent thought it was good there being clear understanding of

61
the dependencies, better and improved readiness for the cost reviews, and improved efficiency of
the close cycle time by moving tasks earlier had been instrumental in its success.
Calculation of Scoring for Effective Rating for Respondent E
Question Score Adjustment Total
11 15 N/A 15
12 20 0 20
13 20 0 20
14 15 0 15
16 15 N/A 15
Total 85
Table 10
The calculation of the score for respondent E (as illustrated by Table 10) which is used to deem the
month-end visual process control board as an effective process improvement tool for an
accounting department environment is 85. Therefore, based on the criteria outlined in the
Research Methodology chapter, the visual process controls that are in use in the Grange Castle and
Newbridge accounting departments are an effective process improvement tool for an accounting
department environment.
62
4.7 Participant ‘F’ and summary of Visual Process Controls findings
Participant F was based at the Newbridge facility and is a member of the Finance Operations
team. The respondent has previous knowledge of Lean Six Sigma and its use within the
organisation. The respondent was fully aware of the implementation of Visual Process Control
board for month-end accounting activities. They had previously used them in another organisation,
rating them as very good.
4.7.1 Findings in response to questions relating to the impact of introducing Visual Process Controls
In response to the question on the impact on the month-end process, the respondent stated
positive impacts included deadlines being known for all activities; bottlenecks had been removed
from the process; there was increased ownership by the whole team resulting in greater
accountability. The candidate said that “people are now aware of who they are impacting where
delays occur”. Having the bottlenecks removed had the greatest positive impact for this candidate.
This candidate saw only one negative impact initial fear of the introduction of the month-end
Visual Process Control board.
In response to the question on the impact on the finance leadership team, the respondent
deemed that positive impacts included the leadership team being more aware of who the bottleneck
holders are; the process for them has become much clearer; decisions are being made sooner and
activities have been moved earlier which is perceived as having the largest positive impact. This
candidate saw negative impacts, which included conflicting priorities during the implementation
phase which is perceived as having the largest negative impact and the process was also launched
at a time of high stress due to operation review and budgeting meetings.
In response to the question on the impact on the finance team, the respondent said positive
impacts included an improved morale as “everyone was now on the same page” and everyone’s
role is now clear as it is visible on the month-end visual process control board, which is seen as
having the greatest positive impact. This candidate saw only one negative impact as the deadlines
resulted in some individuals being busier.

63
In response to the question on the impact on team behaviours, the respondent stated positive
impacts included an improved ownership of each task/activity by individuals, which is seen as
having the largest positive impact. Individuals are also open to answering questions relating to
these tasks/activities and peer pressure is playing an active role in making sure timelines are
adhered to. This candidate saw no negative impact.
In response to the question on the impact on tools, systems or processes, the respondent
deemed positive impacts included some of the reconciliation process moving from a centralised
corporate area to being controlled at the local site, which allowed this part of the process to be
completed one day earlier. Also, the inventory reserve process starts earlier and finishes one day
earlier as bottlenecks in the process have been removed and a new streamlined data gathering
process has been put in place which is seen by this candidate as having the greatest positive impact.
This candidate saw no negative impact.
In response to the question on the impact on team communication, the respondent said positive
impacts include improved discussions by larger pools of colleagues on all areas of the month-end
process which is also perceived as having the greatest positive impact; there is better transparency
in the financial accounts as the information is better understood; the personal development of each
person has improved as they become more informed about the other areas; and the status of the
month-end is much clearer for management as they can review the colour coding on the control
board. This candidate saw no negative impact.
4.7.2 Findings in response to questions relating to the effectiveness and clarity of the month-end visual process control board
When asked how effective the month-end visual process control board proved to be the
respondent deemed the use of the month-end visual process control board to be very effective. The
respondent stated that the process has become much clearer and has ensured timeliness with no
rush thus ensuring more time for the analysis of data.
In response to the questions on the clarity of the month-end activities, activity sequencing,
and status of each activity the respondent stated that the month-end activities are now clear which
was not the case prior to documenting the process on the month-end visual process control board.
The sequence of activities was rated as “very clear” as “the process is up on the wall”.

64
In response to rating the overall experience of the introduction of visual process controls in
their finance environment the respondent acknowledged it was very good, and that it was the
transparency of the process and the ownership which were key to its success.
Calculation of Scoring for Effective Rating for Respondent F
Question Score Adjustment Total
11 20 N/A 20
12 20 0 20
13 20 0 20
14 15 0 15
16 20 N/A 20
Total 95
Table 11
The calculation of the score for respondent F (as illustrated by Table 11) which is used to deem the
month-end visual process control board as an effective process improvement tool for an
accounting department environment is 95. Therefore, based on the criteria outlined in the
Research Methodology chapter, the visual process controls that are in use in Grange Castles and
Newbridges accounting departments are an effective process improvement tool for an accounting
department environment.

65
4.8 Participant ‘G’ and summary of Visual Process Controls findings
Participant G was based at the Newbridge facility and is a member of the Finance Operations
team. The respondent has previous knowledge of Lean Six Sigma and its use within the
organisation. The respondent was fully aware of the implementation of Visual Process Control
board for month-end accounting activities and had previously used it in another company, Pioneer
Management. The participant rated its use in Pioneer as good.
4.8.1 Findings in response to questions relating to the impact of introducing Visual Process Controls
In response to the question on the impact on the month-end process, the respondent stated
positive impacts included being able to readily see how the month-end is progressing; the impact
of the Visual Process Control board on focusing everyone on the month-end activities and the
reduction in time it was previously taking to carry out the close activities. The reduction in cycle
time was seen as having the largest impact. This candidate acknowledged only one negative impact
in that there was less flexibility for individuals where month-end was not their only priority.
In response to the question on the impact on the finance leadership team, the respondent said
positive impacts included the leadership team having more time as they don’t need to check on the
status of tasks being done as there is a visual log, and there is a positive external impact as the
close is completed quicker from a corporate stance which is seen as having the largest positive
impact. This candidate saw no negative impacts.
In response to the question on the impact on the finance team, the respondent stated positive
impacts included an increased focus and collaboration among the finance team which is seen as
having the largest positive impact; more consideration of the effect on colleagues if late and also
getting the job done right the first time. This candidate saw only one negative impact in that it can
put pressure on individuals where there are competing priorities.
In response to the question on the impact on team behaviours, the respondent thought positive
impacts included there being a new feeling of empowerment for team members. The colour coding
process for updating the status of activities on the month-end visual process control board has had

66
the unusual effect of improving camaraderie and team bonding, which is also perceived as having
the greatest positive impact. Individuals are clearly displaying more focus in their specific tasks
and deliverables and the team is continuing to improve the process over time. This candidate saw
no negative impacts.
In response to the question on the impact on tools, systems or processes, the respondent stated
positive impacts included having an early warning system of potential impacts; the process has
been visualised which helps identifying areas for improvement, which in turn encourages the team
to carry out continuous improvement activities. This is also seen as having the greatest positive
impact. This candidate saw no negative impact.
In response to the question on the impact on team communication, the respondent said positive
impacts included horizontal positive work encouragement from colleagues, which is perceived as
having the largest positive impact, and a decrease in the amount of vertical communication from
management. This candidate saw no negative impact.
4.8.2 Findings in response to questions relating to the effectiveness and clarity of the month-end visual process control board
When asked how effective the month-end visual process control board was the respondent
deemed the use of the month-end visual process control board to be effective, “has done what it
was intended to do by streamlining and reducing time of the month end process”. The respondent
also stated that it is better than in their previous company, and they would have rated it as ‘very
effective’ if more time was spent on continuous improvement activities.
In response to the questions on the clarity of the month-end activities, activity sequencing
and status of each activity the respondent stated that the month-end activities and status of
activities are clear, which prior to using the visual process controls they were not. The sequence of
activities is “very clear” now “the visual process control board is split by day and hour with the
description and owner of each activity displayed”. The respondent also stated “there can be a two
hour time delay on the board being updated with the colour code status; it is rather batch than real
time”.

67
In response to rating the overall experience of the introduction of visual process controls in
their finance environment the respondent said it was good as “it is doing what it was intended to
do”. The respondent stated it was not given a “very good” rating as there was not enough time
spent on continuous improvements.
Calculation of Scoring for Effective Rating for Respondent G
Question Score Adjustment Total
11 15 N/A 15
12 20 0 20
13 20 0 20
14 15 0 15
16 15 N/A 15
Total 85
Table 12
The calculation of the score for respondent G (as illustrated by Table 12) which is used to deem
the month-end visual process control board as an effective process improvement tool for an
accounting department environment is 85. Therefore, based on the criteria outlined in the
Research Methodology chapter, the visual process controls that are in use in the Grange Castle and
Newbridge accounting departments are an effective process improvement tool for an accounting
department environment.
68
4.9 Participant ‘H’ and summary of Visual Process Controls findings
Participant H was based at the Grange Castle facility and is a member of the Finance Shared
Services team. The respondent has no previous knowledge of Lean Six Sigma and its use within
the organisation. The respondent was fully aware of the implementation of Visual Process Control
board for month-end accounting activities.
4.9.1 Findings in response to questions relating to the impact of introducing Visual Process Controls
In response to the question on the impact on the month-end process, the respondent stated
positive impacts included people have a better understanding of who is doing what; improved
timing of activities due to this visibility which is seen as having the greatest positive impact; and
giving the Finance Leadership team an overview of the status of month-end without having the
need for update meetings. This candidate saw only one negative impact in that sometimes issues
arise which impact the completion of tasks, so giving a poor perception of the individual even if
the delay is totally out of their control.
In response to the question on the impact on the finance leadership team, the respondent saw
positive impacts in the leadership team being able to get an overview status without having to
consume time with update meetings. This candidate saw one negative impact in that the leadership
team presume that time lines should be met as per month-end Visual Process Control board
regardless of issues arising.
In response to the question on the impact on the finance team, the respondent said positive
impacts included improved interaction among team members which is seen as having the greatest
positive impact, and that dependency and linkages of activities are clearly understood. This
candidate saw no negative impact.
In response to the question on the impact on team behaviours, the respondent stated positive
impacts include improved collaboration among team members which is also seen as having the
greatest positive impact, and improved communication as everyone can see the current status and
what is next to be tackled. This candidate saw no negative impact.

69
In response to the question on the impact on tools, systems or processes, the respondent
perceived no positive impact and highlighted it as a negative impact of seeing no positive impacts!
In response to the question on the impact on team communication, the respondent saw positive
impact in that the status of month-end can be viewed by all via the control board and negative
impact in having the status meetings which the candidate feels is unnecessary.
4.9.2 Findings in response to questions relating to the effectiveness and clarity of the month-end visual process control board
When asked how effective the month-end visual process control board was the respondent
deemed the use of the month-end visual process control board to be effective. The respondent
stated that it is good to have the timelines set but that it will not work in all instances. Also, the
respondent felt that the visual signal that the process is late leads to frustration in that the
individual maybe being perceived negatively. The respondent also felt that the month-end process
was very rigid with a need for more flexibility built in.
In response to the question on the clarity of the month-end activities, activity sequencing, and
status of each activity the respondent stated that the month-end activities are now clear “as they
are set out on the visual process control board so everyone knows what to expect”. The respondent
said that the sequencing of activity was “very clear” as there is now visibility of the process. The
status of each activity was rated as clear and “not rated ‘very clear’ as it is not updated in a timely
manner. So individuals can be distracted and not update a completed task until a number of hours
later”.
In response to rating the overall experience of the introduction of visual process controls in
their finance environment the respondent said it was good. However, the candidate perceives a
number of drawbacks which include timelines being set which in some cases are not achievable;
visual signal that process is late leads to frustration that you are being perceived negatively and it
is very rigid. More flexibility is needed in the month-end process.

70
Calculation of Scoring for Effective Rating for Respondent H
Question Score Adjustment Total
11 15 N/A 15
12 20 0 20
13 20 0 20
14 15 0 15
16 15 N/A 15
Total 85
Table 13
The calculation of the score for respondent H (as illustrated by Table 13) which is used to deem
the month-end visual process control board as an effective process improvement tool for an
accounting department environment is 85. Therefore, based on the criteria outlined in the
Research Methodology chapter, the visual process controls that are in use in the Grange Castle and
Newbridge accounting departments are an effective process improvement tool for an accounting
department environment.

71
4.10 Participant ‘I’ and summary of Visual Process Controls findings
Participant I was based at the Grange Castle facility and is a member of the Finance Shared
Services team. The respondent has no previous knowledge of Lean Six Sigma and its use within
the organisation. The respondent was fully aware of the implementation of Visual Process Control
board for month-end accounting activities.
4.10.1 Findings in response to questions relating to the impact of introducing Visual Process Controls
In response to the question on the impact on the month-end process, the respondent stated
positive impacts included a better understanding of each colleague’s role within the month-end
process and their busy time points; having a better perspective of people’s pressures makes it
easier to arrange meetings during “idle time”; and having a better overview of their own
deliverables and team deliverables was seen as having the greatest positive impact. This candidate
saw only one negative impact in that there was too much time taken up “standing around the
Visual Process Control board discussing issues”, which the candidate felt could be done as a walk
around.
In response to the question on the impact on the finance leadership team, the respondent
perceived no positive impacts. This candidate saw only one negative impact as there is no
apparent change.
In response to the question on the impact on the finance team, the respondent stated positive
impacts included colleagues taking into account the work load of others and not interrupting them
during this time and there have been efficiencies gained through the various process improvements
and publishing of the schedule. This candidate saw only one negative impact the perception that it
has helped operations more than shared services.
In response to the question on the impact on team behaviours, the respondent said positive
impacts included colleagues being more conscious of others’ pressures at particular time points,
also the understanding of the various stress points in a person’s day has resulted in an air of
“understanding” when there is an issue, which is also seen as having the greatest positive impact.

72
This candidate saw only one negative impact which is the “over enthusiasm of the process
champion” when other colleagues are stressed.
In response to the question on the impact on tools, systems or processes, the respondent saw no
positive impact as the activity had already begun when they started their role.
In response to the question on the impact on team communication, the respondent perceived a
positive impact in the improved horizontal communication within the operations team which gave
a better understanding of when information would be ready. This candidate saw a negative impact
in that there was no effect on vertical communication.
4.10.2 Findings in response to questions relating to the effectiveness and clarity of the month-end visual process control board
When asked how effective the month-end visual process control board was the respondent
deemed the use of the month-end visual process control board to be effective. “It has brought the
team into a more synchronised state as there is a better understanding of the various roles with the
group and less duplication of effort”.
In response to the questions on the clarity of the month-end activities, activity sequencing,
and status of each activity the respondent noted that the month-end activities are now clear as
there is “very good visibility of the daily deliverables and the final target”. The sequence of
activities was rated as “very clear” as “there are arrows linking the sequence on chart with start and
finish time which is updated monthly”. The candidate said that the status of activities is clear as
“90% are clear, 10% not clear due to late updating by some people”.
In response to rating the overall experience of the introduction of visual process controls in
their finance environment the respondent thought it was good as there is a better understanding
of the month-end process. The respondent stated it was not rated as “very good” because there are
still inefficiencies in the process, e.g. some activities being unnecessary and ineffective. Also,
issues flagged up to management are not actioned due to limited resources.

73
Calculation of Scoring for Effective Rating for Respondent I
Question Score Adjustment Total
11 15 N/A 15
12 20 0 20
13 20 0 20
14 15 0 15
16 15 N/A 15
Total 85
Table 14
The calculation of the score for respondent I (as illustrated by Table 14) which is used to deem the
month-end visual process control board as an effective process improvement tool for an
accounting department environment is 85. Therefore, based on the criteria outlined in the
Research Methodology chapter, the visual process controls that are in use in the Grange Castle and
Newbridge accounting departments are an effective process improvement tool for an accounting
department environment.

74
4.11 Participant ‘J’ and summary of Visual Process Controls findings
Participant J was based at the Newbridge facility and is a member of the Finance Shared Services
team. The respondent has previous knowledge of Lean Six Sigma and its use within the
organisation’s accounting departments. The respondent was fully aware of the implementation of
Visual Process Control board for month-end accounting activities, and had previously used it in
another organisation, Shell. It was used to support month-end processes, SOX controls and balance
sheet reconciliation processes.
4.11.1 Findings in response to questions relating to the impact of introducing Visual Process Controls
In response to the question on the impact on the month-end process, the respondent stated
positive impacts included increased frequency of meeting deadlines; clear ownership of parts of
the process which had previously been unclear and the new structure around month-end activities
and their linkages had been perceived as having the largest positive impact. This candidate saw a
negative impact in that not everyone has bought into the process and that the process is not as good
as it could be because there is no individual owner driving it.
In response to the question on the impact on the finance leadership team, the respondent
perceived no positive impacts. This candidate saw a negative impact in that the Leadership Team
are not focused on specific deadlines, just on month-end time lines overall.
In response to the question on the impact on the finance team, the respondent said positive
impacts included each person being accountable for their tasks within the process as the tasks have
now been assigned owners and that there is now an environment of clear deadlines so that
colleagues are not held up by others. This is also seen as having the greatest positive impact. This
candidate saw no negative impact.
In response to the question on the impact on team behaviours, the respondent saw positive
impacts in improved collaboration and co-operation, and a better understanding of how each team
member fits into the month-end process. This is perceived as having the greatest positive impact.
Also, this candidate perceived that new discussions around the process occur which is very

75
different from the past – questions are being asked “can we change this”, “can we improve…” and
“can we be better at…”. This candidate saw no negative impact.
In response to the question on the impact on tools, systems or processes, the respondent stated
positive impacts included the documenting of the beginning to end high level month-end process
with documented owners of tasks. Some activities got moved out of the busy month-end period
which gave time back to some colleagues at this critically busy time period. This candidate saw no
negative impacts.
In response to the question on the impact on team communication, the respondent noted
positive impacts included all colleagues understanding each other’s role in the month-end process;
there is now visual communication via the control board which didn’t exist before; constructive
communication among team members which also was not the case before; and this candidate
perceived an indirect impact from the various forms of communication in that the attitude within
the department had changed form “it will take six days to close” to “we will close in four”. This
candidate saw one negative impact as there is no post month-end review of how the close went –
“there is no post-mortem of last month’s close”.
4.11.2 Findings in response to questions relating to the effectiveness and clarity of the month-end visual process control board
When asked how effective the month-end visual process control board was the respondent
deemed the use of the month-end visual process control board to be effective. The respondent
stated that deadlines are now being met, and that it would have been rated at “very effective” if
there was a status meeting every day.
In response to the question on the clarity of the month-end activities, activity sequencing and
status of each activity the respondent said that the month-end activities and the activity status are
now clear. The sequence of activities was rated as “very clear” as a result of having the visual
process control board.
In response to rating the overall experience of the introduction of visual process controls in
their finance environment the respondent stated it was very good as there was now ownership,

76
accountability and a visual aspect to the month-end process which has promoted discussion and
adoption of best practice.
Calculation of Scoring for Effective Rating for Respondent J
Question Score Adjustment Total
11 15 N/A 15
12 20 0 20
13 20 0 20
14 15 0 15
16 20 N/A 20
Total 90
Table 15
The calculation of the score for respondent J (as illustrated by Table 15) which is used to deem the
month-end visual process control board as an effective process improvement tool for an
accounting department environment is 90. Therefore, based on the criteria outlined in the
Research Methodology chapter, the visual process controls that are in use in the Grange Castle and
Newbridge accounting departments are an effective process improvement tool for an accounting
department environment.

77
4.12 Participant ‘K’ and summary of Visual Process Controls findings
Participant K was based at the Grange Castle facility and is a member of the Finance Operations
team. The respondent has no previous knowledge of Lean Six Sigma and its use within the
organisation. The respondent was fully aware of the implementation of Visual Process Control
board for month-end accounting activities.
4.12.1 Findings in response to questions relating to the impact of introducing Visual Process Controls
In response to the question on the impact on the month-end process, the respondent stated
positive impacts included being able to see when individuals are getting the job done; who is
carrying out each activity (seen as having the largest positive impact) and improvements in the
process. This candidate saw negative impacts in that it is not taken seriously by everyone and
individuals overlap their times on tasks with no regard as to the impact on others. The perception
of no buy-in of the process with the Finance Leadership team is seen as having the largest negative
impact.
In response to the question on the impact on the finance leadership team, the respondent
perceived no positive impact. This candidate saw negative impacts in that the month-end visual
process control board has had no impact on the leadership team and that the candidate perceives
the leadership team are not driving the process which is perceived to be having the largest negative
impact.
In response to the question on the impact on the finance team, the respondent said positive
impacts include being able to get a quick visual ‘heads up’ on the status of month-end which this
candidate perceives as giving the greatest positive impact; the team as a whole are now aligned in
meeting the month-end schedule; there is improved team morale. This candidate saw no negative
impact.
In response to the question on the impact on team behaviours, the respondent stated positive
impacts include the majority of the team taking it seriously and encouraging each other and more
respect by individuals of the dependent time lines of their colleagues which is seen as having the

78
greatest positive impact. This candidate perceives only one negative impact which is the lack of
engagement by the Finance Leadership team.
In response to the question on the impact on tools, systems or processes, the respondent
noticed no positive impact, but perceived two negative impacts: i.e. seeing no process
improvements being the significant negative impact and the perception of only time lines being
juggled.
In response to the question on the impact on team communication, the respondent stated
positive impacts include an improvement in communication due to the visualisation of the process
and its status and the horizontal encouragement amongst colleagues. Also, it is now easy to see if
some one is struggling so help can be sourced which is perceived as having the greatest positive
impact. This candidate has seen a number of negative impacts as vertical communication has
deteriorated as the leadership team view the tracker for status updates, but they do not enforce it or
use it as an improvement tool.
4.12.2 Findings in response to questions relating to the effectiveness and clarity of the month-end visual process control board
When asked how effective the month-end visual process control board was the respondent
deemed the use of the month-end visual process control board to be effective. “Weaknesses and
problem areas that are highlighted are not reviewed by management at a review of the previous
month-end meeting”.
In response to the questions on the clarity of the month-end activities, activity sequencing,
and status of each activity the respondent thought that the month-end activities, activity
sequencing to be clear and very clear respectively, but that they were in this state prior to using the
visual process control board because of the respondents’ experience in the process and the business.
However, the respondent has rated the status of activities as being now clear, which is being
facilitated by the visual process control board.
In response to rating the overall experience of the introduction of visual process controls in
their finance environment the respondent stated it was neutral. “The visual process control board

79
is good, but poor in the fact it hasn't driven home improvements because senior management don't
take too much notice of it or they feel it is a substitute for them”.
Calculation of Scoring for Effective Rating for Respondent K
Question Score Adjustment Total
11 15 N/A 15
12 20 -20 0
13 20 -20 0
14 15 0 15
16 0 N/A 0
Total 30
Table 16
The calculation of the score for respondent K (as illustrated by Table 16) which is used to deem
the month-end visual process control board as an effective process improvement tool for an
accounting department environment is 30. Therefore, based on the criteria outlined in the
Research Methodology chapter, the visual process controls that are in use in the Grange Castle and
Newbridge accounting departments are not an effective process improvement tool for an
accounting department environment.

80
4.13 Participant ‘L’ and summary of Visual Process Controls findings
Participant L was based at the Grange Castle facility and is a member of the Finance Leadership
team. The respondent has no previous knowledge of Lean Six Sigma and its use within the
organisation’s accounting departments. The respondent was fully aware of the implementation of
Visual Process Control board for month-end accounting activities.
4.13.1 Findings in response to questions relating to the impact of introducing Visual Process Controls
In response to the question on the impact on the month-end process, the respondent said
positive impacts included the team hitting their targets and being more accountable. The process
and the critical path being better understood by the team are perceived as having the greatest
impact, bottlenecks and unnecessary activity being removed and workload being distributed more
evenly throughout the team. This candidate saw no negative impacts.
In response to the question on the impact on the finance leadership team, the respondent
perceived positive impacts on the leadership team as they now have a better understanding of the
end to end flow; better decisions can be made on what needs to be done which is also perceived as
having the greatest positive impact, and it allows the leadership team to challenge the status quo.
This candidate saw no negative impacts.
In response to the question on the impact on the finance team, the respondent stated positive
impacts included giving individuals more ownership of their own deliverables; individuals can see
that they are part of a team and not to have their own agendas which is seen as having the greatest
positive impact; workload is better balanced across the team and teamwork has improved. Also
individuals have a clearer understanding of what is expected of them. This candidate saw one
negative impact which is that having regimented time deliverables puts pressure points that at
times are unnecessary.
In response to the question on the impact on team behaviours, the respondent noted that
positive impacts included the team being more focused on activities due to better prioritization and
individuals are work balancing which didn’t happen before, this is also seen as having the greatest

81
positive impact. This candidate saw one negative impact in that no one has voiced the fact that
schedule times are not static and need to be amended each month.
In response to the question on the impact on tools, systems or processes, the respondent
noticed two positive impacts: the process being changed and improved, and the investigation of
getting certain processes automated. This candidate perceived no negative impact.
In response to the question on the impact on team communication, the respondent said positive
impacts include the status of the various tasks being visual which is perceived as having the
greatest positive feedback. If there is an issue colleagues can direct it to management, and the chart
now creates a centre point for the status check meeting, which now occurs on a by exception basis.
This candidate saw no negative impact.
4.13.2 Findings in response to questions relating to the effectiveness and clarity of the month-end visual process control board
When asked how effective the month-end visual process control board was the respondent
deemed the use of the month-end visual process control board to be effective. “It's one of a number
of initiatives to get from seven day to five day close. It has been a clear enabler, drives behaviour,
responsibility, attitudes and visualises the critical path and road blocks. It has also improved
communication, and is also a tool that is used for process and system improvement”.
In response to the question on the clarity of the month-end activities, activity sequencing, and
status of each activity the respondent stated that the month-end activities are now clear as “there
is a visible tracker and is understood to the right detail as before there was a too detailed checklist
with one hundred and fifty lines”. The sequence and the status of activities have been rated as very
clear, which was not the case prior to the use of the visual process control board.
In response to rating the overall experience of the introduction of visual process controls in
their finance environment the respondent said it was good. The respondent also said that the
month-end visual process control board “hasn't resolved specific issues but is an enabler to identify
activities, resources, people, the critical path and process improvements”.

82
Calculation of Scoring for Effective Rating for Respondent L Question Score Adjustment Total
11 15 N/A 15
12 20 0 20
13 20 0 20
14 20 0 20
16 15 N/A 15
Total 90
Table 17
The calculation of the score for respondent L (as illustrated by Table 17) which is used to deem the
month-end visual process control board as an effective process improvement tool for an
accounting department environment is 90. Therefore, based on the criteria outlined in the
Research Methodology chapter, the visual process controls that are in use in the Grange Castle and
Newbridge accounting departments are an effective process improvement tool for an accounting
department environment.

83
4.14 Conclusion
This chapter examined the responses relating to the research objectives; exploring the impact of
introducing visual process controls on an accounting department’s month-end processes and
ascertaining if visual process controls that are in use in the accounting departments provides clarity
of use and clarity of process, and if the month-end visual process control board is an effective
process improvement tool for an accounting department environment. This was based on questions
derived from the literature review and asked to twelve respondents from a finance department. The
respondents were selected for the research based on the following common factors:
1. The respondents are accountants whose main place of work is located at Pfizer’s Grange
Castle and/or Newbridge sites.
2. All twelve respondents who participate in the accounting month-end activities and were
present in the company prior to the introduction of the month-end visual process control
board which facilitates views prior to and post implementation.
From what was discussed in this chapter the perception of the impact of the introduction of the
month-end visual process control board is favourable. The researcher found that there were a low
proportion of the respondents who did not see positive impacts. The respondents that experienced
the positive impacts articulated a general theme of negative impacts which included:
1. No apparent process owner and driver on the finance leadership team
2. Lack of a cohesive structure around the meetings to support and improve the control board,
such as the morning ‘status check’ and a post-mortem style review
3. Varying degrees of acceptance and adoption of the month-end activity process control
board among team members and the leadership team
Also, from what was discussed in this chapter there is a general positive perception that visual
process controls provides clarity of use and process, and are an effective process improvement tool
for an accounting department environment.
These views and opinions will be further explored and elaborated on in the next chapter,
Conclusions and Further Research.

84
5 Conclusions and Further Research
5.1 Introduction
The objective of this chapter was to draw conclusions from the findings and make
recommendations for further research.
The literature review has given an overview of where the Visual Process Control tool fits into the
wider programs of Lean, Lean Thinking and Lean Six Sigma. It has also highlighted that there is a
lack of research in the use of the Visual Process Controls in an accounting environment.
5.2 Focus of Research
The research was carried out to better understand the use of Lean, Lean Thinking, Lean Six Sigma
and their associated tools. The author then focused on one of these tools, Visual Process Controls,
and how it impacts on a finance environment.
While there is a large amount of research on Lean, Lean Thinking, Lean Six Sigma and how
Visual Process Controls function in a manufacturing environment, there is a lack of research on its
application in an accounting or administrative environment. Therefore, the focus of this
dissertation was to gain an understanding of how well the Lean Six Sigma tool, Visual Process
Control, could be applied effectively in an accounting environment.
5.3 Assessment of Research to Objective One
Research Objective One was to explore the impact of introducing visual process controls on
Grange Castle and Newbridge accounting departments’ month-end processes. Research
questions were focused on getting the answer to this research objective in six distinct areas
which have been summarised below:
• The month-end process
The visual process control has made the month-end process visible, along with the task
interdependencies and owners, which in turn has raised awareness thus forcing people to
meet their objectives as deadlines are now known in advance. This has enabled improved

85
communication to the entire team and management resulting in efficiencies being realised
as there is no duplication of effort, bottlenecks being removed and work load more evenly
distributed. There is also more awareness of the stresses and strains that colleagues are
under resulting in more consideration being given.
• The finance leadership team
The leadership team are now aware of the scale and obstacles of all the activities, and the
individual effort that has to occur. This has resulted in more focus being placed on the
month-end activities by the leadership team which has allowed them to challenge the status
quo, and it has allowed decisions to be made earlier. Status of month-end can be viewed
easily which reduces meetings and assists adhering to tighter reporting deadlines.
• The finance team
Colleagues are working better as a team, are now more accountable and have become very
proactive in making sure that their deliverables are on time. This is a result of everyone
being aware of the schedule and the knock-on effect of being late. Morale has improved as
it is now much easier to get an overall status of month-end without having a meeting and
colleagues are much more aware of being part of a team.
• Team behaviours
There is a greater effort by the owners to get their tasks completed by the documented time
line which has resulted in a drop in the number of delays; better prioritization, individuals
work balancing and positive peer pressure are all playing a part in this success. Atmosphere
has improved in office which can be seen with the light-hearted “banter”, camaraderie and
team bonding particularly evident while colleagues update the control board. Colleagues
are more prepared for key meetings and status checks, and there is a definite sense of
improved collaboration and co-operation.
• Tools, systems or processes
The process, problems and issues are highlighted visually on the control board and are also
used as an early warning system. Specific process improvements have taken place and
there have been a number of successful streamlining activities for some of the accrual
journals. One of the centralised reconciliation processes has moved to being locally

86
controlled which has allowed the task to complete one day earlier. The inventory reserve
process has also seen improvements on completion time while some processes are being
investigated for automation.
• Team communication (Horizontal and/or Vertical)
The control board has assisted the finance leadership team and the finance team in getting
visual status updates of the month-end closing activities at a glance. It is easy to see if
someone is struggling so that help can be sourced. It has also promoted open discussion on
missed or late tasks and the attendant reasons which has prompted future improvements.
Knowledge sharing by team members has increased which gives a better holistic
understanding of the process to all. Colleagues are also engaging in greater communication
with one another (horizontal) as they are clear who their suppliers and customers are. The
month-end morning status check has given everyone the opportunity to voice concerns and
raise issues.

87
5.4 Assessment of Research to Objective Two
Research Objective Two was to ascertain if Visual Process Controls that are in use in the
Grange Castle and Newbridge accounting departments provide clarity of use and clarity of
process, and if the month-end visual process control board is deemed an effective process
improvement tool for an accounting department environment. The wording of these questions
relating to this research objective establishes the process status prior to and post
implementation of the month-end visual process control board.
The data from twelve respondents has been used in this study. The findings on the use of
Visual Process Controls within an accounting department environment being an effective
process improvement tool have been summarised in Table 18. They show that two of the
twelve respondents or 17% deem their use to be not an effective tool in this environment,
while ten or 83% have deemed their use to be effective. The scoring method used is that
which has been detailed in the research methodology chapter of this dissertation.
Effective Rating for the use of Visual Process Controls
Respondent Effective Rating Score Deemed Effective*
A 85 Yes
B 45 No
C 65 Yes
D 75 Yes
E 85 Yes
F 95 Yes
G 85 Yes
H 85 Yes
I 85 Yes
J 90 Yes
K 30 No
L 90 Yes
Average 76.3 Yes
* Greater than 60 is deemed effective Table 18

88
Visual Process Controls being deemed effective in an accounting environment, in this
dissertation, supports Liker (1997) who stated that visual controls provide employees and
managers with simple but effective ways of understanding current working conditions, which
allow for corrective actions to be taken.
The average effective score based on the 12 respondents is 76.3. Taking a holistic view of the
data for this study the researcher deems the use of Visual Process Controls within an
accounting department environment to be an effective process improvement tool. These
findings support Dinero (2005) who stated that Lean Thinking has changed the focus of
improvement processes from manufacturing areas to the whole organisation – i.e. a finance
department.
Research questions were focused on getting the answer to this research objective in three
distinct areas:
• How effective the month-end activity process control board was
Respondent G said it “has done what it was intended to do by streamlining and reducing
time of the month end process”
• The clarity of the month-end activities, activity sequencing, and status of each
activity
• Overall experience of using Visual Process Controls
Respondent E observed it was good there being clear understanding of the dependencies, better
and improved readiness for the cost reviews, and improved efficiency of the close cycle time
by moving tasks earlier had been instrumental in its success.
Table 19 is a summary of the average results for each of these questions. It is clear from these
findings that there are two areas which are achieving below average results. These areas are
the status of each activity, and the overall experience of the introduction of Visual Process
Controls.

89
Summary of Scores for Individual Questions
Question Average Score Maximum Score attainable
11 15.8 20
12 16.7 20
13 17.1 20
14 12.9 20
16 13.8 20
Average 15.3 20
Table 19
Question 14 referring to ‘Status of each activity’
The low rating in this area equates to two respondents (C and D) giving a rating of neutral, a score
of zero, as they perceived the status of each activity as unclear which was also the case prior to the
implementation of the month-end visual process control board.
Candidate C responding to the question on the clarity of status said that “chart (visual process
control board) being updated with the process in green was after the fact”, while Candidate D said
that they rely “on verbal communication” which is what had been done by the respondent prior to
the implementation of the visual process control board.
Question 16 referring to ‘Overall experience’
The low rating for this area also equates to two respondents (B and K) giving a rating of
neutral, a score of zero. Candidate B said that “we can do a lot more with visual process
controls”, while candidate K observed that “the visual process control board is good, but poor
in the fact it hasn't driven home improvements because senior management don't take too
much notice of it or they feel it is a substitute for them”.

90
5.5 Candidate observations requiring further analysis
Some negative impacts relating to the use of Visual Process Controls have been perceived by most
of the candidates, they include:
• Individual behaviour relating to month-end visual process control board
o initial fear
o buy in
o level of engagement
o resistance to change
• Individual perception when task is late
o Goal more important than concerns raised
• Formalised framework to support the process
o Management ownership of process
o Meetings, status, actions and review points are not published, adhered to or
followed up
No documented mission or rules of engagement for each of the above style
meetings
o Visual Process Control board should be continuously developed so that it does not
become a picture/redundant
o Continuous review of hours being worked by all colleagues
o Rate of business change
• Lack of flexibility for individuals where month-end is not their only priority
• Be mindful of launch time of a new process
• Vertical communication has suffered since its introduction
Having reviewed these perceived negative impacts, and the genesis of each, the author has
concluded that they are not failings of the visual process control tool’s use within the accounting
environment, but rather the failing of an effective all encompassing framework to support the tool
in helping to continually improve and control the process that is clearly adding value based on the
respondents’ answers in this study.
The author will discuss further the above issues and deficiencies in the conclusions sub-section.
91
5.6 Conclusions
Within the primary research, the author was conscious of the need to extract some lessons from the
experience of the respondents on their use of the month-end visual process control board within an
accounting environment.
There is clear evidence, from the qualitative analysis of the respondents’ interview data and
quantitative scoring to deem if the tool’s use within an accounting environment is effective or not,
that there are beneficial impacts from its introduction and the tool is deemed effective for use
within an accounting department environment.
However, as outlined above, the documented issues and deficiencies that have been highlighted by
the respondents are the failings of not having an effective all encompassing framework to support
the tool. The author recommends that this core issue relating to having an all encompassing
framework be addressed by the finance leadership team. The other issues and deficiencies should
be worked on in project teams within both sites to seek remedies as they are merely serving as
barriers to even greater process improvements and savings for Pfizer.
5.7 Limitations of Research
The research findings have not been broken out for each organisation at Grange Castle or
Newbridge. This would be difficult with the current findings as some of the candidates have
experiences of using the month-end visual process control board at both sites.
Attempts were made to interview all of the colleagues in the accounting departments of both plants,
but based on the time constraints this proved to be very difficult to complete with conflicting work
demands and the rapidly changing environment that exists since the Pfizer acquisition of Wyeth.
Also, the researcher is not aware of any other Pfizer facility using Visual Process Controls in their
accounting departments, which is why the study was based on Grange Castle and Newbridge.

92
5.8 Further Research
The author feels that there is further study possible to get more specific information that is
suggested by the following criteria which would give more specific findings to the research
population:
• Results split per site
• Results split by team members and the leadership team
Unfortunately this proved impossible to do due to the time constraints on this research. An
interesting study could then be done to see if the clarity of use, and the effectiveness of the visual
process control board are at similar levels at both sites, and if not why. It would also show if there
are any major differences from the perspectives of the leadership and the finance team. This would
allow some understanding of best practice which could be applied across the two sites and possibly
even used as the basis of a project to eventually deploy across the entire network.
To gauge the success or failure of the Pfizer organisation’s use of the month-end Visual Process
Control board it would be very interesting to identify a similar organisation using Visual Process
Controls in their finance department so that a comparative study could be carried out which would
allow benchmarking of both organisations’ use of the tool.
Given the challenges that are faced by all financial and management accounting departments to
have their month-end results produced earlier and more efficiently, the information gained would
be well received by the industry, Lean Six Sigma bodies and other stakeholders.

93
References
Ackroyd, S. and Hughes, J. (1992) ‘Data Collection in Context’, Longman. Adams, G. & Schvaneveldt, J. (1991) ‘Understanding Research Methods’, 2nd Ed, Longman. Andersson, R., Eriksson, H. and Torstensson, H. (2006) ‘Similarities and differences between TQM, Six Sigma and Lean’, The TQM Magazine, 18(3), 282-296. Antony, J. (2006) ‘Six Sigma for Service Processes’, Business Process Management Journal, 12(2), 234-248. Bhuiyan, N. and Baghel, A. (2005) ‘An overview of continuous improvement: from the past to the present’, Management Decision, 43(5), 761-771. Black, J.T. and Hunter S.L. (2003) ‘Lean Manufacturing Systems and Cell Design’, Illustrated, SME. Becker, R.M., ‘Lean Manufactuing and the Toyota Production System’, Lean Management Institute Available at: http://www.leaninstituut.nl/publications/101207/Lean%20Manufacturing%20and%20the%20Toyota%20Production%20System.pdf [Accessed 18 July 2009] Bernard, H. R. (2006) ‘Research methods in Anthropology: Qualitative and Quantitative approaches’, 4th Ed, Illustrated, Rowman Altamira. Brunet, A.P., and New, S. (2003) ‘Kaizen in Japan: an empirical study’, International Journal of Operations & Production Management, 23(12), 1426 – 1446. Burgess, R.G. (1984) ‘The Research Process in Educational Settings: Ten Case Studies’, Taylor & Francis. Burton, D.M., and Bartlett, S. (2005) ‘Practitioner Research for Teachers’, Illustrated, Sage. Byrne, G., Lubowe, D., and Blitz, A. (2007) ‘Using a Lean Six Sigma approach to drive innovation’, Strategy & Leadership, 35(2), 5-10. Carson, D., Gilmore, A., Perry, C. and Gronhaug, K. (2001) ‘Qualitative Marketing Research’, Illustrated, Sage. Christensen E. H., Coombes-Betz, K.M. and Stein, M.S. (2007) ‘The Certified Quality Process Analyst Handbook’, Illustrated, American Society for Quality. Corbin, J.M., and Strauss, A.L. (2008) ‘Basics of Qualitative Research: Techniques and Procedures for Developing Grounded Theory’, 3rd Ed, Illustrated, Sage.
94
Delbridge, R. and Kirkpatrick, I. (1994) ‘Theory and practice of participant observation’, in Wass, V. and Wells, P. (Eds), Principles and Practice in Management and Business Research, Dartmouth, Aldershot, 35-62. Devane, T. (2004) ‘Integrating Lean Six Sigma and High-Performance Organisations’, Illustrated, John Wiley & Sons. Dinero, D.A. (2005) ‘Training within industry: the foundation of lean’, Illustrated , Productivity Press. Dennis, P. and Shook, J. (FRW) (2007) ‘Lean Production Simplified: A Plain Language Guide to the World's Most Powerful Production System’, 2nd Ed, Illustrated, Productivity Press. Deming, W.E. and Voehl, F. (1995) ‘Deming: The Way we Knew Him’, Illustrated, CRC Press LLC. Dey, I. (1993) ‘Qualitative Data Analysis’, Routledge. George, M.L. (2002) ‘Lean Six Sigma – Combining Six Sigma Quality with Lean Speed’, McGraw-Hill Professional. George, M.L. (2003) ‘Lean Six Sigma for Service: How to Use Lean Speed and Six Sigma Quality to Improve Services and Transactions’, Illustrated, McGraw-Hill Professional. George, M.L., Price, M., Rowlands, D. and Maxey, J. (2005) ‘The Lean Six Sigma Pocket Toolbook’, Illustrated, McGraw-Hill Professional. George, M., Rowlands, D. and Kastle, B. (2003) ‘What is Lean Six Sigma?’, McGraw-Hill Companies, New York, NY. Gill, J. and Johnson, P. (2002) ‘Research Methods for Managers’, Illustrated, 3rd Ed, Sage, 149. Graban, M. and Rona, J.M. (2008) ‘Lean Hospitals: Improving Quality’, Patient Safety, and Employee Satisfaction, CRC Press. Hanson, M.H. (1953) ‘Sample Survey Methods and Theory’, Volume 2, Wiley, 4. Healy, M.J. and Rawlinson, M.B. (1993) ‘Interviewing Business Owners and Managers: A review of Methods and Techniques’, Geoforum 24(3), 339-355. Hirano, H. (1994) ‘JIT Factory Revolution: A Pictorial Guide to Factory Design of the Future’, 7th Ed, Productivity Press. Imai, M. (1986) ‘Kaizen (Ky'zen): The Key to Japan's Competitive Success’, Random House Business Division. Irwin, J.D. (1997) ‘The Industrial Electronics Handbook’, Illustrated, CRC Press. Ishikawa, K. (1985) ‘What is Total Quality Control? The Japanese Way’, Illustrated, 6th Ed, Prentice-Hall.

95
Jackson, K. and Tomioka, M. (2004) ‘The Changing Face of Japanese Management’, Illustrated, Routledge. Jing, G.G. (2009) ‘A Lean Six Sigma BREAKTHROUGH’, Quality Progress, 42(5), 24-31. Kaufman Group White Paper (2000) ‘Integrating Lean and Six Sigma’. Kahn, R. and Cannell, C. (1957) ‘The Dynamics of Interviewing’, 4th Ed, Wiley. Kerlinger, F.N. (1986) ‘Foundations of Behavioral Research’, 3rd Ed, Holt, Rinehart and Winston. Kervin, J.B. (1999) ‘Methods for Business Research’, 2nd Ed, HarperCollins. Kogut, M. (1993) ‘Country Competitiveness: Technology and the Organising of Work’, Illustrated, Oxford University Press US. Krafcik, J. (1988) ‘Triumph of the Production System’, Sloan Management Review, 30(1), 41-52. Kubiak, T.M. and Benbow, D.W. (2009) ‘The Certified Six Sigma Black Belt Handbook’, 2nd Ed, American Society for Quality. Kumar, R. (2005) ‘Research Methodology: A Step-by-step guide for beginners’, 2nd Ed, Illustrated, Sage. Liebesman, S. (2009) ‘Dynamic Duo: Lean and Six Sigma Improve Profits and Customer Satisfaction’, Quality Progress, 42(3), 56-58. Lewis, W.E. (1998) ‘PDCA/Test’, Illustrated, CRC Press. Liker, J.K. (1997) ‘Becoming Lean: Inside Stores of U.S. Manufacturers’, Illustrated , Productivity Press. Liker, J.K. (2004) ‘The Toyota way: 14 management principles from the world's greatest manufacturer’, Illustrated, McGraw-Hill Professional. Locher, D. (2007) ‘Lean Lessons: In the Office: Where Lean and Six Sigma Converge’, Quality Progress, 40(10), 54-55. Locher, D. (2009) ‘Lean Thinking in the Office’, [pdf] Change Management Associates Available at: http://www.cma4results.com/LeanThinkingInTheOfficePrinting.pdf [Accessed 2 July 2009] Magnusson, K., Kroslid, D. and Bergman, B. (2003), ‘Six Sigma – The Pragmatic Approach’, Lund, Studentlitteratur. Mann, D. (2005) ‘Creating a Lean Culture: Tools to Sustain Lean Conversions’, Illustrated, Productivity Press.

96
Maskell, B.H. and Baggaley, B. (2003) ‘Practical Lean Accounting: A Proven System for Measuring and Managing the Lean Enterprise’, Illustrated, Productivity Press. McNabb, D.E. (2002) ‘Research methods in Public Administration and Non Profit Management’, Illustrated, M.E. Sharpe. McNiff, J. and Whitehead, J. (2000) ‘Action Research in Organisations’, Illustrated, Routledge. Murman, E.M. (2002) ‘Lean Enterprise Value: Insights from MIT’s Lean Aerospace Initiative’, Palgrave Macmillan. Nakajima, S. (1984) ‘Introduction to TPM’, Productivity Press, Portland, Oregon. Ohno, T. (1988) ‘Toyota Production System: Beyond Large Scale Production’, Illustrated, Productivity Press. Osada, T. (1991) ‘The 5S's: Five Keys to a Total Quality Environment’, Asian Productivity Organization. Pyzdek, T. (2003) ‘The Six Sigma Handbook’, McGraw-Hill, New York, NY. Rampersad, H.K. and El-Homsi, A. (2007) ‘TPS-Lean Six Sigma: Linking Human Capital to Lean Six’, Illustrated, IAP. Robson, C. (2002) ‘Real World Research: A Resource for Social Scientists and Practitioner-Researchers’, 2nd Ed, Illustrated, Wiley-Blackwell. Saunders, M., Lewis, P. and Thornhill, A. (2007) ‘Research Methods for Business Students’, 4th Edition, Prentice Hall. Sayer, N.J. and Williams, B. (2007) ‘Lean for Dummies’, For Dummies. Shingo, S. and Dillon, A.P. (1985) ‘A Revolution in Manufacturing: The SMED System’, Illustrated, Productivity Press. Silverman, D. (2006) ‘Interpreting Qualitative Data: Methods for analyzing Talk’, Text, and Interaction, 3rd Ed, Illustrated, Sage. Shirose, K. (1996) ‘TPM: New Implementation Program in Fabrication and Assembly Industries’, Japan Institute of Plant Maintenance. Smith, R. and Hawkins, B. (2004) ‘Lean maintenance: reduce costs, improve quality, and increase market share’, Illustrated, Butterworth-Heinemann. Suzuki, T. (1994) ‘TPM in process industries’, Illustrated, Productivity Press. Tapping, D. and Shuker, T. (2002) ‘Value Stream Management for the Lean Office’, Productivity Press. Taylor. F.W, (1923) ‘The Principles of Scientific Management’, Adamant Media Corporation.

97
Taylor, D. and Brunt, D. (2001) ‘Manufacturing operations and supply chain management: the lean approach’, Cengage Learning EMEA. Tischler, L. (2006) ‘Lean - Bringing Lean To the Office’, American Society for Quality, July, 32-38. Thorsen, W.C. (2005) ‘Value Stream Mapping & VM’, [pdf] The Value Society. Available at: http://www.value-eng.org/knowledge_bank/attachments/T20507.pdf [Accessed 30 June 2009] Whyte, W. (1955) ‘Street Corner Society’, 2nd Ed, Univeristy of Chicago Press. Womack, J.P. and Jones, D.T. (1996) ‘Beyond Toyota: How to Root Out Waste and Pursue Perfection’, Harvard Business Review, September – October, 140-158. Womack, J.P., Jones, D.T. and Roos, D. (1990) ‘The Machine that Changed the World’, Rawson Associates. Womack, J.P. and Jones, D.T. (2003) ‘Lean Thinking: Banish Waste and Create Wealth for your Organisation’, Illustrated, Simon and Schuster. Yin, R.K. (2008) ‘Case Study Research: Design and Methods’, Volume 5 of Applied Social Research Methods, 4th Ed, Illustrated, Sage.

98
Appendix A – Letter of Introduction and Consent Ian Fitzmaurice QA/QC 1A Pfizer Pharmaceuticals Grange Castle Business Campus Clondalkin Dublin 22 Phone: 086 608 2357 March 3, 2010 Dear Colleague, I am now in the data collection phase of my dissertation, and I'm requesting your co-operation. One of my data collection activities is to conduct a number of structured interviews with Finance colleagues at Grange Castle and Newbridge, to better understand their use, views and overall experience of Visual Process Controls, specifically the month end activity control board. Your participation is purely voluntary; it will take only a short time to answer the 15 questions during the interview, estimated @ 40 minutes. Of course all answers are confidential and will only be used for the purpose of my dissertation and company internal learning’s. To assure anonymity, your responses will be coded with an identification number instead of your true name. Please advise during the interview if you are interested in seeing the results of this research, I will publish the results to your email when it is completed. Please review and sign, if appropriate, the interview consent form attached. Thank you for your help. Sincerely, Ian Fitzmaurice MSc. in Technology Management Candidate,

99
Interview Consent Form The interview, for the above detailed study, will be digitally-recorded and you will be given a chance to review and amend the transcript in due course. Any personal details will be anonymised and I will not intentionally reveal your identity to anyone outside the research supervision team. The contents of the interviews – including yours – will be analysed and written up during the course of the research. The findings may be included in unpublished thesis submitted for higher degrees, and later lodged in the University Library, NUI Galway. Neither your own name nor any of your other personal details that would identify you will ever be associated with these quotations. I would be grateful if you could confirm, by signing this form, that you are happy for me to use the interview or extracts from it in this way. Consent: I AGREE to participate in this study. Name of Interviewee (Block Capitals): _________________________________ Interviewee Signature: _____________________________ Date: ____________

100
Appendix B – Final Interview Questionnaire
1. Individual details?
Participant No. MT Department Site / Location
2. What visual process controls have been implemented in this department, within the last 12 months?
_________________________________________________________ _________________________________________________________ _________________________________________________________ _________________________________________________________ _________________________________________________________ _________________________________________________________
3. Have you used Visual Process Controls in another department in legacy Wyeth or prior to
joining Wyeth? Yes / No
If No go to 4. If Yes:
A. What organisation / Department: _________________________________________________________ _________________________________________________________ _________________________________________________________
B. For what purpose:
_________________________________________________________ _________________________________________________________ _________________________________________________________
C. To support what process:
_________________________________________________________ _________________________________________________________ _________________________________________________________
D. What impact did it have?
_________________________________________________________ _________________________________________________________ _________________________________________________________

101
E. How would you rate their (VPC’s) use for that Department / Organisation:
Very Poor
Poor Neutral Good Very Good
• Elaborate / Comment?
_________________________________________________________ _________________________________________________________ _________________________________________________________ _________________________________________________________ _________________________________________________________ _________________________________________________________
4. What impacts have you perceived as a result of the introduction of VPC’s on the month end process?
A. Specify positive impacts (if any):
Description of Impact
1. 2. 3. 4. 5.
• Which has had the greatest positive impact? 1 / 2 / 3 / 4 / 5
B. Specify negative impact (if any):
Description of Impact 1. 2. 3. 4. 5.
• Which has had the greatest negative impact? 1 / 2 / 3 / 4 / 5

102
5. What impacts have you perceived as a result of the introduction of VPC’s on the finance leadership team?
A. Specify positive impacts (if any):
Description of Impact
1. 2. 3. 4. 5.
• Which has had the greatest positive impact? 1 / 2 / 3 / 4 / 5
B. Specify negative impact (if any):
Description of Impact 1. 2. 3. 4. 5.
• Which has had the greatest negative impact? 1 / 2 / 3 / 4 / 5
103
6. What impacts have you perceived as a result of the introduction of VPC’s on the finance team?
A. Specify positive impacts (if any):
Description of Impact
1. 2. 3. 4. 5.
• Which has had the greatest positive impact? 1 / 2 / 3 / 4 / 5
B. Specify negative impact (if any):
Description of Impact 1. 2. 3. 4. 5.
• Which has had the greatest negative impact? 1 / 2 / 3 / 4 / 5

104
7. What impacts have you perceived as a result of the introduction of VPC’s on team behaviours?
A. Specify positive impacts (if any):
Description of Impact
1. 2. 3. 4. 5.
• Which has had the greatest positive impact? 1 / 2 / 3 / 4 / 5
B. Specify negative impact (if any):
Description of Impact
1. 2. 3. 4. 5.
• Which has had the greatest negative impact? 1 / 2 / 3 / 4 / 5

105
8. What impacts have you perceived as a result of the introduction of VPC’s on tools, systems or processes?
A. Specify positive impacts (if any):
Description of Impact
1. 2. 3. 4. 5.
• Which has had the greatest positive impact? 1 / 2 / 3 / 4 / 5
B. Specify negative impact (if any):
Description of Impact
1. 2. 3. 4. 5.
• Which has had the greatest negative impact? 1 / 2 / 3 / 4 / 5

106
9. What impacts have you perceived as a result of the introduction of VPC’s on team communication (horizontal and/or vertical)?
A. Specify positive impacts (if any):
Description of Impact
1. 2. 3. 4. 5.
• Which has had the greatest positive impact? 1 / 2 / 3 / 4 / 5
B. Specify negative impact (if any):
Description of Impact
1. 2. 3. 4. 5.
• Which has had the greatest negative impact? 1 / 2 / 3 / 4 / 5
10. IGNORE – REMOVED AFTER PILOT

107
11. Rate how effective you deem the month end activity Visual Process Control board to be:
Very Ineffective
Ineffective No Change Effective Very Effective
Why do you rate it at this level and illustrate with examples? _________________________________________________________ _________________________________________________________ _________________________________________________________ _________________________________________________________ _________________________________________________________ _________________________________________________________
12. Are the department’s month end activities clear? Yes / No / Unsure
Explain? _________________________________________________________ _________________________________________________________ _________________________________________________________ _________________________________________________________ _________________________________________________________ _________________________________________________________
Was this the case prior to using visual process controls? Yes / No
What has changed, if anything?
_________________________________________________________ _________________________________________________________ _________________________________________________________ _________________________________________________________ _________________________________________________________ _________________________________________________________

108
13. How clear is the sequence of each month end activity?
Very Unclear
Unclear Not Sure Clear Very Clear
Explain? _________________________________________________________ _________________________________________________________ _________________________________________________________ _________________________________________________________ _________________________________________________________ _________________________________________________________
Was this the case prior to using visual process controls? Yes / No
What has changed?
_________________________________________________________ _________________________________________________________ _________________________________________________________ _________________________________________________________ _________________________________________________________ _________________________________________________________
14. How clear is the status of each activity, at a particular point in time of the month end
process?
Very Unclear
Unclear Not Sure Clear Very Clear
Explain? _________________________________________________________ _________________________________________________________ _________________________________________________________ _________________________________________________________ _________________________________________________________ _________________________________________________________
Was this the case prior to using visual process controls? Yes / No
What has changed?
_________________________________________________________ _________________________________________________________ _________________________________________________________ _________________________________________________________ _________________________________________________________ _________________________________________________________

109
15. IGNORE - REMOVED AFTER PILOT
16. Rate your overall experience of the introduction of Visual Process Controls in a finance
environment in your current organisation:
Very Poor Poor Neutral Good Very Good
Explain why do you rate it at this level? _________________________________________________________ _________________________________________________________ _________________________________________________________ _________________________________________________________ _________________________________________________________ _________________________________________________________
17. Any other comments or observations in relation to the use of Visual Control Management? _________________________________________________________ _________________________________________________________ _________________________________________________________ _________________________________________________________ _________________________________________________________ _________________________________________________________ _________________________________________________________ _________________________________________________________ _________________________________________________________ _________________________________________________________ _________________________________________________________ _________________________________________________________