the effects of hydrothermal circulation on subduction zone
TRANSCRIPT
1
The Effects of Hydrothermal Circulation on
Subduction Zone Temperatures
Troy Kummer
Advisor: Dr. Glenn A. Spinelli
April 08
Department of Earth and Environmental Science New Mexico Institute of Mining and Technology

2
ABSTRACT
Most thermal models of subduction zones assume no advection of heat by fluid flow
because slow flow through underthrusting sediment, the décollement, and wedge likely
transports only a minor amount of heat. We model coupled fluid and heat transport in a
subduction zone and show that hydrothermal circulation in subducting basaltic basement rocks
can greatly influence subduction zone temperatures. Fractured basaltic basement has
permeability several orders of magnitude higher than a typical décollement, allowing fluid
circulation to redistribute and extract heat from a subduction zone. We simulate systems with
upper basaltic basement permeability ranging from 10−13 to 10−10 m2. Additionally, we
incorporate the effect of permeability reduction within the basaltic basement as it is subducted.
The models with fluid transport show suppressed temperatures along the subducting slab relative
to models with no fluid transport. In models where faulted ocean crust exposes high permeability
basement to the ocean floor, cooling from ocean bottom water results in highly suppressed heat
flow relative to conductive models. With continuous sediment cover, heat is extracted from
under the margin wedge to the trench. An important consequence is that hydrothermally cooled
ocean crust also acts to slow thermally controlled diagenetic reaction progress within subducting
sediment. A sensitivity analysis indicates that hydrothermal circulation is most important for
subduction zones with slow convergence rates and high taper angles.
3
ACKNOWLEDGEMENTS
I would like to thank my advisor, Dr. Glenn Spinelli, for his encouragement, assistance
and support in this project. I also would like to extend my gratitude to the members of my
advisory committee, Dr. Fred Phillips and Dr. John Wilson for their time and effort. This
research is funded by the National Science Foundation MARGINS Program. I am grateful for
their assistance.
4
TABLE OF CONTENTS ABSTRACT .........................................................................................................................................................................2 ACKNOLEDGEMENTS ...................................................................................................................................................3 TABLE OF CONTENTS ...................................................................................................................................................4 LIST OF FIGURES ............................................................................................................................................................6 LIST OF TABLES ..............................................................................................................................................................8 LIST OF ACRONYMS ......................................................................................................................................................9 CHAPTER 1: INTRODUCTION AND BACKGROUND .........................................................................................10
1.1 INTRODUCTION.................................................................................................................................................10 1.2 OCEAN CRUST STRUCTURE AND PROPERTIES ..................................................................................................13
1.2.1 Upper Basement Aquifer ............................................................................................................................15 1.2.2 Sediment Layer ...........................................................................................................................................20 1.2.3 Sheeted Dike Complex amd Lower Ocean Crust Properties ...................................................................21 1.2.4 Ocean Crust Properties With Age .............................................................................................................21
1.3 SUBDUCTION ZONES .........................................................................................................................................22 1.3.1 Overview......................................................................................................................................................22 1.3.2 Limits of Seismicity.....................................................................................................................................24 1.3.3 Thermal Models ..........................................................................................................................................26 1.3.4 Hydrothermal Circulation Continuing in Subducted Crust.....................................................................29 1.3.5 Diagenetic and Metamorphic Reaciont Progress ....................................................................................31
CHAPTER 2: EXPERIMENTAL PROCEDURE.......................................................................................................33
2.1 MODEL SET-UP..................................................................................................................................................33 2.2 DESCRIPTION OF FEHM .....................................................................................................................................38 2.3 CALCULATIONS ................................................................................................................................................40
2.3.1 Decollement Temperatuers and Heat Flux...............................................................................................40 2.3.2 Diagenetic Reaction Progress ...................................................................................................................41 2.3.3 Dimensionless Numbers.............................................................................................................................42
CHAPTER 3: EXPERIMENTAL RESULTS .............................................................................................................44 3.1 COMPARISON TO ACCEPTED THERMAL MODEL ...............................................................................................44 3.2 OPEN CIRCULAITON ........................................................................................................................................45
3.2.1 Decollement Temperatuers and Flow Patterns........................................................................................45 3.2.2 Heat Flux ....................................................................................................................................................51 3.2.3 Diagenetic Reaction Progress ...................................................................................................................53 3.2.4 Nusselt Number ..........................................................................................................................................53 3.2.5 Rayleigh Number........................................................................................................................................53
3.3 CLOSED CIRCULAITON ...................................................................................................................................55 3.3.1 Decollement Temperatuers and Flow Patterns........................................................................................55 3.3.2 Heat Flux ....................................................................................................................................................58 3.3.3 Diagenetic Reaction Progress ...................................................................................................................59 3.3.4 Nusselt Number ..........................................................................................................................................60 3.3.5 Rayleigh Number........................................................................................................................................60 3.3.6 Wedge taper and Convergence Rate.........................................................................................................62
CHAPTER 4: DISCUSSION...........................................................................................................................................68 4.1 HYDROTHERMAL CIRCULATION SHUTTING OFF AT THE TRENCH ...................................................................68 4.2 SUBDUCTION ZONE PARAMETERS ....................................................................................................................68 4.3 EFFECTS OF HYDROTHERMAL CIRCULATION ON HEAT FLUX ..........................................................................70 4.4 IMPLICATIONS FOR CONTROLS ON THE UPDIP LIMIT OF SEISMICITY...............................................................72

5
CHAPTER 5: CONCLUSIONS......................................................................................................................................73 CHAPTER 6: SUBSEQUENT AND PROPOSED FUTURE WORK .....................................................................74
6.1 PERMEABILITY IN SUBDUCTED CRUST.............................................................................................................74 6.2 EXPANDING ON SENSITIVITY ANALYSIS OF SUBDUCTION ZONES ...................................................................75 6.3 RE-VISIT THERMAL MODELS AND CONTROLS ON THE UPDIP LIMIT OF SEISMICITY........................................76
REFERENCES ..................................................................................................................................................................77 APPENDIX.........................................................................................................................................................................84
SEAWARD BOUNDARY CONDITION..................................................................................................................................84 SECTION INCREMENT SIZE...............................................................................................................................................85
6
LIST OF FIGURES
Figure 1.1: Global mountain belt of mid-ocean ridges with vectors indicating spreading rate. Figure 1.2: Cartoon illustrating four main layers of the oceanic crust. Figure 1.3: Summary of bulk permeabilities for ocean crust determined with packer experiments (note difference in
scales for the two plots). Box width indicates uncertainty in permeability estimation and height indicates depth interval over which the packer experiment was conducted. Question mark indicates reinterpretation of data to a higher bulk permeability.
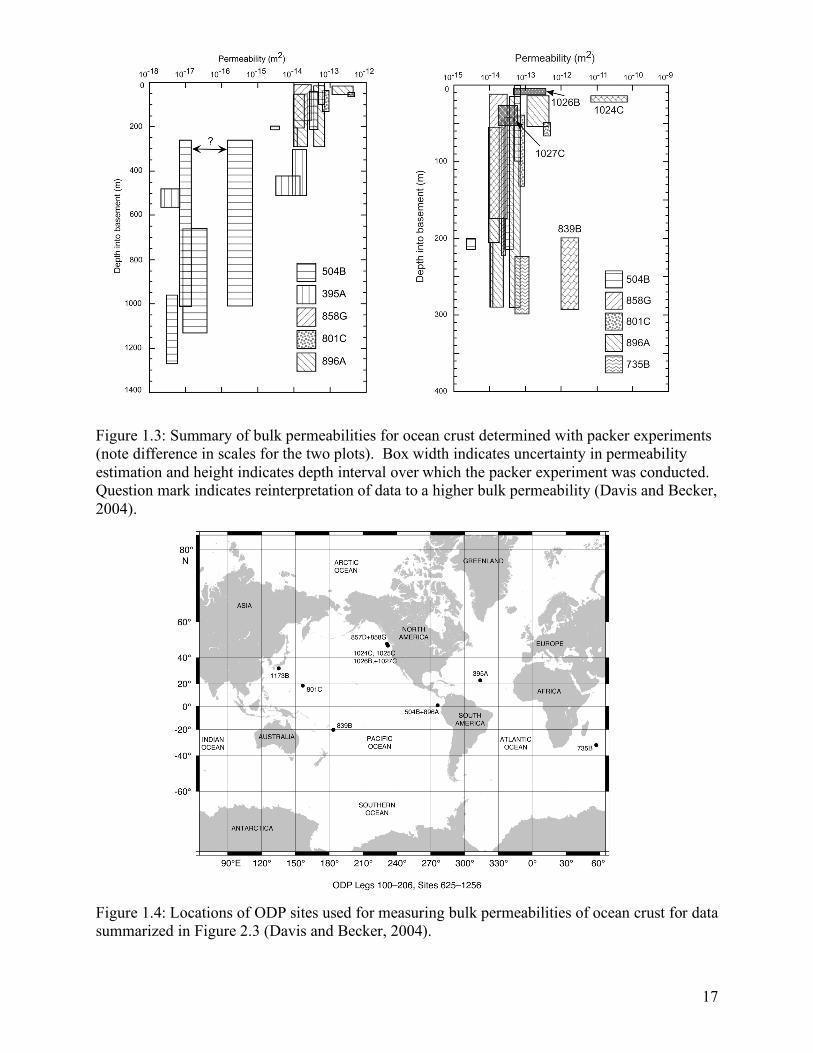
Figure 1.4: Locations of ODP sites used for measuring bulk permeabilities of ocean crust for data summarized in Figure 2.3.
Figure 1.5: Permeability estimates based on temperature logs. Lines connecting hole 395A indicate reinterpretation
of data. Figure 1.6: Plot showing how estimates of permeability in the upper basement aquifer is largely dependant on the
length scale used for making the estimation. Figure 1.7: Cartoon illustrating a subduction zone.
Figure 1.8: Cartoon showing the updip and downdip limits of seismicity and currently accepted temperature ranges associated with those limits.
Figure 1.9: Heat flux data at Nankai compared to heat flux from thermal models with varying plate age (Hyndman
and Wang, 1995). Heat flux data is higher than predicted by thermal models near the trench and lower than predicted at distances >30 km.
Figure 1.10: Comparison of thermal model along the Cascadia margin with heat flux observations. Results agree
best with the model that has negligible frictional heating along the décollement although the large scatter in data leaves room for interpretation.
Figure 2.1: Cartoon illustrating models with (a) faults exposing high permeability basement and (b) continuous
sediment cover.
Figure 3.1: Comparison of thermal models of a subduction zone from (a) FEHM and (b) an established thermal model.
Figure 3.2: Décollement temperatures for FEHM and established subduction zone model.
Figure 3.3: Temperatures along the décollement for open circulation system. Temperatures are nearly isothermal for the highest permeability simulation.
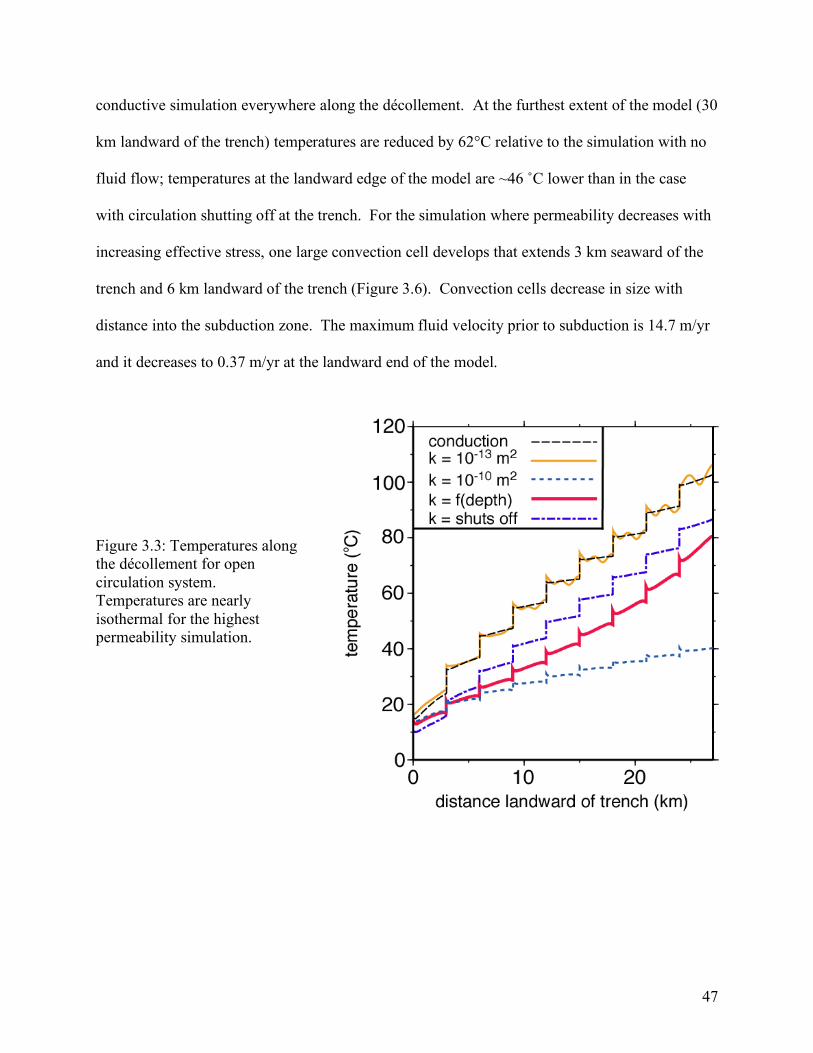
Figure 3.4: Disruption of fluid circulation for a permeability of 10-13 m2 as (a) a fault exposing the upper basement
aquifer is subducted and (b) sealed off. Figure 3.5: Fast recovery of fluid circulation for a permeability of 10-10 m2 as (a) a fault exposing the upper
basement aquifer is subducted and (b) sealed off. Figure 3.6: Thermal structure and circulation patterns for simulations with a permeability of (a) 10-13 m2, (b) as a
function of increasing effective stress and (c) 10-10 m2.
7
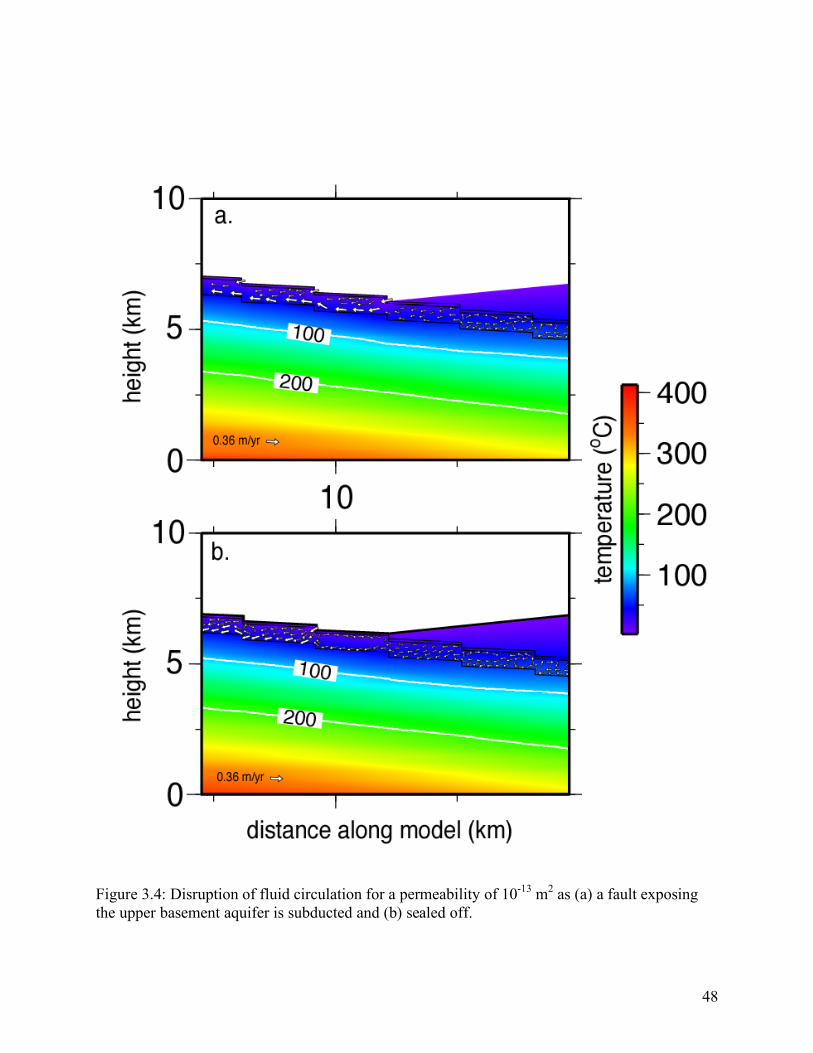
Figure 3.7: Heat flux for simulation with open circulation showing suppressed heat flux at the trench.
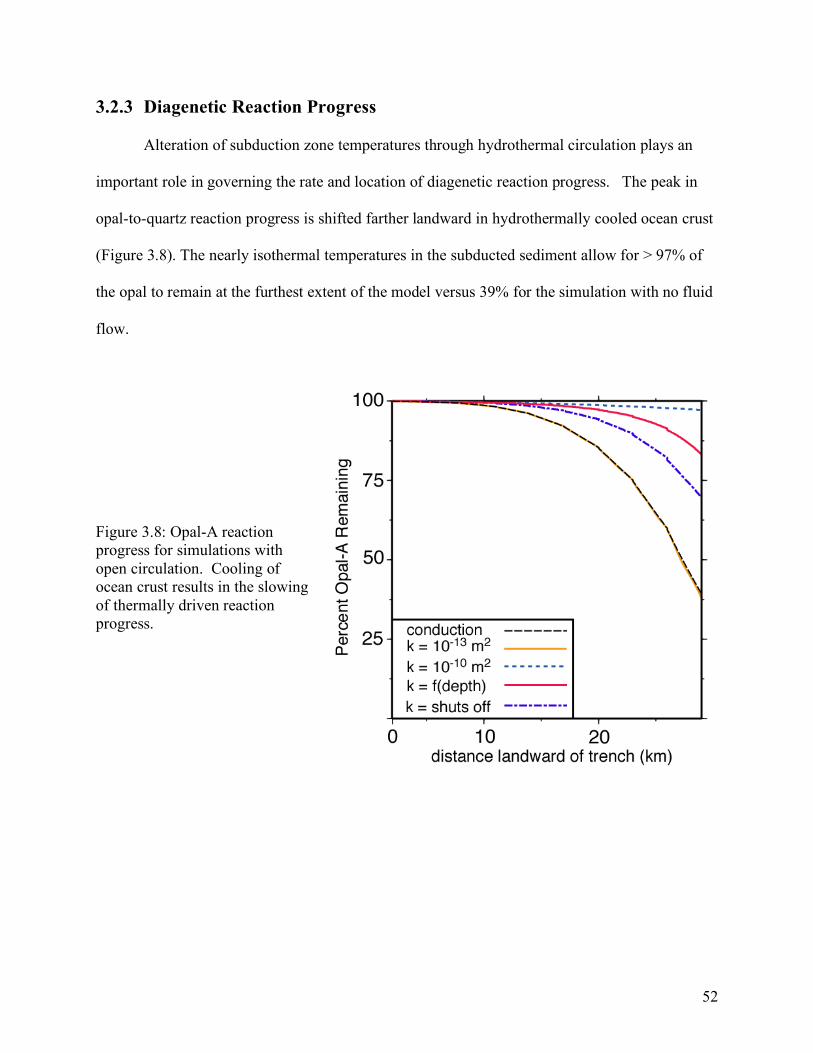
Figure 3.8: Opal-A reaction progress for simulations with open circulation. Cooling of ocean crust results in the slowing of thermally driven reaction progress.
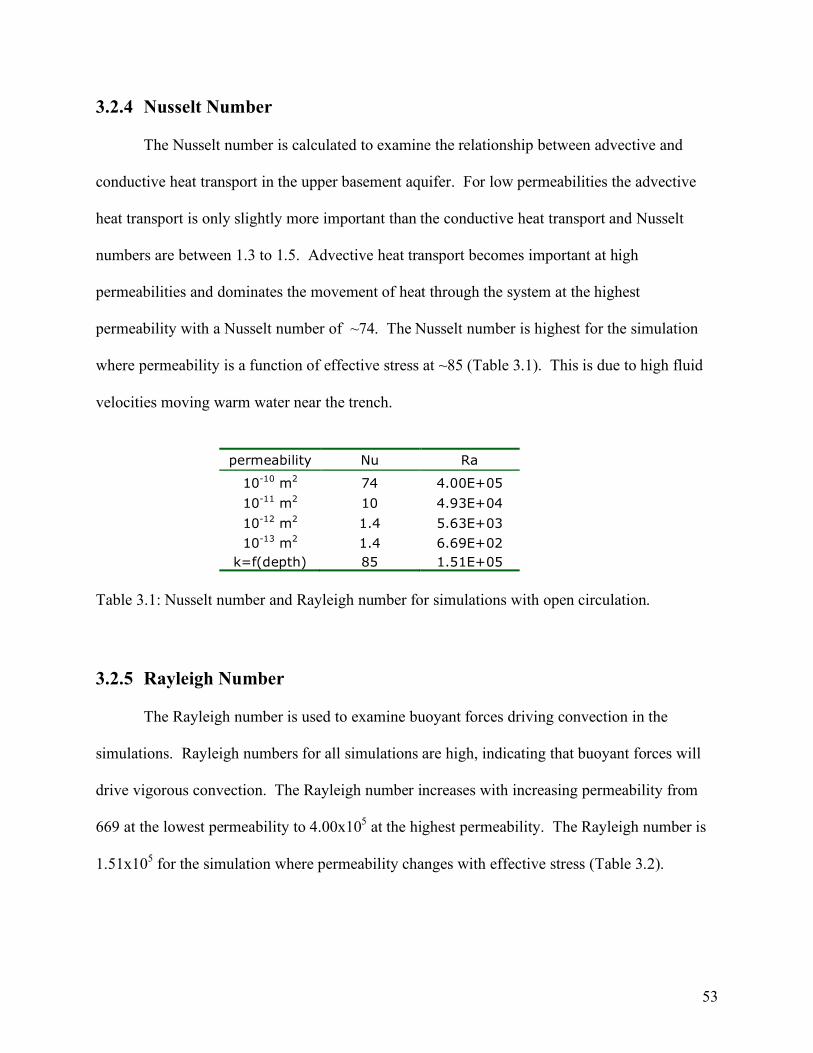
Figure 3.9: Trends in the Rayleigh number for the closed circulation case.
Figure 3.10: (a) Temperatures along the décollement for closed circulation case. At high permeabilities temperatures are elevated near the trench and become suppressed with distance into the subduction zone. (b) Comparison of temperature difference along the décollement for open and closed circulation cases (k = 10-10 m2).
Figure 3.11: Thermal structure and circulation patterns for simulations with a permeability of (a) 10-13 m2, (b) as a function of increasing effective stress and (c) 10-10 m2.
Figure 3.12: (a) Heat flux for closed circulation simulation showing elevated heat flux at the trench. (b) Heat flux
anomaly (relative to case with no fluid flow) resulting from open and closed circulation simulations (k = 10-10 m2).
Figure 3.13: Opal-A reaction progress for closed circulation simulations.
Figure 3.14: Trends in the Rayleigh number for the closed circulation case.
Figure 3.15: (a) Temperatures along the décollement for closed circulation system with a low taper angle and (b) comparison of temperature difference between high and low taper angles (k = 10-11 m2).
Figure 3.16: Heat flux for high and low taper angles for closed circulation system (k = 10-11 m2).
Figure 3.17: Comparison of diagenetic reaction progress for high and low taper angles (k = 10-11 m2).
Figure 3.18: (a) Temperatures along the décollement for slow and fast convergence rates for close circulation simulations and (b) difference in temperature along the décollement from simulation with no fluid flow (k = 10-11 m2).
Figure 3.19: Heat flux for closed circulation system and varying convergence rates.
Figure 3.20: Opal-A diagenetic reaction progress for closed circulation simulation with varying convergence rates.
Figure A1: Sensitivity analysis on seaward boundary.
Figure A2: Sensitivity analysis for wedge increment size.

8
LIST OF TABLES Table 2.1: Node spacing for models. Table 2.2: Model material properties. Table 3.1: Nusselt number and Rayleigh number for simulations with open circulation
Table 3.2: Nusselt number and Rayleigh number for simulations with closed circulation.

9
List of acronyms
FEHM – Finite Element Heat and Mass Transport Model
MORs – Mid-Ocean Ridges
LaGriT – Los Alamos Gridding Toolbox
ODP – Ocean Drilling Project

10
CHAPTER 1: INTRODUCTION AND BACKGROUND 1.1 INTRODUCTION
Subduction zone plate boundary faults are the primary location of large (>M 8) and
tsunamigenic earthquakes. The updip limit of subduction zone seismicity controls the rupture
area of earthquakes (Hyndman et al., 1997) and affects tsunami generation (Satake and Tanioka,
1999). Subduction zone temperatures control the alteration and state of material passing through
the system and the generation and expulsion of volatiles (e.g., Peacock, 1990) affecting material
strength and frictional properties along the plate boundary fault. The updip limit of seismicity
coincides with temperatures of ~100-150 °C on the plate boundary fault estimated from thermal
models. Diagenetic and metamorphic reactions in this temperature range likely trigger the
transition to seismogenic faulting (e.g., Hyndman et al., 1997; Moore and Saffer, 2001).
Therefore, knowledge of subduction zone temperatures is important for understanding processes
controlling the spatial limits of seismicity and characterizing subduction zone fluid flow systems.
Subduction geometry, convergence rate, frictional heating, and the thermal state
of crust entering a subduction zone have been recognized as primary controls on subduction zone
temperature (e.g., Dumitru, 1991). For convergence rates >1 cm/yr, subducting ocean crust acts
as a heat sink, cooling the overriding plate (Cloos, 1985). Forearc thermal conductivity,
radiogenic heating, and fluid flow through the margin wedge or along the plate boundary fault
(i.e., décollement) play smaller roles in affecting subduction zone temperature (Dumitru, 1991;
Peacock, 1987; Wang et al., 1993). In the underthrust section, the volume of fluid produced by
sediment compaction and metamorphic reactions is not sufficient to pervasively alter subduction
zone temperatures as it is driven out of the system (e.g., Peacock, 1987). Temperatures along
isolated

11
preferential fluid flow paths may be altered from conductive values, but the overall thermal
effect of fluid flow either up through the margin wedge or out of the system along the
décollement is minor (Peacock, 1987). While fluid flow through the margin wedge or along the
décollement may be insufficient to significantly alter subduction zone temperatures,
hydrothermal circulation within the subducting crust has the potential to redistribute heat and
enhance the underthrust crust’s ability to act as a heat sink.
Fluid circulating within ocean crust can move significant quantities of heat and therefore
alter temperatures from their background conductive values. For example, open hydrothermal
circulation (i.e. a system with easy exchange of fluid between the ocean and a high permeability
basaltic aquifer) extracts ~70% of the lithospheric heat from 20 Ma crust offshore Costa Rica
(Fisher et al., 2003) and ~85% of the lithospheric heat from 1 Ma crust on the Juan de Fuca
Ridge flank (Davis et al., 1999). Based on global heat flow anomalies, open circulation systems
are present in crust up to ~65 Ma in age (Stein et al., 1995). In systems with continuous low-
permeability sediment cover, closed hydrothermal circulation in the basement aquifer below the
sediment redistributes heat, but little or no heat is directly advected through the seafloor. Such
closed hydrothermal systems can be maintained even in crust >100 Ma (Fisher and Von Herzen,
2005).
Extraction of heat from under the margin wedge by fluid circulation in the basement
aquifer of ocean crust and the transport of that heat seaward of the deformation front should
lower subduction zone temperatures. In areas with open circulation systems seaward of the
trench, heat extracted from under the wedge may be advected directly to the ocean at basement
outcrops. On the Cascadia and Middle America margins (the two margins with extensive
seafloor heat flux data on open circulation systems seaward of the trench), observed heat flux

12
values on the incoming plate are scattered, reflecting local recharge and discharge systems (e.g.,
Fisher et al., 2003). If the circulation system seaward of the trench is closed, heat extracted from
under the wedge will warm the incoming crust, resulting in anomalously high trench seafloor
heat flux. Hydrothermal circulation within the subducting basement aquifer has been proposed as
a mechanism to generate just such a high heat flux anomaly in Nankai Trough (Yamano et al.,
1992), a young warm subduction system with closed circulation seaward of the trench. However,
this idea has not been pursued in previous subduction zone thermal models. A few studies have
accounted for the hydrothermal cooling of crust by open circulation prior to subduction, but most
researchers have assumed that fluid circulation within ocean crust stops at the trench (Harris and
Wang, 2002; Langseth and Silver, 1996) or arbitrarily maintains reduced temperatures in the
shallow subduction zone (Spinelli and Saffer, 2004). Here, we move beyond previous
subduction zone thermal models by examining the effects of hydrothermal circulation in
subducting ocean crust. First, we contrast results from a simulation using the previous
assumption that hydrothermal circulation in the ocean crust “shuts off” at the trench to a
simulation in which we allow coupled fluid and heat circulation to persist in the subducting crust.
In addition, we consider hydrothermal circulation in a closed circulation system (i.e. with no
high permeability connections between the basement aquifer and the seafloor). In addition, we
examine the influence of varying subduction zone geometry and convergence rate on the thermal
effects of fluid circulation.

13
1.2 OCEAN CRUST STRUCTURE AND PROPERTIES
New ocean crust is produced along a 53,000 km long submarine mountain belt encircling
the planet. This mountain belt consists of offset spreading segments which are interconnected
through transform faults (Figure 1.1). These spreading segments allow for mantle material to
flow upwards and fill an extensional zone. The upward flowing mantle undergoes
decompressional melting and magma can be extruded to the sea-floor through a system of dikes,
forming the upper extrusive layers of the ocean crust. Magma also crystallizes at depth forming
the lower layers of the ocean crust. Although all ocean crust has the same general structure,
there is some variation physical properties and topography depending on the rate at which the
ocean crust is being formed along with the composition of melt producing the crust. Ocean crust
structure is constrained by seismic observations, direct observations where normal faults expose
the ocean crust at the sea-floor, crustal drilling, potential field studies, gravity studies, dredging,
and the study of ophiolites (Davis, 2004).
Figure 1.1: Global mountain belt of mid-ocean ridges with vectors indicating spreading rate (Minster et al., 1974).

14
Ocean crust formed at mid-ocean ridges (MORs) can be divided into four layers based on
physical properties; these layers are sometimes divided further into sublayers. The layer
boundaries are not always well constrained. They may be based on direct observations of
lithology or observations of changes in the physical properties of the rocks. Starting from the top
of the ocean crust these layers consists of: sediment, extrusive pillow lavas and sheet flows, a
sheeted dike complex, gabbros, and peridotites. Thicknesses of these layers vary depending on
site location with typical values listed in Figure 1.2 (Brown and Musset, 1993).
Figure 1.2: Cartoon illustrating four main layers of the oceanic crust (Modified after Brown and Musset, 1993).
15
1.2.1 Upper Basement Aquifer
The upper basement aquifer is a layer of extrusive basaltic rocks that consists of sheet
flows interlain with pillow basalts which form as lava is extruded at the sea-floor through a
system of dikes. The interaction of this newly formed hot rock with cool ocean bottom water is
important for developing the interconnected network of pores and cracks that is characteristic of
this layer. The rapid cooling and contraction of this rock leads to a highly fractured upper
basement aquifer (Spencer, 1990). The emplacement of pillow basalts also helps generate an
interconnected fracture network. Pillow basalts form as lava is extruded at the seafloor as
spherical to elliptical mounds. The contacts between individual mounds form interconnected
voids, analogous to pore spaces between sand grains packed together, but on a larger scale. In
addition to open cracks and pore space, faulting also helps create and maintain well connected
conduits through the upper basement. New ocean crust forms in extensional environments.
Normal faults form parallel or sub-parallel to the mid-ocean ridge axis as ocean crust moves
away from the spreading center. The result is a well connected network of pores and cracks on
both a small and large scale. The characteristic high porosity and permeability of this layer is
capable of hosting hydrothermal circulation and proves important for cooling ocean crust where
there is communication with the seafloor and redistributing heat in regions where the upper
basement is sealed off from the seafloor.
While permeability of the upper basement aquifer (layer 2A & 2B) is high, permeability
of both the overlying sediment (layer 1) and underlying sheeted dike complex (layer 2C) is much
lower, allowing the upper basement aquifer to be treated as a confined system where sediment is
sufficiently thick to seal off communication with the seafloor. A variety of techniques have been

16
used to estimate the permeability of the upper basement aquifer with results varying over several
orders of magnitude depending on the scale of the experiment.
At the smallest scale, laboratory measurements of permeability are made on core samples
recovered from drilling. Permeabilities from core samples are generally very small (10-18 to 10-20
m2) and not representative of the large scale properties of the aquifer. These measurements may
provide a minimum estimate for ocean crust permeability (Becker and Davis, 2004).
In situ determinations of permeability are made from Deep Sea Drilling Project (DSDP)
and Ocean Drilling Program (ODP) boreholes, but are limited in number due to the high cost of
drilling. Permeability measurements have been made with packer tests, in which an instrument
is inserted into a borehole and isolated from the ocean floor by inflating a rubber seal with
seawater. Water from the seafloor is then injected into the borehole as a single pulse for a slug
test or at a continuous rate for an injection test and the pressure response is recorded.
Measurements of how the aquifer responds are made directly in the borehole. Permeability
measurements from this method range from 10-10 to 10-17 m2 (Figure 1.3, with site locations
shown in Figure 1.4) (Becker and Davis, 2004). The data shows high permeabilities at shallow
depths, which represents properties of the pillow basalts and sheet flows, and a sharp drop of to
low permeabilities at greater depths, indicating the transition to sheeted dikes.
17
Figure 1.3: Summary of bulk permeabilities for ocean crust determined with packer experiments (note difference in scales for the two plots). Box width indicates uncertainty in permeability estimation and height indicates depth interval over which the packer experiment was conducted. Question mark indicates reinterpretation of data to a higher bulk permeability (Davis and Becker, 2004). Figure 1.4: Locations of ODP sites used for measuring bulk permeabilities of ocean crust for data summarized in Figure 2.3 (Davis and Becker, 2004).
18
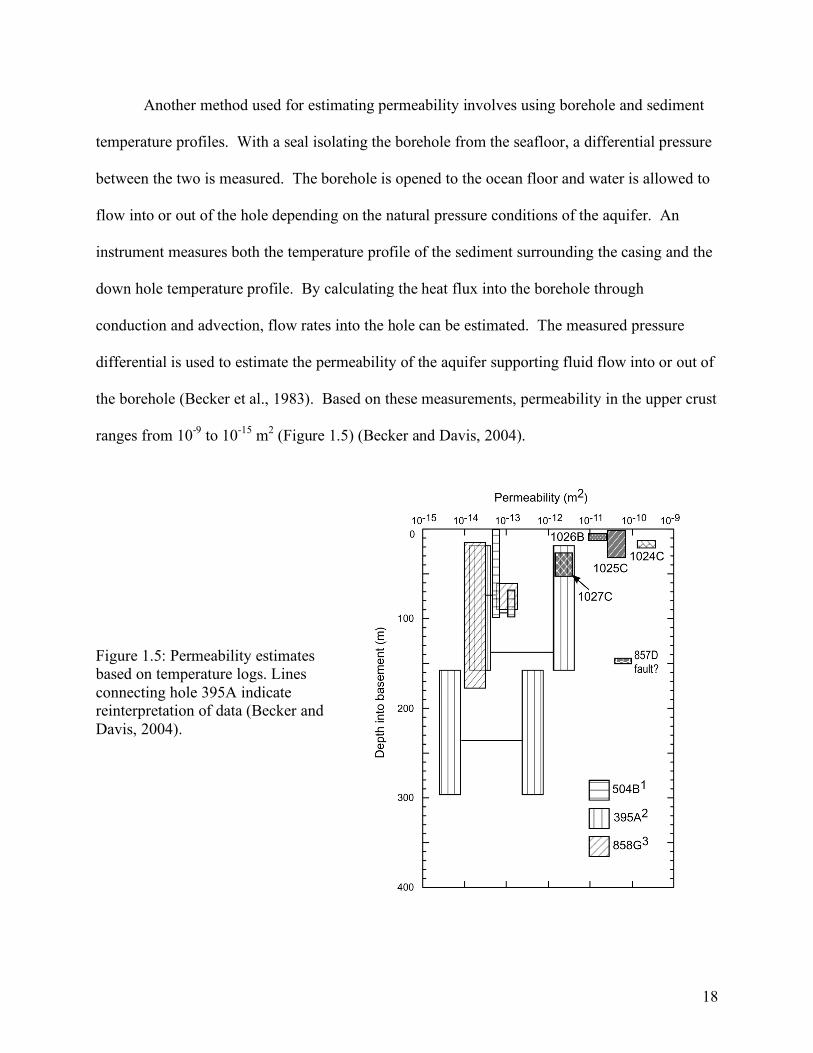
Another method used for estimating permeability involves using borehole and sediment
temperature profiles. With a seal isolating the borehole from the seafloor, a differential pressure
between the two is measured. The borehole is opened to the ocean floor and water is allowed to
flow into or out of the hole depending on the natural pressure conditions of the aquifer. An
instrument measures both the temperature profile of the sediment surrounding the casing and the
down hole temperature profile. By calculating the heat flux into the borehole through
conduction and advection, flow rates into the hole can be estimated. The measured pressure
differential is used to estimate the permeability of the aquifer supporting fluid flow into or out of
the borehole (Becker et al., 1983). Based on these measurements, permeability in the upper crust
ranges from 10-9 to 10-15 m2 (Figure 1.5) (Becker and Davis, 2004).
Figure 1.5: Permeability estimates based on temperature logs. Lines connecting hole 395A indicate reinterpretation of data (Becker and Davis, 2004).
19
Permeabilities can also be estimated on a much larger scale using a CORK installation in
a borehole. These instruments provide a seal at the top of the casing and are used for long term
monitoring of in situ pressure and temperature. One method for estimating permeabilities
involves monitoring pressure response in the formation due to tidal loading. The difference in
elastic properties of the fluid in the pore spaces versus that of the surrounding rock matrix results
in pressure differentials across the seafloor interface. These pressure differentials lead to
diffusive fluid flow. Permeabilities are determined by observing how the system responds to
changes in pressure due to this diffusive fluid flow (Wang and Davis, 1996).
Another method for estimating permeability uses observations of pressure changes
induced from tectonic strain events. If an earthquake occurs close enough to a CORK station
there is an observable pressure transient. This spike in pressure decays with time in a similar
manner to the response observed from seafloor tidal loading (Davis et al., 2001).
The advantage of using CORK observations for permeability measurements is the length
scale over which the estimates apply. Davis et al. (2000) used tidal loading observations to
estimate a permeability of 10-10 m2 for material extending ~14 km from the observation point, the
closest region with exposed basement connecting the seafloor to the upper basement aquifer.
Tectonic strain events give permeability estimates over even larger scales; Davis et al. (2001)
estimated permeabilities as high as 10-9 m2 over tens of kilometers using this method. Estimates
of high permeabilities (10-10 – 10-9 m2) over regional scales are also derived using numerical
models of fluid and heat transport constrained by temperature observations (e.g., Davis et al,
1997, Wang et al., 1997).
Permeability values for the ocean crust vary over many orders of magnitude depending
on the method used for making the estimation. The reason for this variation is due to the length

20
scale at which the permeability is measured. Smaller scales only represent local conditions of
the aquifer and do not capture the regional scale interconnectedness of the system through cracks
and fissures. Therefore, estimates of permeability at larger scales are more representative of the
system. The large differences in permeability from small to large scales suggest that cracks and
fissures play an important role in governing how fluid flows through the upper basement aquifer.
This general concept of scale dependence on estimates of permeability in ocean crust is
summarized by Fisher (1998) (Figure 1.6).
Figure 1.6: Plot showing how estimates of permeability in the upper basement aquifer is largely dependant on the length scale used for making the estimation (Fisher, 1998). 1.2.2 Sediment Layer
Sediment that accumulates on top of the basement aquifer of ocean crust typically has
low permeability (~10-13 – 10-19 m2) that decreases with decreasing porosity (i.e. increasing
burial depth) (Spinelli et al., 2004). Thus, only a thin layer of sediment is required to greatly
reduce fluid communication between the basement aquifer and ocean. For young ocean crust
where sediment cover is generally thin to and patchy, hydrothermal circulation in the basement
aquifer is “open”, with fluid readily circulating between the ocean crust and ocean. As the plate

21
ages, more sediment accumulates and there is a transition from an open system to a closed
system, where there is no significant communication of fluid flow between the ocean crust and
the seafloor except in isolated areas where topographic highs may expose the upper basement
aquifer at the seafloor. These differing systems prove important for controlling how fluid
advects heat through the system.
1.2.3 Sheeted Dike Complex and Lower Ocean Crust Properties
Below the layer of sheet flows and pillow basalts is a sheeted dike complex. This
extrusive layer is formed as magma is periodically injected into the extensional regime and
emplaced in thin vertical sheets. These thin vertical sheets cool and move away from the
spreading center, making room for the next sheet to form. At the bottom of this layer there is a
transition to the intrusive lower crust.
Permeabilities of the sheeted dike complex and lower ocean crust are estimated from
seismic studies, ophiolites, and a limited number of packer experiments. An important feature of
the transition from the upper basement aquifer to the sheeted dike complex is an abrupt transition
to much lower porosities and permeabilities. This change in properties shows up best in seismic
studies. P-wave and s-wave velocities are directly dependant on the properties of the rock with
higher velocities being associated with lower porosities and permeabilities (Sleep and Barth,
1997; Swift et al., 1999). Permeability in the sheeted dike complex ranges from ~10-15 to 10-18
m2 (Becker, 1989, Becker, 1996). These low permeabilities result in little fluid interaction of the
upper basement aquifer with the underlying sheeted dike complex.
1.2.4 Ocean Crust Properties With Age
In addition to scale dependence, ocean crust properties vary with age. The properties of
ocean crust change as the crust ages due to hydrothermal alteration, precipitation of minerals,

22
and the collapse of large-scale voids (Holmes and Johnson, 1993). Evidence of this crustal aging
comes from both seismic refraction studies (e.g. Houtz, 1976; Carlson, 1998; Grevemeyer et al.,
1999) and studies of ophiolites (Gillis and Sapp, 1997). Seismic studies indicate that most of
these changes occur within in the first several million years, with little change in properties
thereafter (Houtz, 1976; Carlson, 1998; Grevemeyer et al., 1999).
Although permeability likely decreases as the crust ages, there is likely maintenance of
connected fluid flow pathways and moderately high permeability in old ocean crust. Fisher and
Herzen (2005) simulated coupled fluid and heat transport in 106 Ma seafloor of the Maderia
Abyssal Plain in the North Atlantic Ocean and found that permeabilities on the order of 10-12 m2
to 10-10 m2 were required to match heat flux observations. These high permeabilities indicate the
importance of hydrothermal circulation even in very old crust.
1.3 SUBDUCITON ZONES
1.3.1 Overview
Subduction zones occur where ocean crust is recycled back into the mantle along
convergent margins. In a subduction zone, relatively cold ocean lithosphere of the subducting
plate is forced below either continental or oceanic crust of the overriding plate. Features
associated with a subduction zone include: the trench, wedge, forearc, magmatic arc and back-
arc (Figure 1.7).

23
Figure 1.7: Cartoon illustrating a subduction zone (Stern, 2002)
There is a significant amount of variability in subduction zones throughout the world.
Convergence rates typically range from about 2 cm/yr to 12 cm/yr, although exceptions, such as
the To Tonga trench, can be as high as 24 cm/yr (Ruff and Kanamori, 1980). Some subduction
zones form accretionary wedges, where sediment is scrapped off from the subducting plate and
added to the overriding wedge, while other subduction zones form non-accretionary wedges,
where all of the sediment is subducted with the plate. The age of subducting crust ranges from
zero, if a spreading ridges is being subducted, up to 170 Ma (Stern, 2002). The age of the
subducting crust is an important control on the angle of subduction. Old, more dense crust will
dip at steep angles while young, more buoyant crust will dip at shallow angles (Stern, 2002).
Taper angle, which is the dip of the subducting plate plus the dip of the overriding wedge
material, can range from less than 3° to greater than 17° (Saffer and Bekins, 2002). All of these
factors play an important role in processes that occur in subduction zones (i.e. size and location
of earthquakes, diagenetic and metamorphic reactions, fluid and rock interactions).

24
1.3.2 Limits of Seismicity
Earthquakes are a common feature associated with subduction zones. The frequency and
magnitude of earthquakes varies between subduction zones. Some regions have frequent, low
magnitude earthquakes (i.e. island arcs of the southwest Pacific) (Pacheco and Sykes, 1992)
while others have infrequent, high magnitude earthquakes (i.e. Cascadia, Chile, N. Sumatra)
(Plafker, 1969, Abe and Kanamori, 1980.). These variations likely result from differences in the
mechanical coupling along the décollement (the interface of the subducting ocean crust and the
overriding tectonic plate). Rocks undergoing shear stress along a fault may exhibit either stick-
slip behavior or stable sliding behavior. Under stick-slip conditions, stress will build up until a
critical value is reached at which failure will occur along the fault resulting in a significant
displacement (i.e. an earthquake). In contrast, stable sliding behavior allows for movement
along the fault without the build up and release of stresses in instantaneous events, but rather
over continuous sliding periods (i.e. creep), and earthquakes are not produced.
Subduction thrust faults can be divided into three zones based on seismic behavior: (1)
the updip aseismic zone (which may not always be present), (2) the seismogenic zone, and (3)
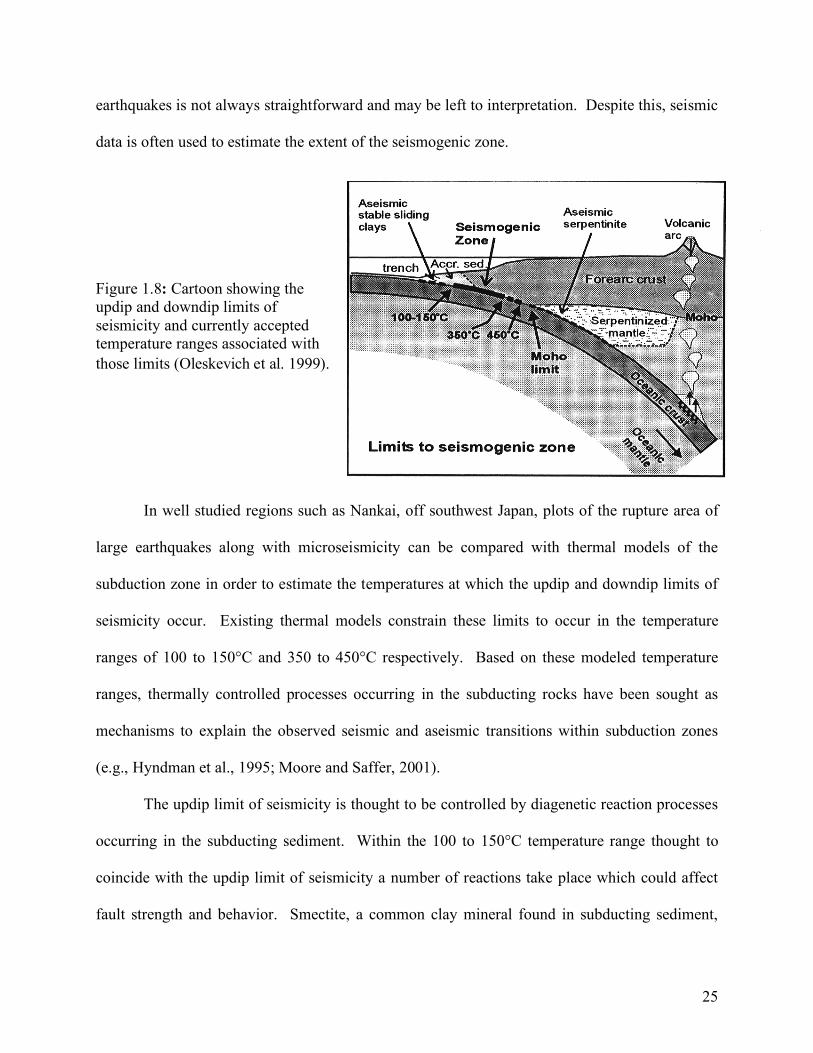
the downdip aseismic zone (Figure 1.8) (Oleskevich et al. 1999). Methods for estimating the
updip and downdip extent of the sesimogenic zone involve a combination of observations from
seismic data, thermal modeling, and dislocation modeling of deformation data. These limits may
not be well constrained in regions where few earthquakes have been observed. There is also a
certain amount of ambiguity in defining what constitutes these limits due to continuum of
earthquakes detectable down to very small magnitudes. There is not a well defined cutoff for
what constitutes aseismic versus seismic behavior. In addition, locating the occurrence of these
25
earthquakes is not always straightforward and may be left to interpretation. Despite this, seismic
data is often used to estimate the extent of the seismogenic zone.
Figure 1.8: Cartoon showing the updip and downdip limits of seismicity and currently accepted temperature ranges associated with those limits (Oleskevich et al. 1999).
In well studied regions such as Nankai, off southwest Japan, plots of the rupture area of
large earthquakes along with microseismicity can be compared with thermal models of the
subduction zone in order to estimate the temperatures at which the updip and downdip limits of
seismicity occur. Existing thermal models constrain these limits to occur in the temperature
ranges of 100 to 150°C and 350 to 450°C respectively. Based on these modeled temperature
ranges, thermally controlled processes occurring in the subducting rocks have been sought as
mechanisms to explain the observed seismic and aseismic transitions within subduction zones
(e.g., Hyndman et al., 1995; Moore and Saffer, 2001).
The updip limit of seismicity is thought to be controlled by diagenetic reaction processes
occurring in the subducting sediment. Within the 100 to 150°C temperature range thought to
coincide with the updip limit of seismicity a number of reactions take place which could affect
fault strength and behavior. Smectite, a common clay mineral found in subducting sediment,

26
transforms to illite; this transition results in a release of fluid and potentially a change in
frictional properties (Saffer and Marone, 2003). Also in this temperature range, hydrocarbon
generation peaks, which may affect fluid pressure and effective stress on the plate boundary
fault. At slightly lower temperatures (~50-100 ˚C) opal is transformed to quartz. This transition
results in a release of fluid and may affect mechanical properties as quartz cements form.
The downdip limit of seismicity, which occurs in the 350 to 450°C range, is thought to be
controlled by the transition from velocity-weakening to velocity-strengthening behavior of rocks
as they are subducted and heated (Tse and Rice, 1986). In velocity-weakening material, friction
decreases with slip, allowing unstable sliding. In velocity-strengthening material, friction
increases with slip; earthquakes cannot be generated in such material.
The thermal state of the ocean crust entering a subduction zone will affect the length and
location of the seismogenic zone. The length of the seismogenic zone constrains the maximum
earthquake rupture width (and therefore magnitude). Seismogenic zone location is important
since earthquakes that occur near the seafloor (i.e. furthest seaward) have the greatest potential
for tsunami generation, while the proximity to land controls ground shaking in coastal areas.
1.3.3 Thermal Models
Thermal models of subduction zones are needed in order to better understand processes
occurring there. Due to the high cost and difficulty of drilling deep into a subduction zone, in
situ measurements are rare (and only very near the trench, to date (Shipboard Scientific Party,
1997)). Thermal models constrained by surface heat flux data are valuable for better
understanding the thermal structure of subduction zones. Models are most often constructed as
2D cross sections perpendicular to the subduction zone and designed with geometries and
parameters of well studied subduction zones. For example, Hyndman and Wang (1995) modeled

27
temperatures of the Nankai Trough, off southwest Japan for two transects in order to estimate
temperatures in the seismogenic zone. Their preferred model results are constrained by
extensive heat flux data and results are shown for a range of estimated of crustal ages. Results
under-predict heat flux at the margin and over-predict it at distances farther into the subduction
zone (Figure 1.9). They acknowledge that neither their models nor previous models are able to
fully explain the observed heat flux data and attribute the discrepancy either to some unknown
upper prism process that results in nearly isothermal conditions for 60 km landward of the trench
or to measurement uncertainties.
Figure 1.9: Heat flux data at Nankai compared to heat flux from thermal models with varying plate age (Hyndman and Wang, 1995). Heat flux data is higher than predicted by thermal models near the trench and lower than predicted at distances >30 km.

28
Hyndman and Wang (1993) modeled subduction zone temperatures for the Cascadian
subduction zone, offshore of Oregon and Vancouver Island. The Cascadia subduction zone is an
exceptionally hot margin with seismic behavior starting at the trench. They recognize the
importance of using thermal models of subduction zone along this margin as a tool for
constraining the landward limit of seismicity since there is no historical record of megathrust
earthquakes occurring there. In their models, they use the effect of heat produced by friction
along the décollement as the variable to fit modeled heat flux to observations of heat flux along
the margin since the other parameters were well constrained for this region. Hyndman and Wang
(1993) also vary convergence rate and plate age in order to perform a sensitivity analysis on their
preferred thermal model. Their preferred model, which assumes negligible frictional heating, is
a reasonable match to heat flux observations along this margin although large scatter in the data
leave room for interpretation (Figure 1.10).
Figure 1.10: Comparison of thermal model along the Cascadia margin with heat flux observations. Results agree best with the model that has negligible frictional heating along the décollement although the large scatter in data leaves room for interpretation.
29
Spinelli et al. (2006) modeled subduction zone temperatures off Nicoya Peninsula, Costa
Rica where the there is an offset in seismicity from subducting crust formed at the Cocos-Nazca
Spreading Center and the East Pacific Rise. Their model accounts for the cooling effects of
hydrothermal circulation in the well-ventilated East Pacific Rise ocean crust by arbitrarily
keeping that crust cool for 10 km into the subduction zone. The Cocos-Nazca Spreading Center
crust, with more continuous sediment cover, is not cooled by open hydrothermal circulation
(Fisher et al., 2003). Spinelli et al. (2006) examine fluid pressures along the décollement that
result from thermally driven diagenetic reaction progress in subducted sediment. Based on their
model, they suggest that the observed offset of the updip limit of seismicity may partially be
controlled by differences in the location of peak fluid generation in the subducting sediment.
Although other thermal models exist for these well studied subduction zones along with
other less studied margins (e.g. Wang et al., 1995; Negredo et al., 2004), none of them model
hydrothermal circulation in subducted ocean crust. The few models that account for the cooling
effects of hydrothermal circulation do so by either cooling ocean crust prior to subduction (e.g.
Harris and Wang, 2002; Langseth and Silver, 1996) or by maintaining reduced temperatures in
the shallow subduction zone (Spinelli and Saffer, 2004). These thermal models are often used to
make inferences about subduction zone processes and are therefore a valuable tool for
understanding subduction zones. This study looks to expand on previous models by examining
the effects of hydrothermal circulation in subducted ocean crust.
1.3.4 Hydrothermal Circulation Continuing in Subducted Crust
Measurements of permeabilities in ocean crust have shown that high permeability exists
in ocean crust prior to subduction, but little is known about permeability trends in ocean crust

30
once it is subducted. Depth dependant permeability curves for continental crust show that
permeability decreases more than three orders of magnitude from the surface to ~10 km depth
(i.e. the base of the brittle crust) due to chemical and mechanical sealing of fractures (Manning
and Ingebritsen, 1999). Several differences between continental crust and subducting ocean
crust suggest that permeability should be better maintained in subducting ocean crust.
Subducting crust is much colder than continental crust at equivalent depth. In addition,
subducting crust spends less time at elevated temperatures than continental crust at depth. The
relatively cool and short thermal history for subducting crust compared to continental crust
should minimize the chemical sealing of fractures. Bend-related normal faulting of ocean crust
approaching and entering a subduction zone results from tensional stress in the upper part of the
plate (Ludwig et al., 1966; Ranero et al., 2003). The opening of fractures throughout the bending
plate should counter the mechanical effects of increasing confining pressure resulting from the
load of the overlying margin wedge.
Although permeability measurements of sedimentary rocks are much more numerous,
there are a few actual permeability measurements of gabbros and basalts with increasing
effective stress. Several experiments on core samples of these rocks have been examined in the
lab to determine effective stress, or depth, dependant permeability trends (Morrow et al., 1994;
Christensen and Ramananantoandro, 1988; Karato, 1983; Trimmer et al, 1980). These
experiments generally show a log-linear relationship between permeability and increasing
effective stress up to pressures of 60 MPa. However, permeabilities of these core samples are
not representative of permeabilities found in basalts of the upper basement aquifer. While the
permeability of the ocean crust aquifer likely decreases as it is subducted beneath the overriding
31
plate, high permeability (and therefore hydrothermal circulation) is likely maintained for some
distance into the subduction zone.
1.3.5 Diagenetic and Metamorphic Reaction Progress
As sediments are subducted in subduction zones, diagenetic and metamorphic mineral
transitions occur due to increasing temperatures and pressures. Using this idea, Kagami (1985)
first suggested that smectite metamorphism is linked to the seismic front observed in the Nankai
Trough as a way to explain observed seismic patterns in this region. This idea has since been
tested by others and had become largely accepted by the scientific community as a primary
mechanism controlling the updip limit of seismicity (Vrolijk, 1990; Hyndman and Wang, 1993).
The thermal history of subducting sediment is the main constraint that governs where the
smectite-illite transition occurs and this well documented transition takes place around 100-
150°C (e.g. Hyndman et al., 1997; Moore and Saffer, 2001), which coincides with the currently
accepted temperature range associated the updip limit of seismicity in well studied regions.
Experimental results suggest that smectite is weaker and will deform more easily than illite under
low confining pressures (Shimamoto and Logan, 1981). It is thought that the weak hydrous
crystal structure of smectite leads to aseismic slip behavior in subduction zones, as opposed to
the stronger nonhydrous illite crystal structure which will behave seismically. However, this
early idea is refuted by recent examination of the frictional properties of smectite- and illite-rich
gouge. Saffer and Marone (2003) conducted a series of experiments to test the hypothesis that
the smectite to illite transition in gouge material, similar to that found in subduction zones,
results in a transition from velocity-strengthening to velocity weakening behavior. They found
that, although the transition from smectite to illite results in an increase in frictional strength, it is
32
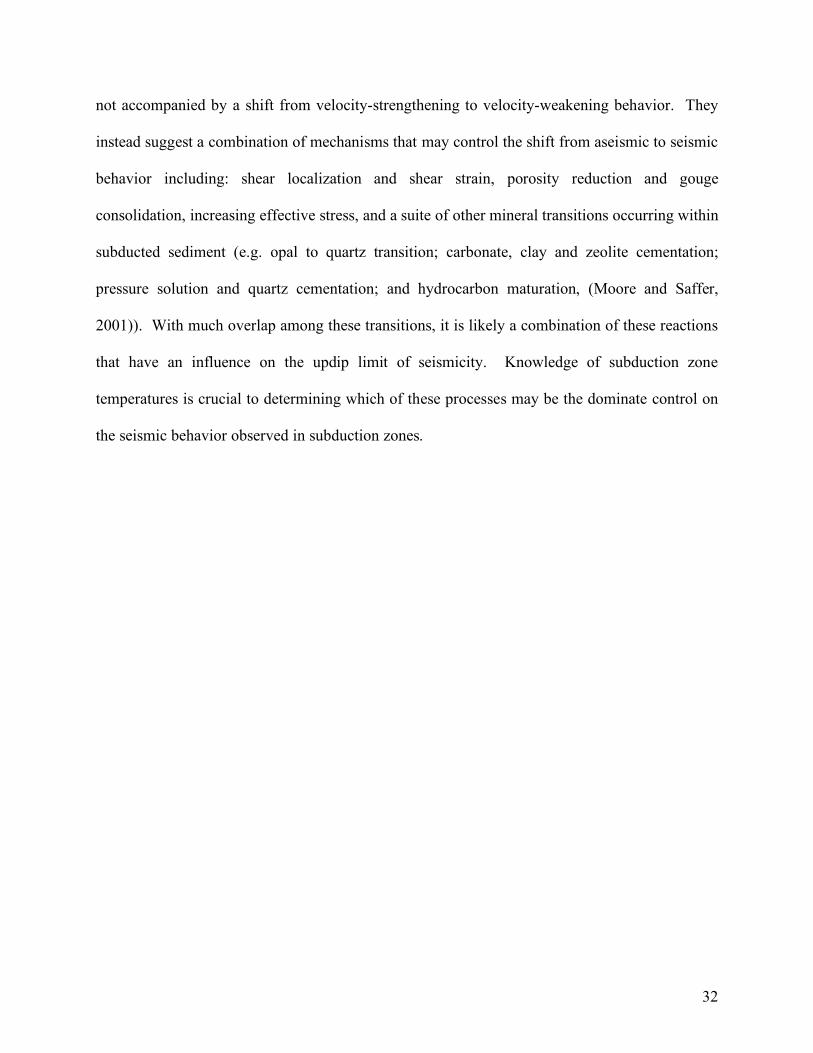
not accompanied by a shift from velocity-strengthening to velocity-weakening behavior. They
instead suggest a combination of mechanisms that may control the shift from aseismic to seismic
behavior including: shear localization and shear strain, porosity reduction and gouge
consolidation, increasing effective stress, and a suite of other mineral transitions occurring within
subducted sediment (e.g. opal to quartz transition; carbonate, clay and zeolite cementation;
pressure solution and quartz cementation; and hydrocarbon maturation, (Moore and Saffer,
2001)). With much overlap among these transitions, it is likely a combination of these reactions
that have an influence on the updip limit of seismicity. Knowledge of subduction zone
temperatures is crucial to determining which of these processes may be the dominate control on
the seismic behavior observed in subduction zones.

33
CHAPTER 2: EXPERIMENTAL PROCEDURE
2.1 MODEL SET-UP
In order to assess the potential thermal effects of fluid circulation in subducting ocean
crust, I model coupled fluid and heat transport in a subduction zone. Models are constructed as a
2D cross-section of a subduction zone perpendicular to the trench. The geometry of the Middle
America subduction zone is used as a base case from which to compare a suite of simulations
with varying convergence rates and geometries. Different simulations are not meant to model
specific subduction zones but rather to allow analysis of how the system responds to changes in
basic subduction zone properties. The results from this study may be used to make inferences
about subduction zones in a more general sense and to help guide future work.
In the modeled cross-sections, the ocean crust is divided into three parallel layers
consisting of a 100 to 400 m thick layer of sediment, 600 m of upper basement and ≥2500 m of
lower basement. The horizontal and vertical node spacing is described in Table 2.1 (the vertical
node spacing decreases as the wedge approaches the ocean crust and tapers out). The total
number of nodes for each model is ≥31,027; the model domain dimensions are ≥39 km long and
10 km high. The finite element grids for the simulations are created using Los Alamos Grid
Toolbox (LaGriT; Gable et al., 1996).
Node Spacing (m) vertical horizontal Wedge 30 50 Sediment 67 50 Upper Basement
0 - 100 m 50 50 100 - 600 m 67 100
Lower Basement 463 200 Table 2.1: Node spacing for models.
34
The sides of the model are no-flow boundaries. The temperature along the seafloor is
held constant at 2°C and pressures are hydrostatic with a maximum depth at the trench of 4.4 km.
The bottom boundary has no fluid flow and a constant heat flux. The basal heat flux (105
mW/m2) is calculated from a standard lithospheric cooling model (e.g. Harris and Chapman,
2004) for 20 Ma ocean crust entering the subduction zone (Figure 2.1). This is the typical age
for crust entering the Middle America subduction zone off northern Costa Rica (Barckhausen et
al., 2001).
The simulations start with ocean crust that has not been subducted (i.e. no margin wedge
in place) and are allowed to run until temperatures reach a quasi steady-state (temperatures may
still be fluctuating but the average value is not changing). Subduction of the ocean crust is
simulated by incrementally adding sections of the margin wedge on top of the ocean crust. The
margin wedge sections are added in steps with approximately 1 km of ocean crust being
subducted with each step. The time allowed to pass between the addition of each wedge section
determines the convergence rate. At the end of the simulation, the seaward boundary is ≥10 km
from the trench and ≥ 27 km of ocean crust has been subducted. All of the sediment on the
incoming plate is subducted simulating a non-accretionary wedge. The initial time step for each
simulation is 0.25 hours and a time-step multiplier between 1.2 and 1.5 is used to increase each
time step. The simulation runs for 11,780 years with the addition of each 1 km of wedge
material
Simulations are initially run for a case with no fluid flow. Temperatures for this
conductive case are used as a benchmark from which to compare to simulations with fluid flow.
The simulations with fluid flow start with temperatures from the conductive case prior to
subduction and hydrostatic fluid pressures. Buoyancy driven fluid flow begins and convection

35
develops in the upper basement aquifer. Fluid flow is allowed to continue as ocean crust is
subducted.
Figure 2.1: Cartoon illustrating models with (a) faults exposing high permeability basement and (b) continuous sediment cover.
Modeled sediment and rock properties are summarized in Table 2.2. Sediment porosity
and permeability decrease with depth consistent with trends for hemipelagic sediment (Spinelli et
al., 2004). Sediment grain thermal conductivity is 2.60 W/m °C. The upper 600 m of basaltic
basement is a high permeability aquifer which represents pillow basalts and sheet flows. The
thickness of this unit is constrained by thermal observations and models for the Cocos plate
offshore Costa Rica (Hutnak et al., 2007). Porosity of the basement rock decreases
incrementally with depth from 0.15 to 0.05. Permeability in the upper basement aquifer is held
constant and simulations are run for a range of permeabilities from 10-13 to 10-10 m2. In

36
additional simulations, permeability decreases with increasing effective stress as the ocean plate
is subducted. This simulates a decrease in permeability associated with the closing of fractures
and pore space that is likely to occur in subducting crust. In these simulations, permeability
decreases from 10-10 m2 prior to subduction to ~10-12 m2 under the thickest modeled margin
wedge. The decrease in permeability follows a trend parallel to that for laboratory experiments
on fractured gabbro (Trimmer et al., 1980), and is of similar magnitude as the average trend for
continental rocks (Manning and Ingebritsen, 1999). Quantitative constraints on changes in
subducting crust permeability with increasing burial depth are not yet available. The decrease in
permeability with depth used here likely represents a maximum permeability reduction for
subducting crust. We also examined a case where hydrothermal circulation is “shut off” at the
trench. This allows comparison to previous subduction zone thermal models that make this
simplifying assumption. In this case, permeability of basement aquifer material prior to
subduction (i.e. seaward of the trench) is 10-10 m2; permeability of subducted crust (i.e. landward
of the trench) is drastically reduced (10-17 m2), so no thermally significant fluid circulation
occurs in the subducted ocean crust.
Below the upper basement aquifer, the complex of sheeted dikes and gabbros is modeled
as low permeability unit that does not host vigorous hydrothermal circulation. Porosity for this
unit decreases with depth from 0.02 to 0.01 and permeability is held constant at 10-17 m2 (Becker,
1996). The thickness of this low permeability unit is ≥2500 m over the entire model domain.
The grain thermal conductivity for the basement rock is 2.05 W/m °C. Fluid viscosity and
density are functions of pressure and temperature (Parry et al., 2000). Fluid thermal conductivity
is 0.62 W/m °C.

37
Table 2.2: Model material properties.
Simulations are run for an open circulation case with normal faults exposing the upper
basement aquifer on the incoming plate to the ocean floor. The model mimics the geometry of
the Middle America subduction zone off the Nicoya Peninsula. The dip along the décollement is
6° and the slope of the margin wedge is 5.4°. The faults are modeled as 200 m vertical offsets
that are spaced evenly every 3 km across the modeled domain, typical for faulted crust entering
the Nicaragua subduction zone (Ranero et al., 2003). The sediment layer is 100 m thick,
allowing for 100 m of the upper basement aquifer to be exposed to the ocean floor along each
fault. This effectively simulates an open circulation system where cool ocean bottom water
recharges the upper basement aquifer and heated hydrothermal fluids are expelled at the seafloor.
The convergence rate for this model is 8.5 cm/yr.
A second series of simulations is run with the same geometry but for ocean crust that
does not contain faults exposing the upper basement aquifer. Instead, a continuous layer of
sediment covers the ocean crust. The sediment layer is 400 m thick; the thick low permeability
sediment hydrologically isolates the basement aquifer from the overlying ocean (i.e. closed

38
circulation in the basement aquifer). Using this geometry, simulations are run with convergence
rates of 2 cm/yr, 8.5 cm/yr and 12 cm/yr. The intermediate convergence rate (8.5 cm/yr) is a rate
for the northern Costa Rica margin (DeMets, 2001). The end-member convergence rates are for
typical fast (e.g. Chile) and slow (e.g. Scotia, Lesser Antilles) convergent subduction zones
(Stern, 2002).
A third series of simulations is run for a system with a much lower wedge taper than the
other models. The dip along the décollement is 2.0° and the slope of the margin wedge is 1.5°.
This low wedge taper end-member is representative of subduction zones such as the Lesser
Antillies and Burma (Stern, 2002). The sediment consists of a 400 m thick continuous blanket of
sediment and the convergence rate is 8.5 cm/yr.
2.2 DESCRIPTION OF FEHM
I use FEHM, a finite element heat and mass transfer code developed by the Hydrology,
Geochemistry & Geology Group (EES-6) at Los Alamos National Laboratory, to simulate
coupled fluid and heat transport in a subduction zone. Complete documentation for the code is
available online: http://ees1.lanl.gov/EES5/fehm/. In this study, the code is used to simulate
flow and energy transport for heat and mass transfer with pressure and temperature dependent
properties, relative permeabilities and capillary pressures. Fluid properties are a function of
pressure and temperatures and are obtained from a look-up table.

39
The conservation of mass equation used by FEHM is:
(1)
((1 ) ) ((1 ) ) ((1 ) (1 ) ) 0v v l l v v l l mv l m v v l l
v l v l
kR kR kR kR AP P q g
z t
! ! ! !" " " ! " !
µ µ µ µ
# # # $$#%• # % + # % + + # + # + =
$ $
where k is permeability, R is relative permeability, µ is viscosity, P is pressure, g is acceleration
due to gravity, η is the concentration of the noncondensible gas expressed as a fraction of the
total mass, ρ is density, q is a source or sink term (applies to constant pressure boundary
condition), subscripts v and l refer to vapor and liquid phases respectively and Am is mass per
unit volume expressed as:
(2) ( (1 ) (1 ))m v v v l l lA S S! " # " #= $ + $
where ! is porosity and S is saturation. Major assumption are slow fluid velocities, thermal
equilibrium between fluid and rock locally, an immovable rock phase and negligible viscous
heating. Equations (1) and (2) can be combined and simplified for single phase liquid flow:
(3) ( )( ) ( ) 0l l l
m l
l l
k kP q g
z t
! ! "!!
µ µ
# $$% + + + =
$ $
Under the same simplifications, the conservation of energy equation used by FEHM is:
(4) ( ) ( ) ( ) 0l l ee
l l
k k Ah P K T q g h
z t
! !!
µ µ
" " " " ##"$• $ "$• $ + + + =
# #

40
where h is the specific heat enthalpy of water, K is the effective thermal conductivity, T is the
temperature, qe is the energy contributed from sources and sinks and Ae is the energy per unit
volume expressed as:
(5) (1 ) ( )e r r l lA ! " # ! "#= $ +
where ν is specific internal energies and the subscript r is for the rock matrix.
Equations (3) and (4) are the governing equations for heat and mass transport used in this
application of FEHM.
The primary numerical method used by FEHM is the Finite Element Method as described by Zienkiewicz et. al (1977) and the system of equations is solved by the Newton-Raphson iterative procedure as described by Zyvoloski et. al (1999). Output consists of pressures, temperatures, and velocity vectors of fluid flow at each node. 2.3 CALCULATIONS 2.3.1 Décollement Temperatures and Heat Flux Modeled temperatures along the décollement are extracted directly from FEHM output
files. The décollement is defined as the interface between the top of the sediment along the
subducting plate and the overriding wedge material. These temperatures are used to easily
compare the effects of hydrothermal circulation on subduction zone temperatures for many
models. In addition, décollement temperatures are widely cited from subduction zone thermal
models due to the importance of associating these temperatures with observations of seismic
behavior.
Another important tool for looking at subduction zones is heat flux data. For our models,
heat flux is calculated along the top of the wedge material and is defined as:

41
(6) HF
Tq K
z
!= "
!
where qHF is heat flux, K is thermal conductivity and ΔT/Δz is the vertical temperature gradient.
Heat flux data at subduction zones is much more extensive than observations of décollement
temperatures.
2.3.2 Diagenetic Reaction Progress
The thermal history of subducting sediment controls diagenetic reaction progress.
Therefore, alteration of subduction zone temperatures through hydrothermal circulation plays an
important role in governing these processes. We use the thermal history of subducting sediments
in our simulations to estimate diagenetic reaction progress. Opal to quartz reaction progress in
each element of the subducting sediment is calculated based on the sediment temperature in the
element and the amount of time the sediment spends at that temperature. The thermal history of
the sediment is combined with kinetics for the opal-A to opal-CT and opal-CT to quartz
reactions (Mizutani, 1970) to model the proportions of the three silica phases in the sediment.
Reaction progress is measured as the percent of the initial fraction of each mineral that is still
present. The laboratory derived kinetic expressions for the smectite-to-illite and opal-to-quartz
reactions used are:
(7) 1
dAk A
dt= !
where dA/dt is the rate of opal-A conversion to quartz, A is the mole fraction of opal-A present,
and k1 is a temperature-dependent rate constant:
(8) 11 1 exp( )
Ek a
RT=

42
where a1 is the frequency factor (23700 yr-1), E1 is activation energy (16 kcal/mole), R is the
universal gas constant and T is temperatures. Similarly, the rate of opal-CT conversion to quartz
is:
(9) 2
dCk C
dt= !
where dC/dt is the rate of opal-CT conversion to quartz, C is the mole fraction of opal-CT
present and k2 is a temperature-dependent rate constant. The smectite-illite conversion is:
(10) 2exp( )aEdS
A KSdt RT
!= !
where S is mole fraction of smectite, A is frequency factor (25481 yr-1), Ea is activation energy
(28 kcal/mole), K is potassium concentration (M) in pore water.
2.3.3 Dimensionless Numbers
The Nusselt number was calculated in order to examine the importance of advective
versus conductive heat transport in the system. The Nusselt number is defined as:
(11) w w w m
m
Tc q T K
LNuT
KL
!"
+"=
"
"
where cw is specific heat capacity, ρw is density of the fluid, qw is heat flux, T is temperature, Km
is thermal conductivity of porous medium and ΔT/ΔL is the temperature gradient. The advective
heat transport is calculated across the middle of the upper basement aquifer. The conductive heat
transport is calculated as the heat flux into the bottom of the aquifer. This measure approximates
the heat that would be transported by conduction in the aquifer, in the absence of the advection

43
of heat by fluid flow. Thus, the Nusselt number compares the relative importance of advective
and conductive heat transport in the aquifer.
In addition, the Rayleigh number was also calculated in order to examine the importance
of buoyant forces driving fluid flow. The Rayleigh number is defined as:
(12)
!
Ra ="gkL2#wq
µ$K
where α is thermal expansively, ρw is fluid density, g is gravitational acceleration, k is
permeability, L is aquifer thickness, q is heat flux into the base of the aquifer, µw is dynamic
viscosity, κ is thermal diffusivity of the aquifer, and K is the porous medium thermal
conductivity. In addition to calculating the Rayleigh number for the entire aquifer, it is also
calculated as a function of distance along the aquifer. This is done by calculating individual
Rayleigh numbers along vertical 1D paths across the aquifer. Although this calculation does not
follow the conventional approach for examining the Rayleigh number, it does provide useful
information about changes in the buoyant driving forces of fluid flow in our simulations.
44
Chapter 3: EXPERIMENTAL RESULTS
3.1 COMPARISON TO ACCEPTED THERMAL MODEL
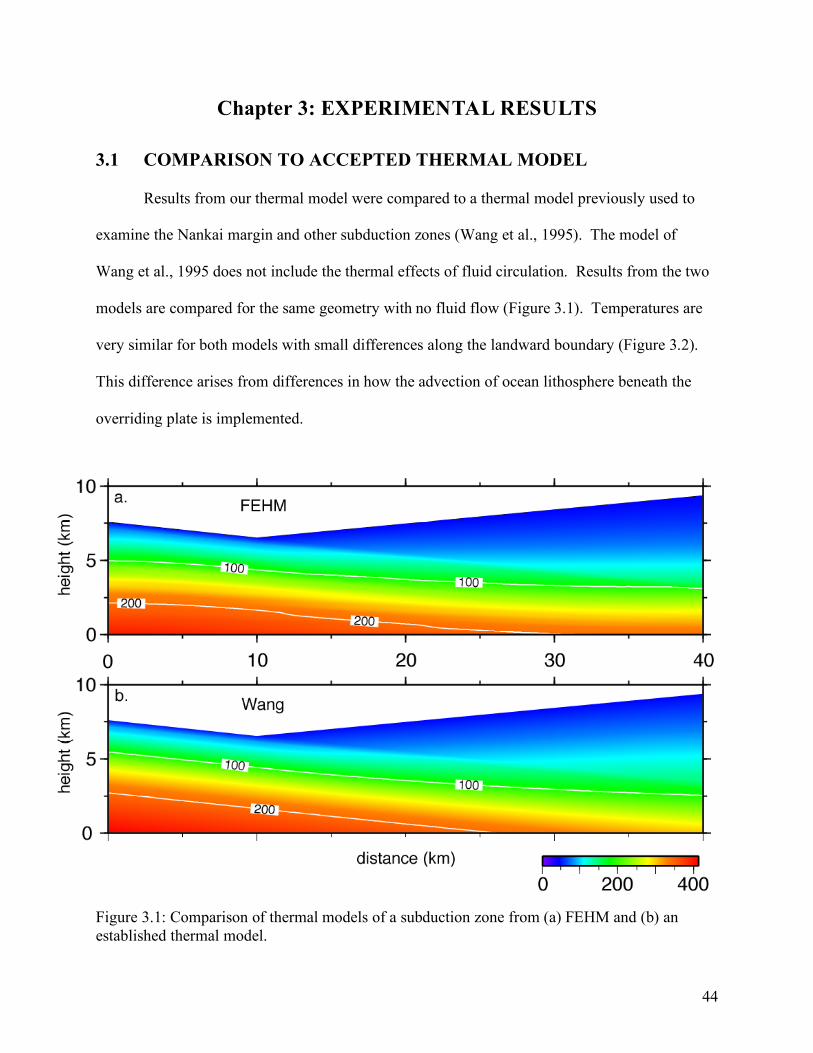
Results from our thermal model were compared to a thermal model previously used to
examine the Nankai margin and other subduction zones (Wang et al., 1995). The model of
Wang et al., 1995 does not include the thermal effects of fluid circulation. Results from the two
models are compared for the same geometry with no fluid flow (Figure 3.1). Temperatures are
very similar for both models with small differences along the landward boundary (Figure 3.2).
This difference arises from differences in how the advection of ocean lithosphere beneath the
overriding plate is implemented.
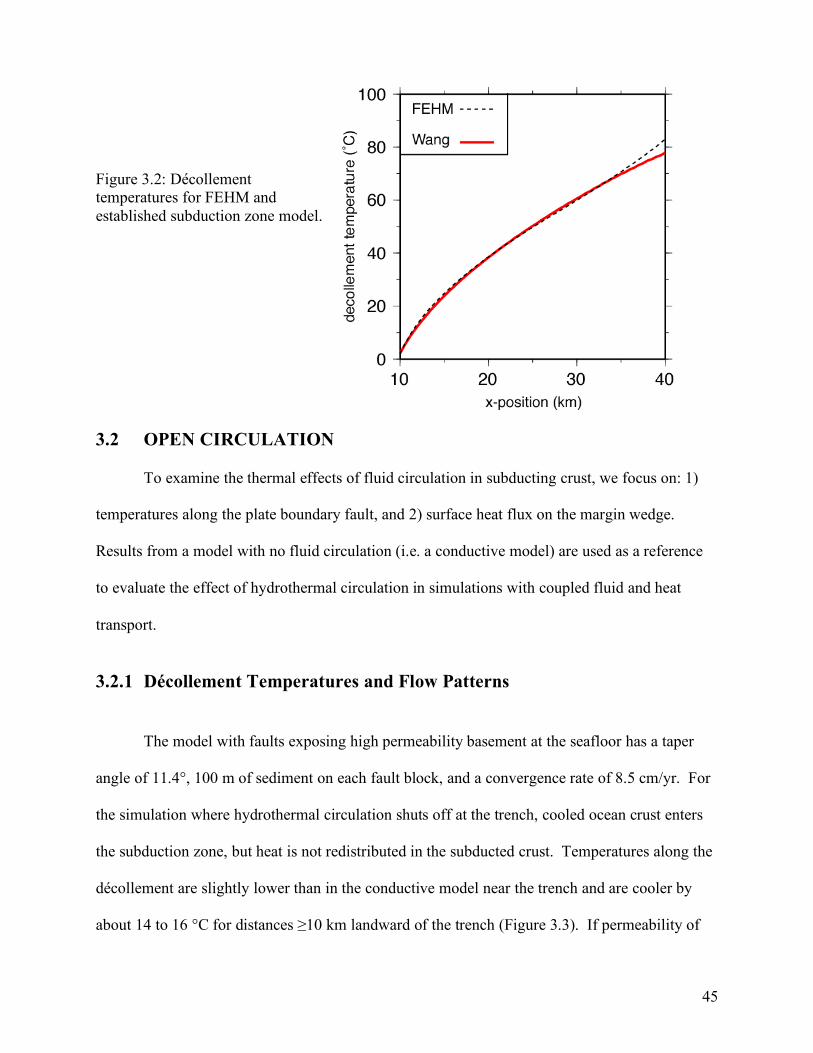
Figure 3.1: Comparison of thermal models of a subduction zone from (a) FEHM and (b) an established thermal model.
45
Figure 3.2: Décollement temperatures for FEHM and established subduction zone model.
3.2 OPEN CIRCULATION
To examine the thermal effects of fluid circulation in subducting crust, we focus on: 1)
temperatures along the plate boundary fault, and 2) surface heat flux on the margin wedge.
Results from a model with no fluid circulation (i.e. a conductive model) are used as a reference
to evaluate the effect of hydrothermal circulation in simulations with coupled fluid and heat
transport.
3.2.1 Décollement Temperatures and Flow Patterns
The model with faults exposing high permeability basement at the seafloor has a taper
angle of 11.4°, 100 m of sediment on each fault block, and a convergence rate of 8.5 cm/yr. For
the simulation where hydrothermal circulation shuts off at the trench, cooled ocean crust enters
the subduction zone, but heat is not redistributed in the subducted crust. Temperatures along the
décollement are slightly lower than in the conductive model near the trench and are cooler by
about 14 to 16 °C for distances ≥10 km landward of the trench (Figure 3.3). If permeability of
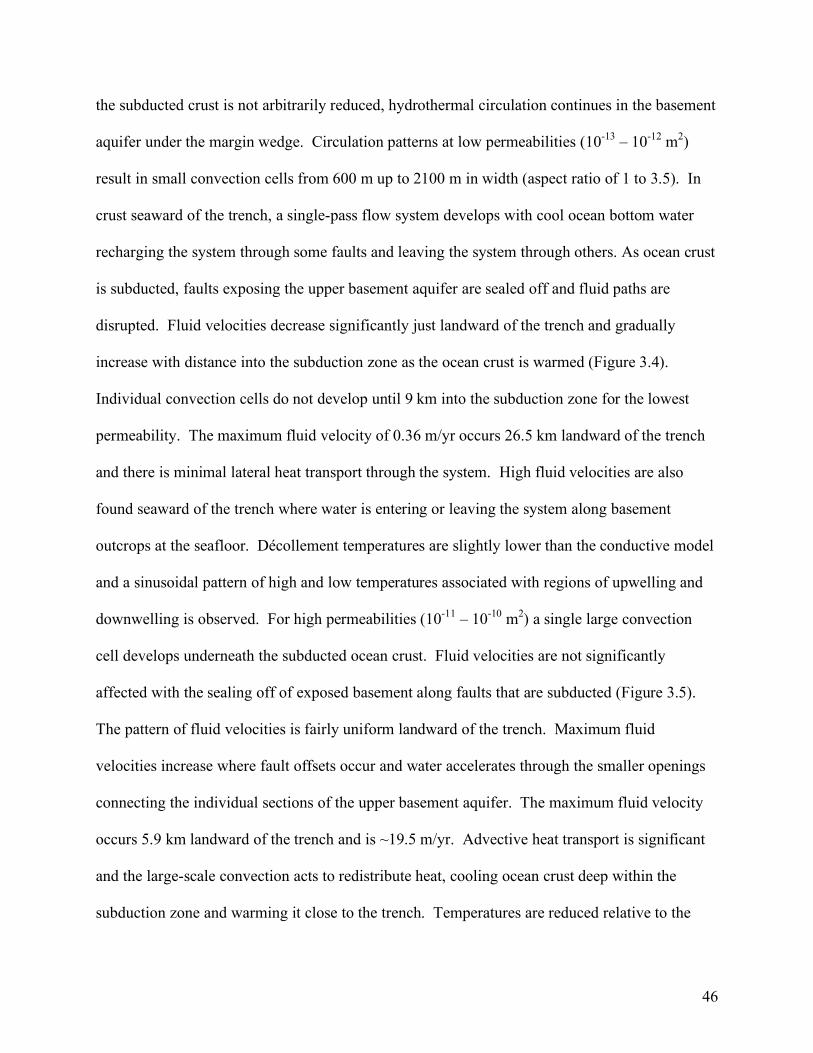
46
the subducted crust is not arbitrarily reduced, hydrothermal circulation continues in the basement
aquifer under the margin wedge. Circulation patterns at low permeabilities (10-13 – 10-12 m2)
result in small convection cells from 600 m up to 2100 m in width (aspect ratio of 1 to 3.5). In
crust seaward of the trench, a single-pass flow system develops with cool ocean bottom water
recharging the system through some faults and leaving the system through others. As ocean crust
is subducted, faults exposing the upper basement aquifer are sealed off and fluid paths are
disrupted. Fluid velocities decrease significantly just landward of the trench and gradually
increase with distance into the subduction zone as the ocean crust is warmed (Figure 3.4).
Individual convection cells do not develop until 9 km into the subduction zone for the lowest
permeability. The maximum fluid velocity of 0.36 m/yr occurs 26.5 km landward of the trench
and there is minimal lateral heat transport through the system. High fluid velocities are also
found seaward of the trench where water is entering or leaving the system along basement
outcrops at the seafloor. Décollement temperatures are slightly lower than the conductive model
and a sinusoidal pattern of high and low temperatures associated with regions of upwelling and
downwelling is observed. For high permeabilities (10-11 – 10-10 m2) a single large convection
cell develops underneath the subducted ocean crust. Fluid velocities are not significantly
affected with the sealing off of exposed basement along faults that are subducted (Figure 3.5).
The pattern of fluid velocities is fairly uniform landward of the trench. Maximum fluid
velocities increase where fault offsets occur and water accelerates through the smaller openings
connecting the individual sections of the upper basement aquifer. The maximum fluid velocity
occurs 5.9 km landward of the trench and is ~19.5 m/yr. Advective heat transport is significant
and the large-scale convection acts to redistribute heat, cooling ocean crust deep within the
subduction zone and warming it close to the trench. Temperatures are reduced relative to the
47
conductive simulation everywhere along the décollement. At the furthest extent of the model (30
km landward of the trench) temperatures are reduced by 62°C relative to the simulation with no
fluid flow; temperatures at the landward edge of the model are ~46 ˚C lower than in the case
with circulation shutting off at the trench. For the simulation where permeability decreases with
increasing effective stress, one large convection cell develops that extends 3 km seaward of the
trench and 6 km landward of the trench (Figure 3.6). Convection cells decrease in size with
distance into the subduction zone. The maximum fluid velocity prior to subduction is 14.7 m/yr
and it decreases to 0.37 m/yr at the landward end of the model.
Figure 3.3: Temperatures along the décollement for open circulation system. Temperatures are nearly isothermal for the highest permeability simulation.
48
Figure 3.4: Disruption of fluid circulation for a permeability of 10-13 m2 as (a) a fault exposing the upper basement aquifer is subducted and (b) sealed off.

49
Figure 3.5: Fast recovery of fluid circulation for a permeability of 10-10 m2 as (a) a fault exposing the upper basement aquifer is subducted and (b) sealed off.

50
Figure 3.6: Thermal structure and circulation patterns for simulations with a permeability of (a) 10-13 m2, (b) as a function of increasing effective stress and (c) 10-10 m2.
51
3.2.2 Heat Flux
As with décollement temperature, heat flux for the conductive simulations is used as a
benchmark to evaluate the effect of hydrothermal circulation in simulations with fluid flow. For
all simulations heat flux is highest at the trench and decreases with distance landward of the
trench. For simulations with faults exposing high permeability basement at the seafloor, heat
flux is significantly altered from the conductive simulation for all permeabilities (Figure 3.7).
Heat flux is suppressed by ~ 30 to 75 mW/m2 at the trench in all cases. For low permeabilities,
heat flux remains suppressed by > 20 mW/m2 for 3 km landward of the trench, after which
differences in heat flux become small. Heat flux remains suppressed by >20 mW/m2 than in the
conductive case for ~ 8 km landward of the trench for the highest permeability, for permeability
decreasing with depth and for permeability shutting off at the trench. Heat flux anomalies of <20
mW/m2 would likely be difficult to identify in transects of seafloor heat flux observations due to
the typical amount of scatter in these measurements.
Figure 3.7: Heat flux for simulation with open circulation showing suppressed heat flux at the trench.
52
3.2.3 Diagenetic Reaction Progress
Alteration of subduction zone temperatures through hydrothermal circulation plays an
important role in governing the rate and location of diagenetic reaction progress. The peak in
opal-to-quartz reaction progress is shifted farther landward in hydrothermally cooled ocean crust
(Figure 3.8). The nearly isothermal temperatures in the subducted sediment allow for > 97% of
the opal to remain at the furthest extent of the model versus 39% for the simulation with no fluid
flow.
Figure 3.8: Opal-A reaction progress for simulations with open circulation. Cooling of ocean crust results in the slowing of thermally driven reaction progress.
53
3.2.4 Nusselt Number
The Nusselt number is calculated to examine the relationship between advective and
conductive heat transport in the upper basement aquifer. For low permeabilities the advective
heat transport is only slightly more important than the conductive heat transport and Nusselt
numbers are between 1.3 to 1.5. Advective heat transport becomes important at high
permeabilities and dominates the movement of heat through the system at the highest
permeability with a Nusselt number of ~74. The Nusselt number is highest for the simulation
where permeability is a function of effective stress at ~85 (Table 3.1). This is due to high fluid
velocities moving warm water near the trench.
permeability Nu Ra
10-10 m2 74 4.00E+05
10-11 m2 10 4.93E+04
10-12 m2 1.4 5.63E+03
10-13 m2 1.4 6.69E+02 k=f(depth) 85 1.51E+05
Table 3.1: Nusselt number and Rayleigh number for simulations with open circulation.
3.2.5 Rayleigh Number
The Rayleigh number is used to examine buoyant forces driving convection in the
simulations. Rayleigh numbers for all simulations are high, indicating that buoyant forces will
drive vigorous convection. The Rayleigh number increases with increasing permeability from
669 at the lowest permeability to 4.00x10⁵ at the highest permeability. The Rayleigh number is
1.51x10⁵ for the simulation where permeability changes with effective stress (Table 3.2).
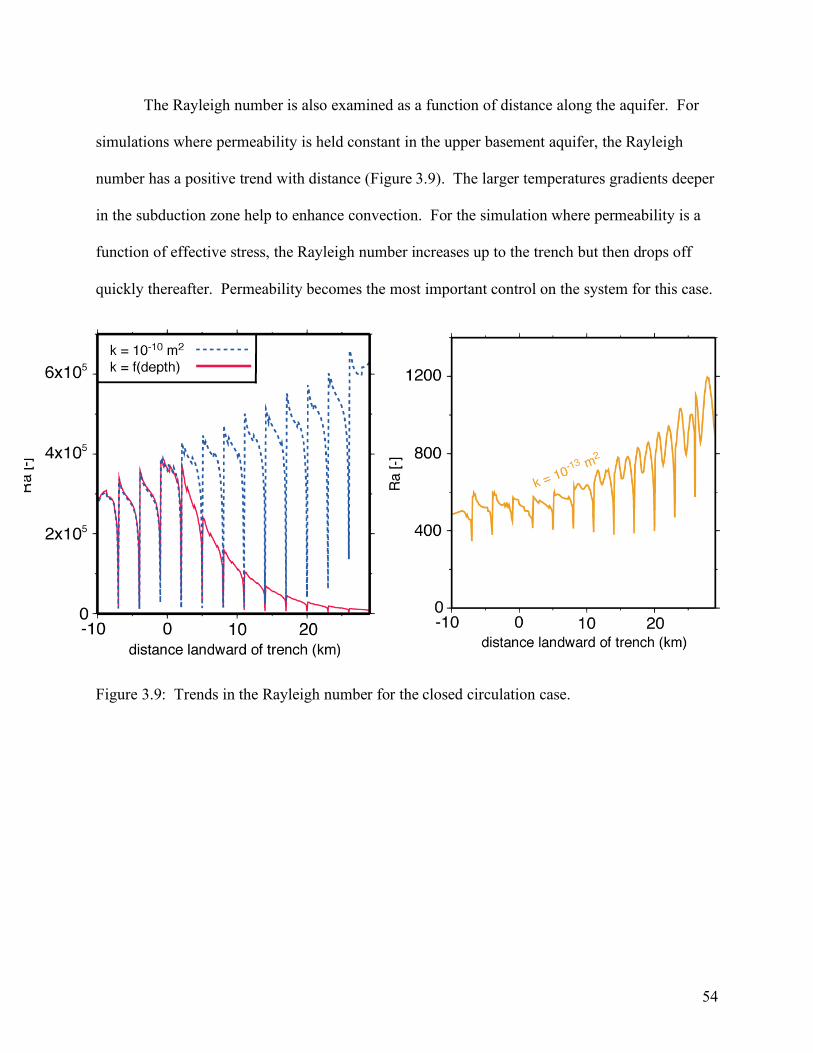
54
The Rayleigh number is also examined as a function of distance along the aquifer. For
simulations where permeability is held constant in the upper basement aquifer, the Rayleigh
number has a positive trend with distance (Figure 3.9). The larger temperatures gradients deeper
in the subduction zone help to enhance convection. For the simulation where permeability is a
function of effective stress, the Rayleigh number increases up to the trench but then drops off
quickly thereafter. Permeability becomes the most important control on the system for this case.
Figure 3.9: Trends in the Rayleigh number for the closed circulation case.

55
3.3 CLOSED CIRCULATION
3.3.1 Decollement Temperatures and Flow Patterns
The closed circulation model has a taper angle of 11.4°, continuous sediment cover that is
400 m thick and a convergence rate of 8.5 cm/yr. For the simulation where hydrothermal
circulation shuts off at the trench, temperatures along the décollement are similar to the
conductive model near the trench and are cooler by about 10-15°C for distances ≥10 km
landward of the trench (Figure 3.10). Circulation patterns at low permeabilities (10-13 - 10-12 m2)
result in small convection cells in the upper basement aquifer that range from 320 m up to 1320
m wide. Convection cells have an aspect ratio between 0.5 and 1.5 and cell width increases with
distance into subduction zone. Fluid velocities increase with distance landward of the trench.
The maximum fluid velocity of ~0.45 m/yr occurs 28.9 km landward of the trench and there is
minimal lateral heat transport through the system. Décollement temperatures are slightly lower
than the conductive model and sluggish convection results in a sinusoidal pattern of high and low
temperatures associated with upwelling and downwelling limbs (Figure 3.10). For high
permeabilities (10-10 to 10-11 m2) a single large convection cell develops in the subducted ocean
crust. The maximum fluid velocity of ~24.2 m/yr occurs 6.7 km landward of the trench and
advective heat transport is significant. The large-scale convection acts to redistribute heat
laterally, cooling ocean crust deep within the subduction zone and warming it close to the trench.
Temperatures are elevated relative to the conductive model within 8.4 km of the trench;
landward of this temperatures are reduced. At the furthest extent of the model (30 km landward
of the trench) temperatures are reduced by 41°C relative to the conductive model (Figure 3.10).
For the simulation where permeability decreases with effective stress, maximum fluid velocity
prior to subduction is 9.2 m/yr. Fluid velocities decrease with distance into the subduction zone
56
and are 0.43 m/yr at 30 km landward of the trench. One large convection cell develops that
extends ~26 km landward of the trench. Temperatures along the décollement are slightly
elevated close to the trench and become reduced by ~ 5 km landward of the trench.
Temperatures are ~ 16°C cooler at 30 km landward of the trench (Figure 3.10).
Figure 3.10: (a) Temperatures along the décollement for closed circulation case. At high permeabilities temperatures are elevated near the trench and become suppressed with distance into the subduction zone. (b) Comparison of temperature difference along the décollement for open and closed circulation cases (k = 10-10 m2).

57
Figure 3.11: Thermal structure and circulation patterns for simulations with a permeability of (a) 10-13 m2, (b) as a function of increasing effective stress and (c) 10-10 m2.

58
3.3.2 Heat Flux
For the model with continuous sediment cover, differences in heat flux from the
conductive model are only significant at the highest permeability (10-10 m2). Heat flux is 52
mW/m2 greater at the trench and differences decrease with distance landward of the trench,
nearly reaching conductive values by 5.25 km landward of the trench (Figure 3.12). Heat flux is
elevated in the closed circulation simulations due to the redistribution of heat while heat flux is
suppressed in the open circulation models since heat is advected out of the system at the seafloor.
a. b.
Figure 3.12: (a) Heat flux for closed circulation simulation showing elevated heat flux at the trench. (b) Heat flux anomaly (relative to case with no fluid flow) resulting from open and closed circulation simulations (k = 10-10 m2).

59
3.3.3 Diagenetic Reaction Progress
For the base geometry and convergence rate, progressively more opal remains in the
sediment at 30 km into the subduction zone with increasing permeability (Figure 3.13). At the
highest permeability, less opal remains in the sediment than the conductive case for the first 13
km where hydrothermal circulation acts to warm the ocean crust. At distances >13 km landward
of the trench, hydrothermal circulation acts to cool the crust and the percent opal reaming is
more than that of the conductive case. By 30 km landward of the trench, 57% opal remains in
the sediment for the highest permeability relative to only 5.5% for the conductive simulation.
Figure 3.13: Opal-A reaction progress for closed circulation simulations.

60
3.3.4 Nusselt Number
The Nusselt number is higher for the closed circulation simulation than for the open
circulation system. Even at the lowest permeability, the advective heat transport is more
important than the conductive heat transport with a Nusselt number of 4.6. At high
permeabilities, advective heat transport dominates the movement of heat through the system and
the Nusselt number is > 72. The Nusselt number is highest for the simulation where
permeability is a function of effective stress at 397 (Table 3.2). Warmer temperatures in
combination with high fluid velocities near the trench result in significant advective heat
transport.
permeability Nu Ra
10-10 m2 323 9.02E+05
10-11 m2 72 8.21E+04
10-12 m2 17 8.24E+03
10-13 m2 4.6 9.08E+02 k=f(depth) 397 3.29E+05
Table 3.2: Nusselt number and Rayleigh number for simulations with closed circulation.
3.3.5 Rayleigh Number
Rayleigh numbers are higher for the closed circulation simulations than for the open
circulation systems. The Rayleigh number increases with increasing permeability from 908 at
the lowest permeability to 9.02x10⁵ at the highest permeability. The Rayleigh number is
3.29x10⁵ for the simulation where permeability changes with effective stress (Table 3.2).

61
Trends of the Rayleigh number with distance are similar to those for the closed
circulation simulations. For simulations where permeability is held constant in the upper
basement aquifer, the Rayleigh number has a positive trend with distance (Figure 3.14). For the
simulation where permeability is a function of effective stress, the Rayleigh number increases up
to the trench but then drops off quickly thereafter as permeability decreases. Observed trends of
the Rayleigh number with distance are controlled by temperature gradients for simulations with a
constant permeability in the upper basement aquifer and by permeability for the simulation
where permeability if a function of depth.
Figure 3.14: Trends in the Rayleigh number for the closed circulation case.

62
3.3.6 Wedge Taper and Convergence Rate
TAPER ANGLE
The influence of the wedge taper angle on subduction zone hydrothermal circulation is
examined by adjusting the taper angle of the closed circulation case from 11.4° to 3°; in both
cases the sediment is 400 m thick, convergence rate is 8.5 cm/yr, and permeability ranges from
10-10 m2 to 10-13 m2. Convection patterns for the low taper angle are similar to the base model,
with many small convection cells developing in the upper basement aquifer and maximum fluid
velocity slightly lower at 0.39 m/yr (versus 0.45 m/yr for the base model). For high
permeabilities (10-11 – 10-10 m2) one large convection cell develops, although a single cell the
entire width of the subducted sediment only develops at the highest permeability. The maximum
fluid velocity for the low taper angle case is 13.9 m/yr, a little more than half that of the base
model (24.1 m/yr). Temperatures along the décollement show the same general pattern of the
base model for high and low permeabilities but deviations from the conductive model are much
less pronounced (Figure 3.15). For low permeabilities (10-13 – 10-12 m2), temperature differences
are small and hydrothermal circulation does not play an important role for altering subduction
zone temperatures. For the highest permeability, large variations from the conductive
décollement temperatures only occur at the furthest extend of the model where hydrothermal
circulation reduces temperatures by 10°C.
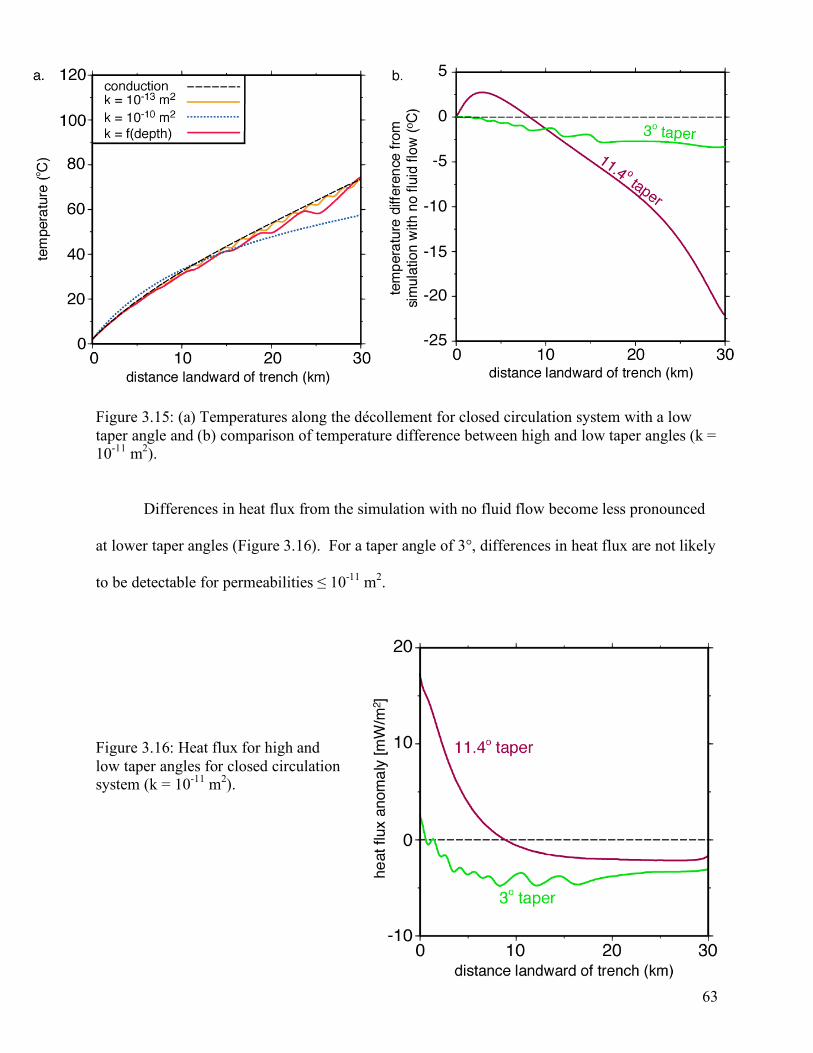
63
Figure 3.15: (a) Temperatures along the décollement for closed circulation system with a low taper angle and (b) comparison of temperature difference between high and low taper angles (k = 10-11 m2).
Differences in heat flux from the simulation with no fluid flow become less pronounced
at lower taper angles (Figure 3.16). For a taper angle of 3°, differences in heat flux are not likely
to be detectable for permeabilities ≤ 10-11 m2.
Figure 3.16: Heat flux for high and low taper angles for closed circulation system (k = 10-11 m2).

64
Diagenetic reaction progress is affected very little through hydrothermal circulation for a
low taper angle. At 30 km into the subduction zone there is little difference in opal-to-quartz
reaction progress at a low taper angle versus that for a high taper angle for the same permeability
(k = 10-11 m2) (Figure 3.17).
Figure 3.17: Comparison of diagenetic reaction progress for high and low taper angles (k = 10-11 m2).
CONVERGENCE RATE
The influence of convergence rates on the thermal effects of subduction zone
hydrothermal circulation is examined by adjusting the convergence rate of the closed circulation
case from 8.5 cm/yr to two end member convergence rates of 2 cm/yr and 12 cm/yr. Model
geometries are the same for all cases (400 m of sediment cover, 11.4° taper angle) and the
permeability is 10-11 m2. One large convection cell develops in the subducted crust; it increases
in size with a decrease in convergence rate (28 km wide for the fastest convergence rate up to the
entire model domain for the slowest convergence rate). Maximum fluid velocities increase from

65
4.1 m/yr for the fastest convergence rate up to 7.9 m/yr for the slowest convergence rate.
Temperatures are significantly higher for the slowest convergence than for the faster
convergence rates. For the conductive simulations, décollement temperatures at the furthest
extent of the model (30 km into the subduction zone) are 100 °C for a convergence rate of 12
cm/yr, 115 °C at 8.5 cm/yr and 204 °C at 2 cm/yr. In the simulations that allow for fluid flow,
décollement temperatures are reduced everywhere landward of the trench for the fastest
convergence rate (Figure 3.18). For the two slower convergence rates, décollement temperatures
are elevated relative to the conductive models for distances less than 8 km from the trench (up to
11.5 °C for a convergence rate of 2 cm/yr) and become reduced farther landward. At 30 km into
the subduction zone and for a convergence rate of 2 cm/yr, décollement temperatures are 89 °C
lower than the conductive simulation.
Figure 3.18: (a) Temperatures along the décollement for slow and fast convergence rates for close circulation simulations and (b) difference in temperature along the décollement from simulation with no fluid flow (k = 10-11 m2).

66
For the simulations with varying convergence rates (base model with a permeability of
10-11 m2) significant differences in heat flux is only observed at the slowest convergence rate of 2
cm/yr. For this simulation heat flux is elevated by >90 mW/m2 at the trench. Heat flux values
reach that of the conductive simulation by 8.9 km landward of the trench and are notably
suppressed at distances greater than 20 km landward of the trench (>15 mW/m2) (Figure 3.19).
Figure 3.19: Heat flux for closed circulation system and varying convergence rates.
For the simulations with varying convergence rates, less opal remains in the sediment for
slower convergence rates. At a convergence rate of 2 cm/yr, all of the opal has been converted to
quartz for the conductive simulation by 18 km landward of the trench. For the simulation with
hydrothermal circulation <1% opal remains at 30 km land ward of the trench. At 12 cm/yr,
~24% of the opal remains in the sediment for the conductive case at 30 km landward of the
trench, while 46% remains for the simulation with hydrothermal circulation (Figure 3.20).

67
Figure 3.20: Opal-A diagenetic reaction progress for closed circulation simulation with varying convergence rates.
68
Chapter 4: DISCUSSION
4.1 HYDROTHERMAL CIRCULATION SHUTTING OFF AT THE TRENCH
Previous efforts to account for the effects of hydrothermal circulation on subduction zone
temperatures have either assumed that such circulation “shuts off” at the trench or arbitrarily
maintained cooler temperatures in subducted crust. Since it is likely that ocean crust is capable
of maintaining high permeabilities for some distance into the subduction zone, these assumptions
are an oversimplification that do not fully account for the alteration of subduction zone
temperatures through hydrothermal circulation. In the case of open circulation, arbitrarily
shutting off hydrothermal circulation at the trench results in only slightly cooled ocean crust
relative to the case with no fluid flow and temperatures follow a similar trend with distance into
the subduction zone. In contrast, much more heat can be extracted if hydrothermal circulation is
allowed to continue landward of the trench. High permeabilities result in much cooler
temperatures with nearly isothermal conditions along the décollement for 30 km into the
subduction zone.
4.2 SUBDUCTION ZONE PARAMETERS
The thermal effects of fluid circulation in subducting crust will differ whether the system
is open or closed and vary in magnitude based on subduction zone taper angle and convergence
rate. Hydrothermal circulation is most important for the thermal state of subduction zones with
slower convergence rates, open circulation systems and higher taper angles (listed in order of
importance).

69
Convergence rate been recognized as a primary control on subduction zone temperatures
(Molnar and England, 1995) and is of first order importance for determining the effects of
hydrothermal circulation on subduction zone temperatures. Slow convergence results in a
relatively warm subduction zone. The overall higher temperatures in a system with slow
convergence support more vigorous hydrothermal circulation. The high fluid flow velocities and
high fluid temperatures result in the advection of large quantities of heat through the system. In
contrast, a fast convergence rate results in cooler temperatures and less vigorous fluid
circulation, and therefore hydrothermal circulation does not greatly affect temperatures. An
important consequence is that hydrothermal circulation acts to moderate the effects of
convergence rate as a control on subduction zone temperatures.
The basic impact of fluid circulation on the thermal state of a subduction zone depends
strongly on whether the system hosts open or closed fluid circulation. Heat is redistributed in
closed systems; in open systems, warm fluid is advected out to the ocean, which acts as an
infinite heat sink, and cool ocean bottom water recharges the system. Two different thermal
regimes are observed at high permeabilities. Closed systems are warmer at the trench and cooler
farther into the subduction zone. Open systems are cooler everywhere along the subducting slab
and by a greater magnitude than for closed systems. The differences between these two systems
will determine whether heat flux at the trench will be higher (closed system) or lower (open
system) than predicted by thermal models that do not account for the thermal effects of fluid
circulation in subducted ocean crust.
Differences in taper angle have a fairly modest influence on the impact of hydrothermal
circulation on subduction zone temperatures. Although a higher taper angle results in warmer
ocean crust at shallower depths, similar to slower convergence rates, the temperature difference

70
is small in comparison. Alteration of subduction zone temperatures is still important at a high
taper angle, but the taper angle is less important for controlling these differences. At a low taper
angle, the lower temperatures and slower fluid velocities make advective heat transport much
less efficient. Only at the highest permeability and for distances >20 km into the subduction
zone are temperatures noticeably different.
4.3 EFFECTS OF HYDROTHERMAL CIRCULATION ON HEAT FLUX
Surface heat flux data currently provides the best constraint on the extent and vigor of
hydrothermal circulation in subduction zones. Our simulations predict that the magnitude of heat
flux anomalies range from very large to virtually unobservable depending on the permeability of
ocean crust, convergence rate, and taper angle.
For subduction zones with an open fluid flow system, heat flux is reduced at the trench.
Our simulations predict that a heat flux deficit will be observable over the entire range of
modeled permeabilities (10-13 to 10-10 m2). The heat flux deficit is similar for all simulations
where the permeability is held constant in the subducted crust. At low permeabilities, there is
minimal lateral heat transport and therefore temperatures at the trench are influenced more by the
cool ocean water that enters the system through exposed faults which are in close proximity to
the trench than the warm water of the upper basement deep within the subduction zone.
Although fluid velocities are low and lateral transport is minimal, the cool water is still able to
effectively cool ocean crust near the trench. At high permeabilities, there is significant heat
transport between cool ocean bottom water at the seafloor and warm water deep within the
subduction zone. The combined affect of an increase in cool water entering the system close to
the trench along with an increase in warmer water leaving at the trench results in a similar
71
temperature gradient for both high and low permeabilities. For this reason, the heat flux deficit
at the trench is similar for high and low permeabilities.
In contrast to simulations with a constant permeability, a larger heat flux deficit occurs
for the simulations where permeability decreases with effective stress and where permeability
shuts off at the trench. These systems have a high permeability seaward of the trench that either
decreases or shuts off landward of the trench. The result is efficient transport of cool water at
high fluid velocities from exposed basement along the ocean floor up to the trench, but little or
no lateral transport of heat from deep within the subduction zone. For this reason, a larger heat
flux deficit is observed at the trench for these simulations.
For closed circulation systems with a convergence rate of 8.5 cm/yr, a heat flux anomaly
will likely only be easily observed for ocean crust with a permeability of around 10-10 m2 or
higher. Heat flux anomalies less than ~15 mW/m2 would likely be difficult to identify, given the
typical scatter common in shallow heat flux probe observations. An anomaly will be less
pronounced for a low taper angle. For a slower convergence rate of 2 cm/yr, aquifer
permeability several orders of magnitude smaller is likely to produce a measurable heat flux
anomaly. Subduction zones where the permeability is less than 10-12 m2 or the convergence rate
is much slower than 8.5 cm/yr are not likely to produce a measurable heat flux anomaly.
Heat flux surveys offshore of the Nicoya Peninsula, Costa Rica margin show this contrast
in heat flux for open and closed systems. Here, subducted ocean crust consists of seafloor
generated from the East Pacific Rise (EPR) to the north, and the Cocos-Nazca Spreading (CNS)
center to the south. Seafloor generated at the EPR consists of seamounts and basement outcrops
which are capable of hosting open circulation. In contrast, seafloor generated at the CNS is
covered by a continuous blanket of sediment and is therefore a closed system (Fisher et al, 2003).

72
Heat flux to the north is much lower than expected for a model with no fluid flow, indicating the
cooling effects of hydrothermal circulation. Heat flux to the south is elevated near the trench,
suggesting the redistribution of heat through vigorous hydrothermal circulation (Grevemeyer,
2008). These observed heat flux anomalies combined with our general modeling results,
suggest that ocean crust entering the Middle America subduction zone is capable of maintaining
high permeability for great distances landward of the trench allowing for hydrothermal
circulation to significantly alter subduction zone temperatures.
4.4 IMPLICAITONS FOR CONTROLS ON THE UPDIP LIMIT OF SEISMICITY
Previous thermal models of subduction zones suggest that the transition from aseismic to
coseismic slip along the updip limit of seismicity occurs near 100 – 150 °C and may result from
a combination of diagenetic/metamorphic reactions that alter material properties and/or affect
fluid pressures (Moore and Saffer, 2001). Results from our thermal models indicate that for
kinetically controlled reactions in subducting material, much of the reaction progress will occur
farther landward than suggest by subduction zone thermal models that do not account for
hydrothermal circulation in subducting crust. With improved thermal models of subduction
zones, the mechanism(s) controlling the transition from stable-sliding to stick-slip behavior along
the décollement may need to be revisited. The cooler seismogenic zone temperatures resulting
from hydrothermal circulation suggest that lower temperature reactions (e.g., opal-to-quartz)
may play a more prominent role in controlling the updip limit of seismicity than higher
temperature reactions (e.g., smectite-to-illite).
73
Chapter 5: CONCLUSIONS
Hydrothermal circulation plays an important role in cooling and redistributing heat in
subduction zones. Significant differences in décollement temperatures exist between models that
do not allow for hydrothermal circulation to persist in subducted ocean crust and those that do.
For this reason, thermal models of subduction zones should account for hydrothermal circulation
in subducted ocean crust in order to accurately model subduction zone temperatures.
The thermal effect of fluid circulation in subducting crust is sensitive to variations in
convergence rate. Open versus closed circulation systems and taper angle are of second and
third order importance, respectively.
Hydrothermal circulation effectively cools ocean crust in open circulation systems and
redistributes heat in closed systems; cooling ocean crust deep within the subduction zone and
warming it close to the trench. Observations of heat flux anomalies, such as those found at the
Middle America subduction zone, can be explained through the alteration of subduction zone
temperatures by hydrothermal circulation.
Mechanisms controlling the updip limit of seismicity in subduction zones are largely
thought to be temperature controlled. Our thermal models of subduction zones suggest that the
seismically or geodetically defined updip limit of megathrust seismicity will coincide with cooler
temperatures than previous thermal models have suggested. These new insights require that
thermally driven mechanisms thought to control the updip limit of seismicity be revisited.

74
Chapter 6: SUSBSEQUENT AND PROPOSED FUTURE WORK
This work has shown the importance of hydrothermal circulation on subduction zone
temperatures. There are several key issues that need to be examined based on this work: 1)
determining better constraints on the permeability trends in subducted ocean crust, 2) expanding
on the sensitivity analysis of the effect of hydrothermal circulation on subduction zone
temperatures, 3) revisiting thermal models of subduction zones where hydrothermal circulation
will play an important role on subduction zone temperatures, and 4) re-examining potential
controls on the limits of seismicity in subduction zones by expanding on the models used in this
study.
6.1 PERMEABILITY IN SUBDUCTED CRUST
Although it is recognized that the permeability of the upper extrusive portion of ocean
crust is quite high, little is known about permeability trends in ocean crust once it subducted.
Our thermal models of subduction zones allow for two sceneries of permeability in subducted
ocean crust: 1) permeability is held constant in the upper basement landward of the trench, and
2) permeability decreases with an increase in effective stress parallel to that for laboratory
experiments on fractured gabbro. Differences in these simulations indicate that the systems are
quite sensitive to the permeability of the upper basement aquifer; therefore, it is important to
have better constraints on permeability trends in subduction zones. A combination of techniques
may be used in order to better constrain actual permeability trends in subducted ocean crust.
Numerical modeling constrained by heat flow measurements is a fairly inexpensive method that
can be applied to well-studied regions. This would involve building a model that accurately
75
replicates a subduction zone where extensive heat flux data is available and properties of the
ocean crust and wedge along with thermal history of the plate entering the subduction zone are
well known. A range of permeabilities for ocean crust prior to subduction could be used in
combination with different trends of permeability decreasing with increasing effective stress in
order to find the best match between observed heat flux data and heat flux data from the
simulations. One downside would be that there may be a combination of simulations that match
the data well. Another method would involve taking in situ measurements of permeability in
boreholes. Unfortunately the high cost and difficulty of making these measurements makes this
an unlikely option. In addition, boreholes would be limited to the shallower region of the
subduction zone and there are likely to be scale dependant limitations on permeability
measurements. Despite this, a project for just such measurements would provide very valuable
information which could be applied to any subduction zone through numerical models. Other
methods that are less expensive, and therefore more feasible, include geochemical analysis of
fluids in the upper basement close to the trench, geophysical measurements of subducted crust
such as p-wave and s-wave velocities, and laboratory experiments on basalt. All of these
methods have limitations, but used in combination, would give a better understanding of
permeability trends in subducted ocean crust.
6.2 EXPANDING ON SENSITIVITY ANALYSIS OF SUBDUCTION ZONES
The sensitivity analysis provided from this work has shown the relative importance of the
effects of hydrothermal circulation on subduction zone temperatures for varying taper angles and
geometries. Although most subduction zones will fall within the range of taper angles and
geometries from this study, many will be in between the end member values chosen. In addition,

76
subduction zones that are exceptions to the norm will fall outside the ranges examined in this
study. For this reason, a more comprehensive analysis on the sensitivity analysis of the effects
of hydrothermal circulation on subduction zone temperatures would provide a useful references
for determining in which subduction zones hydrothermal circulation will be most important and
which subduction zone where hydrothermal circulation is not likely to be important.
6.3 RE-VISIT THERMAL MODELS AND CONTROLS ON THE UPDIP LIMIT OF SEISMICITY
Important processes that occur in subduction zones, such as diagenetic and metamorphic
reaction progress and slab dehydration, are largely thermally driven. What is known about these
processes is largely based on thermal models of subduction zones that do not allow for
hydrothermal circulation to continue in subducted crust. Because we have shown that
hydrothermal circulation can be key component in certain situations on controlling subduction
zone temperatures, many of these models need to be revisited. New thermal models that allow
for hydrothermal circulation to continue in subducted crust should be applied to subduction
zones where hydrothermal circulation will be most important on effecting subduction zone
temperatures. Expanding the domain of our models and adding more complex process, such as
fluid expulsion from sources, tracking geochemical signatures in expelled fluids and possibly
allowing for temporally variable fluid pathways along the décollement and up through the
margin wedge for certain subduction zone models, will provide further insights into the thermal
structure of subduction zones and shed new light on the possible controls on the limits of
seismicity in subduction zones.

77
REFERENCES
Anderson, R.N., Hobart, M.A., and Langseth, M.G. 1979, Geothermal convection through oceanic crust and sediments in the Indian Ocean: Science, v. 204, p. 828–832.
Arrhenius, G. and Bonatti, E., 1965, Neptunism and volcanism in the ocean: In Progress in
Oceanography, v. 3, ed. M. Sears. New York: Pergammon Press, p. 7–21. Barron, E.J., and Whitman, J.M., 1981, Ocean sediments in space and time. In The Oceanic
Lithosphere: ed. C. Emiliani, New York Wiley, p. 689-731. Beardsmore, G.R., and Cull, J.P., 2001, Crustal Heat Flow: A Guide to Measurement and
Modeling: Cambridge University Press, p. 55-58. Becker, K., and Davis, E.E., 2004, In situ determinations of the permeability of the igneous
oceanic crust, Hydrogeology of the Oceanic Lithosphere, Cambridge University Press, p. 189-224.
Becker, K., Langseth, M.G., and Von Herzen, R.P. 1983, Deep crustal geothermal
measurements, Hole 504B, Deep Sea Drilling Project Legs 69 and 70: Initial Reports of the Deep Sea Drilling Project, v. 69, p. 223-236.
Becker, K., 1989, Measurements of the permeability of the sheeted dikes in Hole 504B, ODP
Leg 111: Proceedings of the Ocean Drilling Program, Scientific Results, v. 111, p. 317-325.
Becker, K., 1996, Permeability measurements in Hole 896A and implications for the lateral
variability of upper crustal permeability at Sites 504 and 896: Proceedings of the Ocean Drilling Program, Scientific Results, v. 147, p. 353-363.
Bekins, et al., 1994, Influence of kinetics on the smectite to illite transition in the Barbados
accretionary prism, J. Geophys. Res., v. 99(B9), p. 18,147-18,158. Bevies, M., Taylor, F.W., Schutz, B.E., Recy, J., Isacks, B.L., Helu, S. Singh, R., Kendrick, E.,
Stowell, J., Taylor, B., and Calmantli, S., 2002, Geodetic observations of very rapid convergence and back-arc extension at the Tonga arc, Nature, v. 374, p. 249-251.
Boström, K. and Peterson, M.N.A., 1966, Precipitates from hydrothermal exhalations on the East
Pacific Rise: Econ. Geol., v. 61, p. 1,258–1,265. Bouma, A.H., Coleman, J.M., Meyer, A.W., et al. 1986, Initial Reports of the Deep Sean Drilling
Project: US Govt. Printing Office, Washington, DC, v. 96, 824 pp. Brown, G.C., Mussett, A.E., 1993, The Inaccessible Earth: An Integrated View of Its Structure
and Composition. Chapman & Hall. London.

78
Bryant, W.R., Deflanche, A.P., and Trabant, P.H., 1974, Consolidation of marine clays and carbonates. In Deep-sea Sediments, Physical and Mechanical Properties: ed. A. L. Inderbitzen. New York, Plenum Press, p. 209–244.
Carlson, R.L., 1998, Seismic velocities in the uppermost oceanic crust: age dependence and the
fate of layer 2A: J. Geophys. Res., v. 103, p. 7,069–7,077. Cloos, M., 1985, Thermal evolution of convergent plate margins: thermal modeling and re-
evaluation of isotopic Ar-ages for blueschists in the Franciscan complex of California: Tectonics, v. 4, p. 421–433.
Currie, C.A., Hyndman, R.D., Wang, K., and Kostoglodov, V., 2002, Thermal models of the
Meixico subduction zone: Implications for the megathrust seismogenic zone: Journal of Geophysical Research, v. 107, B12, p. 2370-2383, doi:10.1029/2001JB000886.
Davies, G.F., 1992, On the emergence of palte tectonics: Geology, v. 20, p. 963-966. Davis, E.E., and Elderfield, H., 2004, Hydrogeology of the Oceanic Lithosphere: Cambridge
University Press, New York, p. 152-158. Davis, E.E., and Becker, K., 2002, Observations of natural-state fluid pressures and temperatures
in young oceanic crust and inferences regarding hydrothermal circulation: Earth and Planetary Research Letters, v. 204, p. 231-248.
Davis, E.E., Chapman, D.S., Wang, K., Villinger, H., Fisher, A.T., Robinson, S.W., Grigel, J.,
Pribnow, D., Stein, J., and Becker, K., 1999, Regional heat flow variations across the sedimented Juan de Fuca Ridge eastern flank: Constraints on lithospheric cooling and lateral hydrothermal heat transport: Journal of Geophysical Research, v. 104, B8, p. 17675–17688, doi: 10.1029/1999JB900124.
Davis, E.E., Wang, K., Becker, K., and Thomson, R.E., 2000, Formation-scale hydraulic and
mechanical properties of oceanic crust inferred from pore pressure response to periodic seafloor loading: Journal of Geophysical Research, v. 105, B6, p. 13423- 13435, doi: 10.1029/2000JB900084.
Davis, E.E., Wang, K., He, J., Chapman, D.S., Villinger, H., and Rosenberger, A., 1997, An
unequivocal case for high Nusselt number hydrothermal convection in sediment-buried igneous oceanic crust: Earth Planet. Sci. Lett. v. 146, p. 137-150.
Davis, E.E., Wang, K., Thomson, R.E., Becker, K., and Cassidy, J.F., 2001, An episode of
seafloor spreading and associated plate deformation iferred from crustal fluid pressure transients: J. Geophys. Res. v. 106, p. 21,953-21,963.
Divins, D. L. 2002. Total sediment thickness of the world’s oceans and marginal seas, NOAA
National Geophysical Data Center. See http://www.ngdc.noaa.gov/mgg/sedthick/sedthick.html and references therein.

79
Dumitru, T.A., 1991, Effects of subduction parameters on geothermal gradients in forearcs, with
an application to Franciscan subduction in California: Journal of Geophysical Research, v. 96, B1, p. 621–641.
Elder, J.W., 1965, Physical processes ingeothermal areas: Terrestrial Heat Flow, p. 211-239. Earnst, W.G., and Calvert, S.E., 1969, An experimental study of the recrystallization of
porcelanite and its bearing on the origin of some bedded cherts, Am. J. Sci, v. 267-A, p. 114-133.
Fisher, A.T., 1998, Permeability within basaltic oceanic crust: Rev. Geophys., v. 36, p. 143-182. Fisher, A.T., 2005, Marine hydrogeology: recent accomplishments and future opportunities:
Hydrogeology Journal, v. 13, p. 69–97. Fisher, A.T., and Becker, K., 2000, Channelized fluid flow in oceanic crust reconciles heat flow
and permeability data: Nature, v. 403, p. 71-74. Fisher, A.T., Davis, E.E., Hutnak, M., Spiess, V., Zuhlsdorff, L., Cherkaoui, A., Christiansen, L.,
Edwards, K., Macdonald, R., Villinger, H., Mottl, M.J., Wheat, C.G., and Becker, K., 2003, Hydrothermal recharge and discharge across 50 km guided by seamounts on a young ridge flank: Nature, v. 42, p. 618-621.
Fisher, A.T., Stein, C.A., Harris, R.N., Wang, K., Silver, E.A., Pfender, M., Hutnak, M.,
Cherkaoui, A., Bodzin, R., and Villinger, H., 2003, Abrupt thermal transition reveals hydrothermal boundary and role of seamounts within the Cocos Plate: Geophysical Research Letters, v. 30, no. 11, doi: 10.1029/2002GL016766.
Fisher, A.T., and Von Herzen, R.P., 2005, Models of hydrothermal circulation within 106 Ma
seafloor: Constraints on the vigor of fluid circulation and crustal properties, below the Maderia Abyssal Plain: Geochemistry Geophysics Geosystems, v. 6, no. 11, doi: 10.1029/2005GC001013.
Gable, C. W., H. E. Trease, and T. A. Cherry, 1996, Geological applications of automatic grid
generation tools for finite elements applied to porous flow modeling, in Numerical Grid Generation in Computational Fluid Dynamics and Related Fields, edited by B. K. Soni et al., p. 1-9, Miss. State Univ. Press, Mississippi State.
Giambalvo, E.R., Fisher, A.T., Martin, J.T., Darty, L., and Lowell, R.P., 2000, Origin of elevated
sediment permeability in a hydrothermal seepage zone, eastern flank of the Juan de Fuca Ridge, and implications for transport of fluid and heat: Journal of Geophysical Research, v. 105, B1, p. 913–928, doi: 10.1029/1999JB900360.
Gillis, K.M., and Sapp, K., 1997, Distribution of porosity in a section of upper oceanic crust
exposed in the Troodos ophiolite: J. Geophys. Res., v. 102, p. 10,133–10,149.

80
Grevemeyer, I., Norbert, K., Villinger, H., and Weigel, W., 1999, Hydrothermal activity and the
evolution of the seismic properties of upper oceanic crust:. J. Geophys. Res., v. 104, p. 5,069–5,079.
Hamilton, E.L., 1976, Variations of density and porosity with depth in deep-sea sediments: J.
Sed. Pet., v. 46, p. 280-300. Harris, R.N., and Wang, K., 2002, Thermal models of the Middle America Trench at the Nicoya
Peninsula, Costa Rica: Geophysical Research Letters, v. 29, doi: 10.1029/2002GL015406. Hofmeister, A.M., and Criss, R.E., 2005, Earth’s heat flux revised and linked to chemistry,
Tectonophysics, v. 395, p. 159-177. Holmes, M.L., and Johnson, H.P., 1993, Upper crustal densities derived from sea floor gravity
measurements: northern Juan de Fuca ridge: Geophys. Res. Lett., v. 20, p. 1,871–1,874. Houtz, R.E., 1976, Seismic properties of Layer 2A in the Pacific: J. Geophys. Res., v. 81, p.
6,321–6,331. Hyndman, R.D., Wang, K., and Yamano, M., 1995, Thermal constraints on the seismogenic
portion of the southwestern Japan subduction thrust: Journal of Geophysical Research, v. 100, B8, p. 15373-15392.
Hyndman, R.D., Yamano, M., and Oleskevich, D.A., 1997, The seismogenic zone of subduction
thrust faults: The Island Arc, v. 6, p. 244–260. Ingebritsen, S.E. and Sanford, W.E., 1998, Groundwater in Geologic Processes, New York:
Cambridge University Press. Jarrard, R.D., 1986, Relations amoung subduction parameters: Rev. Geophys., v. 24(2), p. 217-
283. Kirby, S.H., Durham, W.B., and Stern, L.A., Mantle pahse changes and deep-earthquake faulting
in subducting lithosphere: Science, v. 252, p. 216-225. Kummer, T., Spinelli, G.A., and Wada, I., 2006, Hydrothermal Circulation Within Subducting
Crust: Implications for Subduction Zone Temperature [abs.]: EOS (Transactions, American Geophysical Union), v. 87, no. 52, T21A-0380.
Langseth, M.G., and Silver, E.A., 1996, The Nicoya convergen margin – a region of
exceptionally low heat flow: Geophysical Research Letters, v. 23, no. 8, p. 891-894. Lee, W.H.K., and Uyeda, S., 1965, Review of heat flow data. ed. W. H. K. Lee, In Terrestrial
Heat Flow, Geophysical Monograph, v. 8. Washington, DC: American Geophysical Union, p. 87–190.

81
Lister, C.R.B., 1972, On the thermal balance of a mid-ocean ridge: Geophys. J. Roy Astron.
Soc., v. 26, p. 515-535. Langseth, M.G., and Silver, E.A., 1996, The Nicoya convergent margin – a region of
exceptionally low heat flow: Geophysical Research Letters, v. 23, no. 8, p. 891–894. Minster, J.B., Jordan, T.H., and Molnar P., 1974, Numerical modeling of instantaneous plate
tectonics: Geophysics Journal, v. 36, p. 541-576. Molnar, P., Freedman, D., and Shih, S.S.F., 1979, Lengths of intermediate and deep seismic
zones and temperatures in downoing slabs of lithosphere: Geophys. J. R. Astron. Soc., v. 56, p. 41-54.
Moore, J.C., and Saffer, D., 2001, Updip limit of the seismogenic zone beneath the accretionary
prism of Southwest Japan: An effect of diagenetic to low-grade metamorphic processes and increasing effective stress: Geology, v. 29, p. 183–186.
Negredo, A.M., Valera, J.L., and Carminati, E., 2004, TEMSPOL: a MATLAB thermal model
for deep subduction zones including major phase transformations: Computers & Geosciences, v. 30, p. 249-258.
Oleskevich, D.A., Hyndman, R.D., and Wang, K., 1999, The updip and downdip limits to great
subduction earthquakes: Thermal and structural models of Cascadia, south Alaska, SW Japan, and Chile: Journal of Geophysical Research, v. 104, B7, p. 14965-14991.
Palmason, G., 1967, On heat flow in Iceland in relation to the Mid-Atlantic Ridge: In Iceland and
Mid-Ocean Ridges, v. 38, ed. S. Bjornsom. Reykjavik: Soc. Sci. Islandica, p. 11–27. Parry, W.T., Bellows, J.C., Gallagher, J.S., and Harvey, A.H., 2000, ASME International steam
tables for industrial use, p. 286, ASME Press, New York. Peacock, S.M., 1987, Thermal effects of metamorphic fluids in subduction zones: Geology, v.
15, p. 1057–1060. Peacock, S.M., 1990, Fluid processes in subduction zones: Science, v. 248, p. 329–337, doi:
10.1126/science.248.4953.329. Peacock, S.M., 1996, Thermal and petroloigc structure of subduction zones: Subduction: Top to
Bottom, Monogr. Ser., v. 96, p. 119-133. Petterson, H., 1949, Exploring the bed of the ocean: Nature, v. 4168, p. 468–470. Perfit, M.R., and Chadwick, W.W., 1998, Magmatism at mid-ocean ridges: constraqints from
volcanological and geochemical investigations: Faulting and Magmatism at Mid-Ocean Ridges, Geophysical Monograph, 106.

82
Ranero, C.R., Phipps Morgan, J., McIntosh, K., and Reichert, C., 2003, Bending-related faulting
and mantle serpentinization at the Middle America trench: Nature, v. 425, p. 367–373, doi: 10.1038/nature01961.
Ruff, L.J., and Kanamori, H., 1980, Seismicity and the subduction process: Phys. Earth Planet.
Inter., v. 23, p. 240-252. Saffer, D.M, and Bekins, B.A., 2002, Hydrologic controls on the morphology and mechanics of
accretionary wedges: Geology, v. 30, p. 271-274. Satake, K., and Tanioka, Y., 1999, Source of tsunami and tsunamigenic earthquakes in
subduction zones: Pure and Applied Geophysics, v. 154, p. 467–483, doi: 10.1007/s000240050240.
Sclater, J.G., 2004, Variability of heat flux through the seafloor: discovery of hydrothermal
circulation in the oceanic crust: Hydrogeology of the Oceanic Lithosphere, Cambridge, p. 3-27.
Skornyakova, I.S., 1964, Dispersed iron and manganese in Pacific Ocean sediments. Lithology
and mineral resources: Internat. Geol. Rev., v. 7, p. 2,161–2,174. Sleep, N.H., and Barth, G.A., 1997, The nature of lower crust and shallow mantle emlpaced at
low spreading rates: Tectonophysics, v. 279, p. 181-191. Spencer, T.R., 1990, Evolution and style of fracture permeability in intrusion-centered
hyrothermal systems: The Role of Fluids in Crustal Processes, p. 50-62. Spinelli, G.A., and Fisher, A.T., 2004, Hydrothermal circulation within topographicallly rough
basaltic basement on the Juan de Fuca Ridge flank: Geochemistry, Geophysics, and Geosystems, v. 5(2), p. 1-19, doi: 10.1029/2003GC00016.
Spinelli, G.A., and Saffer, D.M., 2004, Along-strike variations in underthrust sediment
dewatering on the Nicoya margin, Costa Rica related to the updip limit of seismicity: Geophysical Research Letters, v. 31, doi: 10.1029/2003GL018863, doi: 10.1029/2003GL018863.
Stein, C.A., Stein, S., and Pelayo, A.M., 1995, Heat flow and hydrothermal circulation, in
Humphris, S., Mullineaux, L., Zierenberg, R., and Thomson, R., eds., Seafloor Hydrothermal Systems: Geophysical Monograph 91, p. 425–455.
Stein, J.S., and Fisher, A.T., 2003, Observations and models of lateral hydrothermal circulation
on a young ridge flank: Numerical evaluation of thermal and chemical constraints: Geochem. Geophys. Geosyst., v. 4(3), p. 1026, doi: 10.1029/2003GC000415.

83
Stern, R.J., 2002, Subduction Zones: Reviews of Geophysics, v. 40, doi: 10.1029/2001RG000108.
Talwani, M., Windish, C., and Langseth, M.G., 1971, Reykjanes Ridge crest: a detailed
geophysical study: J. Geophys. Res., v. 76, p. 473–517. Trimmer, D., Bonner, B., Heard, H.C., and Duba, A., 1980, Effect of pressure and stress on
water transport in intact and fractured gabbro and granite: Journal of Geophysical Research v. 85, B12, p. 7059–7071.
Von Herzen, R. P., and Uyeda, S., 1963, Heat flow through the eastern Pacific floor: J. Geophys.
Res., v. 68, p. 4,219–4,250. Wang, K., and Davis, E.E., 1996, Theory for the propagation of tidally induced pore pressure
variations in layered subseafloor formations: J. Geophys. Res v. 101, p. 11,483-11,495. Wang, K., Hyndman, R.D., and Davis, E.E., 1993, Thermal effects of sediment thickening and
fluid expulsion in accretionary prisms: Model and parameter analysis: Journal of Geophysical Research v. 98, B6, p. 9975–9984.
Wang, K., He, J., and Davis, E.E., 1997, Influence of basement topography on hydrothermal
circulation in sediment-buried igneous oceanic crust: Earth and Planetary Science Letters, v. 146, p. 151-164.
Wang, K., Mulder, T., Rogers, G.C., and Hyndman, R.D., 1995, Case for very low coupling
stress on the Cascadia subducdtion fault: Journal of Geophysical Research, v. 100 (B7), p. 12,907-12,918.
Williams, D.L., Von Herzen, R.P., Sclater, J.G. and Anderson, R.N., 1974, The Galapagos
spreading center: lithospheric cooling and hydrothermal circulation: Geophys. J. Roy. Astron. Soc. v. 38, p. 587–608.
Yamano, M., et al., 1992, Heat flow and fluid flow regime in the western Nankai accretionary
prism v. 109, p. 451-462. Yamano, M., Kinoshita, M., Goto, S., and Matsubayashi, O., 2003, Extremely high heat flow
anomaly in the middle part of the Nankai Trough: Physics and Chemistry of The Earth, v. 28, p. 487–497.
Zyvoloski, G.A., O’Sullivan, M.J., and Krol, D.E., 1979, Finite Difference Techniques for
Modeling Geothermal Reservoirs, Int. J. Numer. Anal. Methods Geomech., v. 3, p. 355-366.
Zyvoloski, G.A., Robinson, B.A., Dash, Z.V., and Trease, L.L., 1999, Models and Methods
Summary for the FEHM Application, Online: http://ees1.lanl.gov/EES5/fehm/.

84
APPENDIX
SEAWARD BOUNDARY CONDITION
The sensitivity of left side boundary was analyzed for our simulation with continuous
sediment cover. At the end of our simulations the left side boundary is 10 km from the trench.
A new model was examined for the case where the left side boundary is 20 km from the trench at
the end of the simulations. The convergence rate is 8.5 cm/yr, the taper angle is 11.4° and the
permeability is held constant in the upper basement aquifer at 10-11 m2. Temperature along the
décollement are very similar for both cases indicating that the results are not sensitive to the left
side boundary for distances 10 km or greater from the trench (Figure A1).
Figure A1: Sensitivity analysis on seaward boundary.

85
WEDGE SECTION INCREMENT SIZE
A sensitivity analysis was performed on the length of ocean crust that gets subducted
with the addition of each wedge section. Our models use a wedge increment size that allows for
approximately 1 km of ocean crust to get subducted with the addition of each wedge section.
This increment size was increased to approximately 2 km and the simulation was re-run for the
case with continuous sediment cover and a convergence rate of 8.5 cm/yr and taper angle of
11.4°. Permeability in the upper basement aquifer is held constant at 10-10 m2. Décollement
temperatures are compared after 18 km of crust has been subducted. Temperatures are very
similar for both cases indicating that the step size has a small effect on the results of the
simulation (Figure A2). The Maximum temperature difference occurs 1 km landward of the
trench and is 3.8 degrees. Decreasing the step size results in larger temperature differences and
therefore our models will slightly underestimate the effects of hydrothermal circulation on
subduction zone temperatures.
Figure A2: Sensitivity analysis for wedge increment size.