the effects of corporate governance on firms’ credit ratings · a firm’s credit rating reflects...
TRANSCRIPT

The Effects of Corporate Governance on Firms’ Credit Ratings
Hollis Ashbaugh-Skaife University of Wisconsin – Madison
Daniel W. Collins * University of Iowa
Ryan LaFond Sloan School of Management, MIT
March 2004 Revised, September 2004, May 2005
_________________ * Corresponding author We would like to thank Sanjeev Bhojraj, Bob Bowen, Tom Dyckman, Paul Hribar, April Klein, S. P. Kothari, Charles Lee, Mark Nelson, Kathy Petroni, Shiva Rajgopal, D. Shores, Joe Weber, Peter Wysocki, and seminar participants at Cornell, University of Illinois Audit Symposium, Iowa State University, Lancaster University, London Business School, MIT, Washington University, and the University of Washington for helpful comments and suggestions. We especially thank Johannes Ledolter for useful discussions on implementation and interpretation of ordered logit models and editor, Tom Lys, for detailed comments on our paper.

The Effects of Corporate Governance on Firms’ Credit Ratings
Abstract Using a framework for evaluating corporate governance recently developed by Standard and Poor’s, this study investigates whether firms that exhibit strong governance benefit from higher credit ratings relative to firms with weaker governance. We document, after controlling for risk characteristics, that firm credit ratings are: (1) negatively associated with the number of blockholders that own at least a 5% ownership in the firm; (2) positively related to weaker shareholder rights in terms of takeover defenses; (3) positively related to accrual quality and earnings timeliness; and (4) positively related to over-all board independence, board stock ownership and board expertise, and negatively related to CEO power on the board. We also provide evidence that CEOs of firms with speculative grade credit ratings are overcompensated to a greater degree than their counterparts at firms with investment grade ratings, and that the overcompensation exceeds the CEO’s share of additional debt costs related to lower credit ratings. Our study provides insights into the characteristics of governance that are likely to affect the cost of debt financing and provides one explanation for why some firms continue to operate with weaker governance when doing so may mean lower credit ratings.
JEL classification: G30; G32; M41
Keywords: Corporate governance, Credit rating, Executive compensation

1
The Effects of Corporate Governance on Firms’ Credit Ratings
I. Introduction
This paper investigates whether firms that possess strong corporate governance benefit from higher
credit ratings relative to firms with weak governance. A firm’s credit rating reflects a rating agency’s
opinion of an entity's overall creditworthiness and its capacity to satisfy its financial obligations (Standard
and Poor’s 2004). Credit agencies are concerned with governance because weak governance can impair a
firm’s financial position and leave debt stakeholders (hereafter referred to as bondholders) vulnerable to
losses (FitchRatings 2004). To structure our analysis, we adopt a framework developed by Standard &
Poor’s for assessing firms’ corporate governance structures and practices (Standard & Poor’s 2002).
Standard & Poor’s (2002) framework focuses on four major components of governance: Ownership
Structure and Influence, Financial Stakeholder Rights and Relations, Financial Transparency, and Board
Structure and Processes. The governance attributes we examine within each of these components are
designed to increase the monitoring of management’s actions to promote effective decision making, limit
their opportunistic behavior and reduce the information asymmetry between the firm and its external
stakeholders. We investigate what effect, if any, these governance features have on firms’ overall credit
ratings.
Our analysis yields several key findings. First, we find variables that capture each of the four major
components of corporate governance enumerated above help explain overall credit ratings after
controlling for firm characteristics that prior research has shown to be related to debt ratings.
Specifically, we find that firms’ overall credit ratings are: (1) negatively associated with the number of
blockholders that own at least a 5% ownership in the firm; (2) positively related to weaker shareholder
rights in terms of takeover defenses; (3) positively related to the quality of working capital accruals and
the timeliness of earnings; and (4) positively related to over-all board independence, board stock
ownership, board expertise, and negatively related to CEO power on the board. To provide an indication
of the economic significance of our results, we find that moving from the lower quartile to the upper

2
quartile of the governance variables nearly doubles a firm’s likelihood of receiving an investment grade
credit rating--from .46 to .93.1 During the time frame of our analysis, the average yield for firms with
investment grade debt with a ten year maturity was approximately 6.00%. In contrast, the average yield
for firms with speculative grade debt with a ten year maturity was approximately 14.0%. This 800-basis
point spread translates into an annual interest cost differential of $38.4 million for the median firm in our
sample with a speculative grade credit rating.2
Our results suggest that weak governance can result in firms incurring higher debt financing costs. So
why are some firms willing to bear additional debt costs by not practicing good governance? We
approach this question by considering how CEOs can extract rents from weak governance. One way
CEOs can appropriate rents is through excess compensation. To investigate this conjecture, we estimate
CEO excess compensation following the work of Core, Holthausen and Larcker (1999). We document
that CEOs of firms with weaker governance (greater CEO power or management entrenchment) receive
more excess compensation relative to the CEOs of firms with stronger governance (less management
entrenchment). Furthermore, we show that firms with speculative grade debt have a greater propensity to
overcompensate their CEOs than do firms with investment grade debt. For firms with speculative grade
credit ratings, we then compare CEO excess compensation to their share of additional debt costs that
1 For purposes of this analysis, we hold the firm characteristic variables (ROA, LEV, SIZE, etc.) constant at the mean values for the sample. For those governance attributes found to be positively (negatively) related to credit ratings, our benchmark probability is determined by assigning governance values equal to the first (third) quartile and then moving to the third (first) quartile value. For governance attributes measured as 0-1 dummy variables, the benchmark probability is determined with the zero (one) value when the governance attribute is positively (negatively) related to credit ratings. 2 To calculate this interest cost differential, we first determine the mean debt-to-asset ratio for our sample of investment grade firms (0.28). We then multiply this ratio times the total assets of each speculative grade firm to estimate the “as-if” capital structure if the speculative grade firm was an investment grade firm. Finally, we multiply the estimated debt level times the 800-basis point spread to determine a speculative firm’s hypothetical incremental interest cost due to weak governance. This additional interest can be viewed as a cost that shareholders bear if the firm chooses not to implement stronger governance to preclude management from stealing firm assets. However, this spread overstates the cost of weak governance from the shareholders viewpoint when weaker governance allows wealth transfers from bondholders to shareholders to take place. To the extent that part of the interest rate spread between investment grade and speculative grade debt is due to bondholders price-protecting against potential wealth transfers between themselves and stockholders, this spread represents an upper bound on the cost of weak governance from the shareholder’s perspective.

3
these firms bear due to weak governance. We find that the median excess compensation far outweighs
the CEO’s share of the additional after-tax interest cost from having speculative grade debt versus
investment grade debt, thus providing one explanation for why all firms do not practice good governance.
This paper makes several contributions to the extant literature on bond (credit) ratings and corporate
governance. Prior literature investigating firms’ credit ratings and debt costs models the cost of debt as a
function of issue characteristics and issuer risk attributes (see e.g., Horrigan, 1966 or Kaplan and Urwitz,
1979) while ignoring the governance mechanisms that are put into place to safeguard the assets of
the firm and ensure that bondholder interests are well-served. We extend the traditional bond
rating literature by incorporating governance features designed to control agency conflicts
between bondholders and management and between bondholders and shareholders.
Sengupta (1998) and Bhojraj and Sengupta (2003) explore the effects of corporate governance on
debt ratings and cost of debt financing, but restrict their analysis to a limited set of governance variables.
Sengupta (1998) finds a negative relationship between firms’ disclosure quality ratings and the cost of
debt financing as reflected in realized yields on new debt issues. Bhojraj and Sengupta (2003) find that
firms with a higher percentage of outside directors on the board and with greater institutional ownership
enjoy lower bond yields and higher ratings on their new debt issues. We extend these two studies by
evaluating a broader set of governance variables thereby providing a more comprehensive analysis of the
relevance of corporate governance from the perspective of bondholders.
Much of the prior literature that investigates the effect of corporate governance focuses on the value
of corporate governance from the shareholder’s perspective (McConnell and Servaes, 1990; Yermack,
1996; Karpoff, Malatesta and Walkling, 1996; Gompers, Ishii and Metrick, 2003). Our study focuses on
the value of governance from the bondholders’ perspective because debt is a major source of capital for

4
publicly traded firms.3 Thus, to the extent that governance is an important determinant of credit ratings, it
can have a significant effect on the cost of firms’ external financing costs.
In this paper, we investigate how various governance mechanisms that are intended to control agency
conflicts between management and all stakeholders impact credit ratings. In addition, our study provides
insights into the governance attributes that heighten or attenuate the potential conflict between
bondholders and shareholders. Although generally aligned, the interests of bondholders and shareholders
can diverge when there are differing stakes in firm performance and differing views on management’s
investment policies (FitchRatings, 2004). Gompers, et al. (2003) find that firms with stronger shareholder
rights have higher share values and enjoy a lower cost of equity capital. In this study, we find that firms
with stronger shareholder rights have lower credit ratings implying a higher cost of debt financing. Our
study is one of the first to demonstrate that governance mechanisms that benefit shareholders may do so
at the expense of bondholders.4 Thus, governance mechanisms designed to give more power to
shareholders can have wealth redistribution effects that leave bondholders worse off.
The remainder of the paper is organized as follows. Section II briefly describes the role of governance
in mitigating agency conflicts between bondholders and management and between bondholders and
stockholders. Section III sets forth the framework recently adopted by Standard and Poor’s for evaluating
the strength of firms’ corporate governance mechanisms and develops empirical proxies to capture
various elements within this framework. Section IV describes our sample, data sources, and variable
measurements and provides descriptive statistics. Section V presents the empirical models used to
investigate the relation between various corporate governance mechanisms and firms’ credit ratings along
with the main empirical results. In Section VI we present evidence on CEO excess compensation related
3 For example, in calendar year 2000, U.S. firms obtained $944.8 billion dollars in debt financing whereas equity financing totaled $311.9 billion dollars (U.S. Census Bureau 2005). 4 Our results are consistent with a concurrent study by Klock, Mansi and Maxwell (2004) who find that firms with stronger anti-takeover provisions (weaker shareholder rights) enjoy a lower cost of debt financing relative to firms with weaker anti-takeover provisions.

5
to weak governance, address endogeneity issues, and conduct sensitivity analyses. Section VII concludes
and offers suggestion for future research.
II. Why Governance Affects Firms’ Credit Ratings
Firm credit ratings are determined by rating agencies’ assessment of the probability distribution of
future cash flows to bondholders, which in turn, depends on the future cash flows to the firm. A firm’s
creditworthiness is determined by assessing the likelihood that its future cash flows will be sufficient to
cover debt service costs and principal payments. As the mean of the firm’s future cash flow distribution
shifts downward or the variance of its future cash flows increases, the likelihood of default increases and
the firm’s credit rating will decline.
Within the Jensen and Meckling (1976) agency theory framework, bondholders, and more generally
debt stakeholders, face two types of agency conflicts that can increase the probability of default and,
hence, reduce the value of their claims. The first is the conflict between management and all external
stakeholders—both bondholders and shareholders. Separation of ownership and control in corporate
organizations leads to information asymmetry problems between external stakeholders and managers.
Information asymmetry creates a moral hazard problem when managers have incentives to pursue their
own interests at the expense of external stakeholders. Self-interested managerial behavior can take several
forms including shirking, consumption of perquisites, over compensation, and empire building, all of
which increase the agency risk faced by external stakeholders and decrease the expected value of the cash
flows to the firm and its external stakeholders. As the firm’s expect cash flows decline, the default risk of
bondholders increases leading to lower credit ratings.
The second agency conflict faced by bondholders is the conflict with shareholders. Shareholders in
levered firms have incentives to undertake actions that can transfer wealth from bondholders to
themselves. This wealth transfer can take several forms that affect the mean and the variance of the firm’s
future cash flows. For example, if shareholders demand direct payouts of firm assets (dividends or share
repurchases) as opposed to supporting manager’s investments in positive net present value projects, then
the mean of a firm’s future cash flow distribution will be lower. The reduction in a firm’s expected future

6
cash flows increases bondholders’ default risk. Likewise, if shareholders influence managers to invest in
riskier projects that increase the variance of a firm’s future cash flows, bondholders face greater default
risk. In both examples, bondholders bear greater risk that their fixed contractual claims on the firm’s cash
flows will not be paid while shareholders potentially are better off.
We hypothesize that governance features impact credit ratings by controlling agency costs that result
from conflicts between managers and all external stakeholders as well as between bondholders and
shareholders. Many of the governance features we examine are designed to reduce the agency conflict
between managers and all stakeholders. Governance mechanisms that provide independent monitoring of
management promote effective managerial decision making that increases firm value and guard against
opportunistic management behavior that decreases firm value. Governance mechanisms that promote
better managerial decision making and limit opportunistic management behavior benefit all stakeholders.
Conversely, we posit that if governance is weak, the firm’s distribution of future cash flows will shift
downward relative to what it would be with more effective governance. This increases the likelihood of
default resulting in a lower credit rating. For convenience, we refer to the role that governance plays in
mitigating the agency conflicts between management and all stakeholders as the “management
disciplining” hypothesis.
Shareholder and bondholder interests are generally aligned when better monitoring of management
occurs. However, certain elements of corporate governance have a more ambiguous impact on
bondholders (FitchRatings, 2004). For example, some features of governance can place greater power in
the hands of shareholders (or selected subsets of shareholders) who can assert their influence to obtain
preferential treatment at the expense of other stakeholders (e.g., greenmail or targeted share repurchases
[Dann and DeAngelo, 1983]). Alternatively, shareholders can use their voting power to encourage
management to undertake risky investments or engage in ownership changes that can harm bondholder
interests. Taking on riskier projects increases the likelihood of default, resulting in lower credit ratings.
Some of the governance features we consider below (e.g., shareholder rights) have the potential for
effecting wealth transfers between bondholders and shareholders. Hence, while beneficial from the

7
shareholders perspective, certain governance features potentially can be harmful to bondholders.5 Or,
alternatively, governance features that weaken shareholder rights may actually be viewed positively from
the bondholder’s perspective. We refer to this as the “wealth redistribution” hypothesis regarding how
governance impacts credit ratings.
In sum, the governance variables introduced in the next section proxy not only for the agency
conflicts between external stakeholders and management, but also potential conflicts between
bondholders and shareholders that can result in wealth transfer effects between these two stakeholder
groups.
III. Corporate Governance Attributes
Prior studies on corporate governance tend to focus on one attribute of governance, e.g., board
independence, as opposed to studying a set of governance attributes intended to protect stakeholders’
claims to firms’ resources. A limitation of this research is that some governance attributes may
complement each other in protecting stakeholders’ claims whereas other governance attributes may serve
as substitutes. As a result, inferences drawn from studying one attribute of governance may be limited.
In 2002, Standard & Poor’s developed a framework for evaluating corporate governance that is based on
four governance components; ownership structure and influence, financial stakeholders rights and
relations, financial transparency and disclosure, and board structure and processes (Standard & Poor’s,
2002). Many of the individual governance mechanisms studied in the prior academic literature can be
classified into one of these four governance components. We use Standard & Poor’s (2002) framework,
along with prior literature, to identify governance attributes that potentially affect firms’ credit ratings.
The four dimensions of governance and the empirical proxies to capture the major attributes of
governance within each dimension are discussed below.
5 For example, shareholders will only approve mergers or acquisitions that serve their interests. But bondholders do not always benefit under all takeover scenarios (see Asquith and Wizman 1990, and Warga and Welch 1993). So giving shareholders greater power to determine ownership changes may well be viewed as an additional risk factor by bondholders and rating agencies.

8
III.1 Ownership Structure and Influence
Typically, corporate governance is viewed from the perspective that publicly traded firms have
dispersed shareholders who demand governance to protect their residual claims. Governance mechanisms
that monitor management actions and limit their opportunistic behavior protect the interests of residual
claimants (shareholders) and the interests of bondholders as well. At times, however, the interests of
shareholders and bondholders can diverge. For example, shareholders with significant ownership
positions can exercise their influence to force management to take on more risky investments where
shareholders as a group receive the benefits of successful outcomes, but bondholders bear a
disproportionate share of the failures. Ownership structure and the influence that certain shareholders
exert on management play a key role in determining the potential for wealth transfers between
bondholders and stockholders, and are important elements of corporate governance.
Jensen (1993) and Shleifer and Vishny (1997) argue that blockholders or institutional investors that
hold large equity positions in a company are important to a well-functioning governance system because
they have the financial interest and independence to view firm management and policies in an unbiased
way, and they have the voting power to put pressure on management if they observe self-serving
behavior. Consistent with this view, Gordon and Pound (1993) find that the structure of share ownership
significantly influences voting outcomes on shareholder-sponsored proposals to change corporate
governance structures. Outside blockholders and institutions (when institutional holdings are relatively
concentrated) tend to align with the proposal sponsor, while insiders and outside directors who hold
significant stock positions tend to align strategically with management, who often oppose the shareholder-
sponsored proposals. Nesbitt (1994) finds that firms targeted by the California Public Employees’
Retirement System (CalPERS) experience positive long-run stock returns, and Opler and Sokobin (1997)
find that firms experience above-market performance the year after being targeted by the Council of
Institutional Investors. These results suggest that blockholders and active institutional shareholders lead to
more efficient monitoring of management and less managerial opportunistic behavior, which benefits all
stakeholders. We characterize this as the “management disciplining” role of governance and we predict a

9
positive relation between our institutional ownership and blockholder measures (described below) and
credit ratings.
A competing view in the literature suggests that concentrated ownership allows these shareholders to
exercise undue influence over management to secure benefits that are detrimental to minority
shareholders and bondholders (Shleifer and Vishny, 1997 and Bhojraj and Sengupta 2003). Examples
include greenmail and targeted share repurchases (Dann and DeAngelo 1983). Under the “wealth
redistribution” hypothesis, as the percentage of shares held by institutions increases or as the number of
blockholders increases, the likelihood of these shareholders using their influence to affect wealth transfers
from bondholders increases, suggesting a negative relation between credit ratings and our institutional
ownership and blockholder variables.
We capture the ownership effects of governance with three variables. BLOCK is the number of
outside blockholders that own 5% or more of a firm’s outstanding voting stock.6 %INST measures the
percentage of shares held by institutional investors. The relation between these two ownership structure
variables and firm credit ratings depends on whether these ownership concentrations, on average, are
beneficial to bondholders (management disciplining hypothesis) or further the interests of shareholders at
the expense of bondholders (wealth redistribution hypothesis). Because we have no way of predicting, a
priori, which effect is likely to dominate, we leave the prediction on these two variables unsigned. The
third variable, %INSIDE, is the percentage of shares held by officers or directors.7 We predict that
%INSIDE will be negatively related to RATING under the assumption that insiders will use their voting
power to expropriate firm resources for their personal benefit or resist shareholder-sponsored proposals to 6 An alternative construct to capture the power of significant ownership is to use the percentage of shares held by the largest shareholder. Board Analyst has a variable labeled dominant shareholder, which reflects whether the firm has a shareholder holding a significant proportion of shares. There are 146 of our 894 sample firms that have a dominant shareholder owning more than 10% of the outstanding shares. When we estimate our model that includes a dummy variable that captures firms that have a dominant shareholder, we find the coefficient on the dominant shareholder variable to be insignificant. 7 Although this measure includes holdings by both officers and directors, the vast majority of %INSIDE is made up of officer shareholdings. Thus, we expect this measure to largely proxy for managements’ self-interests rather than board member incentives to monitor the actions of management.
10
increase the monitoring of their actions (Gordon and Pound, 1993), both of which are likely to lead to
greater agency risks for bondholders. In addition, we predict a negative relation between %INSIDE and
RATING because increasing insider ownership results in stronger incentives for officers and managers, as
residual claimants, to invest in projects that have very high returns when successful but low probabilities
of success (Jensen and Meckling, 1976)—that is, projects that increase bondholders’ risk due to the
differential payoff structure between bondholders and shareholders (wealth redistribution hypothesis).
III.2 Financial Stakeholder Rights and Relations
Financial stakeholder rights reflect the balance of power between stakeholders (bondholders and
shareholders) and management. A key element of this dimension of corporate governance is whether the
firm maintains a level playing field for corporate control and whether it is open to changes in
management and ownership that provide increased shareholder value. Gompers, Ishii and Metrick (2003)
construct an index based on 24 governance provisions, referred to as the G_SCORE, to measure the
power-sharing relationship between investors and management. The 24 provisions are classified into five
categories of management power: (1) tactics for delaying hostile bids; (2) voting rights; (3)
director/officer protection; (4) other takeover defenses; and (5) state takeover laws. Each firm’s
G_SCORE is the sum of points, where one point is awarded for the presence of each governance
provision. Thus, a higher G_SCORE indicates lower shareholder rights and greater management power.8
We use the Gompers, et al. (2003) G_SCORE metric to proxy for the stakeholder rights component of
governance.
Takeover defenses and other restrictions of shareholder rights like staggered terms of directors,
supermajority voting requirements for approval of mergers and ownership changes, and limits on
shareholders’ ability to meet and act places more power in the hands of management vis-à-vis
shareholders and can make it difficult to remove entrenched management that is acting opportunistically.
8 Using a sample of 1500 firms during the 1990s, Gompers, et al. (2003) find that taking a long position in firms with the strongest shareholder rights and a short position in firms with the weakest shareholder rights yields an average abnormal return of 8.5 percent per year.

11
Consistent with the management disciplining hypothesis, governance mechanisms tilted in favor of
opportunistic management can lower overall firm value, resulting in losses to both shareholders and
bondholders. This line of reasoning leads to a predicted negative relation between G_SCORE and credit
ratings. That is, firms with higher G_SCOREs (less shareholder power) are expected to exhibit lower
credit ratings because it is more difficult or costly to remove management that is acting opportunistically
when managers have greater power vis-à-vis shareholders. Alternatively, we may find a negative relation
between G_SCORE and credit ratings because firms with stronger shareholder rights (lower G_SCORES)
are likely to provide better monitoring and control over management leading to more effective and
efficient managerial decision-making, which in turn leads to better overall firm credit worthiness and
higher credit ratings.9
Giving greater power to shareholders to determine changes in management as well as ownership
control does not necessarily make bondholders better off (FitchRatings, 2004). For example, Asquith and
Wizman (1990) and Warga and Welch (1993) find that pre-buyout bondholders suffer significant wealth
losses in leveraged buyouts. These results suggest that bondholders do not always benefit under all
takeover scenarios. Therefore, governance mechanisms that place greater power in the hands of
shareholders may actually be viewed negatively by bondholders and credit rating agencies because it
increases the likelihood of ownership changes that can transfer wealth from bondholders to stockholders.
This line of reasoning predicts a positive relation between g-scores and credit ratings. That is, firms with
higher g-scores (weaker shareholder rights) are expected to have higher credit ratings. Consistent with
this conjecture, Klock, Mansi and Maxwell (2004) find that firms with stronger anti-takeover provisions
(weaker shareholder rights) have a lower cost of debt financing relative to firms with weaker anti-
takeover provisions.
9 Consistent with this conjecture, Gompers et al. (2003) find that firms with lower g-scores have higher firm values, higher profits, higher sales growth, lower capital expenditures and lower corporate acquisitions. These factors should lower firms’ credit risk leading to higher credit ratings. That is, firms with stronger shareholder rights are expected to have higher credit ratings because of lower risk characteristics. Controlling for these additional risk characteristics does not change the sign or significance of our g-score variable reported below.

12
Given the mixed evidence on whether greater shareholder power translates into benefits for
bondholders (management disciplining hypothesis) or greater risk due to potential wealth transfers
between bondholders and shareholders, we make no directional prediction for the g-score variable.
III.3 Financial Transparency
Transparent financial reporting is critical to reducing the information asymmetry between the firm
and its capital suppliers. We posit that greater financial transparency facilitates the monitoring of
management actions and makes it less likely that management will act opportunistically. Sengupta (1998)
conjectures that firms with more timely and informative disclosures are perceived to have a lower
likelihood of withholding value-relevant unfavorable information. As a result, they are expected to be
charged a lower risk premium by creditors. Consistent with this prediction, he finds that firms with
higher AIMR disclosure ratings enjoy a lower effective interest cost of issuing new debt. As AIMR
disclosure ratings are no longer available, we use the quality of firms’ working capital accruals, WCAQ,
and the timeliness of firms’ earnings, TIMELINESS, to capture the transparency of firms’ financial
reporting. We describe the measurement of WCAQ and TIMELINESS in detail in Section IV. Briefly,
WCAQ is based on the standard deviation of the firm-specific residual from regressing working capital
accruals on past, contemporaneous, and future operating cash flows, where smaller residuals reflect a
better mapping of working capital accruals to cash flows (Dechow and Dichev, 2002). TIMELINESS is
the squared residual from regressing returns on earnings allowing for separate intercepts and slopes for
profit and loss firms (Gu, 2002). Earnings that better articulate with market returns are deemed to be more
transparent and timely in that they better reflect the economic events that are priced by the market. A
high squared residual indicates that earnings are less transparent/timely. To facilitate the interpretation of
these variables, we multiply the variables by negative one and predict a positive relation with firms’ credit
ratings.
The reliability of financial information is due, in part, to the quality and integrity of the audit process.
To proxy for the quality and integrity of the audit process, we use three measures: (1) the total fees (audit
plus non-audit) charged to the client firm divided by the total revenues of the audit firm (TOTFEES); (2)
13
%AUD_IND is the percentage of the audit committee made up of outside independent directors; and (3) a
dummy variable, FIN_EXPERT coded one if the firm’s audit committee has at least one individual
deemed to be a “financial expert,” and zero otherwise. Using the attributes of a financial expert set forth
by the Securities and Exchange Commission (SEC, 2003) this variable is coded one if the audit
committee has an outside independent director that is a CPA or who has experience as a chief financial
officer of another company.10
DeAngelo (1981) posits that auditor independence is threatened as the economic bond between the
auditor and client firm increases. Concern over economic bonding between the client firm and its auditor
was the major impetus behind the restrictions that Sarbanes-Oxley placed on the kinds of nonaudit
services that auditing firms can perform for their clients (U.S. Congress 2002). However, the evidence on
whether economic bonding between the audit firm and its client impairs auditor independence as proxied
by abnormal accruals is mixed. While Frankel, Johnson and Nelson (2002) find evidence consistent with
economic bonding impairing auditor independence, Ashbaugh, LaFond and Mayhew (2003), Chung and
Kallapur (2003) and DeFond, Raghunandan and Subramanyam (2002) do not find evidence of
independence impairment. We use our TOTFEES variable to measure the economic bonding between the
audit firm and its client.11 If credit rating agencies perceive that auditor independence, and thus the quality
of financial statements is impaired due to economic bonding, then we expect a negative relation between
this variable and firms’ credit ratings. However, if credit rating agencies perceive that the economic bond
between auditors and their audit clients do not threaten the quality of firms’ financial reporting, as some
10 The SEC recently adopted this provision of the Sarbanes-Oxley Act (SEC 2003) and defined an “audit committee financial expert” to mean a person who has the following attributes: (1) An understanding of financial statements and generally accepted accounting principles; (2) An ability to assess the general application of such principles in connection with the accounting for estimates, accruals and reserves; (3) Experience preparing, auditing, analyzing or evaluating financial statements that present a breadth and level of complexity of accounting issues that are generally comparable to the breadth and complexity of issues that can reasonably be expected to be raised by the registrant’s financial statements, or experience actively supervising one or more persons engaged in such activities; (4) An understanding of internal controls and procedures for financial reporting; and (5) An understanding of audit committee functions. 11 We consider alternative ways of measuring this construct in the “sensitivity analysis” section below.

14
of the studies noted above indicate, then we expect to find no relation between TOTFEES and credit
ratings.
The conventional wisdom is that audit committees more effectively carry out their oversight of the
financial reporting process if they include a strong base of independent outside directors. Klein (2002)
provides evidence to support this assertion. She finds a negative relation between audit committee
independence and abnormal accruals. She also reports that as audit committee independence declines,
abnormal accruals increase. To the extent that better monitoring of the financial reporting process leads to
less managerial opportunism and better financial transparency, this should lead to lower default risk for
bondholders. Accordingly, under the management disciplining hypothesis we predict a positive relation
between %AUD_IND and credit rating.
Several recent studies investigate whether including independent directors with financial expertise on
the audit committee is likely to improve the quality and integrity of a firm’s financial statements. Klein
(2003) finds that placing independent directors with professional certifications in accounting or law or
prior banking experience on the audit committee reduces earnings management. Agrawal and Chadha
(2003) provide corroborating evidence and find that companies whose boards or audit committees have an
independent director with a background in accounting or finance face a lower probability of earnings
restatements. DeFond, Hann and Hu (2004) and Davidson, Xie and Xu (2004) find a positive market
reaction to firms’ announcements that an accounting financial expert has been appointed to the audit
committee. To the extent that having a financial expert on the audit committee improves board
effectiveness and enhances the integrity of the financial reporting process, we predict this will lead to less
managerial opportunism. Accordingly, under the management disciplining hypothesis we predict a
positive relation between FIN_EXPERT and credit ratings.
III.4 Board Structure and Processes
This component of corporate governance deals with such things as: (1) board size and composition in
terms of proportion of inside, outside and affiliated directors; (2) board leadership and committee
structure; (3) how competent and engaged board members are; (4) whether there are a sufficient number

15
of outside independent directors on the board that represent the interests of all stakeholders, and how
those members are distributed across the various committees; and (5) whether board members are
remunerated and motivated in ways that ensure the long-term success of the company.
The first three elements address the board’s role and ability to provide independent oversight of
management performance and hold management accountable to stakeholders for its actions. Boards often
delegate oversight of key functions or decision making to standing committees—e.g., audit,
compensation, nominating or governance, finance and investment. These committees, made up of subsets
of board members, meet separately from the full board and generally have specific, narrowly defined
functions.
Prior research generally posits a positive relation between board and committee independence and
firm performance. Better firm performance should benefit all stakeholders leading to higher credit
ratings. However, research findings on the relation between board and committee composition and overall
firm performance are mixed. Baysinger and Butler (1985) and Hermalin and Weisbach (1991) find no
significant association between the percentage of outsiders on the board and same-year measures of
corporate performance. Bhagat and Black (2000) find no relation between overall board independence
and four measures of firm performance (Tobins’ Q, return on assets, market adjusted stock returns and
ratio of sales to assets) measured over a three year window. Agrawal and Knoeber (1996) investigate the
relation between firm performance (Tobin’s Q) and seven control mechanisms including percentage of
non-officer board members. Using a simultaneous equations framework to control for the
interdependence among the various control mechanisms, Agrawal and Knoeber find a significant negative
relation between outside membership on the board and firm performance, leading them to conclude that
boards seem to have too many outsiders.
Klein (1998) extends the previous research on board composition and firm performance by examining
the relation between the composition of the overall board and of various committees and firm
performance. Consistent with prior evidence, Klein finds no association between firm performance and
overall board composition. Moreover, she finds no association between the level of independence on

16
audit, compensation and nominating committees and firm performance. Interestingly, she does find a
significant positive association between the percentage of inside directors on finance and investment
committees and accounting and stock market performance measures. One explanation for this result is
that inside board members bring specialized institutional and industry-specific knowledge to the table that
helps these committees select long-term investment and financing strategies that enhance firm value.
Thus, inside board members appear to serve a useful role in overall corporate governance if strategically
placed on committees that have more of an operating focus than a monitoring focus.
Finally, and more germane to bondholder interests, Bhojraj and Sengupta (2003) posit that firms with
a greater proportion of outside directors on the board provide better monitoring of management actions.
Thus, bondholders face less agency risks vis-à-vis management. They posit that this, in turn, will lead to
higher bond ratings and lower debt yields. Consistent with this conjecture, they find that firms with a
higher proportion of nonofficer directors enjoy lower bond yields and higher ratings on new bond issues.
Based on the literature reviewed above, we use %BRD_IND to measure the percentage of board
made up of independent outside (nonaffiliated) directors. In articulating its core governance principles for
protecting bondholders, FitchRatings (2004) notes:
“Assessing a company’s governance practices begins with its board of directors. An independent, active, and committed board of directors is an essential element of a robust governance framework. A board that is not committed to fulfilling its fiduciary responsibilities can open the door for ineffective, incompetent, and, in some cases, unscrupulous management behavior.” (p. 5).
Consistent with this view and the literature reviewed above, we expect a positive relation between
%BRD_IND and credit ratings.
Imhoff (2003) argues that board governance is severely compromised when the current or former
CEO of the company also serves as chairman of the board. This is because the board chairman frequently
sets the board’s agenda and, therefore, controls issues brought before the board. Moreover, CEOs that
serve as board chair frequently have significant influence on the slate of candidates for board seats,
thereby increasing the risk that new board appointees will not be independent of management even

17
though they are “outsiders”. CEOs can also exert significant influence over the board through the
committees they serve on. We use CEOPOWER as a composite measure of the influence that the CEO
exercises over the board. A firm receives one point if the CEO is chairman of the board and one point for
each committee that the CEO serves on. We posit that CEO power on the board is likely to reduce the
board’s disciplining of opportunistic management. Accordingly, under the management disciplining
hypothesis, we predict CEOPOWER will be negatively related to credit ratings.
Ceteris paribus, we expect that boards comprised of members who are more competent or
knowledgeable will do a better job of monitoring the activities of management and make better decisions
leading to less default risk. Similar to Klein (1998), we measure board competency or expertise by the
percentage of outside board members that sit on boards of other companies (%BRD_EXPERT). We
predict a positive relation between this variable and credit ratings.
Board compensation is another element of the ‘Board Structure and Process’ component of
governance. Key issues are whether board members are remunerated and motivated in ways that ensure
the long-term success of the company. Jensen (1993) argues that boards with greater ownership in the
firm are more likely to do a better job of monitoring management and fulfilling their fiduciary
responsibilities. Consistent with this conjecture, Yermack (2003) finds that director stock and option
awards are positively related to firms’ investment opportunities and subsequent firm performance.
Yermack shows that tying directors’ pay more closely to stock performance through the use of options
and other equity awards generally leads to increased performance. We use %BRD_STOCK to measure
the percentage of directors that hold stock in the company and predict a positive relation between this
variable and credit ratings.
Recently the SEC endorsed the proposals of the NYSE and NASDAQ that firms adopt a formal
governance policy that outlines the roles and responsibilities of directors and establishes an explicit code
of business conduct and ethics for directors (SEC, 2003). We expect that having such a formal
governance policy places increased responsibility on board members and increases their legal liability
leading to greater attentiveness on the part of board members. Greater board attentiveness should lead to

18
better monitoring of management which, in turn, should lead to less management opportunism. We code
GOVERNANCE_POLICY with a one if a firm has a formal governance policy, and zero otherwise, and
predict a positive relation between this variable and credit ratings under the management disciplining
hypothesis.
Finally, we use %FINCOM_INSIDE to measure the percentage of insiders on finance committees.12
Based on Klein’s (1998) results that having insiders on finance and/or investment committees improves
firm performance, we expect this committee structure variable to be positively related to credit ratings
since improved firm performance is expected to improve a firm’s creditworthiness.
IV. Sample, Variables and Descriptive Statistics
IV.1. Sample and Data Sources
Data for this study are compiled from four sources:
• Governance measures, audit/non-audit fees and share ownership data – Board Analyst data base
and firm proxy statements
• G_SCORES – Gompers, et al. (2003)
• Credit ratings and accounting variables – Standard and Poor’s Compustat
• Stock return data- CRSP
We obtain the majority of the corporate governance measures from the Board Analyst data base
compiled by The Corporate Library, an independent research firm that provides data and analysis of
corporate governance issues.13 This data base contains detailed governance, audit/non-audit fee data and
stock ownership data (including institutional and inside ownership) for over 2000 U.S. companies and
profiles on over 22,000 individual directors. The data used in our primary analysis are from the 2003
proxy season covering the board and committee structures of firms for the 2002 fiscal year.
12 For those firms without finance committees, we used the percentage of insiders on the overall board for this variable because, in the absence of a finance committee, the overall board would be charged with voting on financial policy matters (see Klein (1998) for similar treatment). 13 Board Analyst does not provide information on finance and investment committees. This information was hand-gathered from 2003 proxy statements.
19
G_SCORES that measure the power-sharing relationship between investors and management were
obtained from Gompers, et al. (2003). These G_SCORES are available for approximately 1500 firms and
are based on the incidence of 24 governance provisions related to shareholder rights and take-over
defenses found in 2002 proxy statements.
For firm credit ratings (RATING) we use the long-term issuer credit ratings compiled by Standard &
Poor’s and reported on Compustat (data item 280). The ratings range from AAA (highest rating) to D
(lowest rating—debt in payment default). These ratings reflect S&P’s assessment of the creditworthiness
of the obligor with respect to its senior debt obligations. For purposes of our analysis, the multiple ratings
are collapsed into seven categories according to the schedule provided in Table 1. To facilitate the
discussion of the economic significance of our results, we also estimate our logistic regression model
using a two category classification scheme—investment grade and speculative grade. The assignment of
the credit rating groups into these two classifications are also shown in Table 1.
[Insert Table 1 here]
Table 2, Panel A summarizes the sample selection procedure and number of firms lost because of
minimum data requirements from each data source. Essentially, our final sample for the credit rating
analysis is determined by the intersection of firms for which required data are available on the four data
sources noted above.14
[Insert Table 2 here]
Panel B of Table 2 provides details on board and committee composition for our sample firms. Out of
894 sample firms, all have audit committees, 99.6% (890) have compensation committees, 90.9% (813)
have nominating committees, but only 27.1% (242) have finance committees. The average board
(committee) size is 10 (4) directors. The incidence of firms having at least one insider on a committee
ranges from 0.7% (6 / 894) for audit committees to 30.2% (73 / 242) for finance committees. The much
14 In general, our sample firms are larger than the average firm on Compustat with sample means of assets, sales, market value of equity, and long-term debt (in millions) of $20,765, $7,502, $8,982, and $4,021, respectively. In addition, 84%, 15% and 1% of the sample firms’ shares trade on the New York Stock Exchange, NASDAQ, and the American Stock Exchange, respectively.
20
higher incidence of insiders on finance committees presumably reflects the fact that insiders bring
valuable institutional and industry-specific knowledge and expertise to this committee (Klein, 1998).
Roughly 73% of our sample firms have CEOs that serve as Chairman of the Board, and the more common
committees that CEOs serve on are the nominating and finance committees.
IV.2. Independent Variables
Corporate Governance Measures
The variables identified in Section III that we use to capture key governance attributes within the
S&P framework are summarized in Panel A of Table 3 along with their predicted relation with RATING.
Except for our measures of financial transparency, the variable measurements were described in detail in
Section III when introduced, so we do not take time to repeat them here.
[Insert Table 3 here]
Our first measure of financial transparency, working capital accrual quality (WCAQ), is an
accounting based measure of financial reporting quality based on the work of Dechow and Dichev (2002).
Dechow and Dichev (2002) derive a measure of working capital accruals quality that is a function of how
well working capital accruals map into cash flows. The calculation of WCAQ is a two-step process
beginning with the cross-sectional estimation of the following OLS model:
εββββ ++++= +− 132110 tttt CFOCFOCFOWCA (1)
where
WCA=working capital accruals (-(Compustat # 302+ Compustat # 303+ Compustat # 304+ Compustat # 305+ Compustat # 307)) scaled by average total assets (Compustat # 6), CFO= cash flow from operations (Compustat # 308) scaled by average total assets. We estimate regressions by three, two, or one-digit SIC codes conditional on having at least ten firms in
each SIC group. WCAQ is the standard deviation of the firm-specific residual from the prior three to five
years. Firms with smaller WCAQ values report working capital accruals that better map into cash flows,
i.e., are considered to have higher quality working capital accruals. To facilitate discussion of our results,

21
we multiply WCAQ by negative one. Thus, larger WCAQ values imply higher quality working capital
accruals.
Our second measure of financial transparency, TIMELINESS, is derived from the following
regression equation:
ititititititit NIBELOSSNIBELOSSNIBEET εβββββ +∆++++= 43210 *R (2)
where
RETit = the market adjusted return for firm i over fiscal year t (from CRSP), NIBEit = net income before extraordinary items (Compustat # 18) scaled by beginning of period market value of equity for firm i in period t (Compustat # 25 * Compustat # 199), LOSSit = one if NIBE is negative, zero otherwise, ∆NIBEit = the change in net income before extraordinary items (Compustat # 18) scaled by beginning of period market value of equity (Compustat # 25* Compustat # 199), NIBEit* LOSSit = interaction term that allows for a differential market reaction for loss versus profit firms.
We estimate the above regression cross-sectionally within one, two and three digit SIC codes requiring a
minimum of ten firms in each industry grouping.
Gu (2002) argues that the squared residuals from equation (2) can be conveniently interpreted as the
degree of price movement (returns) that is not explained by contemporaneous accounting earnings.
Higher squared residuals imply less timely earnings. To facilitate interpretation of our results, we multiply
this measure by negative one. Thus, larger (less negative) values imply more timely earnings. One can
think about financial statement transparency as encompassing the relevance and reliability dimensions of
accounting information. The more information about the firm’s current economic activities that is
embedded in current earnings and the more precise that information (i.e., the more relevant and reliable it
is), then the more transparent the economic activities of a company is to its stakeholders. Higher quality,
more transparent earnings information means less information asymmetry between the firm and its
bondholders, leading to less uncertainty about default risk which, in turn, should lead to higher credit
ratings. Barth and Landsman (2003) provide empirical support for this claim in that they find that firms
with more value relevant earnings enjoy a lower cost of debt. We use the Gu measure as one proxy for
22
financial transparency as it captures both the timeliness of firms’ financial information and relevance of
the financial information for assessing firms’ current economic conditions. 15
Control Variables—Firm Characteristics
Additional firm-specific explanatory variables are included in the RATING models based on a survey
of prior research on the determinants of corporate bond ratings (e.g., Horrigan 1966, Kaplan and Urwitz
1979, Boardman and McEnally 1981, Lamy and Thompson 1988, and Ziebart and Rieter 1992). The
accounting-based ratios of debt-to-assets (LEV), return-on-assets (ROA), and interest coverage
(INT_COV) are used to proxy for firms’ default risk, where higher LEV and lower ROA and INT_COV
values reflect greater default risk. We use LOSS, a categorical variable set equal to one if the firm reports
negative earnings in the current and prior fiscal year, as another control for default risk given that the
likelihood of default is greater for firms that are unprofitable.
Firm size, SIZE, is included as a control variable because larger firms face lower risk, and thus are
expected to have higher credit ratings. We also control for differences in firms’ debt structure by
including SUBORD, which is coded one if the firm has subordinated debt. The debt structure of a firm
with subordinated debt is considered to more risky due to the differential claims to assets by debt
providers. Firms’ capital intensity (CAP_INTEN) is included in the model to control for differences in
firms’ asset structure, where firms with greater capital intensity present lower risk to debt providers, and
thus are expected to have higher credit ratings. Finally, FIN_UTILITY is set equal to one if a firm is a
financial institution or utility firm, (zero for firms not in these two industries) to control for lower default
risk for firms operating in regulated industries.
The specific measurements of the variables capturing differences in firm characteristic along with
their predicted relation with RATING are summarized in Table 3.
Descriptive Statistics
15 To validate this construct, we regress the AIMR disclosure ratings on TIMELINESS for the same periods. The coefficient is 13.26 with a t-statistic of 3.89. Thus, this measure of financial transparency and AIMR disclosure rankings appear to be capturing similar constructs.

23
Table 4 presents descriptive statistics for the various governance and firm-characteristic variables.
Within the “Ownership Structure and Influence” component of governance, we find the average (median)
number of blockholders that own 5% or more or the firm’s stock is 4.5 (4.0). The average (median)
percentage of shares held by institutional investors is 63% (68%) while the average (median) percentage
of shares held by insiders (officers and directors) is 8% (4%). For the “Financial Stakeholder Rights”
dimension of corporate governance, the average G_SCORE of our sample firms is 9.59, which is similar
to the mean G_SCORE reported by Gompers, et al., of 9.15. Sixty-one of our sample firms (6.8%) fall
into Gompers et al.’s dictatorship portfolio (G_SCORES > 13 indicating greater management power)
while forty-two firms (4.7%) fall into their democracy portfolio (G_SCORES < 6 indicating greater
shareholder rights).
[Insert Table 4 here]
Turning to the “Financial Transparency” dimension, the mean (median) WCAQ and TIMELINESS
value is -0.04 (-0.03) and -0.10 (-0.03), respectively. Recall the larger (i.e., less negative) values of these
variables reflect higher quality financial reporting. The measure of economic bonding between the firm
and its auditor is our TOTFEES variable.16 Because of its small magnitude, we multiply this variable by
100. Before this scaling adjustment, the median firm’s total fees paid to its auditor amount to only .04%
of the audit firm’s total revenues. Ninety-two percent of the average firm’s audit committee is comprised
of outside independent board members, with over three-quarters of the sample firms having 100%
independent audit committees. The little variation in %AUD_IND is explained by the fact that the listing
rules of the New York Stock Exchange and NASDAQ require listed firms to have audit committees
comprised of at least three independent directors. There are, however, exceptions to the rules that result
in not all firms having 100 percent independent audit committees (see Klein (2003) for an overview).
Finally, 26% of our sample firms have an outside financial expert (CPA or CFO) serving on their audit
committee.
16 Recall we measure this as total fees (audit and non-audit) paid by the client divided by the audit firm’s total revenue.

24
Within the “Board Structure and Process’ dimension, the descriptive statistics indicate that the
average (median) percentage of outsiders on the board is 70% (73%) and the lower quartile value is 58%.
Consistent with the evidence in Table 2, the majority of our sample firms have CEOs that also serve as
Chairman of the Board or on other board committees. On average, 36% of outside directors serve on other
boards and 87% of the directors hold stock in the company. Forty-two percent of the sample firms have a
formal governance policy. The average percentage of outsiders on the compensation (nominating)
committee is 90% (79%), while the average percentage of insiders on the finance committee is 15%.17
For brevity, we do not take time to describe the summary statistics for the firm characteristic
variables. Turning to the dependent variables, we note that the median credit rating is 4.0 implying a debt
rating in the BBB+ to BBB- range, and that sixty-three percent of our sample firms have an investment
grade credit rating.
Table 5 presents correlations among the firm characteristic variables (Panel A) and governance
variables (Panel B) and between these variables and credit ratings. The upper right hand portion of each
panel presents Pearson product-moment correlations while the lower left hand portion presents the
Spearman rank-order correlations. In Panel A, the simple correlations between each of the firm
characteristics and our RATING variable are in the predicted directions and are statistically significant at
the .01 level or below except for the capital intensity variable (CAP_INTEN), which is negative and
insignificant. Specifically, we find that ROA, INT_COV, SIZE and FIN_UTILITY are significantly
positively correlated with credit ratings whereas LEV, LOSS, and SUBORD are significantly negatively
correlated with ratings. Not surprisingly, several of the firm characteristic variables exhibit high
intercorrelations.
[Insert Table 5 here]
17 Recall that in coding this variable, if a firm does not have a standing finance committee, we used the percentage of insiders on the overall board for %FINCOM_INSIDE because the board de facto votes on all major financing decisions in the absence of a finance committee. This explains why the percentage of insiders on this committee appears to be smaller than the numbers imply in Table 2.

25
Panel B of Table 5 presents the correlations between the various governance variables and between
these variables and RATING. Fourteen of the sixteen governance variables exhibit Pearson correlations
with the RATING variable that are significant at .01 or below. The correlations among the various
governance variables generally fall below .30 except for the board and committee independence measures
(shown in shaded cells) which are generally in the .38 to .56 range. The high intercorrelations between the
committee and board independence measures are to be expected because the committees are drawn from
the board membership. Because of these high correlations, we include only the board and audit committee
independence measures in our logit model.
V. Empirical Tests and Results
V.1 Ordered Logit Results
Our empirical tests are derived from a general model that represents credit ratings as a function of
corporate governance components and firm characteristics.
Credit rating = f (corporate governance components, firm characteristics).
To test the predicted relations between corporate governance components and credit ratings, we
estimate a series of ordered logit models. We use ordered logit models because the seven categories of
credit ratings convey ordinal risk assessments; we can rank order firms’ preferences across the rating
categories but cannot assume uniform differences in benefits (costs) between the categories.
[Insert Table 6 here]
We begin by estimating the model using only the firm characteristic variables to provide a benchmark
from which to assess the incremental effect of various corporate governance mechanisms on credit
ratings. The benchmark results are reported in the Model 1 column of Table 6. All of the estimated
coefficients on the firm characteristics have the expected sign and are significant at the 0.01 level or
better. The results document that credit ratings are positively related to ROA, INT_COV, SIZE,
CAP_INTEN, and negatively related to LEV, LOSS and SUBORD. We also document that utilities and
financial institutions are likely to have better credit ratings. The benchmark model yields a Likelihood
ratio χ2 of 660.55, which is significant at the .01 level, and has a generalized R-square of 52 percent.

26
The remaining columns of Table 6 report the results of testing whether the various components of
corporate governance within the S&P framework are associated with firms’ credit ratings. In Column 2
of Table 6, we report the results of estimating the model incorporating the “Ownership Structure and
Influence” component of corporate governance. We find a significant negative coefficient on BLOCK, a
significant positive coefficient on %INST, and a marginally significant negative coefficient (p < .10) on
%INSIDE. The significant positive coefficient on %INST is consistent with our “management
disciplining” hypothesis the conjectures that institutional investors contribute to more efficient monitoring
of management and that the benefits of better monitoring are shared by all stakeholders. The negative
coefficient on BLOCK indicates that firms with a larger number of blockholders have lower credit
ratings. This finding is consistent with our “wealth redistribution” hypothesis that blockholders, as
influential shareholders, can exercise influence on management to secure benefits that are detrimental to
bondholders. This result also corroborates the findings of Bhojraj and Sengupta (2003) who document
that blockholders have an adverse impact on bond ratings. The marginally negative coefficient on
%INSIDE implies that inside ownership adversely affects bondholders providing additional evidence
supporting our “wealth redistribution” hypothesis. The Wald χ2 of 39.64 (significant at .01) indicates that
the addition of the ownership structure and influence variables, as a group, add significant incremental
explanatory power to the benchmark credit rating model.
The results of estimating the model using G_SCORE as our proxy for “Financial Stakeholder Rights
and Relations” are reported in the Model 3 column of Table 6. We find a positive and highly significant
coefficient on G_SCORE and the Wald χ2 of 13.47 is statistically significant at the .01 level. Recall that
the smaller the G_SCORE, the stronger the shareholder rights. Our results suggest that stronger
shareholder rights are associated with lower firm credit ratings. Gompers, et al. (2003) find that firms
with stronger shareholder rights have higher firm value and higher profits. Thus, this finding provides
strong support for the “wealth redistribution” hypothesis that posits that bondholders may suffer potential
wealth transfer effects associated with stronger shareholder rights and that from the bondholders’
perspective the risks of wealth transfer outweigh the positive firm value effects documented in Gompers,

27
et al. (2003). Our finding of a positive association between G_SCORE and credit ratings is consistent
with the work of Asquith and Wizman (1990) and Warga and Welch (1993) who find that certain kinds of
ownership changes can result in significant wealth transfers from bondholders to shareholders. Our results
are also consistent with Klock, et al. (2004) who find that firms with stronger anti-takeover provisions
(weaker shareholder rights) have a lower cost of debt financing relative to firms with weaker anti-
takeover provisions.
The Model 4 column of Table 6 displays the results from estimating the credit rating model using the
“Financial Transparency” variables after controlling for firm characteristics. As predicted, we find a
positive relation between RATING and the transparency of firms’ financial reporting as measured by
WCAQ and TIMELINESS. We also find evidence that the quality of the audit process affects a firm’s
credit rating in that firms having more independent directors serving on their audit committees and having
an independent financial expert on the audit committee have better credit ratings. We fail to find a
significant association between TOTFEES and RATING. The Wald χ2 of 77.16 indicates that the
variables comprising the financial transparency and information disclosure component significantly
improve the explanatory power of the RATING model.
The results of investigating whether the “Board Structure and Processes” component of corporate
governance affects credit ratings are reported in the Model 5 column of Table 6. In general, the estimated
coefficients on the “Board Structure and Processes” variables support our “management disciplining”
hypothesis that better board structure and processes contribute to more efficient monitoring of
management that protects all stakeholders’ interests. As predicted, we find a positive coefficient on
%BRD_IND, which indicates that the greater the board’s ability to provide independent oversight of
management the better the credit rating. This result is consistent with Bhojraj and Sengupta (2003) who
find that firms with a greater proportion of independent outside directors on the board have higher bond
ratings. The positive coefficient on %BRD_EXPERT indicates that when a greater proportion of the
board is comprised of knowledgeable individuals, as proxied by their service to other boards, the higher
the firm credit rating. We also document a positive relation between %BRD_STOCK and RATING. This

28
result indicates that as more members of the board have an equity stake in the firm, they have greater
incentives to restrict managerial opportunism or to monitor management decision making leading to
lower default risk. Finally, the documented positive coefficient on GOVERNANCE_POLICY suggests
that firms receive benefits in the form of better credit ratings by having formal governance policies.
Overall, the Wald χ2 of 42.66 indicates that the board structure and processes component is a significant
determinant of firms’ credit ratings.
The last column of Table 6 reports the full model, where we jointly test whether the four components
of the S&P corporate governance framework are associated with firms’ credit ratings. The model is
highly significant with a Wald χ2 of 139.93. While the coefficients on the firm characteristic variables
remain significant and in the predicted relation to credit ratings with the exception of FIN_UTILITY, the
results indicate that within each component of S&P governance framework, there appears to be at least
one dominant governance mechanism that affects firms’ credit ratings. Specifically, after incorporating
all four components of governance into the RATING model, we find BLOCK, G_SCORE, WCAQ, and
TIMELINESS are governance attributes that are significant determinants of credit ratings. In addition,
we find that four of the six governance provisions related to board structure and processes are significant.
Specifically, we find the coefficients on %BRD_IND, %BRD_EXP, and %BRD_STOCK to be positive
and significant at conventional levels. We also find a marginally significant negative coefficient on
CEOPOWER. This latter result suggests that it is costly for firms, in terms of default risk, to cede the
chief executive officer with too much board control.
V.2 Investment vs. Speculative Grade Analysis
As stated above, credit ratings convey ordinal risk assessments. Because of the difficulty in
quantifying the marginal effects of changes in each governance variable on credit ratings with multiple
categories, we use an alternative classification scheme that partitions credit ratings into two categories--
investment grade or speculative grade. Many bond portfolio managers are restricted from owning
speculative grade bonds (Grinblatt and Titman, 2002), and as such, firms incur significant costs if they

29
receive a speculative bond rating. Furthermore, using a dichotomous credit rating classification allows us
to more readily assess the economic impact of corporate governance on firms’ expected cost of debt.
Table 7 displays the results of estimating six logitistic regressions using INVESTMENT_GRADE as
the dependent variable, where INVESTMENT_GRADE is coded one if the firm’s credit rating is BBB- or
better, and zero otherwise. The results are similar to the results of the RATING analyses reported in
Table 6 with a few exceptions. First, the coefficient on INT_COV is insignificant in all of the
INVESTMENT_GRADE analyses whereas it was highly significant in all of the RATING analyses.
Second, when considering the financial transparency component of corporate governance in isolation, the
coefficients on %AUD_IND and FIN_EXPERT are not significant. Third, the coefficient on
%BRD_EXPERT is not significant in either Model 5 or Model 6. Finally, unlike the RATING analysis,
the coefficients on %BRD_IND and CEOPOWER are insignificant in the full model. When we estimate
the INVESTMENT_GRADE model that incorporates all four corporate governance components, we find
once again that BLOCK is negatively related to credit ratings and G_SCORE, WCAQ, TIMELINESS,
and %BRD_STOCK are positively related to credit ratings.
[Insert Table 7 here]
In order to provide some insight into the economic significance of our results, we calculate the change
in probability of receiving an investment grade credit rating as a result of changing the levels of various
corporate governance variables. The change in probability is calculated using the following steps. First,
we calculate the probability of achieving an investment grade credit rating from our logitistic regression
model using the following expression:
)1()( '' XX eeX ββπ += (3)
where β is the vector of coefficients from Model 6 in Table 7 and X is the vector of independent variables
set equal to their mean values. Next, we calculate the marginal changes in the probability of a firm
receiving an investment grade credit rating as a result of a one unit change in each of our governance
variables. This marginal effect is measured by )](1)[(/)( XXxX ii ππβπ −=∂∂ , which is again calculated at
30
the mean value of the regressors. These marginal effects are reported in column 3 of Table 8 for the
governance variables after standardizing each non-binary variable by its mean and dividing by its
standard deviation.18 The marginal effects measure the change in the probability of receiving an
investment grade rating for a one standardized unit change in each governance variable while holding the
firm characteristics at their mean values.
An alternative way of assessing the effect of various governance variables on the likelihood of
receiving an investment grade credit rating that is easier to interpret is to calculate the values of the logit
function, )(Xπ , at selected xi values such as their lower and upper quartiles (Agresti 2002, p. 167). This
entails substituting the quartile values for each xi explanatory variable into eqn. (2) while holding the
other variables constant at their means. The linear approximation to changes in )(Xπ is obtained by
multiplying the interquartile range of xi values (see Table 4 for the interquartile ranges) by the marginal
effects based on the unstandardized value of the variables (Agresti 2002, Chapter 5). These values are
reported in the last column of Table 8.
[Insert Table 8 here]
Moving from the first quartile to the third quartile of BLOCK decreases the probability of receiving
an investment grade credit rating by approximately .19. The change in probabilities for G_SCORE,
WCAQ, and TIMELINESS are approximately .04, .05, and .08, respectively, while the change in
probabilities for %BRD_IND and %BRD_STOCK are .048 and .052 respectively. Although the
probability changes due to any one governance variable may not appear to be all that dramatic, the
aggregate effect across all dimensions of corporate governance can be substantial.
To demonstrate this point, we first calculate the probability of receiving an investment grade credit
rating for a hypothetical firm that takes on the lower (upper) quartile values of governance variables that
are positively (negatively) related to credit ratings while holding all the firm-specific variables at their
18 We use standardized values because the various governance variables are measured in different units. Without standardization the marginal probabilities are difficult to compare and interpret (Agresti 2002, Chapter 5).

31
mean values.19 This yields a probability of receiving an investment grade credit rating of .46. We next
repeat this process but now use upper (lower) quartile values of governance variables that are positively
(negatively) related to credit ratings. This yields a probability of receiving an investment grade credit
rating of .93. Thus, a firm approximately doubles its probability of receiving an investment grade credit
rating by implementing better governance along multiple dimensions.20 During the time frame of our
analysis, the average yield for firms with investment (speculative) grade debt with a ten year maturity was
approximately 6.00% (14.0%). This 800 basis-point spread translates into $38.4 million in before-tax
interest costs for the median firm in our investment grade sample.21 This cost estimate, however,
overstates the cost of weak governance from shareholders’ perspective when weak governance allows
wealth transfers from bondholders to shareholders can take place. To the extent that part of the interest
rate spread between investment grade and speculative grade debt is due to bondholders price-protecting
against potential wealth transfers between themselves and stockholders, the amount computed above
represents an upper bound on the cost of weak governance from the stockholder’s perspective.
Nevertheless, governance mechanisms that increase firms’ likelihood of receiving an investment grade
debt rating have significant implications for assessing debt financing costs.
VI. Additional Analyses
VI.1 Why Don’t All Firms Practice Good Governance?
The preceding analysis suggests that firms with weak governance have a lower probability of
receiving an investment grade credit rating and, as a consequence, incur significantly higher debt costs.
19 For governance attributes measured as a 0-1 dummy variable, the benchmark probability is determined with the zero (one) value when the governance attribute is negatively (positively) related to credit ratings. 20 We hasten to note that this illustration does not reflect the typical firm in our sample because any given firm will likely not start from a position of having weak governance (low quartile) along all of the multiple dimensions we consider. Nor is it likely that any given firm would be able to move to a position of having strong governance along all dimensions (upper quartile). 21 To calculate the incremental interest costs, we first determine the mean debt-to-asset ratio for our sample of investment grade firms (0.28). We then multiply this ratio times the total assets of each speculative grade firm to estimate the “as-if” capital structure if the speculative grade firm was an investment grade firm. Finally, we multiply the estimated debt level times the 800-basis point spread to determine a speculative firm’s hypothetical incremental interest cost from having weak governance.
32
This raises the question of why some firms are willing to bear additional debt financing costs by not
practicing good governance. One way to think about answering this question is to consider how
managers can appropriate some or all of the rents from outside stakeholders by resisting better
governance.
Evidence by Core, et al. (1999) suggests one way that managers can extract rents from weak
governance. They find that CEOs with greater power over the board or that are more entrenched earn
greater compensation after controlling for standard economic determinants of pay. Moreover, they find
that the estimated component of overcompensation is significantly negatively related with subsequent
firm operating and stock performance. Their results suggest that firms with weaker governance structures
exhibit greater overcompensation of CEOs and face greater agency problems. Generalizing the Core et al.
(1999) results to our research setting, it may be rational for managers to resist efforts to improve
governance as long as they receive more overcompensation relative to their share of increased debt costs
due to weaker governance. Moreover, various frictions in the market for corporate control such as anti-
takeover amendments, super-majority voting rules for ownership changes, poison pills and golden
parachutes contribute to management entrenchment and allow overcompensation and non-optimal
governance structures to persist.
To investigate whether overcompensation helps explain why some firms don’t seek stronger
governance, we model CEO pay in 2002 as:
CEO_PAY = f (economic determinants, board and ownership structure attributes).
Following Core et al. (1999), we measure CEO_PAY in three different ways: Salary, Salary+Bonus
and Total Compensation. The definitions of the alternative measures of CEO_PAY, the specific board
and ownership structure variables and the economic determinants are detailed in the Appendix. As noted
in Core et al. (1999), the portion of CEO_PAY explained by the board and ownership variables represents
overcompensation. Under the optimal contracting view there should be no association between these
governance provisions and CEO compensation, i.e., CEO compensation is only a function of economic
determinants.

33
The results of estimating the cross-sectional models of CEO_PAY for sample firms (Equation A1) are
presented in Panel A of Table 9. As shown, the economic and board and ownership variables explain
from 39% (for Total Compensation) to 52% (for Salary + Bonus) of the variation in CEO pay. The F-tests
on the incremental explanatory power of the set of board and ownership variables relative to the economic
determinants of pay are significant at .001 level and below.
[Insert Table 9 here]
To estimate the proportion of the CEO’s compensation that represents overcompensation
(OVERCOMP), we first calculate for each sample firm the predicted excess compensation by multiplying
the estimated board and ownership coefficients by the sample firm’s board and ownership variables’
values. We then scale predicted overcompensation (OC) by the relevant CEO_PAY value (which we
label OC_Salary, OC_Salary+Bonus and OC_TotalComp).
Our major findings related to overcompensation are summarized in Panel B of Table 9. The mean
(median) overcompensation percentage for firms in our Investment Grade sample ranges from 34.9%
(32.7%) for OC_Salary to 56.1% (50.9%) for OC_TotalComp. For the firms in our Speculative Grade
sample, the corresponding mean (median) overcompensation percentages range from 39.1% (35.5%) for
OC_Salary to 59.2% (60.8%) for OC_TotalComp. For two of the three compensation measures, the
Speculative Grade sample exhibits significantly greater overcompensation of CEOs relative to the
Investment Grade sample after controlling for standard economic determinants of pay.
To give some idea of the incentives that CEOs of Speculative Grade firms have for trading off higher
firm debt cost due to weaker governance for higher overcompensation paid directly to them, we scale the
CEO’s overcompensation by his share of additional financing costs that the firm incurs by having
Speculative Grade debt. To calculate the CEO’s share of the higher financing costs, we multiply the
CEO’s percentage ownership in the firm by the after-tax cost of the additional financing costs to the
34
firm.22 The results of this comparison are presented in Panel C of Table 9. The median value of
OC_Salary is $240,000 (not tabled) which is roughly 123 times the CEO’s share of the additional after-
tax interest cost from having speculative grade debt versus investment grade debt. For OC_Salary+Bonus,
the median overcompensation is $646,000 with a multiple of 334, and for OC_TotalComp the median
overcompensation is $1,808,000, which translates into a multiple 905 times the CEO’s share of the after-
tax interest cost differential.23
To statistically test the CEO’s benefits-to-cost ratio of weak governance, we partition firms in our
Speculative Grade sample into two groups. The first group represents the sub-sample of firms for which
the CEO’s overcompensation is less than or equal to the CEO’s share of the interest expense. The other
group is the sub-sample of firms for which the CEO’s overcompensation is greater than his portion of
interest costs due to weak governance. The latter group reflects the firms for which the CEO benefits
outweigh the costs of weak governance. Consequently, these are firms where the CEO is expected to
impede governance improvements as they would result in a net loss to the CEO, given his degree of
overcompensation and ownership stake in the firm. The χ2 test results suggest that for the vast majority
of firms in the Speculative Grade debt sample, the degree of CEO overcompensation outweighs his share
of the additional debt costs that may result from weaker governance.
A competing explanation for why CEOs may be willing to have the firm incur higher interest costs
due to weaker governance is that the higher interest costs are associated with the firm taking on riskier
projects with a higher expected return, which benefits shareholders as the residual claimants. The higher
interest costs could be offset by higher shareholder value, which can also benefit the CEO indirectly via
continued employment or directly via his personal ownership stake in the firm. Moreover, under this
22 The additional after-tax financing costs are determined by multiplying the firm’s long-term debt at the beginning of 2002 times 8% (the spread between investment grade and speculative grade debt with 10 year maturity in 2002) times 65% (1 – marginal corporate tax rate). 23 A major reason for these relatively large multiples is because CEOs of most firms in the speculative grade sample hold such a small percentage of the firm’s shares. For example, 169 of the 245 speculative grade firms have CEOs that own less than one-tenth of 1% of the firm’s stock. Thus, the typical CEO’s share of the higher after-tax interest costs is quite small.

35
competing explanation the “excess compensation” that we have estimated may simply be compensating
managers for bearing higher risk.
If this risk explanation for higher compensation is valid, we should observe firms with lower credit
ratings exhibiting higher future performance. That is, we would expect riskier firms to earn higher
accounting rates of return. Table 10 provides evidence on this competing explanation for our sample of
firms. Panel A shows that next year’s ROA (ROE) is positively associated with firms having investment
grade credit ratings after controlling for the current year ROA (ROE). Thus, it is not the case that firms
with lower credit ratings have higher shareholder value due to stronger future performance. Consistent
with results in Core et al. (1999), Panel B shows a significant negative relation between the amount of
overcompensation and future period ROA. Moreover, our excess compensation results are not due to
risk premia—that is, compensating managers for bearing higher risk. The risk effects on
compensation are controlled for through two of the economic determinants of compensation
included in the model--the standard deviation of ROA (STD_OPROA) and the standard deviation
of stock returns (STD_RET). These results are consistent with the conjecture that firms with weaker
governance have greater agency problems and the resulting CEO overcompensation is a dead weight cost
that is borne by all stakeholders.
[Insert Table 10 here]
If it is easier for CEOs of firms with weaker governance to garner excess compensation, as the results
presented here suggest, and if the CEO’s share of the additional debt costs are low, then there are clear
incentives for managers to resist efforts to strengthen governance. Thus, CEO expropriation of rents
through excess compensation provides one potential explanation for why some firms continue to operate
with weaker governance when doing so may mean lower credit ratings.
VI.2 Endogeneity
The preceding analysis treats governance attributes as being exogenously determined. Under the
assumption of optimal contracting, a firm’s governance structure is unique in equilibrium and

36
endogenously determined (Bushman, Chen, Engel and Smith, 2004; Hermalin and Weisbach, 2003). If
governance provisions are endogenously determined such that there is a factor or set of factors that affect
governance and also affect credit rating agencies’ assessment of firms’ creditworthiness, then our study
suffers from a potential correlated omitted variable problem. This misspecification causes the parameter
estimates to be inconsistent, which clouds the interpretation of results.
The econometric solution for endogeneity is to use two-stage procedures that rely on instrumental
variables to generate predicted values of the independent variables (in our case, the set of governance
variables) that are uncorrelated with the error term in the structural model. Unfortunately, instrumental
variables are very difficult to identify in most accounting research settings (Ittner and Larcker, 2001).
This is particularly true with respect to governance attributes in that there is no well developed theory or
model of the economic determinants of governance (Hermalin and Weisbach, 2003).
The lack of theory on the determinants of corporate governance draws into question the adequacy of
any instrumental variable approach to deal with potential endogeneity issues in our setting. However,
there is limited empirical evidence (Hermalin and Weisbach, 1991; Bhagat and Black, 2000), that poor
past performance (both accounting and stock market) leads to increases in board independence.
Therefore, past performance is potentially a correlated omitted variable, at least with respect to our board
independence measure.
In Table 11, we expand our full model (Model 6 in Table 6) to include stock returns (PP_RET) as a
past performance measure.24 This measure is industry-adjusted and we present results for one, three and
five-year prior performance horizons.25 With one exception (G_SCORE, 5-year prior performance) all of
the variables that were significantly related to credit ratings in our original model continue to be
24 Including past performance measures in our base model along with the set of governance variable is equivalent to using two stage procedures where we first regress each of the governance variables on the past performance variables and then include the predicted values from the first stage model into the structural model. We choose the one-step approach because it is simpler to implement given the fourteen separate governance variables in our structural model. 25 We also conducted analyses using raw performance and market-adjusted performance measures and the results are qualitatively the same as those reported here.

37
significant in the augmented model. Thus, the inclusion of a past performance measure has little
influence on our conclusions regarding the importance of governance on credit ratings.
[Insert Table 11 here]
Another potential competing explanation for our results is that having debt in a firm’s capital
structure may act as a substitute for strong governance. Jensen (1986) argues that having debt in the
capital structure can reduce the agency costs that external stakeholders face when firms have free cash
flows available for discretionary spending by managers. The threat caused by failure to make debt service
payments serves as an effective motivating force for managers to invest firms’ resources in ways that
maximize the cash flows available to external stakeholders. Firms with weak governance may choose to
have managers pre-commit to achieving a minimal cash flow by issuing debt. Thus, Jensen’s free cash
flow theory of capital structure implies that firms with weaker governance will have more debt
outstanding, resulting in lower credit ratings and higher interest costs.
Merging governance and the traditional capital structure hypothesis suggests that there is a trade-off
between governance and capital structure. In other words, strong governance and leverage are negatively
related. Thus, the higher interest costs we attribute to having weaker governance may well be costs
associated with firms choosing to operate with higher leverage which serves the same role as governance
in disciplining managements’ opportunistic tendencies towards over investing. However, there are several
pieces of evidence in our results that are inconsistent with this competing capital structure hypothesis.
First, differences in sample firms’ capital structures are controlled for by including leverage as one of
the firm-specific control variables in our credit rating model. That is, the effects of the various governance
variables on credit ratings are after taking into account how leverage affects credit ratings. Second, in
unreported results, we find the correlations between the various governance variables and leverage to be
quite low, generally falling in the range of + or - 0.05. Only one of the governance variables
(%BRD_EXPERT) exhibits a significant negative correlation with leverage (ρ=-0.09). As a group, the
governance variables explain only 4% of the cross-sectional variation in leverage. Therefore, for our
sample, governance does not appear to determine leverage. Finally, firms that issued debt during our

38
sample period actually tended to have stronger governance along most dimensions than those firms that
did not issue debt.26 Again, these results are inconsistent with debt acting as a substitute for strong
governance.
In addition to the supplemental results noted above, there are other features of our setting that suggest
correlated omitted variables are not driving our results. In Table 6 we show that there are seven distinct
governance variables that are significantly related to credit ratings. There is at least one variable from
each of the four S&P components of governance that exhibits significant explanatory power, and there is
relatively low correlation among these seven governance variables (see Table 5). Thus, there is no single
omitted variable that could simultaneously be correlated with all seven of these governance variables in
such a way to provide an alternative explanation for our results. Moreover, it is hard to imagine that there
would be a set of omitted economic variables that would be highly correlated with our governance
variables and be correlated with credit ratings in a fashion that’s consistent with our findings.27
Another feature of our setting that suggests that we have appropriately modeled credit ratings is the
evidence from credit rating agencies themselves that indicates that governance features are an important
input into the credit rating process. For example, in a recent special report on credit policy entitled,
“Evaluating Corporate Governance: The Bondholders’ Perspective”28, Fitch Ratings (2004) states the
following:
“The purpose of this global criteria report is to inform the marketplace of Fitch Ratings’ approach to evaluating and incorporating the quality of a company’s corporate governance within the overall credit ratings process. While Fitch always has taken aspects of corporate governance into account, this report formalizes a more systematic framework for reviewing governance practices that affect credit quality . . .” Fitch’s framework is grounded in agency theory and defines corporate governance from a creditor perspective. . . . .Ultimately, companies that are found to have exceptionally
26 These results are available from the authors upon request. 27 We also acknowledge that there could be other economic variables omitted from the model that are correlated (some positively and some negatively) with credit ratings. We have included all the major economic determinants of credit ratings in our model based on evidence provided in prior research. If there are major economic variables that have been omitted from our model, then these have been systematically overlooked by a vast literature on determinants of debt ratings, and we believe this is unlikely. 28 Fitch Ratings, Credit Policy, Special Report, “Evaluating Corporate Governance: The Bondholders’ Perspective,” April 12, 2004.
39
weak corporate governance (or disclosure practices) could face a downgrade or other negative rating action, while those with very strong practices might warrant a special or favorable mention in the credit analysis.” (p. 1).
Statements like these by major credit rating agencies clearly indicate that governance factors are direct
inputs to the credit rating process. Moreover, three major rating agencies (S&P, Moody’s and Fitch
Ratings) have developed infrastructures and have invested significant resources to evaluate firms’
governance structures. These actions clearly signal that governance is important to the credit rating
process.
VI.3 Sensitivity Tests
In our original model, we use total audit fees paid to a firm’s auditor to proxy for the economic bond
between the auditor and client, which potentially threatens auditor independence. Contemporaneous
literature investigating the quality of accounting information in the presence of threats to auditor
independence uses alternative measures of economic bonding (e.g., Frankel, et al., 2002; Ashbaugh, et al.,
2003). To test the robustness of our results related to the quality of the audit function in governance, we
substitute two alternative proxies of economic bonding for the TOTFEE variable in the full model (not
tabled). The first substitution uses the ratio of non-audit fees to total fees (FEERATIO) for TOTFEE.
The second substitution is a dummy variable coded one if TOTFEE is in the upper quartile of the
distribution of TOTFEE and zero otherwise (FEEDUMMY). We expect observations falling into the
upper quartile of TOTFEE to be firms where auditor independence is more likely to be threatened. The
coefficients on FEERATIO and FEEDUMMY are insignificant at conventional levels. Thus, we continue
to find no evidence that measures of economic bonding between the auditor and client firm adversely
affects credit ratings.
Our second set of sensitivity tests relate to our proxy for transparent and timely financial reporting.
Recall that TIMELINESS is defined as negative one times the squared residual from a cross-sectional
regression of returns on the levels and changes in earnings. We substitute two alternative measures of
TIMELINESS in our full model. The first substitution defines TIMELINESS as negative one times the
variance of the residuals from firm-specific time-series regressions, where we require firms to have a

40
minimum (maximum) of eight (ten) years of data to estimate equation (2). The coefficient on this
specification of TIMELINESS is positive and significant at the .001 level or better.
Gelb and Zarowin (2002) provide an alternative specification of the relation between returns and
earnings. Specifically, they posit and provide evidence that current price is reflective of the
informativeness of future earnings. Thus, our second substitution for TIMELINESS is the negative
squared residual from the regression of returns on contemporaneous and future earnings and earnings
changes after controlling for future returns. Once again, the coefficient on this specification of
TIMELINESS is positive and significant at the .001 level or better.
We use the %BRD_EXPERT, the percentage of outside directors that sit on other boards, as a
measure of board competency or expertise following Klein (1998). However, there is evidence in the
literature that when board members sit on too many boards monitoring of management is compromised
and, as a consequence, firm performance deteriorates (Bhagat and Black, 1999; Klein, 1998). As an
additional sensitivity test (not tabled), we include a variable for the percentage of board members that sit
on four or more boards. We find no evidence that board members being “too busy” adversely affects
credit ratings, and adding this variable does not detract from the significance of our %BRD_EXPERT
variable.
The results of these sensitivity tests indicate that our inferences are robust to alternative measures of
governance attributes.
VII. Summary and Conclusions
Weak corporate governance has been singled out as the leading cause for recent high-profile cases of
corporate fraud. Using a framework for evaluating corporate governance structures recently developed by
Standard & Poor’s, this study investigates whether firms that exhibit strong governance benefit from
higher overall firm credit ratings relative to firms with weak governance. We present compelling
evidence that a variety of governance mechanisms do help explain firm credit ratings after controlling for
firm characteristics that prior research has shown to be related to debt ratings. Specifically, we find that
firm credit ratings are: (1) negatively associated with the number of blockholders that own at least a 5%

41
ownership in the firm; (2) positively related to weaker shareholder rights in terms of takeover defenses;
(3) positively related to the degree of financial transparency; and (4) positively related to over-all board
independence, board stock ownership and board expertise and negatively related to CEO power on the
board. We show that a hypothetical firm that possesses desirable governance characteristics from the
bondholder’s viewpoint approximately doubles its likelihood of receiving an investment grade credit
rating. Given the spread between investment grade and speculative grade bond yields, better governance
can translate into significant debt costs savings for firms.
Our primary analysis documents that firms’ governance affects firms’ credit ratings. Our secondary
analysis provides insights into why all firms do not possess strong governance. We note that the cost of
weak governance is borne by all stakeholders whereas the benefits of weak governance can accrue to
managers when they can appropriate some or all of the rents from outside stakeholders by resisting better
governance. We report compelling evidence that suggests that CEOs of weak governance firms can
garner overcompensation in excess of their share of debt costs due to weak governance. Thus, we provide
one explanation for why all firms do not practice good governance.
A number of organizations and companies (Standard & Poor’s, Board Analyst, The Board Institute,
Moody’s Investor Services, and FitchRatings) have begun to compile company ratings of corporate
governance practices along several dimensions. Investigating whether these composite ratings are useful
determinants of credit ratings is one avenue of future research. Another avenue of future research is to
focus on the benefits of governance to equity stakeholders by investigating the relation between
governance and firms’ cost of capital.

42
References
Aboody, D. M. Barth and R. Kasznik. 2004. “Do Firms Manage Stock-Based Compensation Expense Disclosed Under SFAS 123?” working paper, University of California at Los Angeles and Stanford University. Agrawal, A. and S. Chadha. 2003. “Corporate Governance and Accounting Scandals,” Working paper, University of Alabama. Agrawal, A. and C. Knoeber. 1996. “Firm Performance and Mechanisms to Control Agency Problems between Managers and Shareholders,” Journal of Financial and Quantitative Analysis 31: 377-397. Agresti, A. 2002. Categorical Data Analysis, John Wiley and Sons, New York. Ashbaugh, H., R. LaFond and B. Mayhew. 2003. “Do Nonaudit Services Compromise Auditor Independence? Further Evidence,” Accounting Review 78: 611-640. Asquith, P. and T. Wizman. 1990. “Event Risk, Covenants, and Bondholder Returns in Leveraged Buyouts,” Journal of Financial Economics 27: 195-213. Barth, M. and W. Landsman. 2003. “Cost of Capital and the Quality of Financial Statement Information,” Working paper, Stanford University. Baysinger, B. and H. Butler. 1985. “Corporate Governance and the Board of Directors: Performance Effects of Changes in Board Composition,” Journal of Law, Economics and Organizations 1: 101-124. Bhagat, S. and B. Black. 1999. “The Uncertain Relationship Between Board Composition and Firm Performance,” Business Lawyer 54: 921-963. Bhagat, S. and B. Black. 2000. “Board Independence and Long-Term Performance,” Working paper, Stanford Law School, Stanford, CA. Bhojraj, S. and P. Sengupta. 2003. “Effect of Corporate Governance on Bond Ratings and Yields: The Role of Institutional Investors and the Outside Directors,” The Journal of Business 76: 455-475. Bushman, R., Q. Chen, E. Engel and A. Smith. 2004. “Financial Accounting Information, Organizational Complexity and Corporate Governance Systems,” Journal of Accounting & Economics, forthcoming. Boardman, C. and R. McEnally. 1981. “Factors Affecting Seasoned Corporate Bond Prices,” Journal of Financial and Quantitative Analysis 16: 207-216. Chung, H., and S. Kallapur. 2003. “Client Importance, Nonaudit Services, and Abnormal Accruals,” Accounting Review 78: 931-955. Core, J., R. Holthausen and D. Larcker. 1999. “Corporate Governance, Chief Executive Officer Compensation, and Firm Performance,” Journal of Financial Economics 51: 371-406.

43
Dann, L. and H. DeAngelo. 1983. “Standstill Agreements, Privately Negotiated Stock Repurchases, and the Market for Corporate Control,” Journal of Financial Economics 11: 275-300. Davidson, W., B. Xie and W. Xu. 2004. “Market Reaction to Voluntary Announcements of Audit Committee Appointments: The Effect of Financial Expertise,” Journal of Accounting & Public Policy 23: 279-293. DeAngelo, L. 1981. “Auditor Size and Audit Quality,” Journal of Accounting & Economics 3: 183-200. Dechow, P. and I. Dichev. 2002. “The Quality of Accruals and Earnings: The Role of Accrual Estimation Errors,” Accounting Review 77: 35-59. DeFond, M., R. Hann and X Hu. 2004. “Does the Market Value Financial Expertise on the Audit Committee of Boards of Directors?” forthcoming, Journal of Accounting Research (Supplement). DeFond, M., K. Raghunandan and K.R. Subramanyam. 2002. “Do Non-Audit Service Fees Impair Auditor Independence? Evidence from Going Concern Audit Opinions,” Journal of Accounting Research 40: 1247-1274. FitchRatings, 2004. Credit Policy Special Report, “Evaluating Corporate Governance: The Bondholders’ Perspective”, New York. Frankel, R., M. Johnson and K. Nelson. 2002. “The Relation Between Auditors’ Fees for Nonaudit Services and Earnings Management,” Accounting Review 77: 71-105. Gelb, D. and P. Zarowin. 2002. “Corporate Disclosure Policy and the Informativeness of Stock Prices,” Review of Accounting Studies 7: 33-52. Gompers, P. J Ishii and A. Metrick. 2003. “Corporate Governance and Equity Prices,” Quarterly Journal of Economics 118: 107-155. Gordon, L. and J. Pound. 1993. “Information, Ownership Structure, and Shareholder Voting: Evidence from Shareholder-Sponsored Corporate Governance Proposal,” Journal of Finance 48: 697-718. Grinblatt, M. and S. Titman. 2002. Financial Markets and Corporate Strategy, McGraw-Hill Irwin, 2nd Edition. Gu, Z. 2002. “Cross-Sample Incomparability of R2s and Additional Evidence on Value Relevance Changes Over Time,” Working paper, Carnegie Mellon University. Hermalin, B. and M. Weisbach. 1991. “The Effect of Board Composition and Direct Incentives on Firm Performance,” Financial Management 21(4): 101-112. Hermalin, B. and M. Weisbach. 2003. “Boards of Directors as an Endogenously Determined Institution: A Survey of the Economic Literature,” Economic Policy Review 9: 7-26 Horrigan, J. 1966. “The Determinants of Long-Term Credit standing with Financial Ratios,” Journal of Accounting Research 4: 44-62.

44
Imhoff, E. A. 2003. “Accounting Quality, Auditing, and Corporate Governance,” Accounting Horizons Supplement 17: 117-128. Jensen, M. 1993. “The Modern Industrial Revolution, Exit, and the Failure of Internal Control Systems,” Journal of Finance 48: 831-880. Jensen, M. and W. Meckling. 1976. “Theory of the Firm: Managerial Behavior, Agency Costs and Ownership Structure,” Journal of Financial Economics 3: 305-360. Kaplan, R., and G. Urwitz. 1979. “Statistical Models of Bond Ratings: A Methodological Inquiry,” Journal of Business 52: 231-261. Karpoff, J., P. Malatesta, and R. Walkling. 1996. “Corporate Governance and Shareholder Initiatives: Empirical Evidence,” Journal of Financial Economics 42: 365-395. Klein, A. 1998. “Firm Performance and Board Committee Structure,” Journal of Law and Economics 41: 275-303. Klein, A. 2002. “Audit Committee, Board of Director Characteristics, and Earnings Management,” Journal of Accounting & Economics 33: 375-400.
Klein, A. 2003. “Do Audit Committees with Financially Literate Directors Experience Less Earnings Management,” Working paper, Stern School of Business, New York University. Klock, M., S. Mansi and W. Maxwell, 2004. “Corporte Governance and the Agency Cost of Debt,” Working paper, George Washington University. Lamy, R., and R. Thompson. 1988. “Risk Premia and the Pricing of Primary Issue Bonds,” Journal of Banking and Finance 12: 585-601. McConnell, J. and H. Serves. 1990. “Additional Evidence on Equity Ownership and Corporate Value,” Journal of Financial Economics 27: 595-612. Nesbitt, S. 1994. “Long-Term Rewards from Shareholder Activism: A Study of the ‘CalPERS’ Effect,” Journal of Applied Corporate Finance 6: 75-80. Opler, T. and J. Sokobin. 1997. “Does Coordinated Institutional Activism Work? An Analysis of the Activities of the Council of Institutional Investors,” Working paper, Ohio State University. Securities and Exchange Commission. 2003. NASD and NYSE Rulemaking: Relating to Corporate Governance. Release No. 34-48745. Washington, D. C.: Government Printing Office. Sengupta, P. 1998. “Corporate Disclosure Quality and the Cost of Debt,” Accounting Review 73: 459-474. Shleifer, A. and R. Vishny. 1997. “A Survey of Corporate Governance,” Journal of Finance 52: 737-783. Standard & Poor’s. 2002. “Standard & Poor’s Corporate Governance Scores: Criteria, Methodology and Definitions”, New York. McGraw-Hill Companies, Inc.

45
U.S. Census Bureau. 2005 Statistical Abstract of the United States: 2004-2005. Section 25 Banking, Finance and Insurance. U.S. Congress. 2002. The Sarbanes-Oxley Act of 2002. 107th Congress of the United States of America. H.R. 3763. Washington, D.C.: Government Printing Office. Warga, A. and I. Welch. 1993. “Bondholder Losses in Leveraged Buyouts,” Review of Financial Studies 6: 959-982. Yermack, D. 1996. “Higher Market Valuation of Companies with a Small Board of Directors,” Journal of Financial Economics 40: 185-211. Yermack, D. 2003. “Remuneration, Retention, and Reputation Incentives for Outside Directors,” forthcoming, Journal of Finance. Ziebart, D., and S. Reiter. 1992. “Bond Ratings, Bond Yields and Financial Information,” Contemporary Accounting Research 9: 252-282.
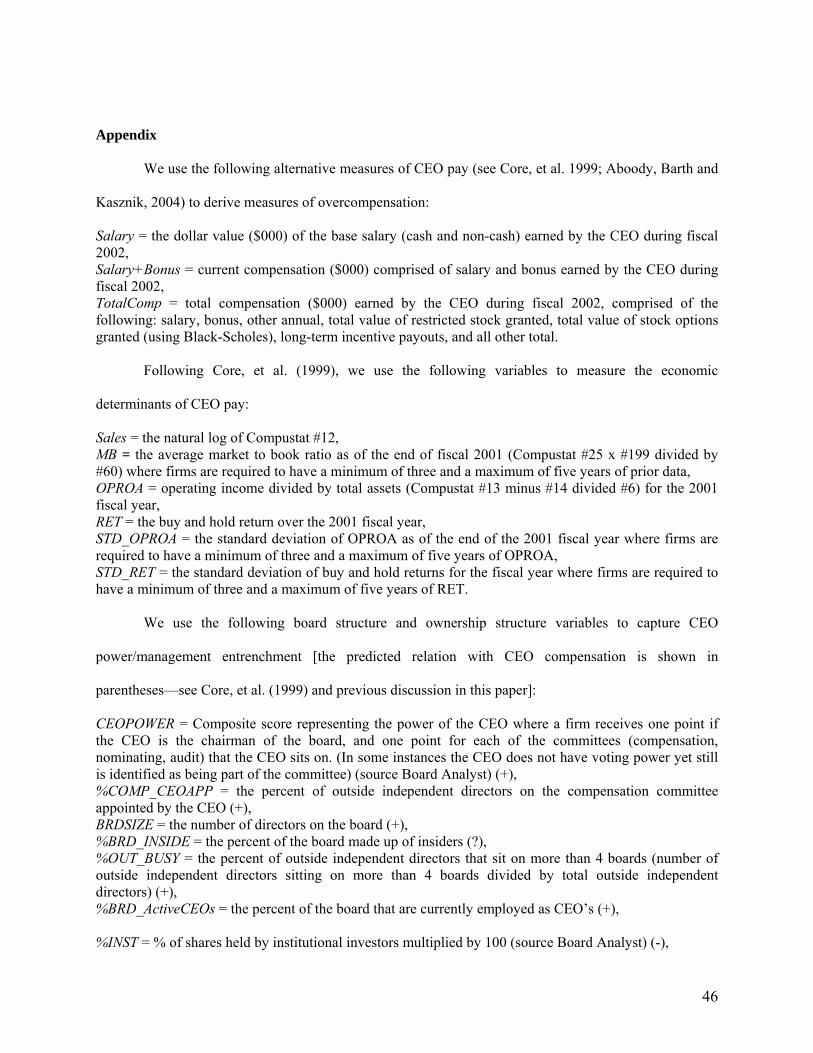
46
Appendix
We use the following alternative measures of CEO pay (see Core, et al. 1999; Aboody, Barth and
Kasznik, 2004) to derive measures of overcompensation:
Salary = the dollar value ($000) of the base salary (cash and non-cash) earned by the CEO during fiscal 2002, Salary+Bonus = current compensation ($000) comprised of salary and bonus earned by the CEO during fiscal 2002, TotalComp = total compensation ($000) earned by the CEO during fiscal 2002, comprised of the following: salary, bonus, other annual, total value of restricted stock granted, total value of stock options granted (using Black-Scholes), long-term incentive payouts, and all other total.
Following Core, et al. (1999), we use the following variables to measure the economic
determinants of CEO pay:
Sales = the natural log of Compustat #12, MB = the average market to book ratio as of the end of fiscal 2001 (Compustat #25 x #199 divided by #60) where firms are required to have a minimum of three and a maximum of five years of prior data, OPROA = operating income divided by total assets (Compustat #13 minus #14 divided #6) for the 2001 fiscal year, RET = the buy and hold return over the 2001 fiscal year, STD_OPROA = the standard deviation of OPROA as of the end of the 2001 fiscal year where firms are required to have a minimum of three and a maximum of five years of OPROA, STD_RET = the standard deviation of buy and hold returns for the fiscal year where firms are required to have a minimum of three and a maximum of five years of RET.
We use the following board structure and ownership structure variables to capture CEO
power/management entrenchment [the predicted relation with CEO compensation is shown in
parentheses—see Core, et al. (1999) and previous discussion in this paper]:
CEOPOWER = Composite score representing the power of the CEO where a firm receives one point if the CEO is the chairman of the board, and one point for each of the committees (compensation, nominating, audit) that the CEO sits on. (In some instances the CEO does not have voting power yet still is identified as being part of the committee) (source Board Analyst) (+), %COMP_CEOAPP = the percent of outside independent directors on the compensation committee appointed by the CEO (+), BRDSIZE = the number of directors on the board (+), %BRD_INSIDE = the percent of the board made up of insiders (?), %OUT_BUSY = the percent of outside independent directors that sit on more than 4 boards (number of outside independent directors sitting on more than 4 boards divided by total outside independent directors) (+), %BRD_ActiveCEOs = the percent of the board that are currently employed as CEO’s (+), %INST = % of shares held by institutional investors multiplied by 100 (source Board Analyst) (-),

47
BLOCK = Number of block holders, where block is defined at the 5% ownership level (source Compact Disclosure) (-), IND_DUM = industry dummies based on firms’ two digit SIC codes and are included for each two-digit SIC group having at least 10 observations, for a total of 23 industry dummies.
The following cross-sectional OLS model is used to estimate the determinants of CEO
compensation using fiscal year 2002 data for our sample firms:
)1(%_
_%_%_%
_%__
__
151413
1211109
8765
4321
23
10
ABLOCKbINSTbOwnershipCEOb
ActiveCEOsBRDbBUSYOUTbINSIDEBRDbBRDSIZEb
CEOAPPCOMPbCEOPOWERbRETSTDbOPROASTDb
RETbOPROAbMBbSalesbDUMINDbCOMPCEO
iiii
iiii
iiii
iiiin
niIi
ε++++
++++
++++
++++∑==
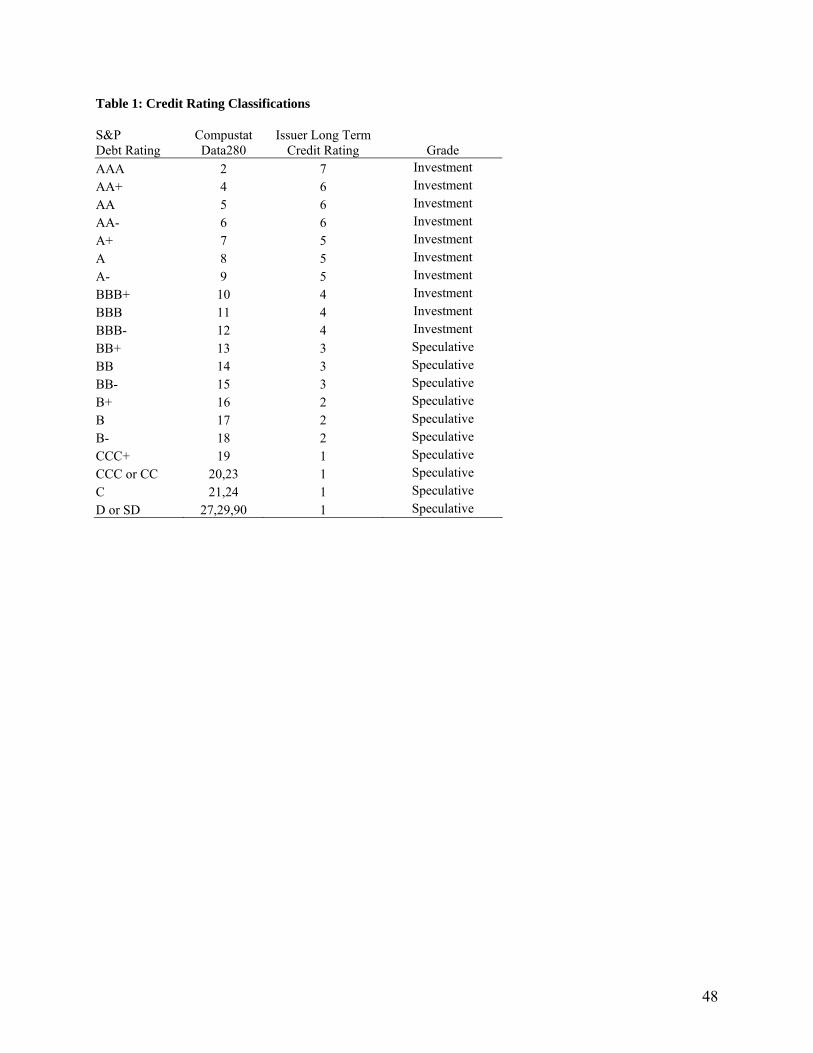
48
Table 1: Credit Rating Classifications
S&P Debt Rating
Compustat Data280
Issuer Long Term Credit Rating
Grade
AAA 2 7 Investment AA+ 4 6 Investment AA 5 6 Investment AA- 6 6 Investment A+ 7 5 Investment A 8 5 Investment A- 9 5 Investment BBB+ 10 4 Investment BBB 11 4 Investment BBB- 12 4 Investment BB+ 13 3 Speculative BB 14 3 Speculative BB- 15 3 Speculative B+ 16 2 Speculative B 17 2 Speculative B- 18 2 Speculative CCC+ 19 1 Speculative CCC or CC 20,23 1 Speculative C 21,24 1 Speculative D or SD 27,29,90 1 Speculative

49
Table 2 Sample Details
Panel A: Sample Construction (fiscal year 2002)
Number Firms of Firms Lost Number of firms in the main Board Analyst Data Set 2050 0
Number of firms having complete governance data from Board Analyst 1867 183
Number of firms having necessary Compustat data for ratings model 1693 174
Number of firms having g-scores 1392 301
Number of firms having credit ratings on Compustat 894 498
Panel B: Sample Firms’ Board Composition
Breakdown of Inside, Outside And Affiliate Directors by Board and by Committees for Sample Firms in Fiscal Year 2002
Board Audit
Committee Compensation
Committee Nominating Committee
Finance Committee
Number of firms having a board (committee) 894 894 890 813 242 Average number of directors on board (committee) 10.05 3.93 3.72 3.97 4.31 Average number of insider directors on board (committee) 1.67 0.01 0.02 0.06 0.39 Average number of outside directors on board (committee) 7.02 3.63 3.37 3.46 3.42 Number of firms having at least one insider on the board (committee) 885 6 17 42 73 Number of firms having the CEO as chairman of the board (committee) 652 3 10 31 65
Notes: This table presents the sample selection and data requirements. Panel B presents the size of the board and committees for the sample of firms for which the specific committee exists. The difference between the average number of directors on the board (committee) and number of insiders and outsiders on the board (committee) is due to affiliated directors.

50
Table 3 Variable Definitions
Variables
Predicted Sign
Definitions and Data Source
Ownership Structure and Influence:
BLOCK ? Number of block holders, where block is defined at the 5% ownership level (source Compact Disclosure)
%INST ? % of shares held by institutional investors (source Board Analyst) %INSIDE − % of shares held by insiders (officers and directors) (source Board Analyst) Financial Stakeholder Rights & Relations:
G_SCORE ? Shareholder rights governance score (source Gompers, Ishii and Metrick 2003) Financial Transparency: WCAQ
+
Negative one times the standard deviation of the firm-specific residual from the prior three to five years, where residuals are from the following cross sectional estimations of Dechow and Dichev’s (2002) model:
εββββ ++++= +− 132110 tttt CFOCFOCFOWCA where regressions are estimated by three, two, or one-digit SIC codes conditional on having at least 10 firms in each SIC group. WCA=working capital accruals (-(Compustat # 302+ Compustat # 303+ Compustat # 304+ Compustat # 305+ Compustat # 307)); CFO= cash flow from operations (Compustat # 308); all variables are scaled by average total assets (Compustat # 6)
TIMELINESS
+
Negative one times the squared residual from the following regression εβββββ +∆++++= NIBELOSSNIBELOSSNIBEET 43210 *R
where the regression is estimated by three, two, or one-digit SIC codes conditional on having at least 10 firms in each SIC group. RET= the market adjusted return over the fiscal year (from CRSP); NIBE= net income before extraordinary items (Compustat # 18) scaled by beginning of period market value of equity (Compustat # 25* Compustat # 199); LOSS= one if NIBE is negative, zero otherwise; ∆NIBE= the change in net income before extraordinary items (Compustat # 18) scaled by beginning of period market value of equity (Compustat # 18* Compustat # 199)
TOTFEES −
Total fees paid by the firm to its auditor divided by total revenues of the audit firm multiplied by 100 (source firms’ proxy statements, Accounting Today Top 100 firms and D&B’s Million Dollar Database)
%AUD_IND + % of audit committee made up of independent directors (source Board Analyst). FIN_EXPERT
+ One if the firm has an independent financial expert on the audit committee, where financial expert is defined as an audit committee member being a CFO or having a CPA, zero otherwise (source Board Analyst)

51
Board Structure and Processes: %BRD_IND + % of independent directors on the board (source Board Analyst) CEOPOWER
− Composite score representing the power of the CEO where a firm receives one point if the CEO is the chairman of the board, and one point for each committee (compensation, nominating, audit) that the CEO sits on (source Board Analyst)
%BRD_EXPERT + % of independent directors that hold seats on other firms’ boards (source Board Analyst)
%BRD_STOCK + % of directors that own stock in the firm (source Board Analyst) GOVERNANCE_POLICY + One if the firm has a formal governance policy, zero otherwise (source Board
Analyst) %FINCOM_INSIDE + % of insiders on the finance committee (source proxy statement) %NOM_IND + % of independent directors on the nominating committee (source Board Analyst) %COMP_IND + % of independent directors on the compensation committee (source Board
Analyst) Firm Characteristics: LEV − Total debt (Compustat #9 plus Compustat #34) divided by total assets (Compustat
#6). ROA + Net income before extraordinary items (Compustat #18) divided by total assets LOSS − One if the net income before extraordinary items is negative in the current and
prior fiscal year, zero otherwise INT_COV + Operating income before depreciation (Compustat #13) divided by interest
expense (Compustat #15) or (Compustat #339) SIZE + Natural log of total assets SUBORD − One if the firm has subordinated debt, zero otherwise CAP_INTEN + Gross PPE (Compustat #7) divided by total assets FIN_UTILITY + One if firm is a financial institution (one-digit SIC code 6) or a utility (two-digit
SIC code 49), zero otherwise

52
Table 4 Summary Statistics on Credit Rating Variables
Variables Mean Standard Deviation Median 25% 75%
Ownership Structure and Influence: BLOCK 4.46 2.80 4.00 2.00 6.00 %INST 0.63 0.24 0.68 0.51 0.80 %INSIDE 0.08 0.11 0.04 0.02 0.08 Financial Stakeholder Rights& Relations: G_SCORE 9.59 2.59 10.00 8.00 11.00
Financial Transparency: WCAQ -0.04 0.03 -0.03 -0.05 -0.02 TIMELINESS -0.10 0.17 -0.03 -0.10 -0.01 TOTFEES 0.11 0.22 0.04 0.02 0.10 %AUD_IND 0.92 0.16 1.00 1.00 1.00 FIN_EXPERT 0.26 0.44 0.00 0.00 1.00 Board Structure and Processes: %BRD_IND 0.70 0.16 0.73 0.58 0.83 CEOPOWER 0.78 0.50 1.00 0.00 1.00 %BRD_EXPERT 0.36 0.22 0.36 0.20 0.50 %BRD_STOCK 0.87 0.20 0.92 0.82 1.00 GOVERNANCE_POLICY 0.42 0.49 0.00 0.00 1.00 %FINCOM_INSIDE 0.15 0.12 0.13 0.08 0.22 %NOM_IND 0.79 0.32 1.00 0.67 1.00 %COMP_IND 0.90 0.20 1.00 0.83 1.00 Firm Characteristics: LEV 0.31 0.17 0.30 0.19 0.41 ROA 0.02 0.08 0.03 0.01 0.06 LOSS 0.13 0.34 0.00 0.00 0.00 INT_COV 10.78 18.77 5.16 2.79 10.23 SIZE 8.46 1.49 8.20 7.38 9.44 SUBORD 0.18 0.39 0.00 0.00 0.00 CAP_INTEN 0.54 0.40 0.48 0.19 0.84 FIN_UTILITY 0.23 0.42 0.00 0.00 0.00 RATING 3.83 1.11 4.00 3.00 5.00 INVESTMENT_GRADE 0.63 0.48 1.00 0.00 1.00
Notes: RATING= S&P LT Domestic Issuer Credit Rating (Compustat #280), see Table 1 for numeric coding; INVESTMENT_GRADE= 1 if a firm’s credit rating is investment grade as noted in Table 1, zero otherwise. See Table 3 for other variable definitions.

53
Table 5 Correlations
Panel A: Firm Characteristics
RATING LEV ROA LOSS INT_COV SIZE SUBORD CAP_ INTEN
FIN_ UTILITY
RATING -0.28 0.44 -0.42 0.27 0.50 -0.19 -0.03 0.24 LEV -0.26 -0.22 0.21 -0.42 -0.03 0.21 0.28 -0.03 ROA 0.39 -0.23 -0.60 0.34 0.06 -0.04 -0.01 0.00 LOSS -0.41 0.17 -0.55 -0.18 -0.16 0.01 0.06 -0.18 INT_COV 0.45 -0.52 0.72 -0.42 -0.02 -0.14 -0.07 -0.13 SIZE 0.51 -0.06 -0.09 -0.15 -0.04 -0.02 -0.20 0.41 SUBORD -0.21 0.19 -0.13 0.01 -0.19 -0.06 -0.09 -0.04 CAP_INTEN -0.04 0.33 0.01 0.08 0.03 -0.19 -0.10 -0.18 FIN_UTILITY 0.26 -0.03 -0.16 -0.18 -0.23 0.39 -0.04 -0.23
Notes: Bold text indicates significance at the 0.01 level or better.

54
Panel B: Governance Variables
A B C D E F G H I J K L M N O P Q R RATING A -0.36 0.11 -0.16 0.19 0.30 0.38 0.26 0.03 0.06 0.18 0.16 0.11 0.07 0.31 0.25 0.26 -0.10 BLOCK B -0.39 0.22 0.14 -0.05 -0.18 -0.09 -0.20 -0.01 0.02 -0.05 -0.06 -0.01 -0.06 -0.06 -0.12 -0.10 0.04 %INST C 0.01 0.35 -0.18 0.13 -0.08 0.07 0.02 0.06 0.08 0.18 0.21 0.12 -0.02 0.19 0.04 0.14 -0.04 %INSIDE D -0.33 0.29 -0.08 -0.23 -0.10 -0.04 -0.15 -0.04 -0.12 -0.39 -0.31 -0.21 -0.06 -0.24 -0.13 -0.15 0.19 G_SCORE E 0.21 -0.06 0.09 -0.18 0.10 0.14 -0.07 0.09 0.09 0.27 0.25 0.18 0.05 0.20 0.23 0.12 -0.20 WCAQ F 0.32 -0.23 -0.18 -0.22 0.07 0.16 0.09 -0.01 0.07 0.08 0.02 0.07 0.02 0.07 0.17 0.07 -0.04 TIMELINESS G 0.28 -0.11 0.02 -0.06 0.06 0.16 0.02 -0.04 0.03 0.02 0.02 0.07 0.08 0.04 0.13 0.10 0.01 TOTFEES H 0.25 -0.15 0.05 -0.29 0.04 0.03 -0.01 -0.06 0.06 0.09 0.07 0.05 0.07 0.28 0.06 0.20 -0.05 FIN_EXPERT I 0.04 -0.01 0.05 -0.05 0.10 -0.01 -0.04 -0.02 0.09 0.10 0.14 0.09 0.01 0.05 0.01 0.04 -0.05 %AUD_IND J 0.03 0.04 0.08 -0.11 0.07 0.00 0.04 0.05 0.09 0.51 0.38 0.41 0.04 0.27 0.06 0.09 -0.12 %BRD_IND K 0.19 -0.04 0.15 -0.38 0.27 0.06 0.05 0.13 0.10 0.46 0.56 0.55 0.13 0.54 0.16 0.23 -0.49 %NOM_IND L 0.14 -0.04 0.18 -0.23 0.20 0.04 0.01 0.06 0.13 0.42 0.55 0.44 0.02 0.36 0.17 0.24 -0.26 %COMP_IND M 0.10 0.00 0.10 -0.18 0.16 0.03 0.06 0.06 0.10 0.43 0.51 0.50 0.00 0.31 0.09 0.14 -0.14 CEOPOWER N 0.07 -0.06 -0.01 -0.12 0.06 0.02 0.06 0.09 0.01 0.05 0.16 0.01 0.02 0.12 0.07 0.06 -0.09 %BRD_EXPERT 0 0.31 -0.05 0.17 -0.35 0.21 0.01 0.03 0.35 0.05 0.27 0.54 0.36 0.31 0.13 0.14 0.33 -0.33 %BRD_STOCK P 0.28 -0.16 -0.02 -0.19 0.28 0.19 0.05 0.13 -0.01 0.08 0.24 0.19 0.15 0.10 0.22 0.15 -0.09 GOVERNANCE POLICY Q 0.25 -0.10 0.11 -0.21 0.12 0.05 0.07 0.21 0.04 0.08 0.22 0.21 0.14 0.08 0.33 0.18 -0.23 %FINCOM_INSIDE R -0.15 0.05 -0.01 0.24 -0.22 -0.06 -0.02 -0.16 -0.06 -0.11 -0.49 -0.18 -0.14 -0.07 -0.35 -0.18 -0.23 Notes: Bold text indicates significance at the 0.01 level. RATING= S&P LT Domestic Issuer Credit Rating (Compustat #280), see Table 1 for numeric coding. See Table 3 for other variable definitions.

Table 6 Logistic Regression Results of the Effects of Corporate Governance Attributes on Firms’ Credit Ratings (Dependent Variable = RATING)
Estimated Coefficient Variables
Predicted Sign
Model 1 Model 2 Model 3 Model 4 Model 5 Model 6 Firm Characteristics LEV − -2.223*** -2.018*** -2.222*** -2.302*** -2.133*** -2.014*** ROA + 0.108*** 0.112*** 0.107*** 0.098*** 0.103*** 0.094*** LOSS − -1.073*** -1.018*** -1.019*** -1.000*** -1.159*** -0.986*** INT_COV + 0.015*** 0.013*** 0.016*** 0.016*** 0.016*** 0.017*** SIZE + 0.869*** 0.777*** 0.867*** 0.805*** 0.778*** 0.643*** SUBORD − -0.744*** -0.654*** -0.684*** -0.747*** -0.673*** -0.604*** CAP_INTEN + 0.863*** 0.811*** 0.825*** 0.712*** 0.738*** 0.538*** FIN_UTILITY + 0.436*** 0.312** 0.438*** 0.259* 0.501*** 0.214 Governance Attributes Ownership Structure and Influence BLOCK ? -0.162*** -0.165*** %INST ? 0.594** 0.390 %INSIDE − -0.778* 0.442 Financial Stakeholder Rights & Relations
G_SCORE ? 0.094*** 0.037* Financial Transparency WCAQ + 6.911*** 7.372*** TIMELINESS + 3.571*** 3.463*** TOTFEES − 0.495 0.340 %AUD_IND + 0.801** -0.036 FIN_EXPERT + 0.203* 0.126 Board Structure and Processes %BRD_IND + 1.041** 0.950* CEOPOWER − -0.098 -0.177* %BRD_EXPERT + 0.794** 1.003*** %BRD_STOCK + 1.385*** 1.109*** GOVERNANCE_POLICY + 0.235** 0.179 %FINCOM_INSIDE + 0.449 0.317 Generalized R-square 0.52 0.54 0.53 0.56 0.54 0.60 Likelihood ratio χ2 660.55*** 701.67*** 673.95*** 738.46*** 702.51*** 811.55*** Wald χ2 39.64*** 13.47*** 77.16*** 42.66*** 139.93*** Sample Size 894 894 894 894 894 894 Notes: Tabled values are coefficient estimates from the following ordered logit models: Model 1 RATING = f(Firm Characteristics) Model 2 RATING = f(Firm Characteristics, Ownership Structure and Influence) Model 3 RATING = f(Firm Characteristics, Financial Stakeholder Rights & Relations) Model 4 RATING = f(Firm Characteristics, Financial Transparency) Model 5 RATING = f(Firm Characteristics, Board Structure and Processes)

56
Model 6 RATING = f(Firm Characteristics, Governance Attributes) ***,**,* indicates significance at the 0.01, 0.05, and 0.10 level or better, respectively. The Wald χ2 statistic tests whether the governance attributes added in each model as a whole explain a significant portion of the variation in firms’ credit ratings. RATING= S&P Long Term Domestic Issuer Credit Rating (Compustat #280), see Table 1 for numeric coding. See Table 3 for other variable definitions.

57
Table 7 Logistic Regression Results of the Effects of Corporate Governance Mechanisms on Firms’ Credit Ratings (Dependent Variable = INVESTMENT_GRADE)
Estimated Coefficient Variables
Predicted Sign
Model 1 Model 2 Model 3 Model 4 Model 5 Model 6 Firm Characteristics: INTERCEPT ? -8.321*** -6.635*** -9.540*** -7.418*** -10.202** -7.125*** LEV − -3.450*** -3.262*** -3.385*** -3.864*** -3.533*** -3.545*** ROA + 0.142*** 0.145*** 0.137*** 0.132*** 0.137*** 0.130*** LOSS - -1.400*** -1.263*** -1.346*** -1.240*** -1.507*** -1.111*** INT_COV + 0.006 0.005 0.010 0.004 0.007 0.007 SIZE + 1.104*** 0.990*** 1.080*** 1.048*** 1.066*** 0.913*** SUBORD − -1.473*** -1.445*** -1.385*** -1.501*** -1.412*** -1.416*** CAP_INTEN + 1.353*** 1.253*** 1.267*** 1.150*** 1.286*** 0.925*** FIN_UTILITY + 0.592** 0.393* 0.599** 0.441* 0.488** 0.194 Governance Attributes Ownership Structure and Influence BLOCK ? -0.219*** -0.226*** %INST ? 0.680* 0.583 %INSIDE − -1.324* -0.207 Financial Stakeholder Rights & Relations
G_SCORE ? 0.145*** 0.067* Financial Transparency WCAQ + 7.066** 6.995** TIMELINESS + 4.215*** 4.108*** TOTFEES − 0.661 0.110 %AUD_IND + 0.481 -0.434 FIN_EXPERT + 0.064 -0.004 Board Structure and Processes %BRD_IND + 1.270** 0.885 CEOPOWER − -0.086 -0.168 %BRD_EXPERT + 0.248 0.698 %BRD_STOCK + 1.540*** 1.320*** GOVERNANCE_POLICY + 0.182 0.066 %FINCOM_INSIDE + 0.026 -0.224 Generalized R-square 0.43 0.45 0.43 0.45 0.44 0.48 Likelihood ratio χ2 495.10*** 530.51*** 509.57*** 536.46*** 516.25*** 587.35*** Wald χ2 33.04*** 14.02*** 33.62*** 20.76*** 72.84*** Sample Size 894 894 894 894 894 894 Notes: Table values are coefficient estimates from the following logit models: Model 1 INVESTMENT_GRADE = f(Firm Characteristics) Model 2 INVESTMENT_GRADE = f(Firm Characteristics, Ownership Structure and Influence) Model 3 INVESTMENT_GRADE = f(Firm Characteristics, Financial Stakeholder Rights & Relations)

58
Model 4 INVESTMENT_GRADE = f(Firm Characteristics, Financial Transparency) Model 5 INVESTMENT_GRADE = f(Firm Characteristics, Board Structure and Processes) Model 6 INVESTMENT_GRADE = f(Firm Characteristics, Governance Attributes) ***,**,* indicates significance at the 0.01, 0.05, and 0.10 level or better, respectively. The Wald χ2 statistic tests whether the governance attributes added in each model as a whole explain a significant portion of the variation in firms’ investment grade ratings. INVESTMENT_GRADE= 1 if a firm’s credit rating is investment grade as noted in Table 1, zero otherwise. See Table 3 for other variable definitions.

59
Table 8 Assessment of Changes in Probabilities of Receiving an Investment Grade Credit Rating for Selected Changes in Governance Variable Values
Variables
Predicted Sign
Marginal Effect Standardized Variables
Change in Probability Q1 vs. Q3 Values
Governance Attributes Ownership Structure and Influence: BLOCK ? -0.136 -0.194 %INST ? 0.030 0.036 %INSIDE − -0.005 -0.003 Financial Stakeholder Rights & Relations: G_SCORE ? 0.037 0.043 Financial Transparency: WCAQ + 0.042 0.045 TIMELINESS + 0.152 0.081 TOTFEES − 0.005 0.002 %AUD_IND + -0.015 0.000 FIN_EXPERT + -0.001 -0.001 Board Structure and Processes: %BRD_IND + 0.031 0.048 CEOPOWER − -0.018 -0.036 %BRD_EXPERT + 0.033 0.045 %BRD_STOCK + 0.056 0.052 GOVERNANCE_POLICY + 0.014 0.014 %FINCOM_INSIDE + -0.006 -0.007
Notes: The Marginal Effects column shows the effects of receiving an investment grade credit rating due to a one unit change in the variable of interest after standardizing the independent variables. Marginal effects are computed as: )1()( '' XX eeX ββπ += where β’X is evaluated at the mean values of X. Tabled values in the Change in Probability column show the change in the probability of receiving an investment grade credit rating as a result of moving from the first to the third quartile value of the variable of interest, holding all other variables constant at their mean values. See Table 3 for variable definitions.
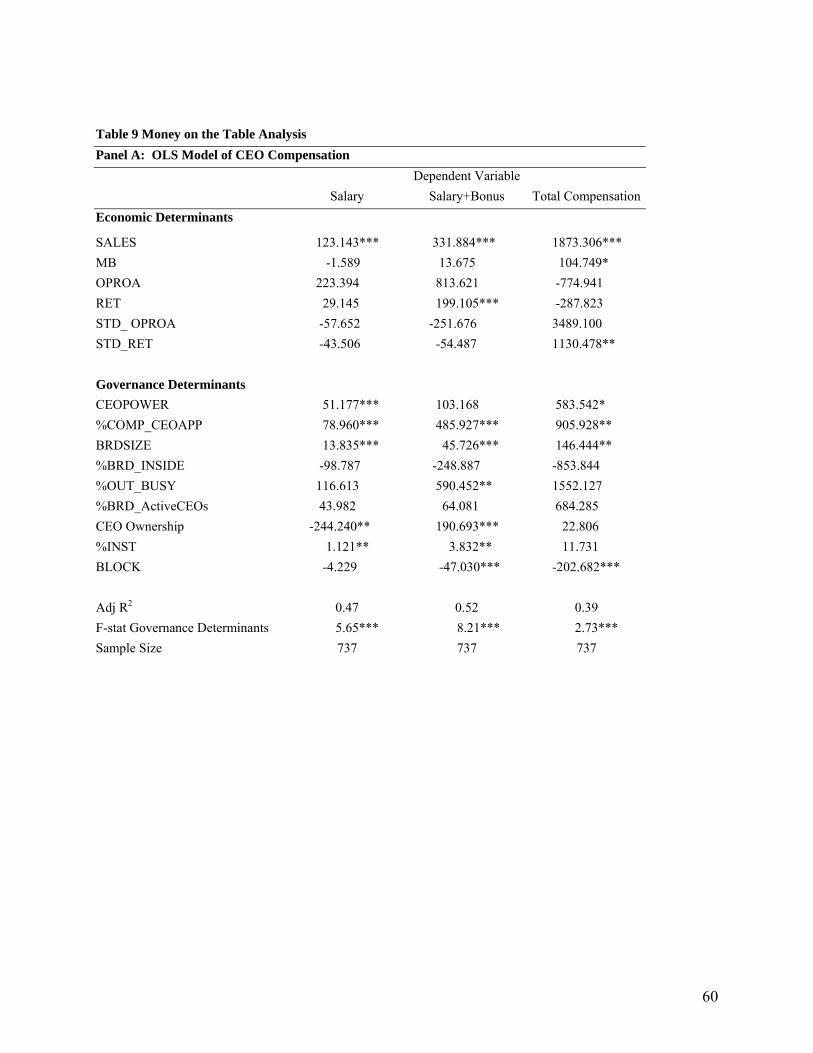
60
Table 9 Money on the Table Analysis Panel A: OLS Model of CEO Compensation Dependent Variable Salary Salary+Bonus Total Compensation Economic Determinants
SALES 123.143*** 331.884*** 1873.306*** MB -1.589 13.675 104.749* OPROA 223.394 813.621 -774.941 RET 29.145 199.105*** -287.823 STD_ OPROA -57.652 -251.676 3489.100 STD_RET -43.506 -54.487 1130.478**
Governance Determinants
CEOPOWER 51.177*** 103.168 583.542* %COMP_CEOAPP 78.960*** 485.927*** 905.928** BRDSIZE 13.835*** 45.726*** 146.444** %BRD_INSIDE -98.787 -248.887 -853.844 %OUT_BUSY 116.613 590.452** 1552.127 %BRD_ActiveCEOs 43.982 64.081 684.285 CEO Ownership -244.240** 190.693*** 22.806 %INST 1.121** 3.832** 11.731 BLOCK -4.229 -47.030*** -202.682***
Adj R2 0.47 0.52 0.39 F-stat Governance Determinants 5.65*** 8.21*** 2.73*** Sample Size 737 737 737

61
Table 9 continued Panel B: Estimates of Overcompensation by Grade Overcompensation estimates INVESTMENT_GRADE
n=492 SPECULATIVE_GRADE
n=245 P-value
(two-tailed)OC_ Salary % (mean) 0.349 0.391 0.00 OC_ Salary % (median) 0.327 0.355 0.01 OC Salary+Bonus %(mean) 0.535 0.600 0.00 OC Salary+Bonus %(median) 0.478 0.573 0.01 OC_ Total Comp %(mean) 0.561 0.592 0.24 OC_ Total Comp %(median) 0.509 0.608 0.26 Panel C: Overcompensation to Share of Interest Costs Ratio – Speculative Grade Firms (n=245) Non Investment Grade Firms (245) Q1 Median Q3
OC_ Salary/CEOSHARE_INTEXP 51.242 122.816 435.501 OC Salary+Bonus /CEOSHARE_INTEXP 133.467 334.230 1212.920 OC_ Total Comp /CEOSHARE_INTEXP 365.773 905.243 3180.150 Panel D: Test of Significance # firms where ratio is
less than or equal to 1
# firms where ratio is greater than 1
χ2
OC_ Salary/CEOSHARE_INTEXP 5 240 225.41*** OC Salary+Bonus /CEOSHARE_INTEXP 4 241 229.26*** OC_ Total Comp /CEOSHARE_INTEXP 4 241 229.26*** Notes: Panel presents the coefficient estimates for OLS regression, see Appendix. ***,**,* indicates significance at the 0.01, 0.05, and 0.10 level or better, respectively. Salary is equal to the dollar value in thousands of the base salary (cash and non-cash) earned by the CEO during fiscal 2002. Salary+Bonus is equal to the current compensation in thousands comprised of salary and bonus earned by the CEO during fiscal 2002. Total Compensation is equal to total compensation in thousands earned by the CEO during fiscal 2002, which is comprised of the following: salary, bonus, other annual pay, total value of restricted stock granted, total value of stock options granted (using Black-Scholes), long-term incentive payouts, and all other total pay. OC_ Salary % is defined as the dollar amount of Salary due to the governance determinants divided by salary; Salary+Bonus % is defined as the dollar amount of Salary+Bonus due to the governance determinants divided by Salary+Bonus; OC_ Total Comp % is defined as the dollar amount of Total Compensation due to the governance determinants divided by Total Compensation. INVESTMENT_GRADE and SPECULATIVE_GRADE are based on a firm’s credit rating as noted in Table 1. Median differences are assessed using the Wilcoxon rank sum test for differences in the distributions. All p-values are two sided. # For the purpose of this analysis the RATINGS groups are collapsed into five groups instead of the original seven used in the primary analysis due to the small number of firm having the necessary data for the compensation analysis in the lowest (n=2) and highest (n=8) debt ratings groups. To calculate the CEO’s portion of avoidable interest (CEOSHARE_INTEXP), we multiple 8% (spread between investment grade and non-investment grade debt) times 0.65 (tax benefit to debt) times the CEO’s ownership stake in the firm times the total debt outstanding. For CEO’s with zero ownership in the firm, we set the OC/ CEOSHARE_INTEXP to the sample median for the respective compensation figure. See Table 3 for other variable definitions.

62
Table 10 Relation between Future Performance, Credit Ratings and Overcompensation Panel A: Future performance and current credit rating (investment vs. non-investment grade)
Dependent variable Variables
Predicted Sign
NEXT YEAR’S ROA NEXT YEAR’S ROE Firm Characteristics: ROA + 0.436*** ROE + 0.470*** INVESTMENT GRADE ? 0.009*** 0.055*** Adjusted R-square 0.36 0.44 Sample Size 869 869 Panel B: Future performance and current period overcompensation
Dependent variable Variables
Predicted Sign
NEXT YEAR’S
ROA NEXT YEAR’S
ROA NEXT YEAR’S
ROA Firm Characteristics: ROA + 0.498*** 0.480*** 0.496*** OC_ Salary % − -0.021*** OC Salary+Bonus% − -0.024*** OC_ Total Comp % − -0.023*** Adjusted R-square 0.41 0.42 0.43 Sample Size 717 717 717 Notes: Panel A presents the coefficient estimates from the following OLS regressions: Model 1 εβββ +++=+ ttt GRADEINVESTMENTROAROA 2101 Model 2 εβββ +++=+ ttt GRADEINVESTMENTROEROE 2101 ROE is equal to net income before extraordinary items (Compustat #18) divided by book value of common equity (Compustat #60). See Tables 3 and 9 for other variable definitions. Panel B presents the coefficient estimates form the following OLS regressions Model 1 εβββ +++=+ ttt SalaryOCROAROA %_2101 Model 2 εβββ ++++=+ ttt BonusSalaryOCROAROA %_2101 Model 3 εβββ +++=+ ttt TotalCompOCROAROA %_2101 ***,**,* indicates significance at the 0.01, 0.05, and 0.10 level or better, respectively. See Table 9 for variable definitions

63
Table 11 Sensitivity Tests with Prior Period Performance
Variables
Predicted
Sign 1-year Prior Performance
3- year Prior Performance
5-year Prior Performance
Firm Characteristics: LEV − -2.154*** -1.794*** -1.763*** ROA + 0.107*** 0.089*** 0.095*** LOSS - -1.089*** -1.155*** -1.045*** INT_COV + 0.015*** 0.029*** 0.025*** SIZE + 0.643*** 0.634*** 0.628*** SUBORD − -0.569*** -0.544**** -0.580*** CAP_INTEN + 0.490*** 0.413** 0.244 FIN_UTILITY + 0.159 0.250 0.149 PP_RET ? -0.006*** -0.007** -0.009** Governance Attributes Ownership Structure and Influence BLOCK ? -0.156*** -0.169*** -0.176*** %INST ? 0.159 0.303 0.133 %INSIDE − 0.497 0.461 0.503 Financial Stakeholder Rights & Relations
G_SCORE ? 0.040* 0.036* 0.032 Financial Transparency WCAQ + 7.736*** 6.738*** 10.147*** TIMELINESS + 3.382*** 3.363*** 3.034**** TOTFEES − 0.316 0.323 0.265 %AUD_IND + -0.063 -0.216 -0.637 FIN_EXPERT + 0.189 0.165 0.176 Board Structure and Processes %BRD_IND + 1.107** 1.362** 1.337** CEOPOWER − -0.167 -0.210* -0.245** %BRD_EXPERT + 1.005*** 0.994** 1.214*** %BRD_STOCK + 0.915*** 1.127*** 1.133*** GOVERNANCE_POLICY + 0.116 0.179 0.191 %FINCOM_INSIDE + 0.276 0.713 0.952* Generalized R-square 0.60 0.60 0.60 Likelihood ratio χ2 800.97*** 770.74*** 709.96*** Wald χ2 125.40*** 128.03*** 117.07*** Sample Size 870 832 783
See Table 3 for variable definitions.

64
Notes: Table values are coefficient estimates from the following ordered logit models: Model 1 RATING = f(Firm Characteristics, Prior 1 year Return, Governance Attributes) Model 2 RATING = f(Firm Characteristics, Prior 3 year Return, Governance Attributes) Model 3 RATING = f(Firm Characteristics, Prior 5 year Return, Governance Attributes) ***,**,* indicates significance at the 0.01, 0.05, and 0.10 level or better, respectively. The Wald χ2 statistic tests whether the governance attributes added in each model as a whole explain a significant portion of the variation in firms’ credit ratings. RATING= S&P Long Term Domestic Issuer Credit Rating (Compustat #280), see Table 1 for numeric coding, PP_RET is equal to the prior period(s) return over the fiscal year, in the three and five year columns it is set to the average return over the past three, five years. PP_RET is industry-adjusted, where industry groups are defined by four, three, two, and one digit SIC codes with a minimum of 10 firms in each industry group. See Table 3 for other variable definitions.