the effects of border violence on u.s.-mexican cattle …€¦ · simple regression models for nine...
TRANSCRIPT

The Effects of Border Violence on U.S.-Mexican Cattle Trade
Subject Area: U.S. Agricultural Trade
Hannah Ahn
Graduate Research Assistant
Pennsylvania State University
1335 Dreibelbis Street #429B State College, PA 16801
734-277-5920
Luis A. Ribera
Associate Professor and Extension Economist
Texas A&M University
Department of Agricultural Economics College Station, TX 77843-2124
979-845-3070
Selected Paper prepared for presentation at the Southern Agricultural Economics
Association (SAEA) Annual Meeting, San Antonio, Texas, February 6‐ 9, 2016.
Copyright 2016 by [Hannah Ahn, Luis A. Ribera, David P. Anderson, David Riley]. All
rights reserved. Readers may make verbatim copies of this document for
non‐ commercial purposes by any means, provided that this copyright notice appears on
all such copies.

Background
Cattle play a major role in agricultural trade between the United States and
Mexico. Since the beginning of NAFTA, the two bordering countries promoted their
economic growth and total agricultural trade. However, as much as the regional
integration upgraded cooperation, the cattle industry faces several challenges due to
violence along the border.
Historically, Mexico has a comparative advantage in the production of feeder
cattle, and the United States has a comparative advantage in the production of beef (Peel,
Mathews, Johnson 2011). After NAFTA, the United States exported more beef to Mexico
and imported more feeder cattle from Mexico (Figure 1). Figure 1 provides monthly data
for U.S. imports of Mexican feeder cattle from January 1996 to October 2014. In 2011
and 2012, Mexico’s live cattle exports reached about 1.4 million and 1.5 million heads
respectively; in 2013, live cattle exports declined to 1.045 million heads.
Based on the data from USDA Market News Service (2014), the percentage of
Mexican feeder cattle imports changed over time; most ports of entry show small
fluctuations. A high percentage of exports through the Santa Teresa/El Paso ports of entry
are present. However, the Presidio port of entry showed a significant decrease in the
number of feeder cattle crossings, and the San Luis port of entry became relatively
inactive (Table 1).
There are multiple factors influencing the changes of the cattle crossings.
According to the literature, i) a seasonal pattern of higher numbers of cattle crossing into
the United States between October and May and fewer imports from June to September
(Guinn and Skaggs 2005); ii) the combined result of 2010/2011 drought which led to high

feed costs in Mexico are other environmental factors (Peel et al. 2010); iii) inspection
process that all cattle have to follow the U.S. health regulations before crossing (USDA
APHIS 2014); iv) other financial restrictions of fees (Mitchell et al. 2001); v) a policy
change in Mexico to increase the slaughter and packing at Federally Inspected Facilities
(TIF) and to expand market access into Russia, China, and Singapore (Juan and Williams
2010); and vi) the health and quality of the cattle and breed characteristics (Peel et al.
2010) impact the U.S. cattle imports from Mexico.
Mexican Violence along the Border
Recently, local violence in Mexico and the continuation of safety concerns
negatively impact the bilateral trade. The USDA veterinarians are responsible for cattle
inspections before cattle cross the border. However, the crimes caused by drug cartels in
Mexico have moved its inspection operations to the United States. The crimes also forced
the USDA to close down the ports of entry and to establish temporary facilities, which
will protect the safety of the US inspectors and maintain the flow of trade across the US
border with Mexico.
In March 2012, gang violence caused the closing of U.S. cattle inspection stations
in Reynosa, Tamaulipas across from Hidalgo, Texas and Nuevo Laredo, Tamaulipas
across from Laredo, Texas for six weeks. This closure was estimated to affect 11 percent
of cattle being offered for entry into the United States (Texas Department of Agriculture
2010). Furthermore, the facility in Ojinaga, Chihuahua across Presidio, Texas was closed
in August 2012, and it was not reopened until June 23, 2014 (Brezosky 2014). During the
closure, a temporary USDA facility in Presidio was opened on October 2, 2012 until the
actual port was reopened (Matheis, Garcia, and Halpern 2012). According to Brezosky
(2014), Mexican cities across from the Del Rio and Eagle Pass facilities were also closed
due to violence since 2010. These events forced Mexican ranchers to transport their
animals to the other ports of entry and it could possibly further decrease the exports of
feeder cattle to the United States.
Objectives
This research identifies and quantifies the impact of border closures caused by
violence that can change the movements of feeder cattle trade between the two countries.
This research is determined to explore how border closures influence the trade flows of
livestock crossings between the U.S.-Mexico border through different ports of entry from
January 2009 to September 2014.
Literature Review
Scholars have attempted to identify the factors affecting the supply of Mexican
feeder cattle to the U.S. cattle market. However, relatively few studies on the U.S.-
Mexico cattle trade at each port of entry. Mitchell (2000) and Guinn (2005)’s studies the
factors that influence feeder cattle movements from Mexico into the United States.
Although they did not considered the violence factors, the work of analyzing the
relationship between the ports of entry along the border aided addressing questions
related to feeder cattle movements between the two countries. Mitchell estimated separate
simple regression models for nine live cattle ports of entry (Columbus, Del Rio, Douglas,
Eagle Pass, Santa Teresa, Laredo, Nogales, Presidio, and San Luis) along the U.S.-

Mexico border; monthly numbers of live cattle imported at each port served as the
dependent variable. Using an ordinary least squares (OLS) method, Mitchell selected the
final models based on economic theory, t-statistics, and R2 (Mitchell 2000). Mitchell
found statistically significant rainfall effects and their variability in the rainfall coefficient
signs, and significant trend variable in the models. The study provided valuable
information predicting the live cattle imports from Mexico into the United States by port
of entry using ten major equations. Guinn updated and re-estimated simple regression
models developed by Mitchell using step-wise regression procedures with statistical
significance set at =0.10 to evaluate the monthly dummy variables and trend variables.
With some monthly variables statistically significant for different models, Guinn found
the trend variable to be significant in only two of the nine models, Eagle Pass and Laredo.
Furthermore, Guinn evaluated nine regression models that represent the cattle crossings
at each port of entry and concluded that the single equation regression models explained
at least 54% of the variability in monthly cattle crossings at each port of entry, which are
slightly weaker than the explanatory powers of Mitchell’s models. Guinn concluded that
the greater U.S. cattle prices and the periods of drought, the greater number of cattle
imported from Mexico (Guinn 2005). Acknowledging the existence of additional
variables that should be incorporated into the port-of-entry explanatory models, the study
overall provides insight on some variables affecting the numbers of cattle being traded
between the two countries.
Given the limitations of OLS introducing bias in the regression estimates of the
values of the coefficients and their standard errors, a simultaneous equations model
Seemingly Unrelated Regression (SUR) estimation proposed by Zellner (1962) can be

used. Golub and Hsieh (2000) revisited the classical Ricardian model using cross-section
seemingly unrelated regressions of sectoral trade flows. They tested the pairs of countries
vis-à-vis the United States using three different purchasing power parity exchange rates
to determine trade patterns. Golub and Hsieh (2000) found that when the equations were
estimated with OLS, the signs and magnitudes of coefficients were similar to those found
with SUR, but the t-statistics were always smaller with a few exceptions. On the other
hand, the standard errors of the SUR regressions decrease with the number of years used,
thereby increasing the t-statistics in the end. Thus, they concluded that the SUR
regressions yield more precise estimates in most cases because they make use of more
information by estimating the cross-section regressions over several years simultaneously
(Golub and Hsieh 2000).
Chionis, Liargovas, and Zanias (2002) expanded the Zellner’s SUR estimating the
coefficients of the gravity model in order to determine the magnitude of potential trade
flows between Greece and nine Balkan countries. The highlight of their research is
allowing for correlation between the error terms; the errors of Greece-Germany may be
related with the errors of Greece-France (Chionis, Liargovas, and Zanias 2002).
Furthermore, they found the SUR estimation was effective in finding potential trades
between Greece and the Balkans.
Currently, the OLS and SUR estimations have been widely used to research
international and regional integration trade patterns. This study differs from the earlier
studies of Mitchell and Guinn because it will use both OLS and SUR to examine the
feeder cattle inflow. It will make a comparison of the two techniques. The information in

this article had not been observed previously in the extant literature within the topic of
bilateral cattle trade at the port of entry level.
Theoretical Framework and Model Specification
This study uses two methods to examine the impact of violence on Mexican
feeder cattle imports. Ten econometric models were tested to explain the effect of the
border closures on the cattle crossings through different ports of entry along the U.S.-
Mexican border: Mexican Feeder Cattle Imports from Santa Teresa, Nogales, Laredo,
Eagle Pass, Hidalgo, Douglas, Columbus, Del Rio, Presidio, and San Luis.
OLS procedures were first selected for analyzing live cattle imports from Mexico
into the United States concerning the impacts of border closures at each port of entry.
Each one of the ten ports had its own unique model to represent its own phenomenon
from January 2009 to September 2014. The dependent variable in each model was the
total monthly cattle crossings through the selected port of entry; the explanatory variables
used in the initial model development and testing were lagged cattle imports; port of
entry closures; temporary facility openings; drought; corn price; US feeder steers price;
US fed steers price; Mexico feeder steer price; exchange rates; oil price; seasonality;
linear trend; and parabolic trend. For example, Santa Teresa port of entry will be
measured as:
SantaTeresa = (STlag, Nogales, Laredo, EaglePass, Hildago, Douglas, DelRio,
Columbus, Presidio, Plag, SanLuis, Pdummy, Tdummy, Drought, Corn, Usfeeder, Usfed,
Mxfeeder, Exchrate, Oil, Trend, Trend2, Jan, Feb, Mar, Apr, May, Jun, Jul, Aug, Sep,
Oct, Nov)
Then the other port equations will be modeled using the same explanatory
variables except that one explanatory port (independent variable) becomes the explained
port (dependent variable) for the next equation. For example, after Santa Teresa
modeling, the explained variable SantaTeresa will become the explanatory variable for
the other equations; Nogales will become the explained variable for its equations and will
be the explanatory variable for the other equations.
Secondly, models are jointly estimated using the SUR estimator. The SUR model
is a system of linear equations with error terms that are correlated across equations for a
given port of entry. It is hypothesized that the geographical locations of the ports are
conceptually related equations; therefore, this study recognizes that there is a potential for
correlation between the error terms of the two equations. If the error terms are correlated,
the SUR model is an appropriate technique for addressing cross-equation error
correlation, and will gain efficiency by using the SUR model. However, if the error terms
of these ten models are unrelated, then the OLS regressions will be sufficient.
Data and Method
Monthly data from January 2009 to September 2014 were collected from the
World Institute for Strategic Economic Research (WISERTrade). The monthly US cattle
imports in dollar value from Mexico’s port of entry data were first extracted. These
values were divided by the ratios of the monthly US cattle imports from Mexico’s overall
import dollar values and total quantities. So monthly US cattle net quantity imports by
port of entry were generated.
Figure 3 shows monthly cattle crossings from January 2009 to September 2014
into the United States for each of the ten ports of entry. Figure 4 gives another
representation of the monthly percentages of cattle imports for all ports. Of all the cattle

that crossed from Mexico into the United States through the ten ports of entry, Santa
Teresa had the largest volume of cattle entries at 35%. Nogales was the second largest
port of entry for cattle imports at 15%, and Presidio was the third largest port of entry at
11%.
The cattle trade faced the anomaly of a severe drought in 2010 and 2011 that
forced Mexican cattle ranchers to liquidate their herds earlier than normal. These similar
patterns were presented at each of the ten ports of entry. So Texas’s drought data were
collected from the United States Drought Monitor to examine their influences and was
used as proxy for northern Mexico. Those data provided weekly drought measures of
extreme and exceptional drought percentages and were averaged into a monthly account.
Since corn is a major input to the production of feeder cattle, the average prices of
corn (dollars per bushel) received by farmers were used in the models. Other prices like
U.S. feeder steers and U.S. fed steers were extracted from the LMIC. The prices for
Mexican feeder steers from USDA Agricultural Marketing Service (USDA AMS) were
also included in the calculations since Mexican cattle exports are depended on both U.S.
and Mexican prices. Crude oil (petroleum) price (dollars per barrel) was used to capture
some distance impacts. The longer the distance that trucks have to travel, the higher the
oil, labor, and other associated risks cost. Other variables to discuss in the model were a
linear and parabolic trend. Linear trend (X) and parabolic trend (X2) measure the upward
or downward movements, and lagged variable for number of cattle crossings captures
dynamic changes based on the past values.
In addition, many of the variables that were used in this research were dummy
variables representing the seasonal pattern in U.S. cattle imports from Mexico. In this

study, the twelve monthly dummy variables were zero or one depending on the month of
the year to consider the seasonal fluctuations; eleven dummy variables represent the 12
months of the year (December as a reference month).
Most importantly, the border violence was represented using dummy variables
called Pdummy representing the closure of the Presidio port of entry and Tdummy
representing opening of the temporary facility. The study defines the first indicator
variable D =1 if port of entry was closed due to violence and D = 0 if port of entry was
opened. For the temporary facility that was opened after 2 months of absolute closure, the
study defines second indicator variable D = 1 for absolute port closure and D = 0 for the
opening of the temporary facility. Descriptive statistics of the variables incorporated in
the model are presented in Table 2.
The study attempts to measure the impact of a closed port of entry on the nearby
ports of entry through the use of a regression in Stata software, a series of economic
explanatory variables, and a dummy variable for port of entry openings and closure. One
of the objectives is achieved using the OLS regression to test for statistical significance of
cattle inflows between the Presidio port of entry and the Santa Teresa port of entry and if
closure causes the diversion of the cattle imports from Mexico. The Presidio, Texas port
of entry is across from Ojinaga, Chihuahua and is about 241 miles away from the Santa
Teresa, NM port of entry. The Presidio port of entry was closed for 22 months from
August 2012 to June 2014 due to repeated security concerns including local violence
(Brezosky 2014). Given limited data, within the 22 months period of closure the
temporary facility was opened for 20 months. This implies that the Presidio port of entry
had 2 months of no inflows from August 2012 to September 2012.

However, the imported data from WiserTrade are determined by port of unlading,
therefore the numbers for the two periods period of the absolute border closures were
given values. In other words, for those two periods the cattle were first transported to the
Presidio port of entry and were unloaded, however, they were imported from the other
ports of entry (see Figure 5).
Looking at Figure 5, the two ports are moving together in 2009 and 2011. After
May 2012, there was a decreasing trend of cattle inflows through two ports of entry and
in August 2012 during the port closure, they faced the extremely low volumes of cattle
inflows. There is a possibility that the decreasing trend that started from May 2012 was
caused by the violence in the region. Then the inflow was stabilized in October 2012
when the temporary facilities were established.
OLS procedures were first selected for analyzing live cattle imports from Mexico
into the United States concerning the impacts of border closures at each port of entry.
Each one of the ten ports had its own unique model to represent its own phenomenon
from January 2009 to September 2014. The dependent variable in each model was the
total monthly cattle crossings through the selected port of entry; the explanatory variables
used in the initial model development and testing were listed in Table 2.
Then the other port equations will be modeled using the same explanatory
variables except that one explanatory port (independent variable) becomes the explained
port (dependent variable) for the next equation. For example, after Santa Teresa
modeling, the explained variable SantaTeresa will become the explanatory variable for
the other equations; Nogales will become the explained variable for its equations and will
be the explanatory variable for the other equations.

Secondly, models are jointly estimated using the SUR estimator. The SUR model
is a system of linear equations with error terms that are correlated across equations for a
given port of entry. It is hypothesized that the geographical locations of the ports are
conceptually related equations; therefore, this study recognizes that there is a potential for
correlation between the error terms of the two equations. If the error terms are correlated,
the SUR model is an appropriate technique for addressing cross-equation error
correlation, and will gain efficiency by using the SUR model.
Results and Discussion
The OLS results of the estimated port of entry equations are reported in Table 3. It
can be seen from the table that border closing at the Presidio port of entry had a
statistically positive effect on exports through the Santa Teresa port of entry. Using a
temporary facility opened at the Presidio port of entry does not make our results
statistically significant. Other ports of entry that are within a 200~ 250 miles range from
Santa Teresa, NM; also see larger crossings due to border closure, including Douglas
(204.7 miles), Columbus (59.7 miles), and Presidio (241 miles). For instance, Columbus,
Douglas, Presidio and Santa Teresa ports of entry exhibit a positive relationship, and
other ports of entry that are outside of the range are not statistically significant. On the
other hand, Del Rio (447 miles) and Santa Teresa ports of entry exhibit a negative
relationship, or may be substitutes of each other.
From the OLS results, if the Presidio port of entry is closed due to violence, then
an average of 16,212 more cattle per month cross the Santa Teresa port of entry. The
Santa Teresa port of entry is positively related to the ports that are within 200~ 250 miles
range.
Using Stata software, the estimated parameters from the OLS output and the SUR
output are compared. For OLS, the single equation regression models explained at least
76.90% (R2) and 54.47% (adjusted R
2) of the variability in monthly cattle crossings at
each port of entry in Table 4. In consideration of their significance using p-values, the
signs of the prices for corn, U.S. feeder steers, U.S. fed steers, Mexican feeder steers,
exchange rates, oils, droughts, and trends were mixed; the Laredo model had no
statistically significant variables and the Hidalgo and San Luis model had very few
statistically significant variables.
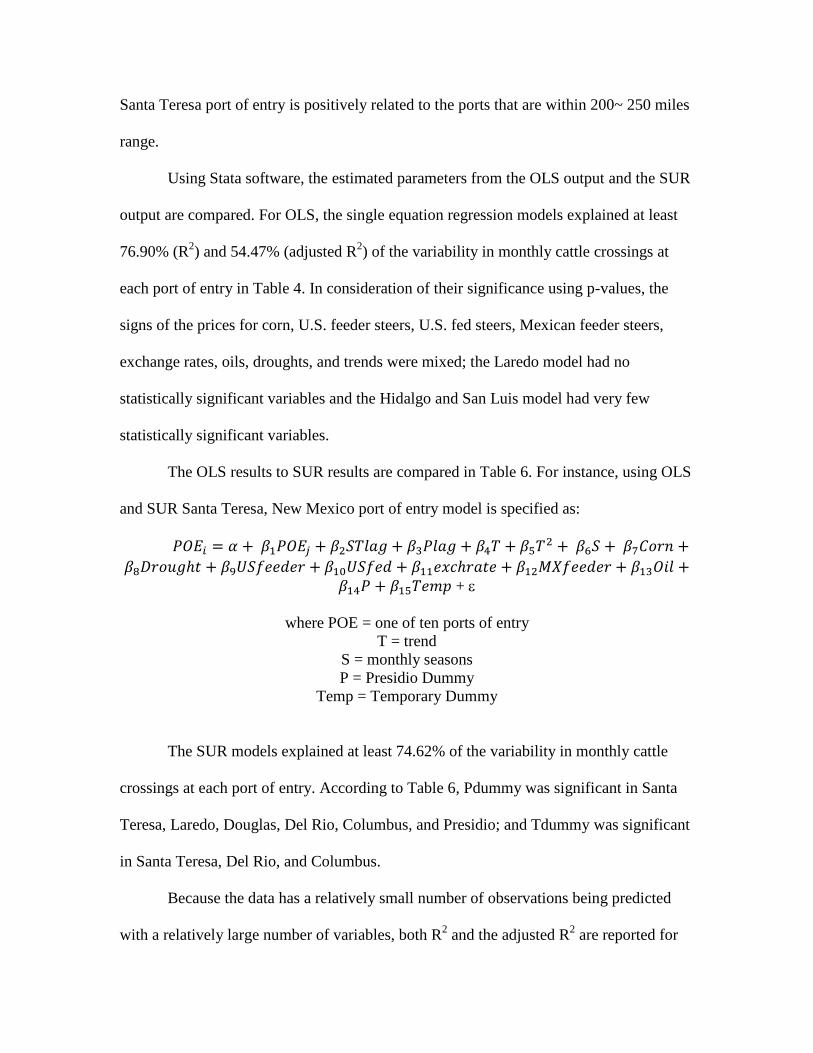
The OLS results to SUR results are compared in Table 6. For instance, using OLS
and SUR Santa Teresa, New Mexico port of entry model is specified as:
𝑃𝑂𝐸𝑖 = 𝛼 + 𝛽1𝑃𝑂𝐸𝑗 + 𝛽2𝑆𝑇𝑙𝑎𝑔 + 𝛽3𝑃𝑙𝑎𝑔 + 𝛽4𝑇 + 𝛽5𝑇2 + 𝛽6𝑆 + 𝛽7𝐶𝑜𝑟𝑛 +
𝛽8𝐷𝑟𝑜𝑢𝑔ℎ𝑡 + 𝛽9𝑈𝑆𝑓𝑒𝑒𝑑𝑒𝑟 + 𝛽10𝑈𝑆𝑓𝑒𝑑 + 𝛽11𝑒𝑥𝑐ℎ𝑟𝑎𝑡𝑒 + 𝛽12𝑀𝑋𝑓𝑒𝑒𝑑𝑒𝑟 + 𝛽13𝑂𝑖𝑙 +𝛽14𝑃 + 𝛽15𝑇𝑒𝑚𝑝 +
where POE = one of ten ports of entry
T = trend
S = monthly seasons
P = Presidio Dummy
Temp = Temporary Dummy
The SUR models explained at least 74.62% of the variability in monthly cattle
crossings at each port of entry. According to Table 6, Pdummy was significant in Santa
Teresa, Laredo, Douglas, Del Rio, Columbus, and Presidio; and Tdummy was significant
in Santa Teresa, Del Rio, and Columbus.
Because the data has a relatively small number of observations being predicted
with a relatively large number of variables, both R2 and the adjusted R
2 are reported for

OLS equations. Only R2 is reported for SUR because the SUR estimation procedure is
optimal under the contemporaneous correlation assumption, so no standard error
adjustment is necessary (Hill, Griffiths, and Lim 2011).
Overall, the R2 values from OLS were greater than the R
2 values from SUR.
However, when the adjusted R2 values from OLS were compared with the R
2 values from
SUR, higher R2
values from SUR were observed.
With SUR, the study found smaller standard errors for all equations compared to
OLS (see Table 6). The standard error of the regression is an estimator of the standard
deviation of the error term; thus, SUR gives better estimates of the variable parameters
than the OLS results, and it has increased the efficiency of the statistical results.
More differences in the number of statistically significant variables between the
OLS and SUR techniques are observed in Table 6. OLS left out significant variables and
this could be problematic if the model cannot capture important effects. Therefore, SUR
is a better estimation.
Similar to the OLS results, SUR showed border closing at the Presidio port of
entry had a statistically positive effect on exports through the Santa Teresa port of entry.
Given the Presidio port closure, the Santa Teresa port of entry exhibited a positive
relationship with Nogales, Laredo, Douglas, Columbus, and Presidio and a negative
relationship with Eagle Pass, Del Rio, and San Luis. The OLS estimations had four port
variables and the SUR estimations had eight port variables explaining the independent
variable Santa Teresa. For different ports of entry, the same logical process can be used
to determine each model.

Examining the Presidio port closure effects, the OLS and SUR estimations gave
two different results (see Table 6). The OLS results reveal that two affected ports were
Presidio and Santa Teresa. In contrast, the SUR results reveal that the impact of the
Presidio port of entry closure was significant in all ports of entry except for San Luis,
Nogales, Eagle Pass, and Hidalgo, which are the ports near the ends of the U.S. and
Mexico border (see Figure 2 and Table 6). When the Presidio port of entry was closed,
positively affected ports were Santa Teresa and Del Rio and negatively affected ports
were Laredo, Douglas, Columbus, and Presidio. Thus more ports were negatively
affected by the Presidio port closure; however, a significantly large number of cattle
crossings through the Santa Teresa ports are observed compared to other ports.
The SUR estimation captured the port of entry closure and the temporary
facility’s significance. The Santa Teresa model implies that when the Presidio port of
entry is closed, an average of 23,703 more cattle per month were imported through the
Santa Teresa port of entry. However, when a temporary facility was opened in Presidio,
an average of 15,472 fewer cattle per month were imported through the Santa Teresa port
of entry, which is consistent with our a priori expectation.
The results show the significant effect of the temporary facility in the Presidio
port. Similar results were shown for the Del Rio and Columbus ports of entry. After
allowing correlations between the errors to occur, the SUR results indicated that the
effect of the temporary facility in the Presidio port of entry that when the temporary
facility was opened, the cattle crossings through the Santa Teresa port of entry was
decreased by 1-(15,472/23,703) = 35%. This analysis suggests that the temporary facility

in the Presidio port of entry played an important role, possibly mitigating the impact of
port closures caused by violence.
However, there are also limitations to SUR estimations. Going back to the Santa
Teresa port of entry model, the distance measure was harder to capture using SUR
estimations. It was hard to make a clear distinction of range of miles to the extent that
show how ports were related in terms of distance. Or the study suggests that in most
cases the impact of border closure was strong enough—and all of ports are integrated
with one other—that one port of entry positively and negatively impacts each other.
Furthermore, using SUR Pdummy was significant in the Santa Teresa, Laredo,
Douglas, Del Rio, Columbus, and Presidio ports; Tdummy was significant in the Santa
Teresa, Del Rio, and Columbus ports. From the OLS results, Pdummy was significant in
the Santa Teresa and Presidio ports; however, Tdummy was significant in the Del Rio
port at the p-value < 0.05.
Overall, the study attempts to measure how much impact a closed port of entry
has on the nearby ports of entry. The OLS results show the importance of ports that are
within 200~250 miles range from Santa Teresa that are both statistically significant and
positively related. However, using SUR showed more and fewer cattle crossings were
independent from distance. More attention given to the opening of the temporary facility
in Presidio resulted in an opposite sign, which indicates that establishing the temporary
facility offsets the effect of port closure. SUR increased efficiency in the estimated model
parameters by correcting for error correlations and providing more statistically significant
estimates of the variable than the OLS results. Also, the SUR estimations display smaller
standard errors with higher R2 compared to adjusted R
2 from the OLS estimations.

Therefore, SUR is a better estimation technique, although OLS provides minor
advantages.
Conclusion
This study examined the impact of border closures on the movements of feeder
cattle trade between the United States and Mexico. Given the ten major ports, the ten
models presented captured the strong seasonal marketing patterns, and the figures and
tables illustrate the distributions of U.S. imports of Mexican feeder cattle by port of entry.
The research presented a comparison of the OLS and SUR estimations and showed the
clear benefits of using SUR. When equations were estimated with OLS, the signs and
magnitudes of coefficients were similar to those found with SUR. But smaller standard
errors with higher R2 (compared to adjusted R
2 from OLS) of the SUR regressions were
found. Also, more statistically significant variables explained the port of entry models
using SUR; therefore, this study concludes that the SUR regressions yield more precise
estimates in most cases.
Based on the SUR estimation techniques, the volume of imports is not necessarily
distance dependent. This study finds that the Presidio port closure from the SUR results
affected more ports compared to the OLS results, and the temporary facility played a
significant role in the flow of Mexican cattle into the United States.
References
Acock, A.C. 2012. A Gentle Introduction to Stata: Revised, 3rd. ed. College Station,
StataCorp LP.
Bae S., S. Gen, and S.G. Moon. 2011. “Institutional, Geographic, and Facility Factors
affecting Differences in Prices for Wastewater Services.” Annals of Regional
Science 49:767-788.
Brezosky, L. 2014. “USDA Reopens Ojinaga Inspection Facility.” San Antonio Express
News, July. Accessed February 9, 2015, Available at:
http://www.expressnews.com/news/us-world/border-mexico/article/USDA-
reopens-Ojinaga-inspection-facility-5650364.php.
Chionis, D., P. Liargovas, and G. Zanias. 2002. “Greece’s Trade with the Balkan
Countries: Is It Too Little?” Journal of Economic Integration 17 (3): 608-622.
Federal Bureau of Investigation (FBI). 2014. Stats and Services. Washington DC.
Accessed November 15, 2014, Available at: http://www.fbi.gov/stats-services/fbi-
resources.
Golub, S.S., and C.T. Hsieh. 2000. “Classical Ricardian Theory of Comparative
Advantage Revisited.” Review of International Economics 8(2):221-234.
Guinn, C., and R. Skaggs. 2005. “Live Cattle Imports by Port of Entry from Mexico into
the United States: Data and Models.” Report, Dept. of Agricultural Economics
and Agricultural Business, New Mexico State University.
Hill, R.C., W.E. Griffiths, and G.C. Lim. 2011. Principles of Econometrics, 4th. ed. New
Jersey: Wiley.
Hwang, H.S. 2013. ECMT 765 Notes. Unpublished, Texas A&M University.
Jaenicke, T. 2015. AEREC 510 Notes. Unpublished, Penn State University.
Juan, S.J., and D.R. Williams II. 2010. Mexico Livestock and Products Annual.
Washington DC: U.S. Department of Agriculture, Foreign Agricultural Service.
GAIN Rep. MX0064, September.
Livestock Marketing Information Center. 2015. Feeder Cattle. Lakewood, Colorado.
Accessed November 2014, Available at: http://lmic.info/content/about-lmic.
Matheis J., J.D. Garcia, and A.T. Halpern. 2012. Dismay, Economic Concern Greet
USDA Cattle Inspection Facility Move. Accessed November 3, 2014, Available
at: http://bigbendnow.com/2012/12/dismay-economic-concern-greet-usda-cattle-
inspection-facility-move/.

Mitchell, D.R. 2000. “Predicting Live Cattle Imports by Port of Entry from Mexico into
the United States.” MS thesis, Dept. of Agr. Econ., New Mexico State University.
Mitchell, D., R. Skaggs, W. Gorman, T. Crawford, and L. Southard. 2001. Mexican
Cattle Exports to U.S.: Current Perspectives. Washington DC: U.S. Department
of Agriculture, Economic Research Service, June-July.
Peel, D.S., R.J. Johnson, and K.H. Mathews. 2010. Cow-Calf Beef Production in
Mexico. Washington DC: U.S. Department of Agriculture, Economic Research
Service. Rep. LDP-M-196-01, November.
Peel, D.S., K.H. Mathews, and R.J. Johnson. 2011. Trade, the Expanding Mexican Beef
Industry, and Feedlot and Stocker Cattle Production in Mexico. Washington DC:
U.S. Department of Agriculture, Economic Research Service. Rep. LDP-M-206-
01, August.
Texas Department of Agriculture. 2010. USDA Suspends Imports Livestock Inspection in
Reynosa and Nuevo Laredo. Austin, Texas. Accessed November 12, 2014,
Available at:
http://www.texasagriculture.gov/NewsEvents/TDAPublications/TradeActionNetw
ork/USDASuspendsImportLivestockInspection.aspx.
U.S. Department of Agriculture, Foreign Agricultural Service (USDA FAS). 2015.
Global Agricultural Trade System. Washington DC. Accessed January 2, 2015,
Available at: http://apps.fas.usda.gov/gats/default.aspx.
U.S. Department of Agriculture, Agricultural Markets Service (USDA AMS). 2014.
Amarillo Livestock Market News. Las Cruces, NM. Accessed January 10, 2015,
Available at: www.ams.usda.gov/lsmnpubs/.
U.S. Department of Agriculture, Economics Research Service (USDA ERS). 2014.
International Markets & Trade. Washington DC. Accessed December 20, 2014,
Available at: http://www.ers.usda.gov/topics/international-markets-
trade/countries-regions.aspx.
U.S. Department of Agriculture, Animal and Plant Health Inspection Service (USDA
APHIS). 2014. Import Live Animals. Washington DC. Accessed Feb 3, 2015
Available at: http://www.aphis.usda.gov/wps/portal/aphis/home/.
Wooldridge, J.M. 2013. Introductory Econometrics: A Modern Approach, 5th. ed.
Mason: South-Western.
World Institute for Strategic Economic Research Trade (WiserTrade). 2015. Port HS
Database. Leverette, Massachusetts. Accessed January 19, 2015, Available at:
http://www.wisertrade.org/home/portal/index.jsp.

Xu, X. 2000. “International Trade and Environmental Policy: How Effective is ‘Eco-
Dumping’?” Economic Modelling 17:71-90.
Zellner, A. 1962. “An Efficient Method of Estimating Seemingly Unrelated Regressions
and Tests for Aggregation Bias.” Journal of the American Statistical Association
57: 348-368.
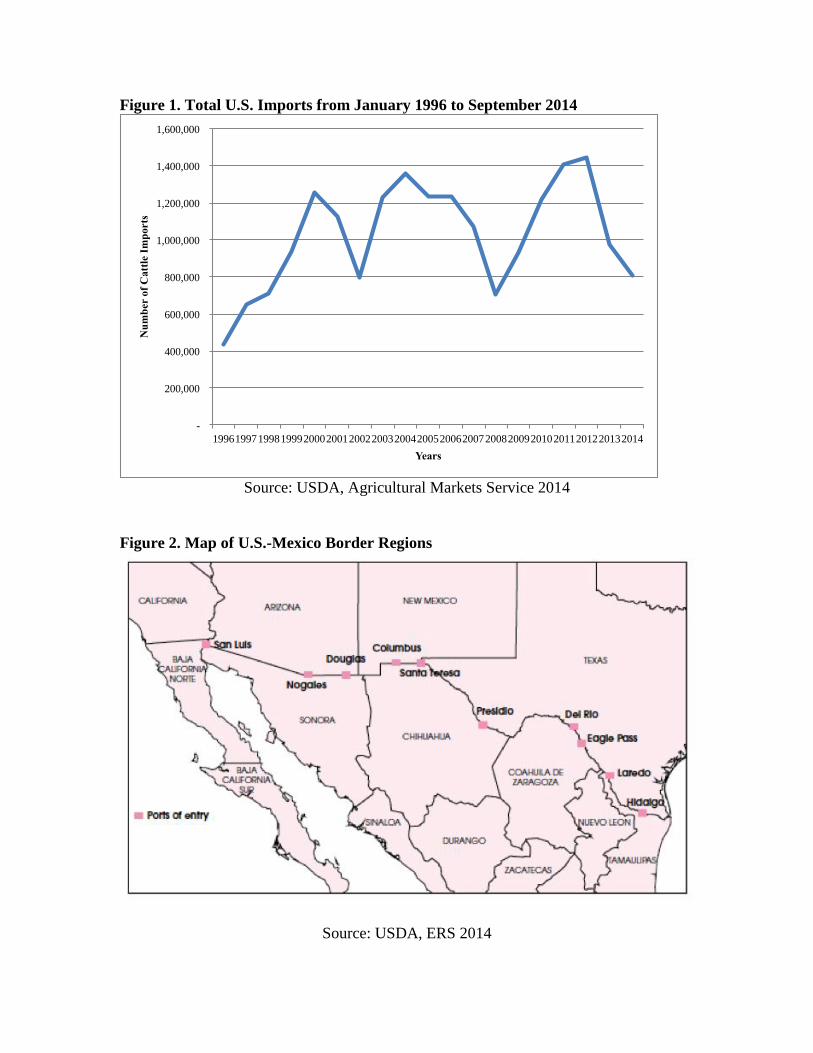
Figure 1. Total U.S. Imports from January 1996 to September 2014
Source: USDA, Agricultural Markets Service 2014
Figure 2. Map of U.S.-Mexico Border Regions
Source: USDA, ERS 2014
-
200,000
400,000
600,000
800,000
1,000,000
1,200,000
1,400,000
1,600,000
1996 1997 1998 1999 2000 2001 2002 2003 2004 2005 2006 2007 2008 2009 2010 2011 2012 2013 2014
Nu
mb
er o
f C
att
le I
mp
orts
Years

Figure 3. Monthly Cattle Imports from Mexico by Port of Entry from January 2009
to September 2014
Source: WiserTrade 2015
Figure 4. U.S. Cattle Imports from Mexico by Port of Entry from January 2009 to
September 2014
Source: WiserTrade 2015
0
10,000
20,000
30,000
40,000
50,000
60,000
70,000
80,000
Jan
-09
Mar
-09
May
-09
Jul-
09
Sep
-09
Nov
-09
Jan
-10
Mar
-10
May
-10
Jul-
10
Sep
-10
Nov
-10
Jan
-11
Mar
-11
May
-11
Jul-
11
Sep
-11
No
v-1
1
Jan
-12
Mar
-12
May
-12
Jul-
12
Sep
-12
Nov
-12
Jan
-13
Mar
-13
May
-13
Jul-
13
Sep
-13
Nov
-13
Jan
-14
Mar
-14
May
-14
Jul-
14
Sep
-14
Nu
mb
er o
f C
att
le I
mp
orts
Months
Santa Teresa, NM Nogales, AZ Laredo, TX Eagle Pass, TX Hildago,TX
Douglas, AZ Del Rio, TX Columbus, NM Presidio,TX San Luis, AZ
35%
15% 4%
8% 4%
10%
9%
3% 11%
1% Santa Teresa, NM
Nogales, AZ
Laredo, TX
Eagle Pass, TX
Hildago,TX
Douglas, AZ
Del Rio, TX
Columbus, NM
Presidio,TX
San Luis, AZ

Figure 5. The Presidio and Santa Teresa Ports of Entry
Source: WiserTrade 2015
Table 1. Percentage of Total Imports, January 1996 – September 2014
Source: USDA Market News Service, 2014
0
10000
20000
30000
40000
50000
60000
70000
80000
Jan
-09
Mar
-09
May
-09
Jul-
09
Sep
-09
No
v-0
9
Jan
-10
Mar
-10
May
-10
Jul-
10
Sep
-10
No
v-1
0
Jan-1
1
Mar
-11
May
-11
Jul-
11
Sep
-11
No
v-1
1
Jan
-12
Mar
-12
May
-12
Jul-
12
Sep
-12
No
v-1
2
Jan
-13
Mar
-13
May
-13
Jul-
13
Sep
-13
No
v-1
3
Jan
-14
Mar
-14
May
-14
Jul-
14
Sep
-14
Nu
mb
er o
f C
att
le I
mp
ort
s
Months
Presidio,TX Santa Teresa, NM
DEL RIO EAGLE EL PASO HIDALGO LAREDO PRESIDIO COLUMBUS SANTA NOGALES DOUGLAS SAN LUIS
TX PASS, TX TX TX TX TX NM TERESA AZ AZ AZ
NM
1996 6 4 30 3 5 9 4 38 0 0
1997 6 4 31 2 6 20 4 23 3 2
1998 6 4 29 3 6 20 5 15 5 6
1999 8 4 29 4 5 19 5 12 7 7
2000 8 4 26 7 8 20 3 10 7 6
2001 11 4 22 8 10 20 4 10 5 6
2002 7 5 22 3 5 20 8 15 7 8
2003 9 4 22 8 5 21 6 13 8 3
2004 12 6 14 12 7 17 3 9 13 5 2
2005 11 9 10 6 13 3 28 13 6 1
2006 13 11 8 5 12 2 26 13 9 1
2007 11 10 9 4 14 3 27 13 7 1
2008 8 8 4 2 13 5 29 17 10 2
2009 8 9 4 4 13 5 30 15 10 1
2010 16 6 3 3 14 4 31 13 8 1
2011 17 7 5 4 14 3 27 13 9 1
2012 6 11 6 6 16 2 31 12 8 1
2013 5 7 6 8 4 4 37 16 11 2
2014 5 7 6 11 2 5 37 21 5 1

Table 2. An Overview of All Variables Included in this Analysis
Variable Name Variable Definition
Santa Teresa number of cattle imported from Santa Teresa port of entry
STlag lagged number of cattle imported from Santa Teresa port of entry
Nogales number of cattle imported from Nogales port of entry
Laredo number of cattle imported from Laredo port of entry
EaglePass number of cattle imported from Eagle Pass port of entry
Hildago number of cattle imported from Hildago port of entry
Douglas number of cattle imported from Douglas port of entry
DelRio number of cattle imported from Del Rio port of entry
Columbus number of cattle imported from Columbus port of entry
Presidio number of cattle imported from Presidio port of entry
Plag lagged number of cattle imported from Presidio port of entry
SanLuis number of cattle imported from San Luis port of entry
Pdummy monthly dummy variable for Presidio port of entry (0=open, 1 = closure)
Ldummy monthly dummy variable for Laredo port of entry (0=open, 1 = closure)
Hdummy monthly dummy variable for Hildago port of entry (0=open, 1 = closure)
Tdummy monthly dummy variable for Presidio port of entry with temporary facility opened
Drought cumulative drought severity in south region
Corn average price of corn received by farmers
Usfeeder U.S. feeder steer prices
Usfed U.S. fed cattle prices
Mxfeeder Mexican feeder steer prices
Exchrate average exchange rate, USD/MXN
Oil average of three spots
Trend linear variable
Trend2 seasonal variable
Jan monthly dummy variable for the month of January
Feb monthly dummy variable for the month of February
Mar monthly dummy variable for the month of March
Apr monthly dummy variable for the month of April
May monthly dummy variable for the month of May
Jun monthly dummy variable for the month of June
Jul monthly dummy variable for the month of July
Aug monthly dummy variable for the month of August
Sep monthly dummy variable for the month of September
Oct monthly dummy variable for the month of October
Nov monthly dummy variable for the month of November
Dec monthly dummy variable for the month of December
b0….bk estimated parameters

Table 3. Results of OLS, Santa Teresa Port of Entry
Number of obs 68
F( 33, 34) 16.09
Prob > F 0
R-squared 0.9398
Adj R-squared 0.8814
Root MSE 5942.2
SantaTeresa Coef. Std. Err. t P>t
STlag - - - -
Nogales - - - -
Laredo - - - -
EaglePass - - - -
Hidalgo - - - -
Douglas 0.9550405 0.3421264 2.79 0.009
DelRio -0.7655267 0.2706927 -2.83 0.008
Columbus 1.417242 0.3555655 3.99 0
Presidio 1.037587 0.3327957 3.12 0.004
Plag - - - -
SanLuis - - - -
Pdummy 16212.26 6697.33 2.42 0.021
Tdummy - - - -
Corn - - - -
Drought - - - -
USfeeder - - - -
USfed - - - -
exchrate - - - -
MXfeeder - - - -
oil - - - -
Jan - - - -
Feb - - - -
Mar - - - -
Apr - - - -
May - - - -
Jun - - - -
Jul - - - -
Aug - - - -
Sep - - - -
Oct - - - -
Nov - - - -
Trend - - - -
Trend2 -22.87134 9.22856 -2.48 0.018
_cons - - - -

Table 4. Results of OLS
Table 5. Results of SUR
Equation RMSE R-sq Adj R-sq P
SantaTeresa 5942.2 0.9398 0.8814 0.0000
Nogales 2394.5 0.9314 0.8648 0.0000
Laredo 902.4 0.8791 0.7918 0.0000
EaglePass 2999.0 0.8393 0.6834 0.0000
Hidalgo 1143.9 0.8333 0.6714 0.0000
Douglas 2686.7 0.9381 0.8781 0.0000
DelRio 3387.3 0.9047 0.8122 0.0000
Columbus 2366.1 0.8416 0.6880 0.0000
Presidio 2700.4 0.9514 0.9042 0.0000
SanLuis 541.7 0.7690 0.5447 0.0003
Equation RMSE R-sq Chi2 P
SantaTeresa 4888.9 0.9185 1224.4 0.0000
Nogales 1805.3 0.9220 956.9 0.0000
Laredo 673.5 0.8653 535.6 0.0000
EaglePass 2327.4 0.8065 424.3 0.0000
Hidalgo 872.9 0.8058 391.0 0.0000
Douglas 2165.1 0.9196 1133.6 0.0000
DelRio 2687.5 0.8800 749.6 0.0000
Columbus 1838.4 0.8088 445.4 0.0000
Presidio 2095.0 0.9415 1411.1 0.0000
SanLuis 401.5 0.7462 262.8 0.0000
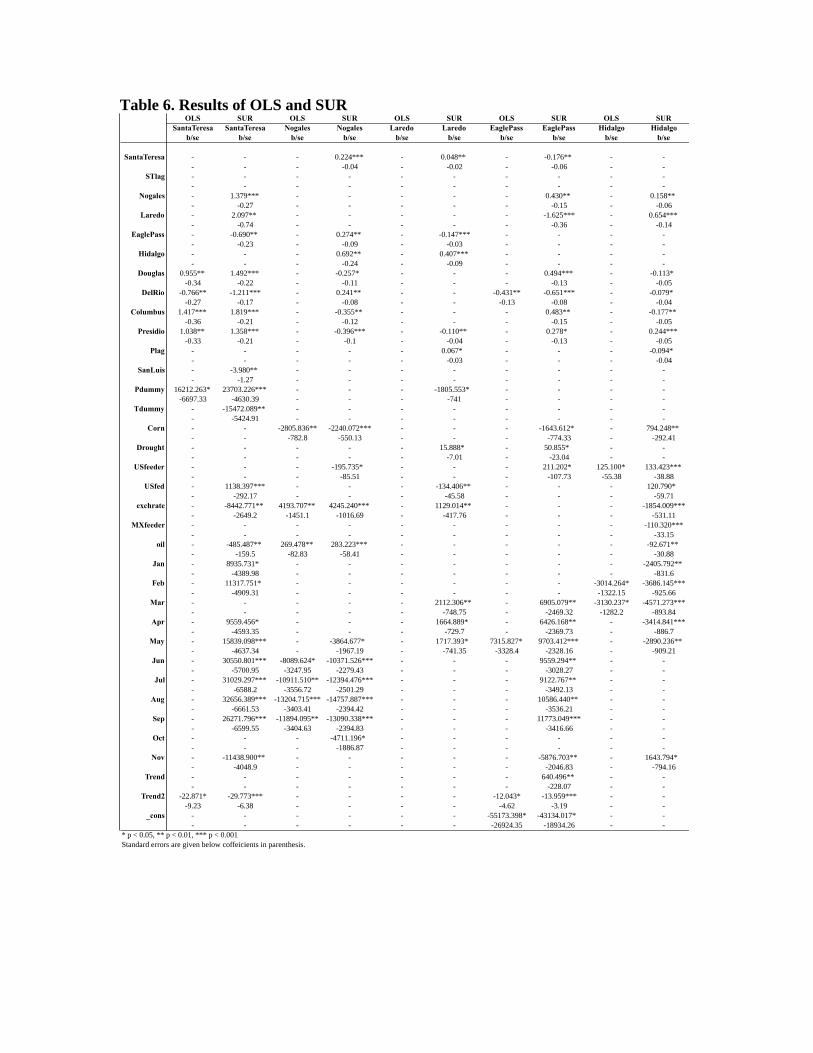
Table 6. Results of OLS and SUR
OLS SUR OLS SUR OLS SUR OLS SUR OLS SUR
SantaTeresa SantaTeresa Nogales Nogales Laredo Laredo EaglePass EaglePass Hidalgo Hidalgo
b/se b/se b/se b/se b/se b/se b/se b/se b/se b/se
SantaTeresa - - - 0.224*** - 0.048** - -0.176** - -
- - - -0.04 - -0.02 - -0.06 - -
STlag - - - - - - - - - -
- - - - - - - - - -
Nogales - 1.379*** - - - - - 0.430** - 0.158**
- -0.27 - - - - - -0.15 - -0.06
Laredo - 2.097** - - - - - -1.625*** - 0.654***
- -0.74 - - - - - -0.36 - -0.14
EaglePass - -0.690** - 0.274** - -0.147*** - - - -
- -0.23 - -0.09 - -0.03 - - - -
Hidalgo - - - 0.692** - 0.407*** - - - -
- - - -0.24 - -0.09 - - - -
Douglas 0.955** 1.492*** - -0.257* - - - 0.494*** - -0.113*
-0.34 -0.22 - -0.11 - - - -0.13 - -0.05
DelRio -0.766** -1.211*** - 0.241** - - -0.431** -0.651*** - -0.079*
-0.27 -0.17 - -0.08 - - -0.13 -0.08 - -0.04
Columbus 1.417*** 1.819*** - -0.355** - - - 0.483** - -0.177**
-0.36 -0.21 - -0.12 - - - -0.15 - -0.05
Presidio 1.038** 1.358*** - -0.396*** - -0.110** - 0.278* - 0.244***
-0.33 -0.21 - -0.1 - -0.04 - -0.13 - -0.05
Plag - - - - - 0.067* - - - -0.094*
- - - - - -0.03 - - - -0.04
SanLuis - -3.980** - - - - - - - -
- -1.27 - - - - - - - -
Pdummy 16212.263* 23703.226*** - - - -1805.553* - - - -
-6697.33 -4630.39 - - - -741 - - - -
Tdummy - -15472.089** - - - - - - - -
- -5424.91 - - - - - - - -
Corn - - -2805.836** -2240.072*** - - - -1643.612* - 794.248**
- - -782.8 -550.13 - - - -774.33 - -292.41
Drought - - - - - 15.888* - 50.855* - -
- - - - - -7.01 - -23.04 - -
USfeeder - - - -195.735* - - - 211.202* 125.100* 133.423***
- - - -85.51 - - - -107.73 -55.38 -38.88
USfed - 1138.397*** - - - -134.406** - - - 120.790*
- -292.17 - - - -45.58 - - - -59.71
exchrate - -8442.771** 4193.707** 4245.240*** - 1129.014** - - - -1854.009***
- -2649.2 -1451.1 -1016.69 - -417.76 - - - -531.11
MXfeeder - - - - - - - - - -110.320***
- - - - - - - - - -33.15
oil - -485.487** 269.478** 283.223*** - - - - - -92.671**
- -159.5 -82.83 -58.41 - - - - - -30.88
Jan - 8935.731* - - - - - - - -2405.792**
- -4389.98 - - - - - - - -831.6
Feb - 11317.751* - - - - - - -3014.264* -3686.145***
- -4909.31 - - - - - - -1322.15 -925.66
Mar - - - - - 2112.306** - 6905.079** -3130.237* -4571.273***
- - - - - -748.75 - -2469.32 -1282.2 -893.84
Apr - 9559.456* - - - 1664.889* - 6426.168** - -3414.841***
- -4593.35 - - - -729.7 - -2369.73 - -886.7
May - 15839.098*** - -3864.677* - 1717.393* 7315.827* 9703.412*** - -2890.236**
- -4637.34 - -1967.19 - -741.35 -3328.4 -2328.16 - -909.21
Jun - 30550.801*** -8089.624* -10371.526*** - - - 9559.294** - -
- -5700.95 -3247.95 -2279.43 - - - -3028.27 - -
Jul - 31029.297*** -10911.510** -12394.476*** - - - 9122.767** - -
- -6588.2 -3556.72 -2501.29 - - - -3492.13 - -
Aug - 32656.389*** -13204.715*** -14757.887*** - - - 10586.440** - -
- -6661.53 -3403.41 -2394.42 - - - -3536.21 - -
Sep - 26271.796*** -11894.095** -13090.338*** - - - 11773.049*** - -
- -6599.55 -3404.63 -2394.83 - - - -3416.66 - -
Oct - - - -4711.196* - - - - - -
- - - -1886.87 - - - - - -
Nov - -11438.900** - - - - - -5876.703** - 1643.794*
- -4048.9 - - - - - -2046.83 - -794.16
Trend - - - - - - - 640.496** - -
- - - - - - - -228.07 - -
Trend2 -22.871* -29.773*** - - - - -12.043* -13.959*** - -
-9.23 -6.38 - - - - -4.62 -3.19 - -
_cons - - - - - - -55173.398* -43134.017* - -
- - - - - - -26924.35 -18934.26 - -
* p < 0.05, ** p < 0.01, *** p < 0.001
Standard errors are given below coffeicients in parenthesis.
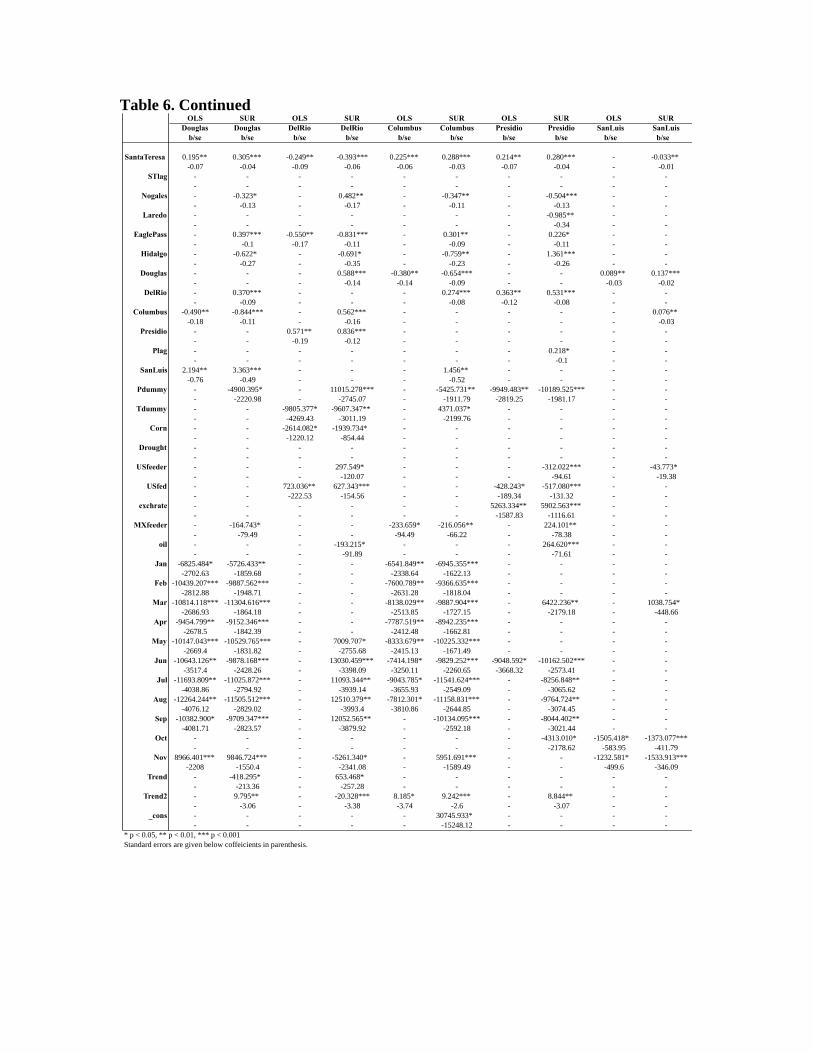
Table 6. Continued
OLS SUR OLS SUR OLS SUR OLS SUR OLS SUR
Douglas Douglas DelRio DelRio Columbus Columbus Presidio Presidio SanLuis SanLuis
b/se b/se b/se b/se b/se b/se b/se b/se b/se b/se
SantaTeresa 0.195** 0.305*** -0.249** -0.393*** 0.225*** 0.288*** 0.214** 0.280*** - -0.033**
-0.07 -0.04 -0.09 -0.06 -0.06 -0.03 -0.07 -0.04 - -0.01
STlag - - - - - - - - - -
- - - - - - - - - -
Nogales - -0.323* - 0.482** - -0.347** - -0.504*** - -
- -0.13 - -0.17 - -0.11 - -0.13 - -
Laredo - - - - - - - -0.985** - -
- - - - - - - -0.34 - -
EaglePass - 0.397*** -0.550** -0.831*** - 0.301** - 0.226* - -
- -0.1 -0.17 -0.11 - -0.09 - -0.11 - -
Hidalgo - -0.622* - -0.691* - -0.759** - 1.361*** - -
- -0.27 - -0.35 - -0.23 - -0.26 - -
Douglas - - - 0.588*** -0.380** -0.654*** - - 0.089** 0.137***
- - - -0.14 -0.14 -0.09 - - -0.03 -0.02
DelRio - 0.370*** - - - 0.274*** 0.363** 0.531*** - -
- -0.09 - - - -0.08 -0.12 -0.08 - -
Columbus -0.490** -0.844*** - 0.562*** - - - - - 0.076**
-0.18 -0.11 - -0.16 - - - - - -0.03
Presidio - - 0.571** 0.836*** - - - - - -
- - -0.19 -0.12 - - - - - -
Plag - - - - - - - 0.218* - -
- - - - - - - -0.1 - -
SanLuis 2.194** 3.363*** - - - 1.456** - - - -
-0.76 -0.49 - - - -0.52 - - - -
Pdummy - -4900.395* - 11015.278*** - -5425.731** -9949.483** -10189.525*** - -
- -2220.98 - -2745.07 - -1911.79 -2819.25 -1981.17 - -
Tdummy - - -9805.377* -9607.347** - 4371.037* - - - -
- - -4269.43 -3011.19 - -2199.76 - - - -
Corn - - -2614.082* -1939.734* - - - - - -
- - -1220.12 -854.44 - - - - - -
Drought - - - - - - - - - -
- - - - - - - - - -
USfeeder - - - 297.549* - - - -312.022*** - -43.773*
- - - -120.07 - - - -94.61 - -19.38
USfed - - 723.036** 627.343*** - - -428.243* -517.080*** - -
- - -222.53 -154.56 - - -189.34 -131.32 - -
exchrate - - - - - - 5263.334** 5902.563*** - -
- - - - - - -1587.83 -1116.61 - -
MXfeeder - -164.743* - - -233.659* -216.056** - 224.101** - -
- -79.49 - - -94.49 -66.22 - -78.38 - -
oil - - - -193.215* - - - 264.620*** - -
- - - -91.89 - - - -71.61 - -
Jan -6825.484* -5726.433** - - -6541.849** -6945.355*** - - - -
-2702.63 -1859.68 - - -2338.64 -1622.13 - - - -
Feb -10439.207*** -9887.562*** - - -7600.789** -9366.635*** - - - -
-2812.88 -1948.71 - - -2631.28 -1818.04 - - - -
Mar -10814.118*** -11304.616*** - - -8138.029** -9887.904*** - 6422.236** - 1038.754*
-2686.93 -1864.18 - - -2513.85 -1727.15 - -2179.18 - -448.66
Apr -9454.799** -9152.346*** - - -7787.519** -8942.235*** - - - -
-2678.5 -1842.39 - - -2412.48 -1662.81 - - - -
May -10147.043*** -10529.765*** - 7009.707* -8333.679** -10225.332*** - - - -
-2669.4 -1831.82 - -2755.68 -2415.13 -1671.49 - - - -
Jun -10643.126** -9878.168*** - 13030.459*** -7414.198* -9829.252*** -9048.592* -10162.502*** - -
-3517.4 -2428.26 - -3398.09 -3250.11 -2260.65 -3668.32 -2573.41 - -
Jul -11693.809** -11025.872*** - 11093.344** -9043.785* -11541.624*** - -8256.848** - -
-4038.86 -2794.92 - -3939.14 -3655.93 -2549.09 - -3065.62 - -
Aug -12264.244** -11505.512*** - 12510.379** -7812.301* -11158.831*** - -9764.724** - -
-4076.12 -2829.02 - -3993.4 -3810.86 -2644.85 - -3074.45 - -
Sep -10382.900* -9709.347*** - 12052.565** - -10134.095*** - -8044.402** - -
-4081.71 -2823.57 - -3879.92 - -2592.18 - -3021.44 - -
Oct - - - - - - - -4313.010* -1505.418* -1373.077***
- - - - - - - -2178.62 -583.95 -411.79
Nov 8966.401*** 9846.724*** - -5261.340* - 5951.691*** - - -1232.581* -1533.913***
-2208 -1550.4 - -2341.08 - -1589.49 - - -499.6 -346.09
Trend - -418.295* - 653.468* - - - - - -
- -213.36 - -257.28 - - - - - -
Trend2 - 9.795** - -20.328*** 8.185* 9.242*** - 8.844** - -
- -3.06 - -3.38 -3.74 -2.6 - -3.07 - -
_cons - - - - - 30745.933* - - - -
- - - - - -15248.12 - - - -
* p < 0.05, ** p < 0.01, *** p < 0.001
Standard errors are given below coffeicients in parenthesis.