the effects of bag house fines and incomplete combustion
TRANSCRIPT

K
SCHOOL OF
CIVIL ENGINEERING
INDIANA
DEPARTMENT OF TRANSPORTATION
ii. ii
m111MI1
ijl.^ij; fifj
mm
i iiii
JOINT HIGHWAY RESEARCH PROJECTFinal ReportPHWA/IN/JHRP-90/10
THE EFFECTS OF BAG HOUSE FINESAND INCOMPLETE COMBUSTIONPRODUCTS IN A DRUM DRIER ON THECHARACTERISTICS OF ASPHALTPAVING MIXTURES - PHASE II
J. D. Lin
:
:
i
i
:
:
5
j
l><*o^
PURDUE UNIVERSITY

i "'".''' v
-V" %'
...-.. ..
(
. '

JOINT HIGHWAY RESEARCH PROJECTFinal ReportFHWA/IN/JHRP-90/10
THE EFFECTS OF BAG HOUSE FINESAND INCOMPLETE COMBUSTIONPRODUCTS IN A DRUM DRIER ON THECHARACTERISTICS OF ASPHALTPAVING MIXTURES - PHASE II
J. D. Lin

Final Report
The Effects of Bag House Fines and Incomplete CombustionProducts in a Drum Drier on the Characteristics of Asphalt
Paving Mixtures - Phase II
To: Harold L. MichaelJoint Highway Research Project
From: Leonard E. WoodResearch Engineer
August 22, 199
Project: C-36-6II
File: 2-4-36
This letter will serve to transmit the Final Report titled"The Effects of Bag House Fines and Incomplete Combustion Productsin a Drum Drier on the Characteristics of Asphalt Paving Mixtures -
Phase II". It was prepared by J. D. Lin and L. E. Wood andrepresents the work of J. D. Lin of our staff.
This report concentrates on the effects of bag house fines oncharacteristics of asphalt paving mixtures and contains 10chapters. Chapter 1 presents a general overview of the project andits objectives. Chapter 2 presents a brief literature review ofpertinent technical articles dealing with bag house fines. Chapter3 describes the materials and the equipment used in the study.Chapter 4 details the laboratory procedures followed in the study.Chapter 5 outlines the experimental design of the study. Chapter6 covers the influence of bag house fines on asphalt mastics.Chapter 7 presents the influence of various bag house fines onasphalt paving mixtures. The effects of bag house fines on theability of asphalt paving mixtures to resist aging, moisture anddensification is covered in Chapter 8. Chapter 9 examines theinfluence of particle size of the bag house fines on asphalt pavingmixtures. A summation of the study is presented in Chapter 10.
This report is presented for review and approval as evidenceof fulfillment of the objectives of this project.
Res»ectfully,
fonard E. WoodResearch Engineer
Crc
LEW:cr
cc: A. G. AltschaefflD. AndrewskiJ. L. ChameauW. F. ChenW. L. DolchA. R. FendrickJ. D. FrickerD. W. Halpin
K. R. HooverC. W. LettsC. W. LovellD. W. LucasH. L. MichaelD. C. NelsonB. K. PartridgeG. J. Rorbakken
C. F. ScholerG. B. SchoenerK. C. SinhaC. A. VenableT. D. White
Digitized by the Internet Archive
in 2011 with funding from
LYRASIS members and Sloan Foundation; Indiana Department of Transportation
http://www.archive.org/details/effectsofbaghousOOIinj

Final Report
THE EFFECTS OF BAG HOUSE FINES AND INCOMPLETECOMBUSTION PRODUCTS IN A DRUM DRIER ON THE
CHARACTERISTICS OF ASPHALT PAVING MIXTURES - PHASE II
by
J. D. Lin
Joint Highway Research Project
Project No.: C-36-6IIFile No. : 2-4-36
Prepared for an InvestigationConducted by the
Joint Highway Research ProjectEngineering Experiment Station
Purdue University
in cooperation with theIndiana Department of Transportation
and the
U.S. Department of TransportationFederal Highway Administration
The opinion, findings and conclusions expressed in thispublication are those of the authors and not necessarilythose of the Federal Highway Administration
Purdue UniversityWest Lafayette, Indiana
August 22, 199

•CHNiCAL 3 SPORT STanOaSD TITLE s *Gc
i 1. 3«porr No. 1 1. io»trnmtnt Accimon No. J. Recipient i Catalog No.
FHWA/IN/JHRP-90/10
4. Tifl* ana Suortn* 5. Report Dot*
The Effects of Baghouse Fines and Incomplete CombustionProducts in a Drum Drier on the Characteristics of
Aug. 22, 1990
6. P«rtormtna; Organization Caa»
Asphalt Paving Mixtures Phase II
7. Aunt on j; 3. Performing Organization Roporr No.
J. D. LinJHRP-90 /L0
9. Performing Orgonixofton Nam* and Address 10. Ward Unit No.
Joint Highway Research ProjectCivil Engineering Building II. Conrrocf or Granf No.
Purdue University-
Vest Lafayette, IN 4 7907 13. Typ« or S •oort and P «nod Cav«r«a
Final Reporc12. Sponsoring Agency Nome and Aaaftl"
Indiana Department of TransportationState Office Building100 N. Senate Avenue * Sponsoring Agency -ja*
Indianapolis, IN 4602-
15. Supplementary Notes
Prepared in cooperation with the U.S. Department of Transportation, Federal HighwayAdministration. Study title is "The Effects of Baghouse Fines and Incomplete Com-
bustion Products in a Drum Drier on the Characteristics of Asphalt Paving Mixtures".
16. Ab.troet ^n extensive laboratory study of the asphalt paving mixtures containing
baghouse fines has been conducted through seven sets of experimental designs to char-
acterize the performance of pavement. Marshall size specimens of asphalt paving mix-
tures with different k-inds and amounts of baghouse fines were fabricated using the
gyratory testing machine. The following techniques were used to evaluate the
influence of the various variables upon mechanical properties such as: gyratory para-
meters, resilient modulus, indirect tensile strength, indirect creep, and Hveem
stability tests to evaluate their mechanical properties. In addition, in the asphalt
paving mixtures, asphalt cement was replaced with baghouse fines in order to maintain
a constant volume of asphalt cement plus baghouse fines. The evaluation was conducted
under the simulation of plant aging, environmental aging, moisture damage, and traffic
densification.The gyratory stability index and gyratory e lasto-plastic index can be used
to determine the effect of baghouse fines on asphalt paving mixtures during specimen
fabrication. The resilient modulus, indirect tensile strength, and Hveem stability
decrease significantly with higher amounts of baghouse fines. Artificial aging pro-
cesses to simulate pavement performance caused an increase in resilient modulus and
the indirect tensile strength as well as a reduction in failure tensile strain. The
effect of water sensitivity of asphalt paving mixture decreased with increasing amount
of- asphalt cement or with decreasing of baghouse fines/asphalt cement ratio. Densi-
fication of asphalt paving mixtures produces higher indirect tensile strength, but it
also decreased the resilient modulus. The resilient modulus value was insensitive to
the gradation of baghouse fines or mineral fillers, but the indirect tensile strength'*IfraacoH c i rrn ! f • r in r Ur T-.'f-ri fi'nar finog (T fllleTS-
17. Key Wordl
baghouse fines, mineral fillers, gyra-
tory testing machine, aging, watersensitivity, densificat ion, resilientmodulus, indirect tensile strength,indirect creep test
13. Distribution Stotement
No restrictions. This document is avail-
able to the public through the National
Technical Information Service, Springfield,
VA 22161
19. Security Clainl, (oi ti'S report)
line lass if ied
2C Security Cloini. (oi this page)
Unc lass if ied
21. No. ol ?og*«
178
22. P"C*
Farm DOT F 1700.7 1B-S9)

TABLE OF CONTENTS
LIST OF TABLES iv
LIST OF FIGURES vi
ABSTRACT x
CHAPTER 1 INTRODUCTION 1
1 .
1
Background 1
1 .
2
Problem Statement 2
1 . 3 Obj ect of the Study 3
1 .
4
Organization of this Study 4
1 . 5 Implementation 4
CHAPTER 2 LITERATURE REVIEW 5
2 • 1 Introduction 5
2 . 2 Baghouse Fines 6
CHAPTER 3 MATERIALS AND EQUIPMENT 12
3 . 1 Materials 12
3.1.1 Baghouse Fines 12
3.1.2 Mineral Fillers 12
3.1.3 Aggregate 12
3.1.4 Asphalt Cement 14
3 . 2 Equipment 18
CHAPTER 4 LABORATORY TEST PROCEDURES 19
4 . 1 Introduction 19
4 .
2
Testing Sequence and Flow Chart 19
4 .
3
Preparation, Batching, and Mixing 214 . 4 Compaction 2 4
4.5 Resilient Modulus Test 254 . 6 Indirect Tensile Test 27
4.7 Hveem Stabilometer Test 284.8 Water Sensitivity Test 284 . 9 Environmental Aging Test 29
4.10 Creep Test 30
4.11 Asphalt Cement and Baghouse Fines Test Method 31
CHAPTER 5 DESIGN OF THE EXPERIMENT 32
5.1 Introduction 32
5 . 2 Response Variables 3 3
5.2.1 Gyratory Indices 33
5.2.2 Resilient Modulus (MR )34

11
5.2.3 Stabilometer Resistant Value (S-Value) 345 = 2.4 Indirect Tensile Value 355.2.5 Creep Compliance and Mix Stiffness 365.2.6 Temperature Susceptibility of Asphalt Mastics 375.2.7 Water Susceptibility of Asphalt Paving
Mixtures 395 . 3 Independent Variables 39
5.3.1 Type of Baghouse Fines 395.3.2 Percent of Baghouse Fines 395.3.3 Type of Binder 405.3.4 Percent of Binder 405.3.5 Compactive Effort 405.3.6 Aging Time 405.3.7 Water Saturation 415.3.8 Testing Temperature 41
5 . 4 Experimental Designs 415,
5,
5
5
5,
5,
5.
......... o 43. . o 43
4347
Design No. 6 4 7
Design No. 7 47
Design No. 1,
Design No. 2.
Design No. 3,
Design No. 4,
Design No. 5,
CHAPTER 6 BAGHOUSE FINES AND ASPHALT MASTICS 51
6.1 Baghouse Fines 516.1.1 The Particle Size Distribution 516.1.2 The Surface Area 516.1.3 The Specific Gravity 546.1.4 The Mineralogical Composition 566.1.5 PH Value 566.1.6 The Unit Weight and Void Content 56
6 . 2 Asphalt Mastics 596.2.1 Penetration Test 616.2.2 Viscosity Test 626.2.3 Softening Point and Ductility 666.2.4 PI Temperature Susceptibility 726.2.5 PR Temperature Susceptibility 726.2.6 VTS Temperature Susceptibility 746.2.7 PVN Temperature Susceptibility 74
6 . 3 Summary of Results 776.3.1 Characteristics of Baghouse Fines and
Mineral Fillers 776.3.2 Characteristics of Fines/Asphalt Mastics 80
CHAPTER 7 ASPHALT PAVING MIXTURES WITH BAGHOUSE FINES 83
7 . 1 Introduction 837 . 2 Method of Analysis 847.3 Results 85
Ill
7.4 Analysis of Results 867.4.1 Gyratory Parameters 867.4.2 Resilient Modulus 907.4.3 Indirect Tensile Strength and Hveem Stability 94
7 . 5 Summary of Results 99
CHAPTER 8 CONDITIONING OF ASPHALT PAVING MIXTURES WITH BAGHOUSEFINES 101
8.
1
Introduction 1018 . 2 Aging Behavior 103
8.2.1 Gyratory Parameters 1038.2.2 Resilient Modulus 1078.2.3 Hveem Stability 1088.2.4 Indirect Tensile Strength 1148.2.5 Summary of Results 120
8 . 3 Water Sensitivity 1218.3.1 Gyratory Parameters 1228.3.2 Resilient Modulus 1258.3.3 Indirect Tensile Strength 1318.3.4 Summary of Results 134
8 . 4 Densification 1348.4.1 Gyratory Parameters 13 5
8.4.2 Resilient Modulus 1388.4.3 Indirect Tensile Strength 1438.4.4 Summary of Results 14 8
CHAPTER 9 COMPARISON OF ASPHALT PAVING MIXTURES WITH BAGHOUSEFINES AND MINERAL FILLERS 149
9 . 1 Introduction 1499.2 Results of Experimental Design No. 6 150
9.2.1 Gyratory Parameters 1509.2.2 Resilient Modulus 1539.2.3 Indirect Tensile Strength 155
9.3 Effect of Baghouse Fines or Mineral Fillers Gradationon Asphalt Paving Mixtures 1559.3.1 Gyratory Parameters 1559.3.2 Resilient Modulus 1589.3.3 Indirect Tensile Strength 165
9 . 4 Summary of Results 168
CHAPTER 10 CONCLUSIONS 170
LIST OF REFERENCES 174
APPENDICES 178

IV
LIST OF TABLESTable
3.1 Chemical and Physical Properties of the Fly Ash 15
3 .
2
Specific Gravity of Aggregate 15
3 .
3
Aggregate Gradations Used for Various Baghouse FinesContents 16
3 .
4
Physical Properties of Asphalt Cement 17
5.1 Experimental Design No. 1:
Asphalt Mastics Characteristics (Baghouse Fines) 42
5.2 Experimental Design No. 2: Asphalt Paving MixturesContaining Baghouse Fines 44
5.3 Experimental Design No. 3: Asphalt Paving MixturesContaining Constant Volume of Baghouse Fines and Asphalt.Cement (Aging) 4 5
5.4 Experimental Design No. 4: Asphalt Paving MixturesContaining Constant Volume of Baghouse Fines and AsphaltCement (Water Sensitivity) 46
5.5 Experimental Design No. 5: Asphalt Paving MixturesContaining Fines and Fillers (Densification) 48
5.6 Experimental Design No. 6: Asphalt Paving Mixtures withMineral Fillers or Baghouse Fines 48
5.7 Experimental Design No. 7: Asphalt Paving MixturesContaining Different Gradation of Mineral Fillers orBaghouse Fines 50
6.1 Particle Size Distribution of Baghouse Fines 53
6 .
2
Physical Properties of Baghouse Fines 55
6 .
3
Oxide Analysis of Baghouse Fines 58
6.4 Volume (%) of Free Asphalt 60
6.5 ANOVA Results for Penetration (Design No. 1) 63
6.6 ANOVA Results for Viscosity (Design No. 1) 63
6.7 ANOVA Results for Softening Point (Design No. 1) 69
6.8 ANOVA Results for Ductility (Design No. 1) 69

V
6.9 ANOVA Results for Temperature Susceptibility 69
7.1 ANOVA Results for Gyratory Parameters (Design No. 2) 81
7.2 ANOVA Results for Resilient Modulus (Design No. 2) ...... 91
7.3 ANOVA Results for Indirect Tensile Strength(Design No. 2) 95
7.4 ANOVA Results for Hveem Stability (Design No. 2) 96
8.1 ANOVA Results for Gyratory Parameters (Design No. 3)..... 106
8.2 ANOVA Results for Resilient Modulus (Design No. 3) 113
8.3 ANOVA Results for Hveem Stability (Design No. 3) 115
8.4 ANOVA Results for Indirect Tensile Strength(Design No. 3) 115
8.5 ANOVA Results for Failure Tensile Strain (Design No. 3) .118
8.6 ANOVA Results for Gyratory Parameters (Design No. 4) ....123
8.7 ANOVA Results for Resilient Modulus (Design No. 4) 129
8.8 ANOVA Results for Indirect Tensile Strength(Design No. 4) 132
8.9 ANOVA Results for Failure Tensile Strain (Design No. 4).. 132
8.10 ANOVA Results for Gyratory Parameters (Design No. 5).... 137
8.11 ANOVA Results for Resilient Modulus (Design No. 5) 139
8.12 ANOVA Results for Indirect Tensile Strength(Design No. 5) 144
9.1 ANOVA Results for Gyratory Parameters (Design No. 6) ....151
9.2 ANOVA Results for Resilient Modulus (Design No. 6) 151
9.3 ANOVA Results for Indirect Tensile Strength(Design No. 6) 156
9.4 ANOVA Results for Gyratory Parameters (Design No. 7) ....159
9.5 ANOVA Results for Resilient Modulus (Design No. 7) 162
9.6 ANOVA Results for Indirect Tensile Strength(Design No. 7) 166
VI
LIST OF FIGURESFigure
3 .
1
The Location of Baghouse Fines 13
3 .
2
Gradation and Job Mix Formula of Aggregate 16
3 .
3
Gyratory Testing Machine 18
4.1 Flow Chart of Asphalt Mastics Test Procedure 20
4 .
2
Flow Chart of Asphalt Paving Mixtures Test ProcedureUnder No Conditioning 2
4 .
3
Flow Chart of Asphalt Paving Mixtures Test Under Agingand Water Saturation Conditioning 22
4.4 Flow Chart of Asphalt Paving Mixtures Test ProcedureUnder Densification Conditioning 2 3
4 .
5
Curing of Asphalt Paving Mixtures Specimens 31
6.1 The Particle Size Distribution of Baghouse Fines 52
6.2 X-ray Diffraction of Baghouse Fines No. 5 (Continue) .... 57
6.2 X-ray Diffraction of Baghouse Fines No. 10 57
6.3 Effect of Baghouse Fines Concentration on Penetrationof Asphalt Mastics (39.2°F) (Continue) 65
6.3 Effect of Baghouse Fines Concentration on Penetrationof Asphalt Mastics (77°F) (Continue) 64
6.3 Effect of Baghouse Fines Concentration on Penetrationof Asphalt Mastics ( 115°F) 65
6.4 Effect of Baghouse Fines Concentration on Viscosity ofAsphalt Mastics (140°F) 67
6.5 Effect of Baghouse Fines Concentration on Viscosity ofAsphalt Mastics (275°F) 67
6.6 Effect of Baghouse Fines Concentration on Ductility ofAsphalt Mastics 70
6.7 Effect of Baghouse Fines Concentration on the SoftPoint of Asphalt Mastics 71
6.8 Effect of Baghouse Fines Concentration on thePenetration Index of Asphalt Mastics 73

Vll
6.9 Effect of Baghouse Fines Concentration on thePenetration Ratio of Asphalt Mastics 75
6.10 Effect of Baghouse Fines Concentration on theViscosity Temperature Susceptibility 76
6.11 Effect of Baghouse Fines Concentration on thePenetration Viscosity Susceptibility (77°F-275°F)(Continue) 78
6.11 Effect of Baghouse Fines Concentration on thePenetration Viscosity Susceptibility (140°F-275°F) 79
6 . 12 % Va Versus log Viscosity at 140°F 82
6.13 % Va Versus log Viscosity at 275°F 82
6 . 14 % Va Versus A SF 82
7.1 Gyratory Indices of Asphalt Paving Mixtures ContainingBaghouse Fines (Design No. 2) 88
7.2 Resilient Modulus of Asphalt Paving Mixtures ContainingBaghouse Fines (Design No. 2) 92
7.3 Indirect Tensile Strength of Asphalt Paving MixturesContaining Baghouse Fines (No. 2) 97
7.4 Hveem Stability of Asphalt Paving Mixtures ContainingBaghouse Fines (Design No. 2) 98
8.1 Gyratory Indices of Asphalt Paving Mixtures ContainingBaghouse Fines/Asphalt Cement Content (BH + AC =
Constant; Design No. 3) 105
8.2 Resilient Modulus of Asphalt Paving Mixtures ContainingBaghouse Fines/Asphalt Cement Content (BH + AC =
Constant; Design No. 3) 109
8.3 Resilient Modulus of Asphalt Paving Mixtures withOptimum Asphalt Cement Content at Different AgingConditions (Design No. 3) Ill
8.4 Hveem Stability of Asphalt Paving Mixtures ContainingBaghouse Fines/Asphalt Cement Content(BH + AC = Constant; Design No. 3) 116
8.5 Indirect Tensile Strength of Asphalt Paving MixturesContaining Baghouse Fines/Asphalt Cement Content(BH + AC = Constant; Design No. 3) 117

Vlll
8.6 Failure Tensile Strain of Asphalt Paving MixturesContaining Baghouse Fines/Asphalt Cement Content(BH + AC = Constant; Design No. 3) 119
8.7 Gyratory Indices of Asphalt Paving Mixtures ContainingBaghouse Fines/Asphalt Cement Content(BH + AC = Constant; Design No. 4) 124
8.8 Resilient Modulus of Asphalt Paving Mixtures ContainingBaghouse Fines/Asphalt Cement Content(BH + AC = Constant; Design No. 4) 126
8.9 Resilient Modulus of Asphalt Paving Mixtures ContainingBaghouse Fines/Asphalt Cement Content at DifferentTesting Temperature (Design No. 4) 127
8.10 Resilient Modulus Ratio and Tensile Strength Ratio ofAsphalt Paving Mixtures (Design No. 4) 130
8.11 Indirect Tensile Strength of Asphalt Paving MixturesContaining Baghouse Fines/Asphalt Cement Content(BH + AC = Constant; Design No. 4) 133
8.12 Gyratory Indices of Asphalt Paving Mixtures ContainingBaghouse Fines (Design No. 5) 136
8.13 Resilient Modulus of Asphalt Paving MixturesContaining Baghouse Fines (Design No. 5) 14
8.14 Resilient Modulus of Asphalt Paving MixturesContaining Different Types of Baghouse Fines(Design No. 5) 142
8.15 Indirect Tensile Strength of Asphalt Paving MixturesContaining Different Baghouse Fines (Design No. 5) 145
8.16 Indirect Tensile Strength of Asphalt Paving MixturesContaining Different Types of Baghouse Fines(Design No. 5) 147
9 .
1
Gyratory Parameters of Asphalt Paving MixturesContaining Mineral Fillers (Design No. 6) 152
9.2 Resilient Modulus of Asphalt Paving Mixtures ContainingMineral Fillers (Design No. 6) 154
9.3 Indirect Tensile Strength of Asphalt Paving MixturesContaining Mineral Fillers (Design No. 6) 157
9.4 Gyratory Indices of Asphalt Paving Mixtures ContainingMineral Fillers or Baghouse Fines (Design No. 7) 160

IX
9.5 Unit Weight of Asphalt Paving Mixtures ContainingMineral Fillers or Baghouse Fines (Design No. 7) 161
9.6 Resilient Modulus of Asphalt Paving Mixtures ContainingMineral Fillers or Baghouse Fines (Design No. 7) ....... 163
9.7 Indirect Tensile Strength of Asphalt Paving MixturesContaining Mineral Fillers or Baghouse Fines(Design No. 7) 167
f

ABSTRACT
Asphalt paving mixtures that are to be utilized in paving
structures must have properties that will prevent or minimize the
following primary distress modes: (1) thermal or shrinkage
cracking, (2) fatigue cracking, (3) permanent deformation or
rutting, (4) moisture sensitivity. An extensive laboratory study
of the asphalt paving mixtures containing baghouse fines has been
conducted through eleven sets of experimental designs to
characterize the performance of pavement. Marshall size specimens
of asphalt paving mixtures with different kinds and amounts of
baghouse fines were fabricated using the gyratory testing machine.
The following techniques were used to evaluate the influence of the
various variables upon mechanical properties, gyratory parameters,
resilient modulus, indirect tensile strength, indirect creep, and
Hveem stability tests. In addition, in the asphalt paving
mixtures, asphalt cement was replaced with baghouse fines in order
to maintain a constant volume of asphalt cement plus baghouse
fines. The evaluation was conducted under the simulation of plant
aging, environmental aging, moisture damage, and traffic
densification.
The gyratory stability index and gyratory elasto-plastic index
can be used to determine the effect of baghouse fines on asphalt
paving mixtures during specimen fabrication. The resilient
modulus, indirect tensile strength, and Hveem stability decrease
significantly with higher amounts of baghouse fines. Artificial

XI
aging processes to simulate pavement performance caused an increase
in resilient modulus and the indirect tensile strength as well as
a reduction in failure tensile strain. The effect of water
sensitivity of asphalt paving mixture decreased with increasing
amount of asphalt cement or with decreasing of baghouse
fines/asphalt cement ratio. Densification of asphalt paving
mixtures produces higher indirect tensile strength, but it also
decreased the resilient modulus. The resilient modulus value was
insensitive to the gradation of baghouse fines or mineral fillers,
but the indirect tensile strength increased significantly with
finer fines or fillers.
The results of this study will provide the highway engineer
with a better understanding of the effect of different factors on
the mechanical properties of hot asphalt paving mixtures with
baghouse fines.

CHAPTER 1
INTRODUCTION
1 . l Background
The Clean Air Act of 1970 was established by Environmental
Protection Agency. In 1973 the Environmental Protection Agency
issued strict air pollution control codes and standards for the
emission of particles from the asphalt plants into the atmosphere.
All new plants purchased after June, 197 3 are limited to 0.04 gm of
particles per cubic foot of exhaust gas (1)
.
This strict regulation has forced contractors to equip their
plants with a baghouse as either a primary or secondary dust
collector (2) , or as a replacement of wet scrubber. Baghouses have
been installed instead of wet scrubber systems for primarily
economic reasons. In contrast to wet scrubbers the baghouse is
easier to maintain. It does not need water. It does not have any
problem concerned with the disposal of a water slurry. To offset
the cost of the baghouse and the associated dust disposal problems,
many plants are adding the collected dust to asphalt paving
mixtures. This feedback of collected dust to mixtures has led to
a considerable debate (3)
.
The reuse of baghouse fines has been associated by different
investigators with poor compaction, bleeding and flushing, and
tender mixes. Those baghouse fines are often much finer than the
traditional mineral fillers that have been used in the past years.
Unfortunately, the research on the characteristics of baghouse
fines has not been sufficient. As a result a number of highway

2
agencies have been concerned as to the proper handling and use of
baghouse fines. Thus, it is worthwhile to investigate and evaluate
the effects of baghouse fines on asphalt paving mixtures.
1.2 Problem Statement
The Indiana Department of Transportation has experienced early
distresses in some asphalt pavement sections. The increased use of
drum mixers and the resulting incorporation of baghouse fines in
asphalt paving mixtures has caused a question to be raised
concerning the influence of those baghouse fines upon the behavior
of asphalt paving mixtures. The baghouse fines can serve either as
binder extender or stiffener depending on their characteristics.
There is a need to better understand the role of such baghouse
fines.
An investigation of all possible asphalt pavements in which
baghouse fines have been incorporated would necessarily entail a
research effort that is widespread and time consuming. Therefore,
it is the intention of this study to conduct a laboratory
investigation to evaluate the effects of baghouse fines in
laboratory to evaluate their mechanical properties and performance
of asphalt paving mixtures.
There are several unanswered questions in the area of asphalt
paving mixtures with baghouse fines; a long term aging and water
damage, a long term effect of traffic densification, stability and
compactibility, and the interaction between asphalt and baghouse
fines. There is a need for assurance that those effects would not

be harmful.
1.3 Object of the Study
The object of this study is to characterize typical baghouse
fines which are found in Indiana and to determine their influence
on the behavior of asphalt paving mixtures. This would be
accomplished by concentrating in the following areas:
1. Mineralogical Characterization and grain size analysis of
typical baghouse fines found in Indiana.
2. Physical tests on asphalt mastics that have different amounts
of various baghouse fines.
3. Mechanical tests on asphalt paving mixtures that have
different amounts of various baghouse fines and asphalt
cement.
4. Evaluation of the effect of weathering by means of artificial
laboratory conditioning on asphalt paving mixtures with
baghouse fines.
The mechanical properties are determined by means of resilient
modulus, indirect tensile strength test, indirect creep tests, and
Hveem stability test.
1.4 Organization of this Study
This study contains ten chapters. Chapter 2 is the literature
review of work included on the area of mineral fillers and baghouse
fines. It also contains some theoretical background for several
tests that were used to determine major mechanical properties

4
evaluated in this study. Chapter 3 contains a description of the
materials and equipment. Chapter 4 describes the test procedures
employed in this study. Chapter 5 contains an outline of the
experimental designs conducted in this study. Chapter 6 presents
the research work conducted to evaluate and characterize the
asphalt mastics. Chapters 7 and 8 present the evaluation and
characterization of the asphalt paving mixtures with different
amount of baghouse fines under long term performance and
densification. Chapter 9 contains the comparison between baghouse
fines and mineral fillers. Chapter 10 contains the summary and
conclusions and the recommendation for further research
respectively.
1.5 Implementation
Implementation of the results of this study could lead to a
better utilization of baghouse fines in the Indiana Department of
Transportation asphalt paving mixtures. The end result would
increase the service life and lower maintenance costs of asphalt
pavements in Indiana.
5
CHAPTER 2
LITERATURE REVIEW
2.1 Introduction
According to ASTM standard specification D2 4 2 (4) , the
definition of mineral filler is finely divided mineral matter such
as rock dust, slag dust, hydrated lime hydraulic cement, fly ash,
loess or other suitable mineral matter. At the time of use it
shall be sufficiently dry to flow freely and essentially free from
agglomerations. A great deal of research has been conducted on
mineral filler and its effect on asphalt paving mixtures. Baghouse
fines can also be considered as a mineral filler, however, because
they are a rather recent development relatively little research has
been done on them. They differ from the more traditionally used
mineral fillers in that they can contain a much larger percentage
of very fine (< 10 jum) particles.
2.2 Baghouse Fines
Scrimsher (5) examined the effect of different baghouse fines
on Hveem mix design parameters. He found that using a maximum of
2% baghouse fines content has little effect on Hveem stability.
When an extremely fine mineral dust is added to an asphalt mixture
as a filler to correct a deficiency in the aggregate gradation, a
reduction in the asphalt content is necessary to prevent asphalt
pavement flushing and instability. He recommended that the
contractors should be permitted to introduce as much as 2% baghouse
fines into the weigh box at the pugmill. The report also
6
recommended that the actual baghouse fines used in the laboratory
mixture design can be used in asphalt paving mixtures in the field.
Erick and Shook (6) conducted a study on baghouse fines in
1976 and 1977. They analyzed the properties of several typical
baghouse fines, fine-asphalt mixtures, and asphalt-aggregate-fines
mixtures. They compared these properties to known properties of
commercial mineral fillers and filler-asphalt mixtures and
determined to what extent the reintroduction of baghouse fines
affects asphalt mastic properties, asphalt mixture properties and
asphalt pavement performance. They concluded that baghouse fines
were satisfactory for use in the mix as long as the quality of the
parent aggregate is satisfactory.
Ward and McDougal (7) studied baghouse fines from 16 sources
with a wide variety of particle size distribution, mineralogical
composition, and other physical properties. Three different types
of baghouse fines with varying degrees of fineness were studied to
evaluate the influence upon the Hveem stability and dynamic
modulus. The baghouse fines, a particle size less than 20 nm,
tended to combine with asphalt cement and act as an asphalt
extender. The report concluded that when baghouse fines were used
in proper quantities, it was not harmful to the paving mix.
Baghouse fines could serve as an inexpensive and beneficial
substitute for part of the asphalt cement to decrease the cost of
asphalt pavement.
Dukatz and Anderson (8) studied the influence of baghouse
fines and cyclone fines on the properties of Marshall samples. It
7
was found that flow and stability were relatively insensitive to
source of the filler or the asphalt, but that the creep compliance
of the samples was affected by the filler and the source of the
asphalt. They also attempted to relate mixture compactibility to
the stiffness of the filler-asphalt mixtures and found a limited
correlation, indicating that the stiffer filler-asphalt mixtures
reduce mixture compactibility.
Gietz (9) using the Rolling Thin Film Oven studied the
viscosity of baghouse fines-asphalt mixtures. There was a
significant variation in the behavior of different fines after
aging in the RTFO test. Temperature susceptibility and hardening
were different for the different baghouse fines and for the two
different asphalt cements. There was a strong interaction between
the fines and the asphalt cement.
Kandhal (10) examined eight baghouse fines from the primary
collector. He verified Rigden's (13) earlier relationships between
stiffening of filler/asphalt mixtures and the void characteristics
of the dry-compacted dust. From the study Kandhal developed some
specification criteria for baghouse fines. The bulk volume of the
fines to asphalt cement in a mixture should be less than 50%, if
the bulk volume is greater than 50%, a check on softening point
must be performed. If the bulk volume of the fines is greater than
50%, the maximum allowable increase in softening point is less than
11°C. The percentage of retained tensile strength, based on the
Idaho Moisture Sensitivity Test should be greater than 50%. He
found no satisfactory relationship between the consistency of the

8
filler-asphalt mixtures and size distribution, particle shape,
surface area, plasticity index, or mineralogical composition of the
baghouse fines.
Maupin (11) conducted a study on the effect of baghouse fines
on mixture voids, stability, and penetration time. He found that
increases in baghouse fines content produced large changes in
mixture behavior and design properties.
Anderson and Tarris (12,1) studied the addition of dust
collector fines to asphalt paving mixtures. Thirty-three different
baghouse fines were sampled in order to establish the day to day
and within day variability of baghouse fines. The variability of
gradation was largely related to efficiency of the primary
collector. Without a primary dust collector, baghouse fines can be
very coarse, ranging up to the No. 30 sieve mesh with as little as
20-30% passing No. 200 mesh. They also discussed a considerable
variety of collection equipment and practices. In another study
(14,15) different proportions of primary and secondary dusts were
added to mixtures and the Marshall properties were measured. The
fineness of the dust was not a good predictor of the stiffening
effect of the dust, although the finer dusts did produce
appreciable stiffening. The baghouse fines that significantly
stiffened the mixtures affected the air voids and reduced the
compactibility of the mixtures. The finer dusts also acted as
asphalt extenders and reduced the air voids. Filler/asphalt ratio
might be a better control criteria than merely setting an upper
limit on the percentage of baghouse fines. When baghouse fines

9
were used as an asphalt extender the mix properties could be very
sensitive to change in asphalt content. When baghouse fines were
added at a plant, or when baghouse fines were introduced to an
existing design, a complete mixture design, including a voids
analysis, should be performed.
Anani and Al-Abdul-Wabhab (16) analyzed the Marshall tests on
asphalt paving mixtures that had various ratios of filler to
baghouse fines. The results of this study indicated that baghouse
fines could greatly affect the properties of the mixture, such as
increased optimum asphalt content, increased mixture stability, and
decreased resistance of the mixture to water damage. One factor
that controls the effect of baghouse fines on asphalt mixture was
the percentage of carbon. The larger percentage of carbon in the
baghouse fines would decrease the stability loss of the mixture and
increase the optimum asphalt content.
Kriech (17) studied factors which influence Type IV sand mix
performance. The report concluded that baghouse fines were a major
contributor to reduction of permeability in sand mixture which
results in lower skid numbers. The level of baghouse fines in the
asphalt film played the important roles. First it swells the
asphalt film larger by acting as an extender. This lowers the
volume of air voids and significantly reduced the number of
interconnected voids. Secondly, the baghouse fines stiffen the
asphalt changing its rheological properties and making it more
difficult to achieve proper mixture density.
Anderson (18,19,20) used Marshall compaction to form specimens

10
which were tested for indirect resilient modulus, creep, and
strength. Additional specimens were made using a kneading
compactor. These specimens were tested for compressive creep and
dynamic modulus. The mechanical properties of the mixes were then
compared with the stiffness of the dust-asphalt mixtures and to the
physical properties of the dust to determine the effect of
different dust-asphalt ratios and dust sources on the properties of
hot asphalt paving mixtures. Anderson concluded that maximum
filler-asphalt cement ratio of 1.2 to 1.5 based upon weight should
be recommended. The 1.2 ratio had been used successfully in
laboratory and field experiments, and this may be tentatively
increased to 1.5 based upon the results of this study. The
fillers, baghouse fines, or other fines that were used for mixture
design must be the same as those that were used for producing the
mixture at the asphalt paving facility. Legislative attempts to
dispose of large quantities of various fines, such as fly ash, into
asphalt paving mixtures should be carefully evaluated in laboratory
experiments and field trials. The stiffening effect of baghouse
fines on asphalt mixtures could be effectively measured during
mixture design through viscosity, penetration, softening point,
bulk density for dry compacted dust, or kerosene absorptivity
testing. Based upon the current state of the art, there was
nothing to suggest that filler or baghouse fines levels that
produce stiffening ratios greater than 10 to 15 were harmful to
asphalt pavement construction or road performance. Baghouse fines
or fillers that produce very large stiffening ratios may, however,
11
lead to brittle mixes or mixes that are hard to compact.
In summary, the review of the literature on baghouse fines
indicates:
(1) The size of the dust collected from baghouse collection
systems depends on the pavement aggregate, the plant
configuration, and the operating condition at the plant.
(2) When possible, the mix design should be incorporate the
same baghouse fines that will be used in the actual
mixture.
(3) The behavior of baghouse fines in asphalt paving mixtures
cannot be predicted on basis of fineness alone.
Additional testing of the baghouse fines is required in
order to predict its behavior.
(4) Baghouse fines can be act as an asphalt extender, but it
can also interact with asphalt cement and stiffen the
asphalt mastics.

12
CHAPTER 3
MATERIALS AND EQUIPMENT
3.1 Materials
3.1.1 Baghouse Fines
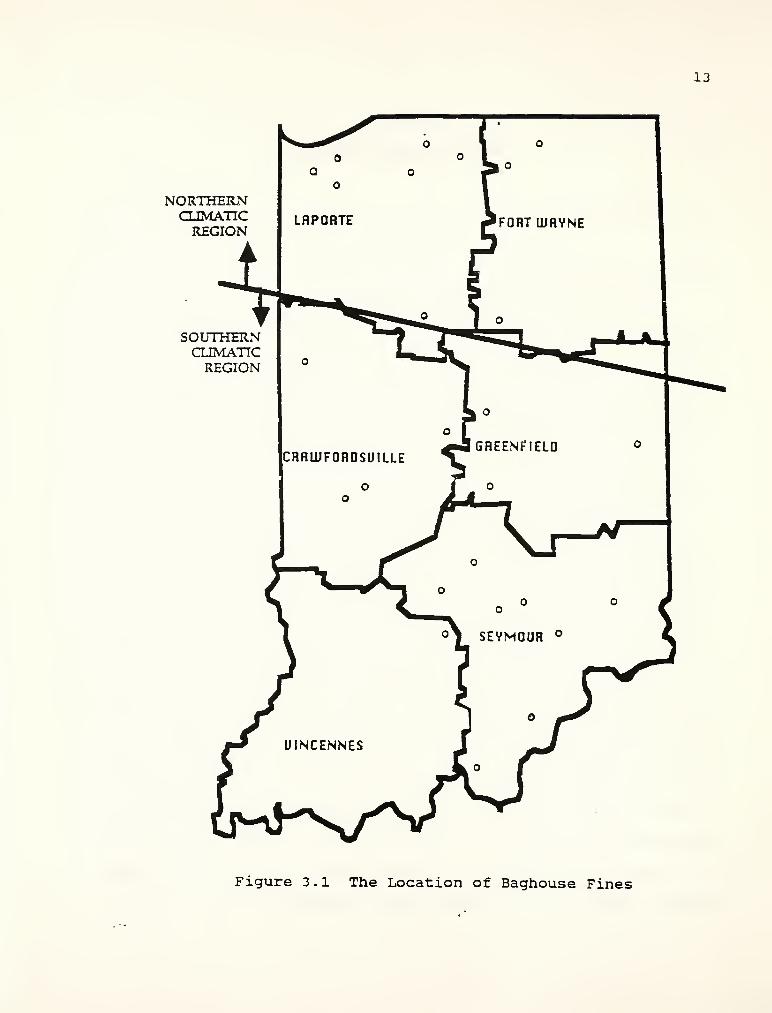
Thirty different samples of baghouse fines were collected from
asphalt plants by INDOT personnel. Figure 3.1 given is the
location of asphalt plants. These baghouse fines represent
different generic types depending on the aggregate processed. The
characteristics of those baghouse fines are reported in Chapter 6.
3.1.2 Mineral Fillers
Four different kinds of mineral fillers were collected from
cement concrete and bituminous laboratory at Purdue University.
They represent a wide range of chemical and physical properties of
mineral fillers available. The single Class C fly ash is an
excellent fly ash and is utilized widely in Indiana portland cement
concrete. It was collected from the Rockport Station of the
Indiana and Michigan Electric Co. Microsilica EMS 900 silica fume
supplied by Elkem Chemicals Inc., Pittsburgh, PA, was used in this
study. The data provided by supplier show that this product
contains mainly amorphous Si02 and carbon. The content of
amorphous Si02 is stated about 95% by weight. The particle sizes
of silica fume are nearly all less than 5 /xm. It has a bulk
density about 0.125 g/cm3 and specific gravity of 2.2. Hydrated
13
NORTHERNCLIMATICREGION
SOUTHERNCLIMATICREGION
Figure 3 . 1 The Location of Baghouse Fines

14
lime is commercially used for mineral filler in asphalt plants.
The main component is Ca(OH) 2/ it has a bulk density about 1.29
g/cm3, specific gravity of 2.72. Silica rock flour is also
commercially used as a mineral filler in asphalt plants. The main
component is Si02 . It has bulk density about 1.67 g/cm3, specific
gravity of 2.76. Table 3.1 shows the chemical and physical
properties of fly ash.
3.1.3 Aggregate
The aggregate used in the study was a limestone obtained from
the Erie Stone Company of Huntington, Indiana. The aggregate has
been stored in the Purdue Bituminous Laboratory and has been used
by many researchers. Its physical properties are shown in Table
3.2. Figure 3.2 presents the gradation of the limestone used in
the asphalt mixture design. Table 3.3 gives the gradation of the
asphalt paving mixtures used corresponding to each baghouse fines
content. The job-mix formula meets all the requirements of the
ASTM Standard Specification D3515 (21,22). Adjusting gradation by
the baghouse fines or mineral filler content is based on adjusting
formula suggested by Asphalt Institute MS-2 (22) or Caltrans (23) .
3.1.4 Asphalt Cement
The three grades of asphalt cement were used in this study:
an AC-5, AC-10, and AC-20. The asphalt cement was supplied by
Amoco, Whiting, Indiana. Their physical properties are shown in
Table 3.4.

15
Table 3.1 Chemical and Physical Properties of the Fly Ash
Si02 (%)
A1 2 3 (%)
Fe2 3 (%)
S i02+Al 203+Fe2 3 ( %
)
CaO (%)
MgO (%)
Loss of Ignition (%)
Specific Gravity
Mean Size /im
% > 45 lira
35.8
19.6
6.4
61.8
26.8
3.3
0.34
2.61
14
21
Table 3.2 Results of Tests on Aggregates
Size MaterialBulk
SpecificGravity*
ApparentSpecificGravity*
Absorption(%)
1/2 "-3/4" Limestone
3/8"-l/2" Limestone
#4 -3/8" Limestone
#4 -#8 Limestone
#8 -#30 Natural Sand
#30 -#50 Outwash Sand
#50 -#200 Natural Sand
Passing#200 Limestone
2.678 2.730
2.700 2.767
2.643 2.765
2.666 2.702
2.698 2.733
2.607 2.707
2.644 2.710
2.721
0.8
1.2
2.1
1.8
0.8
1.2
1.5
0.2
* - average of three determinations

16
Table 3.3 Aggregate Gradations Used for Various Baghouse FinesContents
Percent PassingSieve JMF JMF JMF JMF JMFNo. for 0% for 3.0% for 6.0% for 9.0%
3/4" 100 100 100 100 100
1/2" 90-100 94.7 94.8 95.0 95.1
3/8" - 84.0 84.5 85.0 85.5
No. 4 44-74 56.5 57.5 59.0 60.3
No. 8 28-58 39.3 41.2 43.0 44.8
No. 16 20-46 28.7 30.9 33.0 35.1
No. 30 13-33 18.1 20.5 23.0 25.5
No. 50 5-21 7.4 10.2 13.0 15.8
No. 100 3-16 4.3 7.1 10.0 12.9
No. 200 2-10 3.0 6.0 9.0

17
Table 3.4 Physical Properties of Asphalt Cement
Before Aging AC-
5
AC- 10 AC-20
Penetration (l/10mm) 112 60 46
(25°C)Soft Point (°C) 44 49 50
Ductility (cm) > 150 > 150 > 150
(25°C)Viscosity (poise) 551 1275 2378
(60°C)Viscosity (cSt) 198 312 356
(135°C)
After Aging 2 . 5 hrs
Penetration (l/10mm) 99 50 " 38
(25°C)Soft Point (°C) 45.5 50. 53.5
Ductility (cm) > 150 > 150 > 150
(25°C)Viscosity (poise) 689 2233 3714(60°C)Viscosity (cSt) 235 392 495
(135°C)-
After Aging 5.0 hrs
Penetration (l/10mm) 85 40 27
(25°C)
Soft Point (°C) 49.5 52.5 56.0
Ductility (cm) > 150 > 150 > 150
(25°C)Viscosity (poise) 1404 3656 5700(60°C)Viscosity (cSt) 490 875 2707(135°C)

18
3 . 2 Equipment
The major pieces of equipment used in this study include the
gyratory testing machine, the resilient modulus test equipment, the
indirect tensile test machine, the Hveem stabilometer and Riehle
compression machine, the Marshall testing equipment, the indirect
creep test equipment, the forced draft oven (aging) , low
temperature chamber and the asphalt cement physical properties test
equipments. They are described in the following sections. The
test procedures are not included herein, but they are presented in
later chapters relevant to their usages. Figure 3.3 show the
gyratory testing machine used in this study.
Figure 3.3 Gyratory Testing Machine

19
CHAPTER 4
LABORATORY TEST PROCEDURES
4 .
1
Introduction
This chapter presents the laboratory test procedures and
testing sequence in this study. It includes the descriptions of
(1) flow chart and testing sequence, (2) preparation, batching, and
mixing, (3) compaction, (4) resilient modulus test, (5) indirect
tensile test, (6) Hveem stability test, (7) environmental aging
test, (8) water sensitivity test, (9) creep test, (10) asphalt
physical properties test.
4.2 Testing Sequence and Flow Chart
The testing sequence on the specimens was designed so that as
much information and parameters as possible could be collected from
every laboratory testing sample. The general testing sequence and
flow chart for the asphalt mastic in this study is presented in
Figure 4.1. Figure 4.2 shows the general testing sequence and flow
chart for asphalt paving mixtures containing different baghouse
fines and asphalt cement content. The resilient modulus is a non-
destructive test, so the same specimens were used repeatedly at
various temperatures and conditioning. After the resilient modulus
test had been performed on each specimen, some of specimens were
evaluated in the Hveem stabilometer or in the creep test and then
in the indirect tensile test.
The testing sequences for the asphalt pavinq mixture where the

'•Jaign
Bagnousa FinasWaigh
Asphalt Canant
20
Mixing
Asphalt Mastic
SofteningPoint Test
DuctivityTest
Penetration I
Test 39.2 Fl
ViscosityTest 140 F
viscosityTest 275 •
Penetration
j
Test 77 F I
I Penetration
i
I Test 115 Fj
Figure 4.1 Flow Chart of Asphalt Mastics Test Procedure
Prepare Bituminous Mixture
Compact Diametral TestSoecimens to an After-Construction
Air Void Level
UnconditionedSpecimens
Test Specimensat 41. 77. 104 F
Measure ResilientModulus and Static
Creep Modulus
Indirect Tensile Strengthand Failure Strains
Figure 4.2 Flow Chart of Asphalt Paving Mixtures Test ProcedureUnder No Conditioning
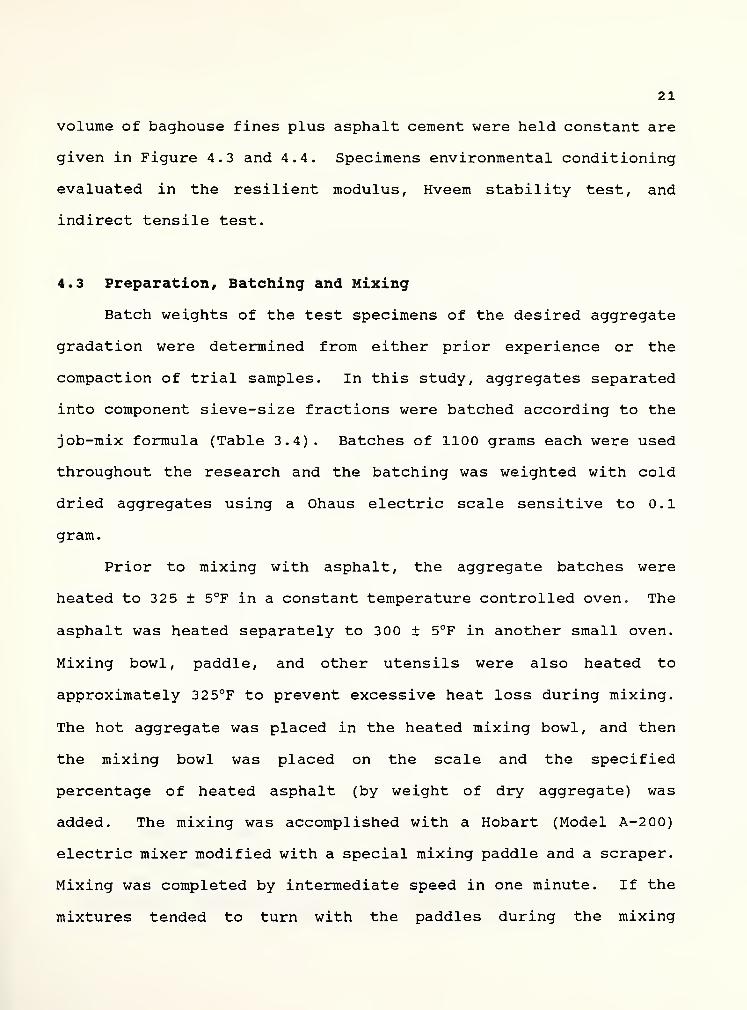
21
volume of baghouse fines plus asphalt cement were held constant are
given in Figure 4.3 and 4.4. Specimens environmental conditioning
evaluated in the resilient modulus, Hveem stability test, and
indirect tensile test.
4.3 Preparation, Batching and Mixing
Batch weights of the test specimens of the desired aggregate
gradation were determined from either prior experience or the
compaction of trial samples. In this study, aggregates separated
into component sieve-size fractions were batched according to the
job-mix formula (Table 3.4). Batches of 1100 grams each were used
throughout the research and the batching was weighted with cold
dried aggregates using a Ohaus electric scale sensitive to 0.1
gram.
Prior to mixing with asphalt, the aggregate batches were
heated to 325 ± 5°F in a constant temperature controlled oven. The
asphalt was heated separately to 300 ± 5°F in another small oven.
Mixing bowl, paddle, and other utensils were also heated to
approximately 325°F to prevent excessive heat loss during mixing.
The hot aggregate was placed in the heated mixing bowl , and then
the mixing bowl was placed on the scale and the specified
percentage of heated asphalt (by weight of dry aggregate) was
added. The mixing was accomplished with a Hobart (Model A-200)
electric mixer modified with a special mixing paddle and a scraper.
Mixing was completed by intermediate speed in one minute. If the
mixtures tended to turn with the paddles during the mixing

22
Prepare Bituminous Mixture
Initial Oven Heating of Bulk
Mixture - Four Hours 3 275 F
Compact 18 Diametral Test
Specimens to an After-ConstructionAir Void Level
Sroup Test SpecimensBased on Air Voids
UnconditionedSpecimens
Moisture ConditionSoecimens
ModifiedAASHTQ T 283
Test Specimens
at 41. 77. 104 F
Temoerature Condition(Accelerated Aging)
Specimens
Initial Aging
2 Days 9 140 F
1
Final Aging
5 Days 9 225 F
1
Test Specimens
at 41 F
Test Specimensat 41 F
Measure Resilient Modulus,
Indirect Tensile Strength
and Failure Strains
Measure ResilientModulus and Static
Creep Modulus
Figure 4 .
3
Flow Chart of Asphalt Paving Mixtures Test Under Agingand Water Saturation Conditioning

23
Prepare Bituminous Hixture
Initial Oven Heating of BulkHixture - Four Hours 9 Z75 F
Compact Uniaxial CompressionTest Specimens to An After-Construction
Air Void Leveli
Traffic Densif icatian ofSpecimens, Densify toRefusal at 140 F.
Group Test SpecimensBased on Air Voids
Test Specimensat 104 F
Measure ResilientModulus and Static
Creep Modulus
Figure 4.4 Flow Chart of Asphalt Paving Mixtures Test ProcedureUnder Densification Conditioning

24
operation, a spatula was inserted into the mixing bowl to increase
agitation. Care should be exercised to assume coating of all
aggregate particles. The mixing bowl and paddles were removed and
the adhered mixture was scraped off and the mixture was loosened
from the sides of the bowl with a large spatula.
The loose mixtures were subjected to two types of treatments
used in this study: no curing and aging to simulate asphalt plant
production, no curing of the mixture involved mixing followed by
compaction. Asphalt plant hardening was simulated by aging the
loose mixture in a force draft oven at 275°F for a period of 4
hours followed by compaction. The loose mixtures were transferred
to an 11" x 7" x 1 1/2" pan and placed in a Hotpack (Model 1412)
oven with forced draft air circulation. The open air temperature
was maintained at 275° ± 5°F.
4 . 4 Compaction
The gyratory compaction was accomplished using the gyratory
testing machine (Model 4C) as shown in Figure 3.4. The base plate,
mold were preheated at 24 0°F to 2 60°F. The gyratory chunk heater
should be turned on 1/2 hour prior to compaction and set for a
140°F temperature. The heated mold, base plate, and paper disc
were placed on the carving tray. Using a wide mouth funnel, empty
the contents of the pan into the mold. The flat side of a spatula
may be used to push the mixture into the mold to permit the funnel
to be removed. A paper disc was placed on the mixture and with a
4-inch diameter plunger compress the mixture was compressed by hand

25
until it was 3/8 to 1/2 inch below the top of the mold.
The mold was clamped in the GTM which has been previously set
for a 1 degree angle of gyration and different ram pressure.
Initial compaction was carried out in all cases with the oil-filled
upper roller and a specimen temperature of about 250 ± 5°F. Ram
pressures used were 100 or 200 psi. The conditions of the test
were chosen depending on simulating compaction in the field by
construction equipment and by traffic situation. The numbers of
revolutions used in the compaction were 30, 60, 120, and 180, also
depending on field or traffic condition. GTM was used to study
traffic densification at selected asphalt cement and baghouse fine
contents. The compacted specimens were allowed to cool prior to
being placed in a 14 0°F oven. The GTM was set at a 1 degree angle,
200 psi ram pressure, and 20 psi oil-roller pressure. The mold
chuck heater was set at 140°F and traffic densification simulation
test were performed up to a maximum of 300 revolutions. Initial
sample height readings were obtained prior to densification.
After completion of compaction in Marshall or the gyratory
testing machine, specimens were tested in indirect tensile strength
test, resilient modulus test, Hveem stability test, and unit weight
test. Figure 4.5 shows the specimen extruded from mold being
prepared for the various test.
4.5 Resilient Modulus Test
The height of the specimens were measured and then placed in
a constant temperature controlled room for at least 24 hrs. A
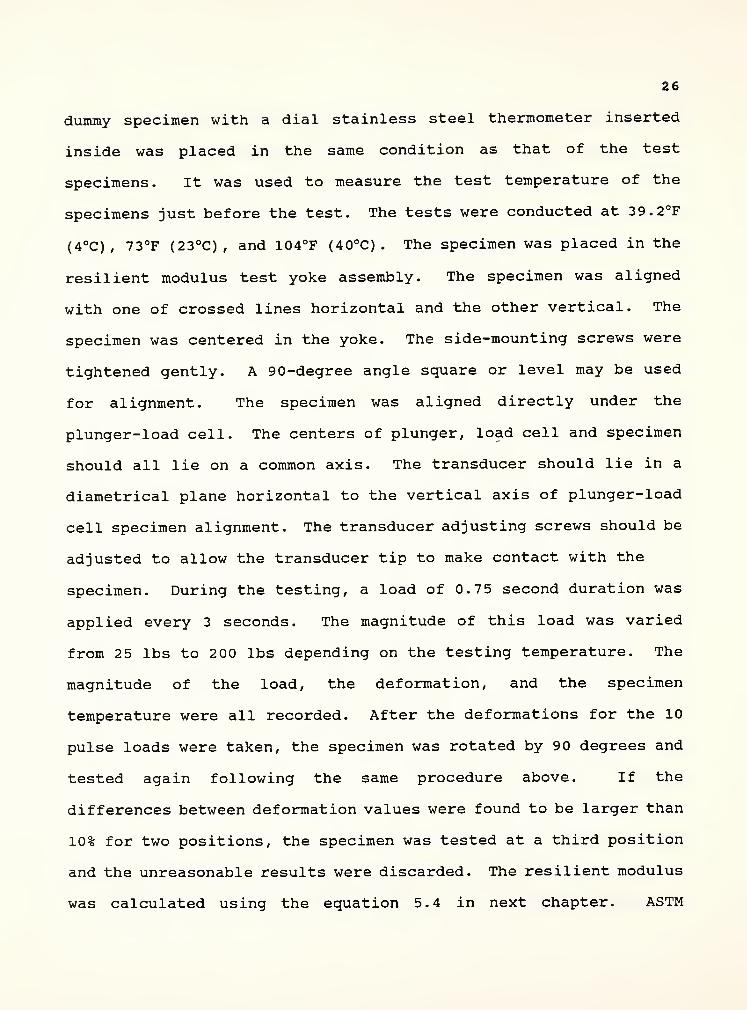
26
dummy specimen with a dial stainless steel thermometer inserted
inside was placed in the same condition as that of the test
specimens. It was used to measure the test temperature of the
specimens just before the test. The tests were conducted at 39.2°F
(4°C) , 73°F (23°C) , and 104°F (40°C) . The specimen was placed in the
resilient modulus test yoke assembly. The specimen was aligned
with one of crossed lines horizontal and the other vertical. The
specimen was centered in the yoke. The side-mounting screws were
tightened gently. A 90-degree angle square or level may be used
for alignment. The specimen was aligned directly under the
plunger-load cell. The centers of plunger, load cell and specimen
should all lie on a common axis. The transducer should lie in a
diametrical plane horizontal to the vertical axis of plunger-load
cell specimen alignment. The transducer adjusting screws should be
adjusted to allow the transducer tip to make contact with the
specimen. During the testing, a load of 0.75 second duration was
applied every 3 seconds. The magnitude of this load was varied
from 2 5 lbs to 2 00 lbs depending on the testing temperature. The
magnitude of the load, the deformation, and the specimen
temperature were all recorded. After the deformations for the 10
pulse loads were taken, the specimen was rotated by 90 degrees and
tested again following the same procedure above. If the
differences between deformation values were found to be larger than
10% for two positions, the specimen was tested at a third position
and the unreasonable results were discarded. The resilient modulus
was calculated using the equation 5.4 in next chapter. ASTM
27
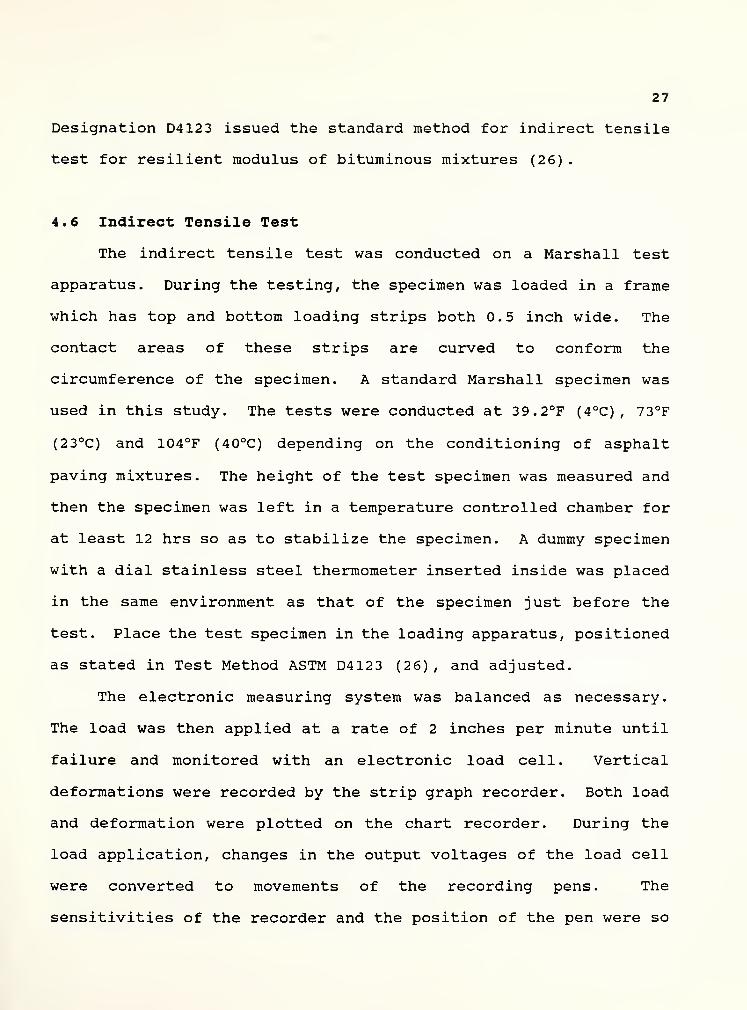
Designation D4123 issued the standard method for indirect tensile
test for resilient modulus of bituminous mixtures (26)
.
4.6 Indirect Tensile Test
The indirect tensile test was conducted on a Marshall test
apparatus. During the testing, the specimen was loaded in a frame
which has top and bottom loading strips both 0.5 inch wide. The
contact areas of these strips are curved to conform the
circumference of the specimen. A standard Marshall specimen was
used in this study. The tests were conducted at 39.2°F (4°C) , 73°F
(23°C) and 104°F (40°C) depending on the conditioning of asphalt
paving mixtures. The height of the test specimen was measured and
then the specimen was left in a temperature controlled chamber for
at least 12 hrs so as to stabilize the specimen. A dummy specimen
with a dial stainless steel thermometer inserted inside was placed
in the same environment as that of the specimen just before the
test. Place the test specimen in the loading apparatus, positioned
as stated in Test Method ASTM D4123 (26) , and adjusted.
The electronic measuring system was balanced as necessary.
The load was then applied at a rate of 2 inches per minute until
failure and monitored with an electronic load cell. Vertical
deformations were recorded by the strip graph recorder. Both load
and deformation were plotted on the chart recorder. During the
load application, changes in the output voltages of the load cell
were converted to movements of the recording pens. The
sensitivities of the recorder and the position of the pen were so

28
adjusted to obtain recording within the chart. The load at
failure, determined from the strip graph, was used to calculate the
indirect tensile strength.
4.7 Hveem Stabilometer Test
The Hveem stabilometer is the standard device that is used for
the Hveem stability (S-value) test. The standard procedures for
the stabilometer test is given in ASTM D1560 (27) or Asphalt
Institute MS-2 (22) were used in this study. In this test, the
horizontal pressure for a vertical load of 5000 lb was determined.
The displacement on specimen was also determined.
The horizontal pressure, deformation of specimen and vertical
load were used to calculate the stability of asphalt paving
mixtures. When the specimen height is not between 2.4 and 2.59
inches, a conversion chart was used applied to correct the Hveem
stability values to a effective specimen height of 2.5 inch.
4.8 Water Sensitivity Test
The test used in this study for evaluating resistance to
moisture damage was performed in accordance with AASHTO T-283 (28)
or ASTM D4867 (29) . They were a modification of the Lottman test
that was originally used by Tunnicliff . The procedure for moisture
sensitivity test is as follows:
(1) The specimen was saturated by submerging it in water and
applying a partial vacuum of 20-in. (508 mm) Hg for a short
time such as five minutes. The vacuum was removed and the

29
specimen submerged in water for 30 minutes.
(2) The bulk specific gravity by AASHTO T-186 or ASTM D2726. The
volume of absorbed water and degree of saturation was
determined.
(3) The vacuum saturated specimen was covered tightly with a
plastic film and placed in a plastic bag which in turn was
placed in freezer at 0.5 ± 3 . 6°F (-18 ± 2.0°C) for at least 16
hours
.
(4) After 16 hours, the specimens were placed into 140 ± 1.8°F
water bath for 24 hours. After 3 minutes of immersion and the
surface of the specimen had thawed the bag and wrapping from
the specimens were removed.
(5) After 24 hours in the 140°F (60°) water bath, the specimen was
removed and placed in a water bath already at 7 3°F for 2
hours. The specimen was tested in the resilient modulus
device and indirect tensile test apparatus.
4.9 Environmental Aging Test
The specimens were placed in a forced draft oven at a
temperature of 140°F (60°C) for approximately 48 hours plus or minus
3 minutes. After initial aging, the temperature of the forced
draft oven was elevated to 225°F for an additional 5 days of aging.
After aging, the specimens were removed from the oven and placed in
the temperature controlled chamber and stored for at least 12 hours
prior to determining the resilient modulus and indirect tensile
strength.

30
4.10 Creep Test
The indirect creep test makes use of the same kind of
apparatus as the resilient modulus device. The test specimen is
placed in the loading apparatus, positioned as stated in Test
Method ASTM D4123. The electronic measuring system is adjusted and
balanced following the instructions and operation manual (30) . The
specimen is preconditioned by applying a repeated havers ine to the
specimen without impact using a loading frequency of 1 cycle per
second for 1 minute. At the end of preconditioning step, the
horizontal recoverable deformation is measured to calculate the
resilient modulus in accordance with ASTM D4123. The
recommendation load range to be used for indirect tensile or creep
compliance testing is that to induce 5 to 10 percent of the
indirect tensile strength. After the samples had been
preconditioned, a static load was applied to the specimen for a
period of 10 minutes plus or minus 15 seconds. After the fixed
load had been applied for over 10 minutes, it should be released
and the rebound or resilient deformation recorded for another 10
minutes of no load. After 10 minutes, the amount of permanent
deformations should be measured and recorded from the strip chart
recorder.
4.11 Asphalt Cement and Baghouse Fine Test Method
1. Asphalt Physical Properties
(1) Penetration ASTM D5
(2) Soft Point ASTM D2398

31
(3) Ductility ASTM D113
(4) Viscosity ASTM D2170 & D2171
(5) Thin Film Oven Test ASTM D1754
Filler and Fines
(1) Hydrometer Method ASTM D422
(2) Kerosene Method
(3) Dry Compaction Method Modified ASTM D698
(4) PH Value
Figure 4.5 Curing of Asphalt Paving Mixtures Specimens

32
CHAPTER 5
DESIGN OF THE EXPERIMENT
5.1 introduction
The main objective of this portion of the study is to evaluate
the feasibility of using the gyratory testing machine to prepare
and design asphalt paving mixtures for long term performance which
contain baghouse fines. The long-term behavior of baghouse fines
asphalt mixtures are dependent upon the mineralogical
characteristics of baghouse fines, additional traffic compaction,
aging, temperature, and water sensitivity. The behavior of a wide
variety of baghouse fines asphalt mixtures have to be fully
understood in order to evaluate the feasibility of predicting long
time performance from short-term results, the effects of these five
factors.
Seven sets of experiments are presented that will focus on the
behavior of a wide variety of asphalt mastics and asphalt paving
mixtures containing baghouse fines and mineral fillers. Specimens
would be compacted with the gyratory machine and gyratory indices
will be obtained during the compaction process. These gyratory
indices are to be correlated to the long-term behavior of these
mixtures as measured by the resilient modulus, Hveem stability,
indirect tensile strength, creep, aging, and water sensitivity
test.
This chapter presents the description of the response
variables and independent variables used, and the experimental

33
design for investigation.
5.2 Response Variables
The response variables used in the laboratory study include
the gyratory indices generated by the gyratory testing machine
during the compaction process and other variables measured at some
specific times after compaction and conditioning.
5.2.1 Gyratory Indices
The gyratory motion experienced by specimen, as specimen is
being compacted by the gyratory testing machine, is recorded by a
gyrograph and the magnitude of gyratory angle is indicated by the
width of the gyrograph. Gyratory indices can then be obtained from
the gyrograph.
(1) Gyratory Elasto-Plastic Index (GEPI)
CFPT _ Minimum Intermediate Gyrograph Width5
,
Initial Gyratory Angle
(2) Gyratory Stability Index (GSI)
rqT _ Maximum Gyrograph Width5 2
Minimum Intermediate Gyrograph Width
(3) Gyratory Compactibility Index (GCI)
GCT _ Unit Weight at 3 Revolutions5 3
Unit Weight at 60 Revolutions

34
The gyrograph band width is obtained by counting vertically
the total number of small divisions over which the gyrograph
extends (Figure 3.5).
5.2.2 Resilient Modulus (MR )
The resilient modulus is defined as the ratio of the applied
stress to the resilient strain (recoverable strain) when a dynamic
load is applied.
P (v + 0.2734) 5 . 4* td
where P = the vertical load, pounds
d = horizontal deformation, inches
v = poissons ratio
t = thickness of specimen, inches
5.2.3 Stabilometer Resistance Value (S-Value)
The S-value is an empirical number which indicates the
stability or resistance of pavement materials to plastic
deformation and is generally used in the evaluation of asphalt
paving mixtures. Marshall size specimens are subjected in the
stabilometer to a vertical pressure of 400 psi at 60°C temperature.
The S-value is then calculated from the horizontal pressure and the
displacement of the specimen according to an empirical formula.

35
S = 22.2
-^L + 0.2225 ' 5
Py-Ph
where S = stabilometer value
D2 = displacement of specimen
Pv = vertical pressure (typically 400 psi)
Ph = horizontal pressure
= stabilometer pressure gauge reading taken at the instant
Pv is 400 psi
5.2.4 Indirect Tensile Value
The static indirect tensile test was included in this study.
The variables obtained from this test and used in the analysis are
Indirect Tensile Strength (ITS) , Indirect Tensile Stiffness (ITST)
,
Indirect Tensile Index (ITI) , and Failure Tensile Strain (35)
.
(1) Indirect Tensile Strength (ITS)
The Indirect Tensile Strength is defined as the maximum load
required to produce failure of a standard Marshall specimen in
Indirect Tensile Test. It is an indication of the ability of
an asphalt paving mixture to resist the tensile stress.
(2) Indirect Tensile Stiffness (ITST)
The Indirect Tensile Stiffness is defined as the slope of the
linear portion of the load-deformation plot obtained in
indirect tensile test. It is generally used in conjunction
with the indirect tensile strength to evaluate the performance
of asphalt paving mixtures.
36
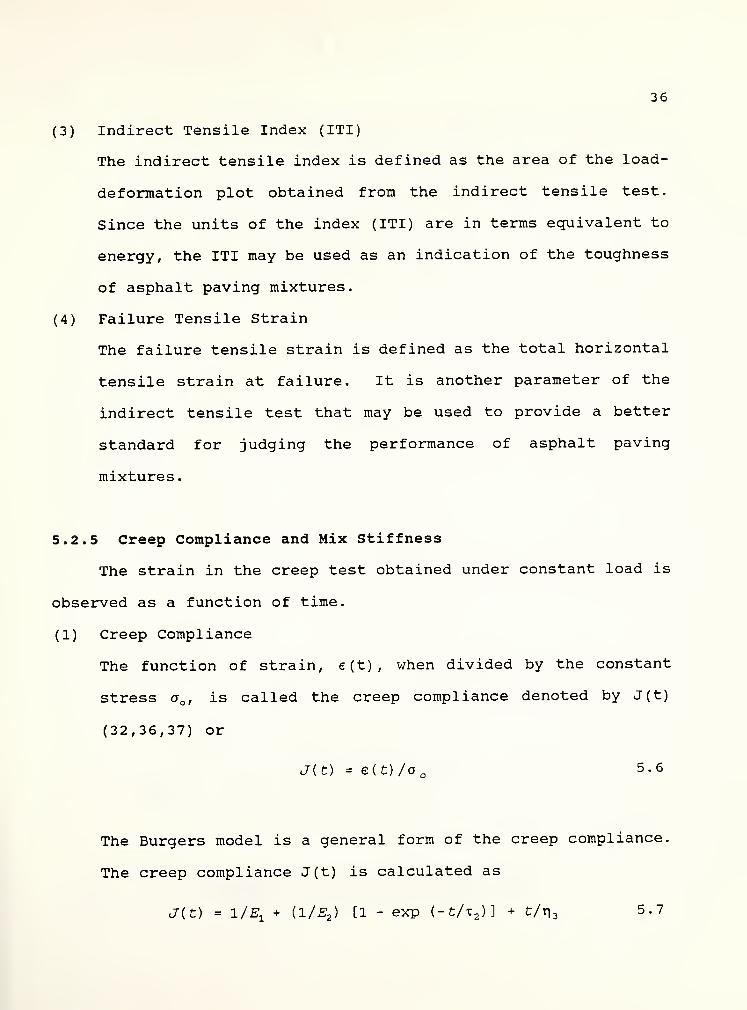
(3) Indirect Tensile Index (ITI)
The indirect tensile index is defined as the area of the load-
deformation plot obtained from the indirect tensile test.
Since the units of the index (ITI) are in terms equivalent to
energy, the ITI may be used as an indication of the toughness
of asphalt paving mixtures.
(4) Failure Tensile Strain
The failure tensile strain is defined as the total horizontal
tensile strain at failure. It is another parameter of the
indirect tensile test that may be used to provide a better
standard for judging the performance of asphalt paving
mixtures.
5.2.5 Creep Compliance and Mix Stiffness
The strain in the creep test obtained under constant load is
observed as a function of time.
(1) Creep Compliance
The function of strain, e (t) , when divided by the constant
stress a , is called the creep compliance denoted by J(t)
(32,36,37) or
J-(fc) = e(t)/o 5.6
The Burgers model is a general form of the creep compliance.
The creep compliance J(t) is calculated as
Jit) = 1/E1
+ (1/E2 ) [1 - exp (-t/x2 )] + t/n.3 5 - 7

37
where E x= the modulus of elasticity of Maxwell unit
E2= the modulus of elasticity of Voigt unit
n 3= the viscosity of the Maxwell unit
rj 2 = the viscosity of the Voigt unit
t 2 = the retardation time = r?2/ E 2
All the parameters can be obtained by nonlinear regression
analysis method.
(2) Mix Stiffness
Analysis of the data from the creep test can produce an
indicator of mixtures stiffness. This indicator is identified
as a modulus Smix (31) that defines the relationship between a
constant load and deformation as a function of time and
temperature.
Smix( T > t) = a a/e(T,c) 5.8
where a = axial loading stress
e(T,t) = total horizontal strain, at given time and
temperature
5.2.6 Temperature Susceptibility of Asphalt Mastics
Four measures of temperature susceptibility were used in this
study
.
(1) Penetration Index (PI)
FIT « *. • T j 20 - 500 FX K QPI = Penetration Index = 5.950 FX + 1

38
log (800) - log (Pen77 °F)where FX = 2_^ i 2
SP - 77 °F
SP = softening point of asphalt cement (°F)
(2) Penetration Ratio (PR)
PR = Penetration Ratio 5.10
Penetration at 39.2°F
Penetration at 77°Fx 100%
(3) Pen-Vis Number (PVN)
PVN1 = Pen-Vis Number (77°F - 275°F)
-1.5 (L - log t] 275 of ) .
5 ±1(L-M)
where L = 4.050 - 0.79674 log (Pen 77°F)
M = 3.46289 - 0.61094 log (Pen 77°F)
n = viscosity of asphalt cement at 275°F (135°C)
Pen = Penetration at 77°F (25°C)
PVN2 = Pen-Vis Number (77°F - 140°F)
f
6 .489 - 1.59 log P - log v 1 (-1 5) 5#121.050 - 0.2234 log P
where P = penetration at 77°F (25°C)
v = viscosity at 140°F (60°C)
(4) Viscosity Temperature Susceptibility (VTS)

39
VTS = Viscosity Temperature Susceptibility 5.13
lQg r\liO°F ~ lQg T1 275°F
log 140 °F - log 275 °F
where r? uo F = Viscosity at 140°F (60°C)
^275 f = Viscosity at 275°F (135°C)
5.2.7 Water Susceptibility of Asphalt Paving Mixtures
The evaluation of moisture damage can be made by calculating
the tensile strength ratio (TSR) or the resilient modulus ratio
(MMR) (32) as follows:
TSR _ ITS of condi ti oned specimens5
, .
ITS of control specimens
M„ of conditioned specimensMMR m —
S
_ . f_ 5.15MR of control specimens
5.3 Independent Variables
5.3.1 Type of Baghouse Fines
Fifteen different baghouse fines which are found in Indiana
were used to mix with the asphalt cement and asphalt aggregate
mixture for this study.
5.3.2 Percent of Baghouse Fines
The three levels of baghouse fines added were: 3%, 6% and 9%

40
by weight of the aggregate.
5.3.3 Type of Binder
The binders added to the aggregate were an AC-5, AC-10 and AC-
20.
5.3.4 Percent of Binder
The three or four levels of percent binder added were 4.0%,
4.5%, 5.0% and 5.0% by weight of the aggregate. The values used
were dependent upon the optimum asphalt content of the asphalt
mixture
.
5.3.5 Compactive Effect
The gyratory testing machine used in this study is capable of
producing different compactive efforts by varying the numbers of
revolutions and vertical ram pressures. The three main compactive
effects used were 60, 120 and 180 revolutions at 200 psi ram
pressure. The densification test required 300 revolutions to
compact the asphalt paving mixtures at 60°C temperature.
5.3.6 Aging Time
Aging time is the time between the compaction and the testing
of specimen. The three aging times used were 4 hours, 48 hours and
168 hours at different temperatures in a forced draft oven.
5.3.7 Water Saturation

41
The three conditions of water saturation used in this study
were dry, vacuum, and saturation at different stages to simulate
the water sensitivity in field.
5.3.8 Testing Temperature
The three levels of test temperature used in this study were
4°C, 23°C and 40°C (39.2°F, 73°F and 104°F) .
5.4 Experimental Designs
5.4.1 Design No. 1
The first set of experiments dealt with different types and
amounts of baghouse fines combined with asphalt cement. The
experimental design is shown in Table 5.1. The factors studied
were different types of baghouse fines (15 levels), percent of
baghouse fines (3 levels) , one type of asphalt cement (1 level)
,
and the testing temperature (5 levels) as independent variables.
The dependent variables are Penetration Index, Penetration Ratio,
Penetration Viscosity Number, Viscosity Temperature Sensitivity,
softening point temperature, ductility, viscosity, and penetration.
5.4.2 Design No. 2
The experimental design for the second set of experiments
dealt with different types and amounts of baghouse fines mixed with
aggregate containing different percents of asphalt cement by

42
Temp
(°F) 3% 6%
40 xx***xx
Pene.** 77 XX XX
115 XX XX
Table 5.1 Experimental Design No. 1
Asphalt Mastics Characteristics(Baghouse Fines)
Baghouse Fines****1 2
Baghouse Fines Content* (%)
9% 3% 6% 9% 3%
XX XX XX XX XX
XX XX XX XX XX
XX XX XX XX XX
6% 9%
XX XX
XX XX
XX XX
Visc.**135 XX XX XX XX XX XX XX XX XX
275 XX XX XX XX XX XX XX XX XX
SF.**
Duct.** 77
XX XX XX
XX XX XX
XX XX XX
XX XX XX
XX XX XX
XX XX XX
**
***
**** •
Percent of baghouse fines content = is not shown on the
table.
Pene. = Penetration, Vise. = Viscosity, SF = Softening
Point, Duct. = Ductility.
Test data; dependent variables: (1) penetration index,
(2) penetration ratio, (3) penetration viscosity number,
(4) viscosity temperature sensitivity.
Independent variable: type of baghouse fines (different
surface area, particle size, mineralogical composition,
unit weight, PH value)

43
weight.
The experimental design No. 2 is shown in Table 5.2. A
compactive effort of 2 00 psi vertical pressure was used. The main
factors studied were the different types of baghouse fines (3
levels) , the percent baghouse fines added, the percent asphalt
cement added (each 3 level) and revolutions in gyratory testing
machines (4 levels) . The compaction temperature was 250°F.
5.4.3 Design No. 3
Design No. 3 involved the oven simulated aging is executed at
different times in order to study the asphalt mixture performance.
The experimental design is presented in Table 5.3. Three aged
conditions (4 hrs, 48 hrs, 168 hrs) of the asphalt mixture are
used. The other factors studied are the baghouse fines (4 levels) ,
the testing temperature (3 levels) and the percent of asphalt
cement added to hold the volume of baghouse fines plus the binder
content constant.
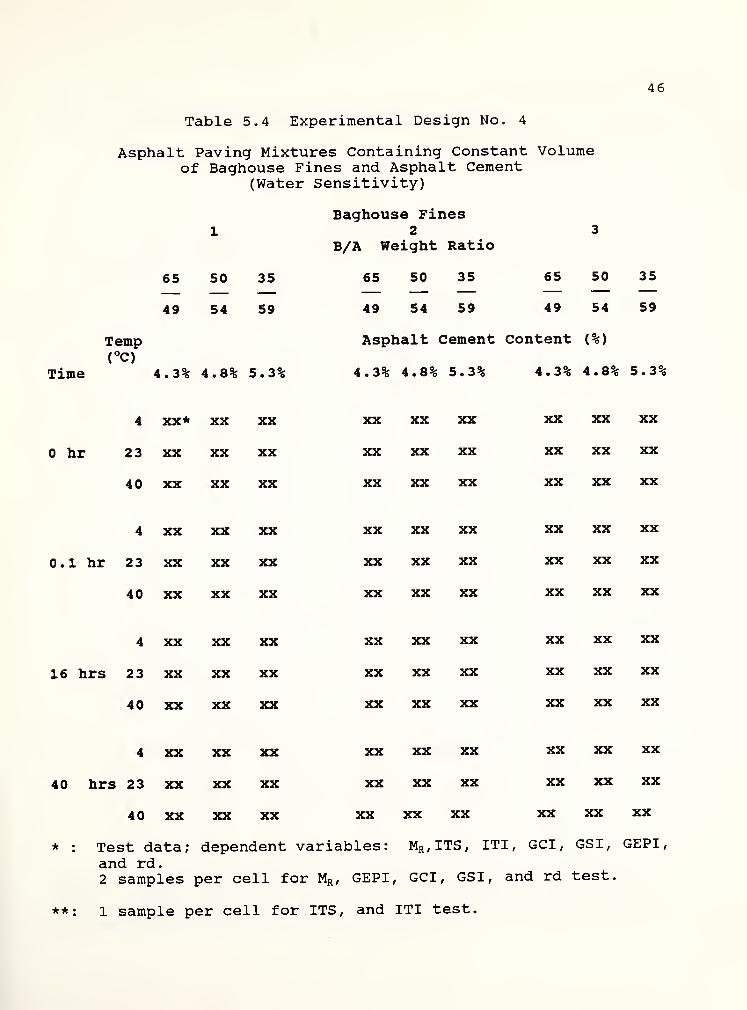
5.4.4 Design No. 4
Design No. 4 evaluated the effects of water on asphalt paving
mixtures containing baghouse fines. Three different moisture
conditions in asphalt paving mixtures were used. The experimental
design is shown in Table 5.4. Three moisture conditions (dry,
partial vacuum, saturated) , 3 levels of constant volumes of
baghouse fines and asphalt cement content, the baghouse fines (3
levels) , and the testing temperatures (3 levels) were independent

44
Table 5.2 Experimental Design No. 2
Asphalt Paving Mixtures Containing Baghouse Fines
Baghouse Fines12 3
Baghouse Fines Content (%)
3% 6% 9% 3% 6%
XX XX XX
XX XX XX
XX XX XX
XX XX XX
XX XX XX
XX XX XX
XX XX XX
XX XX XX
XX XX XX
XX XX XX
XX XX XX
XX XX XX
*: Test data; dependent variables: GEPI, GSI, GCI , MR , S, ITS, ITST, ITI
,
and rd.
2 samples per cell for GEPI, GSI, GCI, MR , S, ITS and rd test.
1 sample per cell for creep test.
AC Idevolutions 3% 6% 9%Content
(%)30 XX* XX XX
60 XX XX XX4.0%
12 XX XX XX
180 XX XX XX
30 XX XX XX
60 XX XX XX4.5%
120 XX XX XX
180 XX XX XX
30 XX XX XX
60 XX XX XX5.0%
120 XX XX XX
180 XX XX XX
X XX XX
X XX XX
X XX XX
X XX XX
X XX XX
X XX XX
X XX XX
X XX XX
XX XX XX
XX XX XX
XX XX XX
XX XX XX

45
Table 5.3 Experimental Design No. 3
Asphalt Paving Mixtures Containing Constant Volumeof Baghouse Fines and Asphalt Cement
(Aging)
Baghouse Fines12 3
B/A Weight Ratio
88 65 50 35 88 65 50 35 88 65 50 35
44 49 54 59 44 49 54 59 44 49 54 59
Temp Asphalt Cement Content (%)
(°C)
Aging 3.8% 4.3% 4.8% 5.3% 3.8% 4.3% 4.8% 5.3% 3.8% 4.3% 4.8% 5.3%
4 XX XX* XX XX XX XX XX XX XX XX XX XX
hr 23 xx xx xx xx xx xx xx xx xx xx xx xx
40 XX XX XX XX XX XX XX XX XX XX XX XX
4 XX XX XX XX XX XX XX XX XX XX XX XX
4 hrs 23 xx xx xx xx xx xx xx xx xx xx xx xx
40 XX XX XX XX XX XX XX XX XX XX XX XX
4 XX XX XX XX XX XX XX XX XX XX XX XX
48 hrs 23 xx xx xx xx xx xx xx xx xx xx xx xx
40 XX XX XX XX XX XX XX XX XX XX XX XX
4 XXXXXXXX XXXXXXXX XX XX XX XX
168 hrs 23 xx xx xx xx xx xx xx xx xx xx xx xx
40 XX XX XX XX XX XX XX XX XX XX XX XX
* : Test data; dependent variables: MR , S, ITS, ITI, GEPI, GSI, GCI and rd.
2 samples per cell for MR , GEPI, GSI, GCI and rd test.
**: 1 sample per cell for ITS, ITI, and S test.
46
Table 5.4 Experimental Design No. 4
Asphalt Paving Mixtures Containing Constant Volumeof Baghouse Fines and Asphalt Cement
(Water Sensitivity)
Baghouse Finesl 2 3
B/A Weight Ratio
65 50 35
49 54 59
Temp<°C)
Time 4.3% 4.8% 5.3%
65 50 35 65 50 35
49 54 59 49 54 59
Asphalt Cement Content (%)
4.3% 4.8% 5.3% 4.3% 4.8% 5.3%
4 XX* XX XX
hr 23 xx xx xx
40 XX XX XX
XX XX XX
XX XX XX
XX XX XX
XX XX XX
XX XX XX
XX XX XX
4 XX XX XX
. 1 hr 2 3 xx xx xx
40 XX XX XX
XX XX XX
XX XX XX
XX XX XX
XX XX XX
XX XX XX
XX XX XX
4 XX XX XX
16 hrs 23 xx xx xx
40 XX XX XX
XX XX XX
XX XX XX
XX XX XX
XX XX XX
XX XX XX
XX XX XX
4 XX XX XX
40 hrs 23 xx xx xx
40 XX XX XX
XX XX XX
XX XX XX
XX XX XX
XX XX XX
XX XX XX
XX XX XX
* : Test data; dependent variables: MR ,ITS, ITI , GCI , GSI, GEPI,
and rd.2 samples per cell for MR , GEPI, GCI, GSI, and rd test.
**: 1 sample per cell for ITS, and ITI test.
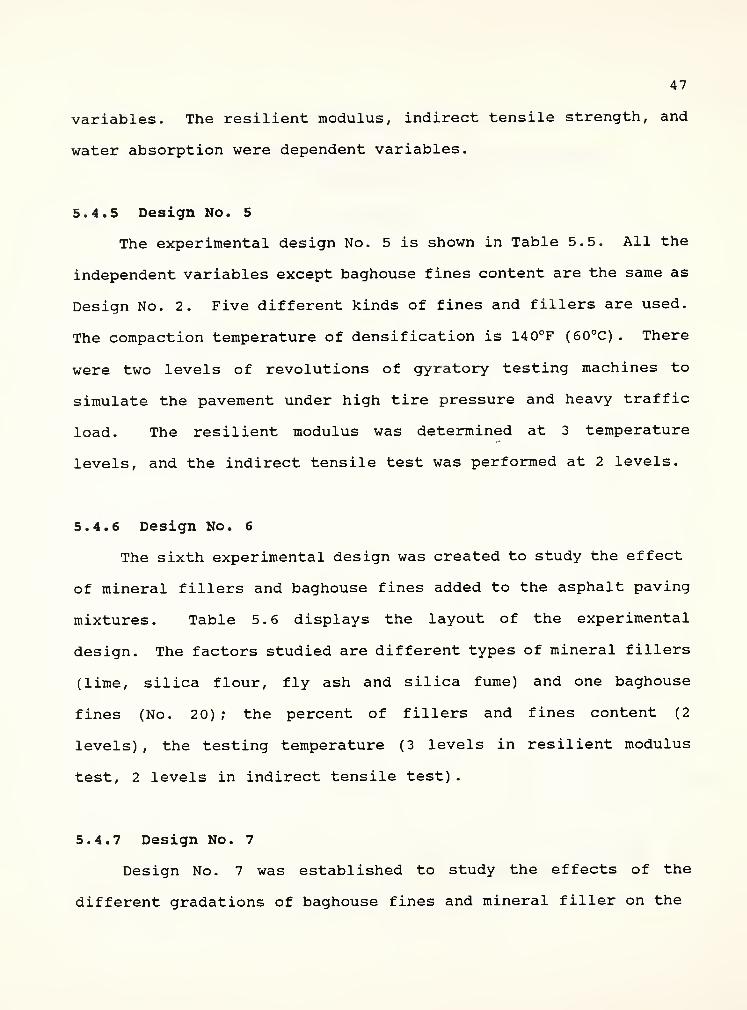
47
variables. The resilient modulus, indirect tensile strength, and
water absorption were dependent variables.
5.4.5 Design No. 5
The experimental design No. 5 is shown in Table 5.5. All the
independent variables except baghouse fines content are the same as
Design No. 2. Five different kinds of fines and fillers are used.
The compaction temperature of densification is 140°F (60°C) . There
were two levels of revolutions of gyratory testing machines to
simulate the pavement under high tire pressure and heavy traffic
load. The resilient modulus was determined at 3 temperature
levels, and the indirect tensile test was performed at 2 levels.
5.4.6 Design No. 6
The sixth experimental design was created to study the effect
of mineral fillers and baghouse fines added to the asphalt paving
mixtures. Table 5.6 displays the layout of the experimental
design. The factors studied are different types of mineral fillers
(lime, silica flour, fly ash and silica fume) and one baghouse
fines (No. 20) ; the percent of fillers and fines content (2
levels) , the testing temperature (3 levels in resilient modulus
test, 2 levels in indirect tensile test)
.
5.4.7 Design No. 7
Design No. 7 was established to study the effects of the
different gradations of baghouse fines and mineral filler on the
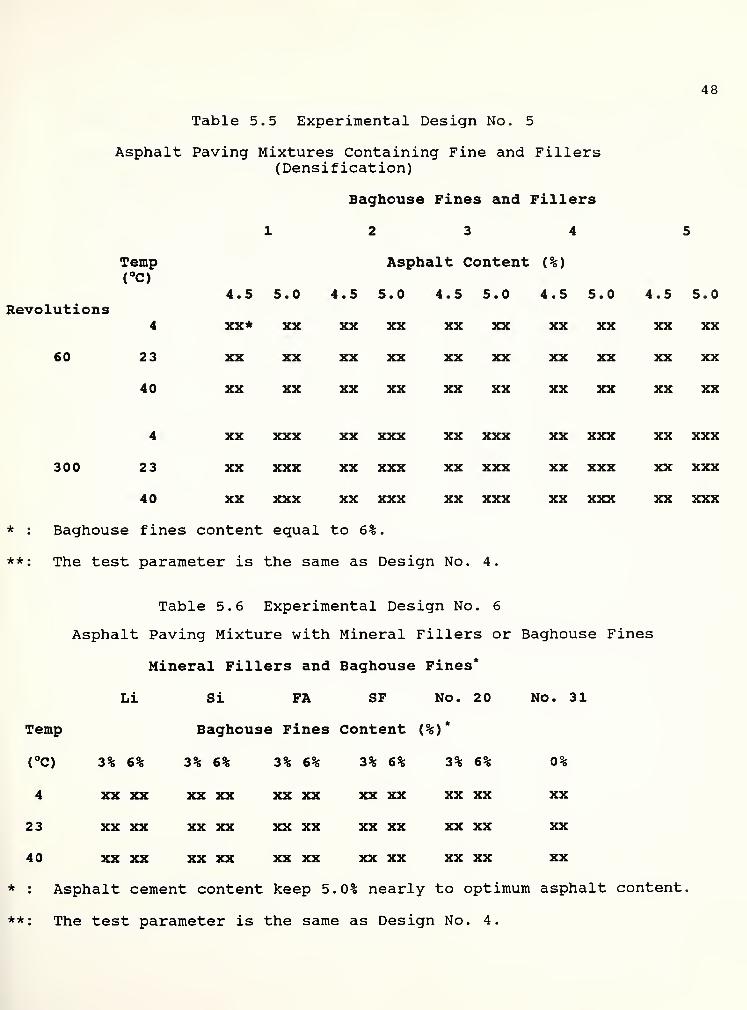
48
Table 5.5 Experimental Design No. 5
Asphalt Paving Mixtures Containing Fine and Fillers(Densification)
Baghouse Fines and Fillers12 3 4
Temp Asphalt Content (%)<°C)
4.5 5.0 4.5 5.0 4.5 5.0 4.5 5.0 4.5 5.0
XX* XX XX XX XX XX XX XX XX XX
XX XX XX XX XX XX XX XX XX XX
XX XX XX XX XX XX XX XX XX XX
XX XXX XX XXX XX XXX XX XXX XX XXX
XX XXX XX XXX XX XXX XX XXX XX XXX
XX XXX XX XXX XX XXX XX XXX XX XXX
Revolutions4
60 23
40
4
300 23
40
* : Baghouse fines content equal to 6%.
**: The test parameter is the same as Design No. 4.
Table 5.6 Experimental Design No. 6
Asphalt Paving Mixture with Mineral Fillers or Baghouse Fines
Mineral Fillers and Baghouse Fines*
Li Si FA SF No. 2 No. 31
Baghouse Fines Content (%)*
3% 6% 3% 6% 3% 6% 3% 6% 0%
XX XX XX XX XX XX XX XX XX
XX XX XX XX XX XX XX XX XX
XX XX XX XX XX XX XX XX XX
* : Asphalt cement content keep 5.0% nearly to optimum asphalt content.
**: The test parameter is the same as Design No. 4.
Temp
<°c> 3% 6%
4 XX XX
23 XX XX
40 XX XX
49
behavior of asphalt paving mixtures. Two different gradations,
coarse and fine, of the same mineralogical composition are used.
The experimental design is shown in Table 5.7. Two gradations, two
types of mineral fillers, two types baghouse fines, two different
fillers or fines content and 3 testing temperatures were the
independent variables. The resilient modulus, indirect tensile
strength, and gyratory parameters were dependent variables.

Table 5.7 Experimental Design No. 7
Asphalt Paving Mixtures Containing Different Gradationof Mineral Fillers or Baghouse Fines
50
Gradation
Temp(°C)
Mineral Fillers and Baghouse Fines
Silica Lime No. 20 No. 6
Filler or Fines Content (%)
3% 6% 3% 6% 3% 6% 3% 6%
Coarse
4 XX XX XX XXX XX XXX XX XXX
23 XX XX XX XXX XX XXX XX XXX
40 XX XX XX XXX XX XXX XX XXX
4 XX XX XX XXX XX XXX XX XXX
23 XX XX XX XXX XX XXX XX XXX
40 XX XX XX XXX XX XXX XX XXX
Fine
* : The test parameters are the same as Design No. 4

51
CHAPTER 6
ASPHALT MASTICS AND BAGHOUSE FINES
6 . 1 Baghouse Fines
Thirty different baghouse fines were sampled and collected by
various INDOT personnel during the 1988 construction season. These
samples had been organized as to their location in the state.
These samples represent different generic types depending on the
aggregate processed, such as sand, gravel, limestone and slag.
Hydrated lime was used as a control mineral filler for comparison.
6.1.1 The Particle Size Distribution
These particle sizes were determined by the sedimentation
process, using a hydrometer to secure the necessary data. The
results for each kind of baghouse fines were calculated as
cumulative particle size distributions and shown in Table 6.1 and
Figure 6.1. Figure 6.1 shows a wide variation in the gradation of
the different fines. These samples can be divided into three
groups based on a particle size of 2 /zm:
Coarse: No. 4, 6, 10, 16, 19, 21, 22, 24, 25, 29, (%<50%)
Medium: No. 1, 3, 9, 12, 14, 20, 23, 26, 28
Fine: No. 2, 5, 7, 8, 11, 13, 15, 17, 18, 27, 30, (%>70%)
The 2 /urn is considered by some investigators to be the
thickness of asphalt film that coats the aggregate in asphalt
paving mixtures.
6.1.2 The Surface Area

52
* -4 >m a <
i \ ( \ -
• •«> <s
\ WW .
• •*&«\ \\ \ \ •.
• D <Ww• o > •« as
X^ \\ ^
• op a
• & EiMOfflO-NKl \ \ |\Vi (MCMCNCN \ 111OO0O00O . \ I HZZ2ZZZZ \ \ \
o • < 4 a > \11 ;
•1
'! 1
\1 1 : 1 i i 1 »snio • < < a >
i i i i i .ill
Ea.
q fe"
o "5
- E_o
2au«waa.
oooooooooo
< m * CD
|\ 1 \\< • 4 o a" W \
<3 • * D• \\\ \\ .
< m •« CD
"W \< •• as -
\ \ A :
441
mio r» oooiaw\ :m +• ao -
CM CN CM CM CN flO o o oZZZZZ2• < 4 O
o • 4 4 a »o -
E3.
q fe*
o "3•" E
_a
a_o
uroa.
ooooooooooooajcor^iomTncN —
CO
CD
C
CD
m3
sztr>
ia
CQ
<4-l
o
c
•H4JZJ
XJ•H
-P
(%) BUISSDJ }Li33J3d {%) 5uiSSDd ;U33J3d
X X\\\
0*440BI>»
-8
o-d
E3.
V~v
E
o_2
aa.
m
OS •« » K)
y c\ ^DO « *
\VW\ '
a 4i cr» •
"nV\ \\\Tsc -m o •
\1^> OB •»•< ^D
M 'wo r» »4 < w a-
^V\ V. 1.
V. I
o > *m\ \\\
•a 0'
o,o — cMr>*j-in<o \ \\t 1
v i
oooooooo \
N
V iZZZZZZZZ \ ^ '
0«<4DB>* \ n\\ 1
i: 1 I i
c II C;
i i . i i i i i
E3.
uvaC53_jj
o
oCL
OOOOOOOOOOoo)oorvtom^"'ncN —oooooooooooocncoi^wmTncN —
CD
N-Hen
u—
I
4J
03
0,
CD
-C
0)
30»
(%) Buissdj ;u33js,j (%) BujSSOd }U33J3J

53
Table 6.1 Particle Size Distribution
Sample Particle SizeNo. 75m 50/x 3 0/zm 20/iiri lO/im 5/Ltm 3mhi 1/xm
1 88 80 74 68 53 38 30 212 95 94 82 72 56 42 35 233 83 79 77 65 47 35 28 204 90 68 57 50 38 30 25 185 93 92 87 86 84 75 56 30
6 76 65 54 45 32 23 18 137 90 88 83 76 64 52 38 248 90 87 80 75 64 52 35 239 67 65 62 57 55 52 42 2110 80 75 57 50 40 20 15 7
11 92 92 85 75 32 17 13 8
12 89 85 75 66 47 30 24 1813 95 92 85 72 12 3 2 1
14 77 76 72 65 48 34 25 1515 95 87 80 75 67 50 35 12
16 64 57 48 43 36 32 28 1017 100 98 92 84 56 35 15 9
18 99 97 92 85 68 45 34 1819 26 26 22 20 18 12 11 10
20 92 85 72 60 30 20 12 6
21 48 45 38 30 20 13 12 10
22 67 60 48 40 28 20 17 1523 72 71 64 58 45 32 24 14
24 47 43 36 28 22 15 10 8
25 38 34 23 18 12 7 5 4
26 84 83 74 65 45 28 18 8
27 98 95 90 84 55 36 28 15
28 71 70 65 60 46 32 22 9
29 36 28 24 20 15 10 10 9
30 81 78 75 72 63 45 30 15

54
The surface area of baghouse fines was determined by the
Blaine air permeability method ASTM C204. The results for each
sample were shown in Table 6.2. These samples can also be divided
in three groups by surface area:
Large: No. 2, 5, 7, 8, 9, 11, 13, 18, (S.A. > 8000cm2/g)
Medium: No. 1, 3, 4, 10, 12, 14, 15, 16, 17, 20, 26, 27, 28, 30
Small: No. 6, 19, 21, 22, 23, 24, 25, 29, (S.A. < 5000 cm3/g)
Generally, the finer the gradation of the baghouse fines, the
greater the surface area.
6.1.3 The Specific Gravity
The specific gravity of the baghouse fines were determined by
the classical pycmometer method ASTM D854. The results are
presented in Table 6.2. Of the thirty samples tested, Samples No.
1, 3, 17, and 20 have a higher specific gravity and Samples No. 5,
15, 25, and 27 have a lower specific gravity. However, the
specific gravities of all the samples are between 2.645 and 2.861.
It is necessary to understand that although in the design of
hot asphalt paving mixtures, fines and fillers are proportional on
the basis of weight, the volume occupied by the fines and fillers
must be taken into consideration for surface area and free asphalt
calculations.
The fines used in this study had specific gravities that
varied less than the specification limit 0.2 from the specific
gravities of the fine and coarse aggregate so no adjustments were
necessary.
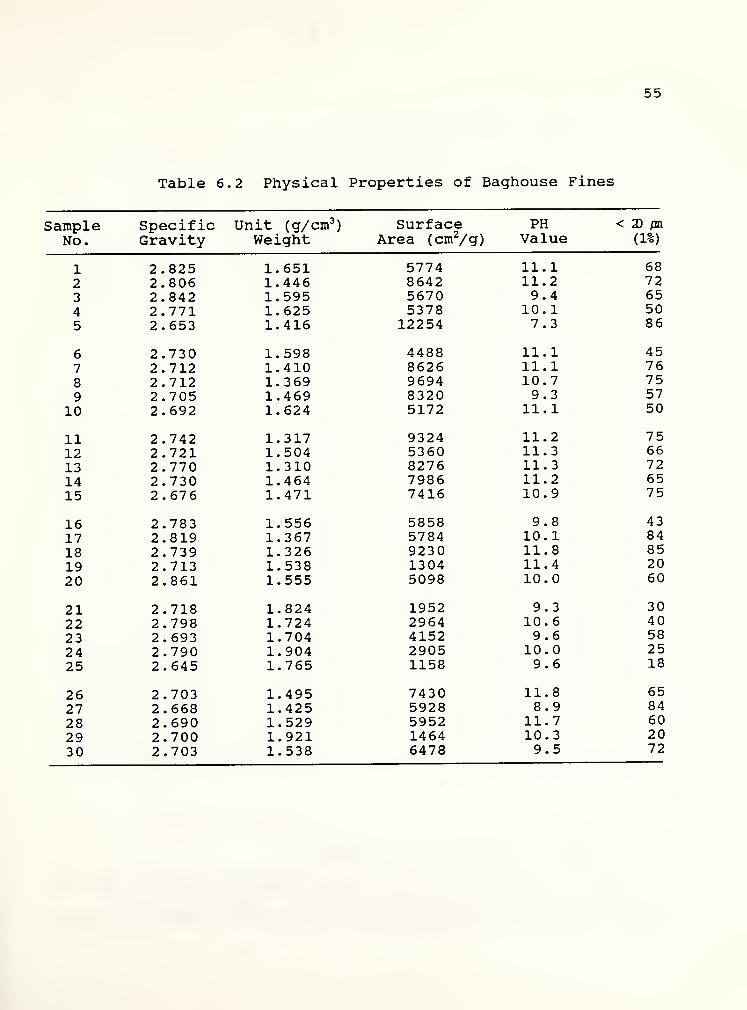
55
Table 6.2 Physical Properties of Baghouse Fines
Sample Specific Unit (g/cm3)
Surface PH < 3D pa.
No. Gravity Weight Area (cm2/9) Value (1%)
1 2.825 1.651 5774 11.1 682 2.806 1.446 8642 11.2 723 2.842 1.595 5670 9.4 654 2.771 1.625 5378 10.1 505 2.653 1.416 12254 7.3 86
6 2.730 1.598 4488 11.1 457 2.712 1.410 8626 11.1 768 2.712 1.369 9694 10.7 759 2.705 1.469 8320 9.3 57
10 2.692 1.624 5172 11.1 50
11 2.742 1.317 9324 11.2 7512 2.721 1.504 5360 11.3 66
13 2.770 1.310 8276 11.3 72
14 2.730 1.464 7986 11.2 6515 2.676 1.471 7416 10.9 75
16 2.783 1.556 5858 9.8 4317 2.819 1.367 5784 10.1 84
18 2.739 1.326 9230 11.8 8519 2.713 1.538 1304 11.4 20
20 2.861 1.555 5098 10.0 60
21 2.718 1.824 1952 9.3 30
22 2.798 1.724 2964 10.6 4023 2.693 1.704 4152 9.6 58
24 2.790 1.904 2905 10.0 2525 2.645 1.765 1158 9.6 18
26 2.703 1.495 7430 11.8 65
27 2.668 1.425 5928 8.9 84
28 2.690 1.529 5952 11.7 60
29 2.700 1.921 1464 10.3 2030 2.703 1.538 6478 9.5 72

56
6.1.4 The Mineralogical Composition
X-ray diffraction analyses were carried out using Siemens D500
diffractometer to get the mineral composition. A typical x-ray
diffraction of sample No. 5 and No. 10 are shown in Figure 6.2. In
addition to the diffraction, x-ray fluorescence analyses were also
used to find the oxide composition of baghouse fines. The results
are presented in Table 6.3. A larger amount of CaO results in a
larger amount of alkaline. A larger amount of Si0 2 results in a
reduced amount of alkaline. Examination of the data in Table 6.3
would indicate that Sample No. 8, 9, 10, 14, 16, 17, 19, 20, 22 and
29 are siliceous baghouse fines. The others are carbonate baghouse
fines. The A1 2 3/ Fe 2 3 , K20, S0 3 and Na 2 contents are low. Sample
No. 1 has the highest MgO content, and No. 5 has the least MgO
content.
6.1.5 PH Value
PH value of the baghouse fines were determined by mixing 50
grams of sample with 100 ml distilled water. The results for each
sample were shown in Table 6.2. The sample No. 5 had the lowest PH
value, and the sample No. 18 and 28 had the highest PH values, but
nearly all of the samples had PH value that were between 9.5 to
11.0.
6.1.6 The Unit Weight and Void Content
The bulk density of the compacted baghouse fines is the dry
weight of the baghouse fines when the fines were compacted into the

57
2800- Baghouse Fines No.
5
2400-
2000-
bui 1600-z.Ui
iz 1200-
800-
400-
. ii . * \ k\
o . . x,, ,\ A»J\..i A- ,J» ,, •
uI
i
1
i
i | i | i
15 25 35
WO THEJA45
Figure 6.2 X-ray Diffraction of Baghouse Fines No. 5
2800-
2400-
2000 -
on 1600
Ui
S 1200-
800-
400-
Baghouse Fine3 No. 10
JL UJi r
15 25 35
TWO THEJA45
Figure 6.2 X-ray Diffraction of Baghouse Fines No. 10

58
Table 6.3 Oxide Analysis of Baghouse Fines
Sample sio 2 A1 2 3 Fe2 3 CaO MgO so 3 K2 1tfa 2°No.
1 3.05 0.38 0.39 <33.17 <23.4 0.19 0.16 0.072 20.51 3.46 2.12 <33.17 <15.8 1.45 0.76 0.253 30.14 4.92 1.26 <33.17 9.19 2.75 0.55 0.304 16.00 2.53 1.72 <33.17 15.3 0.79 0.98 0.135 13.80 2.98 1.53 38.26 1.64 0.49 0.91 0.13
6 14.70 2.11 1.78 <33.17 >17.5 0.45 0.66 0.217 24.33 4.25 3.67 <33.17 10.95 0.32 1.07 0.368 31.62 4.42 4.47 29.94 13.1 0.07 1.21 0.339 36.96 5.33 2.97 30.94 7.15 1.48 1.00 0.4310 41.61 4.27 3.05 29.67 7.56 0.19 0.87 0.37
11 16.20 3.43 1.77 <33.17 12.00 0.99 1.07 0.1912 28.56 3.85 3.09 32.14 12.15 0.77 1.15 0.4013 30.89 4.91 3.09 32.09 >13.6 1.22 1.11 0.3514 32.19 4.91 3.33 31.94 10.03 0.37 1.28 0.4015 15.03 2.71 3.02 <33.17 >13.6 0.93 1.02 0.19
16 42.98 6.11 2.65 30.69 7.58 1.45 0.99 0.4617 35.43 6.71 2.94 31.89 9.13 3.20 1.37 0.4118 28.20 4.70 4.29 30.29 >13.9 0.50 1.23 0.3719 49.76 4.64 2.59 27.54 7.35 0.14 0.95 0.7220 33.52 5.50 1.70 <33.17 11.40 2.30 0.85 0.29
21 22.20 2.37 1.54 <33.17 12.90 0.32 0.65 0.3322 44.32 6.42 2.09 31.74 9.29 1.40 0.92 0.4823 19.31 2.54 1.90 <33.17 10.40 0.32 0.77 0.27
26 16.50 2.75 1.90 <33.17 12.50 0.69 0.73 0.2927 13.80 2.73 2.41 <33.17 11.75 0.96 0.74 0.2028 31.40 4.11 2.80 32.09 11.70 0.48 0.99 0.4929 45.42 3.68 1.84 32.24 4.54 0.10 0.76 0.59

59
small mold, divided by the total volume of the mold. The void
content of the baghouse fines is defined as the bulk value of the
compacted fines minus the volume of the fines solids. The results
of the bulk density determinations of the baghouse fines are shown
in Table 6.2. Samples No. 29, No. 24, No. 21, No. 25, No. 22 and
No. 23 containing coarse particles had the higher bulk densities.
Samples No. 2, No. 5, No. 7, No. 8, No. 11, No. 13, No. 17 and No.
18 containing finer particles had lower bulk densities.
The volume of asphalt required to fill these air voids is
called fixed asphalt. Any asphalt that is added to a baghouse
fines/asphalt mastics that is in excess of the fixed asphalt is
called free asphalt, because it is free to lubricate the baghouse
fines/asphalt mastics. The quantity of the free asphalt in the
asphalt mastics should be used to predict the viscosity and
stiffness of asphalt mastics. The percent of free asphalt is
defined as the volume of the free asphalt divided by the total
volume of the asphalt mastics. It is a new parameter used to
describe the rheological behavior of the asphalt mastics. Table
6.4 shows the volume (%) of free asphalt of different baghouse
fines. B/A is the weight ratio of baghouse fines to asphalt
cement
.
6.2 Asphalt Mastics
Basic physical test results of baghouse fines are contained in
Table 6.1 through 6.3 and in Fig. 6.1 to Fig. 6.2. Because of
constraints in time and equipment, only 17 different mastics were

60
Table 6.4 Volume (%) of Free Asphalt
Sample B/A =0.2 B/A =0.4 B/A =0.6 B/A =0.8No.
1 71.85 51.63 36.97 24.632 67.89 44.91 28.20 14.183 70.84 49.88 34.60 21.764 71.49 51.15 36.41 24.065 67.53 44.65 28.21 14.54
6 71.08 50.54 35.69 23.297 67.27 44.05 27.30 13.328 66.29 42.38 25.12 10.729 68.59 46.34 30.26 16.8910 71.02 51.53 37.05 24.99
11 64.89 39.91 21.84 6.7412 70.47 49.51 34.37 21.7313 64.64 34.41 21.12 5.8114 68.43 46.01 29.80 16.2715 68.69 46.58 30.67 17.92
16 66.02 41.64 29.31 9.0417 65.13 40.33 22.40 7.42181920 70.05 48.49 32.78 19.51
21 74.68 56.72 43.75 32.9322 73.08 53.83 39.84 28.1123 72.94 53.80 40.00 28.502425 73.96 55.63 42.47 31.54
26 69.14 47.29 31.52 18.3727 67.70 44.91 28.51 14.8628 69.85 48.53 33.17 20.3629 75.99 58.99 46.72 36.5130 70.11 48.76 33.43 20.65
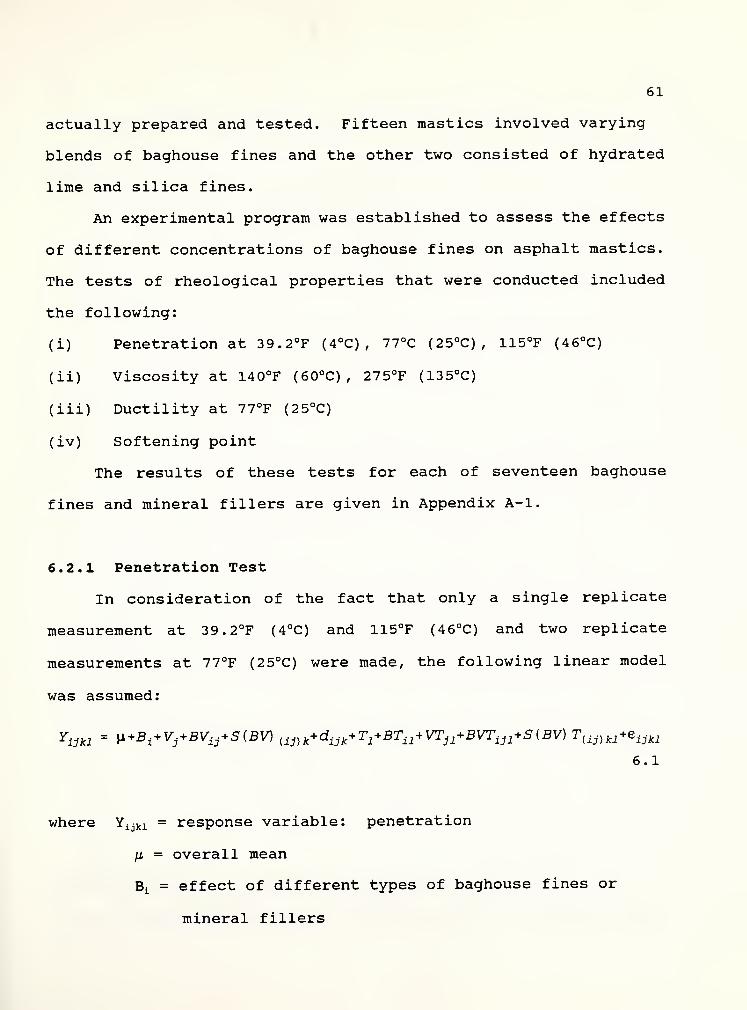
61
actually prepared and tested. Fifteen mastics involved varying
blends of baghouse fines and the other two consisted of hydrated
lime and silica fines.
An experimental program was established to assess the effects
of different concentrations of baghouse fines on asphalt mastics.
The tests of rheological properties that were conducted included
the following:
(i) Penetration at 39.2°F (4°C) , 77°C (25°C) , 115°F (46°C)
(ii) Viscosity at 140°F (60°C) , 275°F (135°C)
(iii) Ductility at 77°F (25°C)
(iv) Softening point
The results of these tests for each of seventeen baghouse
fines and mineral fillers are given in Appendix A-l.
6.2.1 Penetration Test
In consideration of the fact that only a single replicate
measurement at 39.2°F (4°C) and 115°F (46°C) and two replicate
measurements at 77°F (25°C) were made, the following linear model
was assumed:
y±m " ^Bi+ Vj+BVij + S(BV) Uj)^dijk+ T1+BTn + VTjl+BVTijl +S(BV)TUj)kl+eijkl
6.1
where YiJkl= response variable: penetration
H = overall mean
Bi = effect of different types of baghouse fines or
mineral fillers
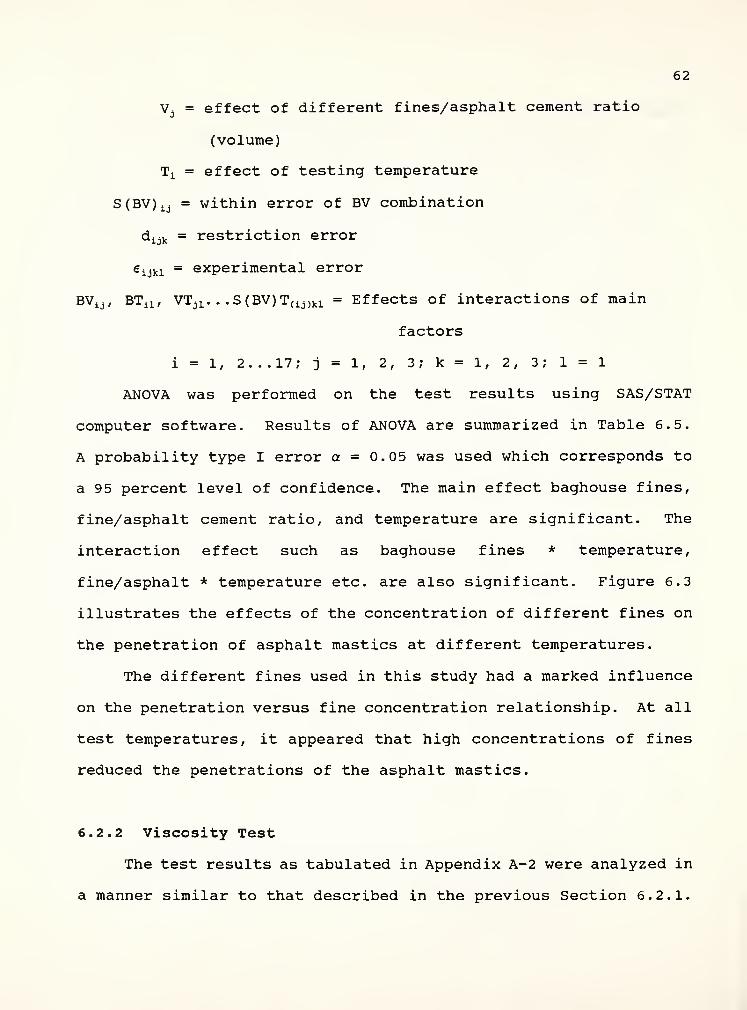
62
Vj = effect of different fines/asphalt cement ratio
(volume)
Tj. = effect of testing temperature
SfBV)^ = within error of BV combination
dijk = restriction error
€ ijki= experimental error
BVijf BTij., VTjL S(BV)T (ij)kl = Effects of interactions of main
factors
i=l, 2. ..17; j =1, 2, 3; k=l, 2, 3; 1=1
ANOVA was performed on the test results using SAS/STAT
computer software. Results of ANOVA are summarized in Table 6.5.
A probability type I error a = 0.05 was used which corresponds to
a 95 percent level of confidence. The main effect baghouse fines,
fine/asphalt cement ratio, and temperature are significant. The
interaction effect such as baghouse fines * temperature,
fine/asphalt * temperature etc. are also significant. Figure 6.3
illustrates the effects of the concentration of different fines on
the penetration of asphalt mastics at different temperatures.
The different fines used in this study had a marked influence
on the penetration versus fine concentration relationship. At all
test temperatures, it appeared that high concentrations of fines
reduced the penetrations of the asphalt mastics.
6.2.2 Viscosity Test
The test results as tabulated in Appendix A-2 were analyzed in
a manner similar to that described in the previous Section 6.2.1.
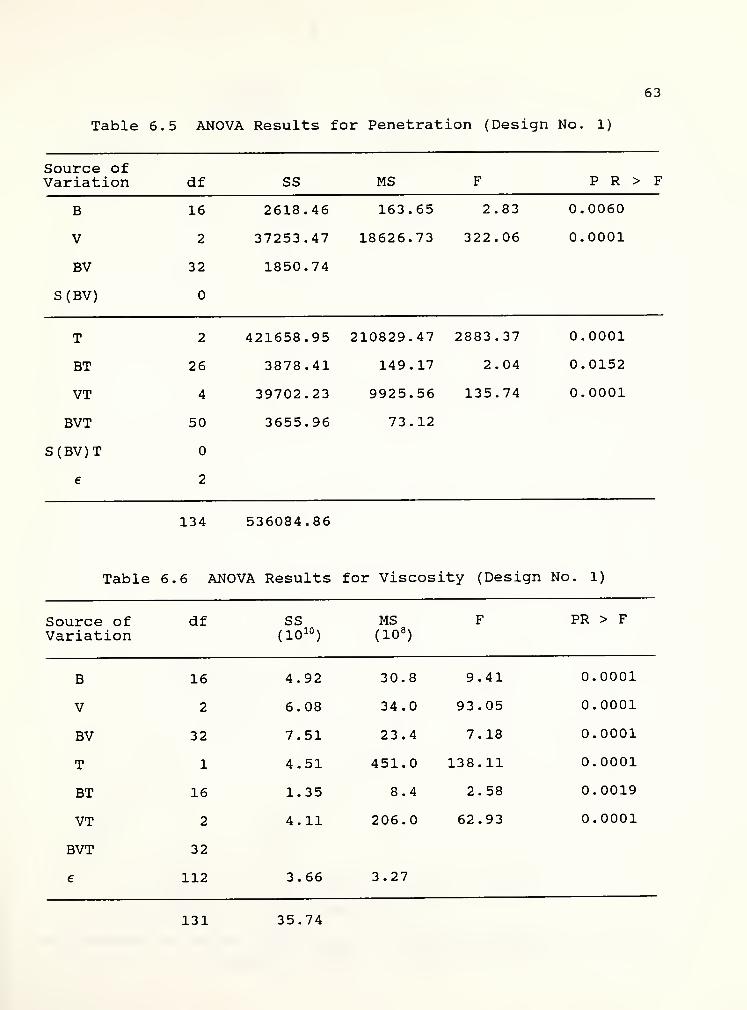
63
Table 6.5 ANOVA Results for Penetration (Design No. 1)
Source ofVariation df SS MS F P R > F
B 16 2618.46 163.65 2.83 0.0060
V 2 37253.47 18626.73 322.06 0.0001
BV 32 1850.74
S(BV)
T 2 421658.95 210829.47 2883.37 0.0001
BT 26 3878.41 149.17 2.04 0.0152
VT 4 39702.23 9925.56 135.74 0.0001
BVT 50 3655.96 73.12
S(BV)T
e 2
134 536084.86
Table 6.6 ANOVA Results for Viscosity (Design No. 1)
Source ofVariation
df SS(10 10
)
MS(10 8
)
F PR > F
B 16 4.92 30.8 9.41 0.0001
V 2 6.08 34.0 93.05 0.0001
BV 32 7.51 23.4 7.18 0.0001
T 1 4.51 451.0 138.11 0.0001
BT 16 1.35 8.4 2.58 0.0019
VT 2 4.11 206.0 62.93 0.0001
BVT 32
e 112 3.66 3.27
131 35.74

oIf)
CM
EE
Ocua.
64
0.2 0.4 0.5
Filler/Asphalt Ratio (Volume)
uomCN
Ee
ca
cua.
o— o MO 9•—•• .M0 10a- • a NO 11a a M0 13a- -a N017- N0 18
0.2 0.4 0.5
Filler/Asphalt Ratio (Volume)
aomIN
EE
co
c
a.
25-
200.0
o—o N020• • N027a- • • a N030a a N032a- -a N033
0.2 0.4 0.5
Filler/Asphalt Ratio (Volume)
0.8
Figure 6.3 Effect of Baghouse Fines Concentration of Penetrationof Asphalt Mastics (77°F) (Continue)
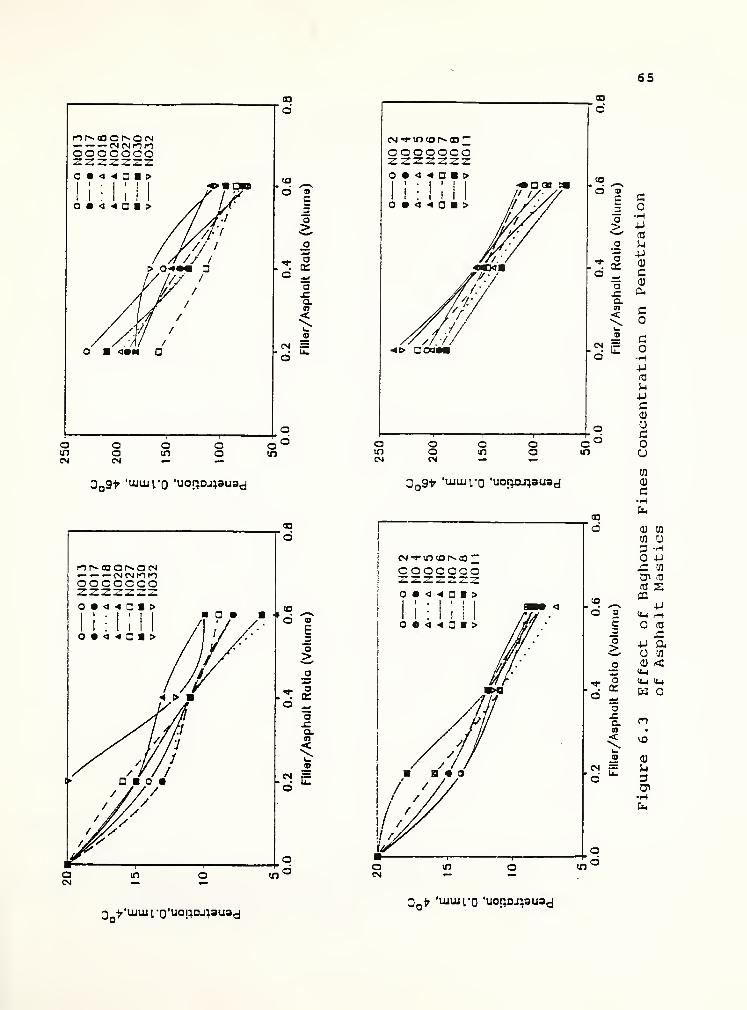
65
coo r-. ocn— iNcsniolOOOOO:zz2zz
CO
o
CD
£
O>
•«* o
o ^o
a.
<
2 £
o O O o oin o in o mCN CN »— —
3 9> 'uiuu - 'uorjoj^ausd
1*1 MDONON— — — CN CN K) 1*1oooocoozzzzzzzo • 4 4 a >
a • •>,-; -^
CO
d
a>
aIT
O —
a.en<
m
CM
6
tNTiniOMD"OOOOOOOZZZZZZZ
•o qcxm
CO
d
oinCN
aoCN
a oa
3Q9t 'uwui'O 'uot}o-i}au3d
cn •* m «o r» co*"
cooooooI
u l_J
CO^_^
a CD
E3
Co
O H> 4J
«j
a U— U«*
rr <u
o c"5 a)
a.a7)
< C
L>O c
CNir c
d+J
IB
M+J
C0)
o cuu
0)
cH6h
CO
c
aghouseMastics
CO ^^03
d 3
54-1 H
(0
_2 ,co> -p a.
a ra
o <D <<U
T a <M -U
da:
a
W
JSCL COen •
< VO
u<o a)
CN
d iZ u3CXI
in
3 y'ujmi'o'uonDj^aua^3Q> 'uitui'Q 'uoi;oj;au3d

66
The following linear model is assumed:
Yim = \x + B±
+ ^ + BV^ + r* + sriJt
+ VTjk + flVTiJJt
+ ei:fJU 6 . 2
where Yijkl = response variable: viscosity
B, V, T, m = the same as model 6.1
i=l, 2 , ... 17; j =1, 2, 3; k=l, 2; 1=1, 2
The ANOVA results shows that the differences among baghouse
fines, mineral fillers, fines/asphalt ratio, and temperature are
statistically significant at the a = 0.05 level. The two way
interaction effects are also significant, see Table 6.6.
Figure 6.4 and Figure 6.5 illustrate the effects of the
concentration of different fines on the viscosity of asphalt
mastics at different temperatures. Figure 6.4 shows such effects
at a temperature of 140°F (60°C) . Figure 6.5 shows these effects
at a temperature of 275°F (135°C) . Both figures illustrate that
wide variations of asphalt mastics viscosity occur even when the
same concentrations of different fines were used. A more than
tenfold increase in viscosity is shown for No. 11, No. 13, No. 17
at a high concentration of fines. On the basis of viscosity it may
be concluded that surface area and particle size distribution
contribute to the increase of the viscosities of fines/asphalt
mastics in these tests.
6.2.3 Softening Point and Ductility
The test results of softening point and ductility are also

67
0.2 0.4- 0.S
Filler/Aaohalt Ratio (Volume)
0.3200
0.2 0.4 C.S
Ffller/Asonalt Ratio (Volume)
0.3
o o NO 9•—- NO10A- • • a N01
1
a * N013a- -a N017
NOT 3
0.2 0.4 0.6
Filler/Asphalt Ratio (Volume)
0.3 0.2 0.4 0.S
Filler/Aspnalt Ratio (Volume)
2000
-o N020•—-* N027a- • • a NO30* a N032a- -a N033
0.0 0.2 0.4 0.6
Rller/Asphalt Ratio (Volume)
0.3
10"-uom
o
= io-5
.
oa
2000.0
o—o N020• • N027a- a N030a a N032a- -a HOZZ
.<¥.
s/
ss
Figure 6 .
4
Effect of Baghouse Fines - FigureConcentration on Viscosityof Asphalt Mastics (140°F)
0.2 0.4 0.8 0.3
FTIIer/Asphalt Ratio (Volume)
6.5 Effect of Baghouse FinesConcentration on Viscosityof Asphalt Mastics (275°F)

68
tabulated in Appendix A-2 . The assumed linear model is simpler
than 6 . 1 and 6.2:
Yijk = U + Bi * Vj
* BV±j * eijk 6.3
where Y ijk= response variables, soft point or ductility
B, V, H = the same as model 6.1
i=l, 2, ... 17; j =1, 2, 3; k=l,2
The ANOVA results are shown in Table 6.7 and 6.8. The
differences among baghouse fines, mineral fillers, fine/asphalt
ratio are significant at a = 0.05 level.
Figure 6.6 and 6.7 illustrate the concentration effects of
different fine or ductility and softening point. Figure 6.6
indicates that low concentrations of fines reduce the ductility of
asphalt mastics. Fines which tend to increase asphalt mastics
viscosity to a greater extent also tend to decrease the ductility
of asphalt mastics significantly. Softening point versus fines
concentration trends for different fines as indicated in Figure
6.7. Fines which increase asphalt mastics viscosity to the
greatest extent also increase the softening point of the asphalt
mastics more pronouncedly.
Therefore, after examination of the changes in viscosity,
penetration, softening point and ductility from pure asphalt cement
to mastics, the stiffening, strengthening effects of the filler
materials are dramatic. In order to investigate this phenomenon
the following indicators of temperature susceptibility were

69
Table 6.7 ANOVA Results for Softening Point (Design No. 1)
Source ofVariation df SS MS F PR > F
B 16 745.56 46.57 52.51 0.0001
V 2 3533.34 1766.20 1991.16 0.0001
BV 32 622.66 19.45 21.93 0.0001
e 51 45.25 0.89
101 4946.71
Table 6.8 ANOVA Results for Ductility (Design No. 1)
Source ofVariation df SS MS F PR > F
B 16 3038.56 189.99
V 2 27518.57 13795.46
BV 32 3561.89 111.45
e 48 3590.42 74.80
2.54 0.0066
183.95 0.0001
1.49 0.1042
96 38087.58
Table 6.9 ANOVA Results for Temperature Susceptibility
Source ofVariation PI
ResponsePVN1 PVN2
VariablesPR VTS
B
V
s.
s.
S.
S.
S.
S.
N.S.
S.
S.
S.
S. = significant at a = 0.05, N.S. = not significant at a = 0.05

ISO-70
0.0
O NO 2• • NO 4A- • • A NO 5A—A NO S
D- -G NO 7— i no a
0.2 0.4 O.S 0.3
FTller/A3phait Ratio (Volume)
1SO
e 120
3 80
\«
NO 9• 1 N0 10A- •
• A N011A N013
C- -G N0 171N018
A^5•^s^"
><i^"^0
0.0 0.2 0.4 O.S 0.3
Filler/Asphalt Ratio (Voiume)
1.0
ISO-
1 120
3 80-o3a
0.0
O-—O NG20•-—• N027A- • • A N030
A N0320- -G N033
0.2 0.4 O.S 0.3
Filler/Aaphait Ratio (Volume)
Figure 6.6 Effect of Baghouse Fines Concentration on Ductility ofAsphalt Mastics (No. 2-33)

71
Uo—*
c'oa.
OlC'ca
*oin
0.4 O.S
Rller/Asphalt Ratio (Volume)
0.3
uo
c'oa.
c'cu
"oin
0.2 0.4- O.S
Rller/Asphalt Ratio (Volume)
ao
_
*jz
oa.
ca
o
0.2 0.4 O.S
Rller/Asphalt Ratio (Volume)
0.3
Figure 6.7 Effect of Baghouse Fines Concentration on the Soften in;
Point of Asphalt Mastics (No. 2-3 3)

72
calculated:
(i) PI (Penetration Index)
(ii) PVN (Penetration Viscosity Number)
(iii) PR (Penetration Ratio)
(iv) VTS (Viscosity Temperature Susceptibility)
The values of these characteristics and the ANOVA results are
given in Appendix A-2 and Table 6.9 respectively. The primary
observations from these analyses are presented in the following
sections.
6.2.4 PI Temperature Susceptibility
PI temperature susceptibility is an indicator of temperature
susceptibility. The PI value requires an asphalt penetration at
77°F (25°C) and a ring-ball softening point temperature for its
calculation. The result shows that there are very significant
differences for these variables among baghouse fines and
concentrations of fines. A larger PI value indicates a lower
temperature susceptibility. The PI values of all samples are
larger than -1.0, so these samples have low temperature
susceptibilities. However the No. 11 asphalt mastic (B/A = 0.6)
was found to be stiffer than any others in the test.
Figure 6.8 illustrates the concentration effects of different
fines on the PI value of asphalt mastics.
6.2.5 PR Temperature Susceptibility
Penetration ratio is the ratio between the penetrations at

73
IJJJJJJJJ J .• J .•
3
F3
..a
-«
-.<n
r»
r<o
—ui
ro
9
E3
B i -1 ' > '
\><>>>H> TTT
CM^"«0odd
Dll<zzzzzzzz
+2
J. CM
io
CM
_ oCM
-03
..r-
i-i"">
XCD
E3
xspu| uo;;cm3u3j xaoui jor^3jaauaa
CN^mtof-cocn^^ooooooooozzzzzzzzz
0(<4QI»>»
aa
d
CO
d
o>
arr
o ^
aa<
IN
d
n r» «3 o r» o cm ir—— — cm cm rnmnoooooooozzzzzzzz
I I
CO
a
«5
d
T OS.a _,
£a.n<
(N
d_2
<n o in a m ocm cm — — d-d
xspu| uor^aj^ausd
m o v
d ~l I
m a m o m o m oCM CM ** • o a a
i TX3pU| 'J0I|DJ;3U3J
nm
I
JC cm4J
CZ
C
I/]
'J
J)
u
caoC 4J
-i
a us
j:en aa) wc <
0)
in x3 0)
73s. c
3 C
O +J
> <u c^ (M OJ
o W 0,
co
0)
J-l
3

74
39.2°F (4°C) and 77°F (25°C) . This variable is an indicator of
temperature susceptibility in the temperature range from 39.2°F to
77°F. The ANOVA shows that there are also very significant
differences in these variables for different baghouse fines at
different concentrations. There is a trend for a decrease in
penetration ratio with increasing concentration of baghouse fines.
However, this pattern is not observed for No. 11 and No. 13 asphalt
mastics. Figure 6.9 illustrates the concentration effects of
different fines on PR value of asphalt mastics.
6.2.6 VTS Temperature Susceptibility
Viscosity temperature susceptibility is an indicator of
temperature susceptibility in the temperature range from 14 0°F
(60°C) to 275°F (13 5°C) . The ANOVA shows that there are very
significant differences in the main factors such as baghouse fines
and concentrations. There is also a trend for a decrease in VTS
value with increasing concentration of baghouse fines. However,
No. 6 and No. 30 were found to be more temperature susceptible than
other asphalt mastics in this temperature range. Figure 6.10
illustrates the concentration effects of different fines on VTS
value of different asphalt mastics.
6.2.7 PVN Temperature Susceptibility
There are two kinds of PVN values, one is calculated from
viscosity at 275°F (135°C) and penetration at 77°F (25°C) , the other
is calculated from viscosity at 140°F (60°C) . This variable is an

if > '.v gas gzzs
L>. !.
i;v .'. E3ZB2ZS2•<o
•J ''•' .' >i
oa
Oa
aa
oi|Dy uai}OJiaua^
ior--a3 ~OOOOZ2Z2* a u >
in
a a
a$ny uoi}Dj}au3d
•-m3z
aaoa
33
d
to ^d o
E_3O>
° ~a-Ca.o<
L>>> >>>.',>SSS >?>>>>, >
. CM1*1
zzzz: BZZZZZfl
l>;
' ' ' ».' v.- -.
\> ?> >> >ss ? g g gzaazzg
2Z22
ZZ
v; y/ y g .' .' v. ? ;
75
CN
CN
33
a
. ro
Oa
ao
aoCN
aaa
o ooiiay jciicmaua,-
or-ocNCN CNdf!OOOO4 a >
d
m t- 1*1
o" d doipy uaiiajiaua^
33
dE
O>
ao.ea.a
u.2
mm
<D 1
pc ao zco•H (fl
-P(T3 —iU 4J
-P Wc .-a
C 4J
rH
U (0
en a<U 'J]
c <ft, u_i
en o3 -Ho +j
03 C
V-U uO +J
cu cu
«-i c<*-i cu
en
cu
P.
301

m t n cm — O
K}!!jqi}daosns ajruojadoiaj. X}iso3si/\
• •40
CD
d
6
cMTtncor»<x>a>~OOOOOOOOzzzzzzzzo«44oa>»
o *o * a * & *
E
O>
a01
<a
CM =a c
O IfJ
CM
OCM
Xyjiqi^dassris sjn}Djadiuaj_ X;isoasi/\
OOOOOOOOzzzzzzzz
&•<!«>»•
CD
d
CO
d CO
E3O>
oa:oa.ca.
CM
d
m o in
CM CM
co•H >,4J -P(0 -wU i-H
c .aoj -Hu +j
c ao <u
a oin
w 3
c-h a)
3a; jj
m to
3 UO Q)
j= ait s<a a)
oa £h r
I
O +J•H
U
<w tn [^H-l -M |-^
U > —
3
X}i|iqt}daosns ajn^ojadaiai X^isoasi/v X^iiqi^daasn^ ajn^ojadiusj, Xiisoasi^
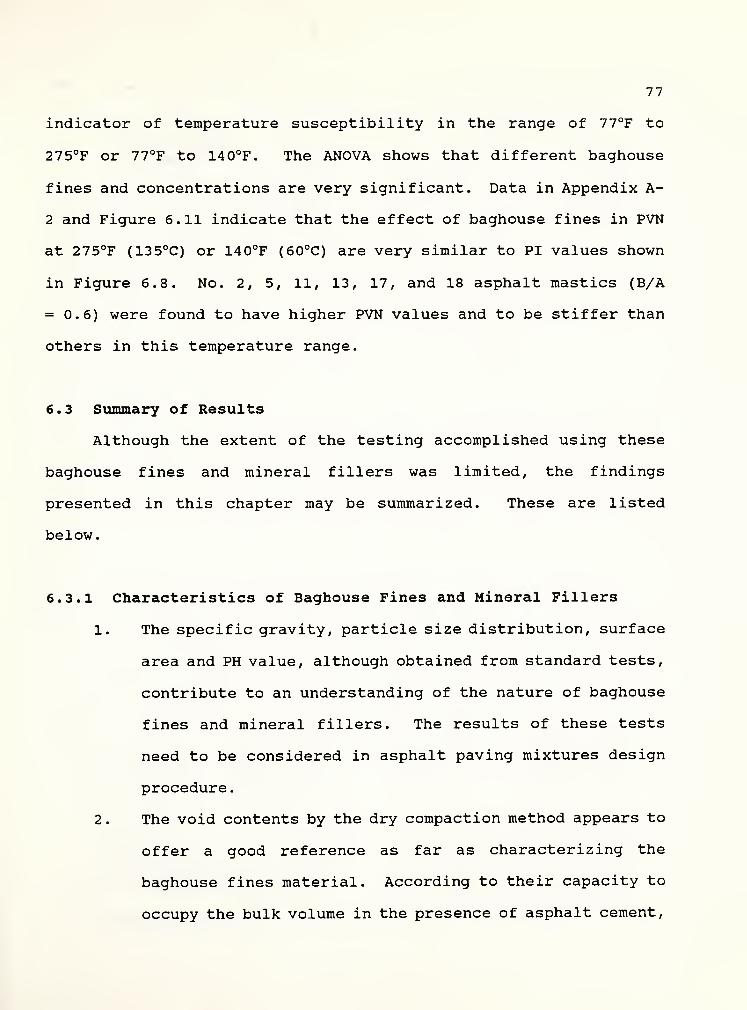
77
indicator of temperature susceptibility in the range of 77°F to
275°F or 77°F to 140°F. The ANOVA shows that different baghouse
fines and concentrations are very significant. Data in Appendix A-
2 and Figure 6.11 indicate that the effect of baghouse fines in PVN
at 275°F (135°C) or 140°F (60°C) are very similar to PI values shown
in Figure 6.8. No. 2, 5, 11, 13, 17, and 18 asphalt mastics (B/A
=0.6) were found to have higher PVN values and to be stiffer than
others in this temperature range.
6.3 Summary of Results
Although the extent of the testing accomplished using these
baghouse fines and mineral fillers was limited, the findings
presented in this chapter may be summarized. These are listed
below.
6.3.1 Characteristics of Baghouse Fines and Mineral Fillers
1. The specific gravity, particle size distribution, surface
area and PH value, although obtained from standard tests,
contribute to an understanding of the nature of baghouse
fines and mineral fillers. The results of these tests
need to be considered in asphalt paving mixtures design
procedure.
2. The void contents by the dry compaction method appears to
offer a good reference as far as characterizing the
baghouse fines material. According to their capacity to
occupy the bulk volume in the presence of asphalt cement,

' ." '=
' > .' ii > i > wr
..O
-O)
BsassBsssssa
bbsbssbb
tosses
« S
E+<0 I
*«
ro C4
jsquin^ /aisocsi_A, joiidjisus^
cM^vn<or»coa>3—oooooooooZZ2ZZZ222
03
a
CO
E
>
T Ko _"5
a.a
OinomomomoI I
CMT CO
cd as cd gzsgzazsBB
DISBgggezssssa
b a 2 i ; - a
BZESSBZSaZ2gZgggSS
B2SBSSBSBESBBZZ B
»>>>>>}}>>>>>>>>?
73
or>
Xmr* MCM o
wo
QCM E
-03
if*
— 1*3
rO
jaqainfg Xiisccsi/, joao-iiaua-
< m m < >
\I. \
• \'• \*)SOONONO v
fl—— <-NCNiOiOO '. \ v
OOOOOOOO • \ \'ZZZZZZZZ »
o»4+am>>
03
d
to
3Z
O 3
E_3O>
o m o m o m o If) on CM CM — »~ o o o
1 1
C*i
m0) I
jC ™PCo zco•H >4J 4J(0 -HSj -H4J -HC .00) -H
+J
c ao ai
a on
U3 3<U WC•H >.Pu Jj
•Ha) ui
w os ao u>
£ -H
IW -H £ra I
-Uo0)0
<w C -4-
4-i a) hw a. —
'
a)
M3
H
jaquirtN X3,;so3Si/\ uor)oj;su»d
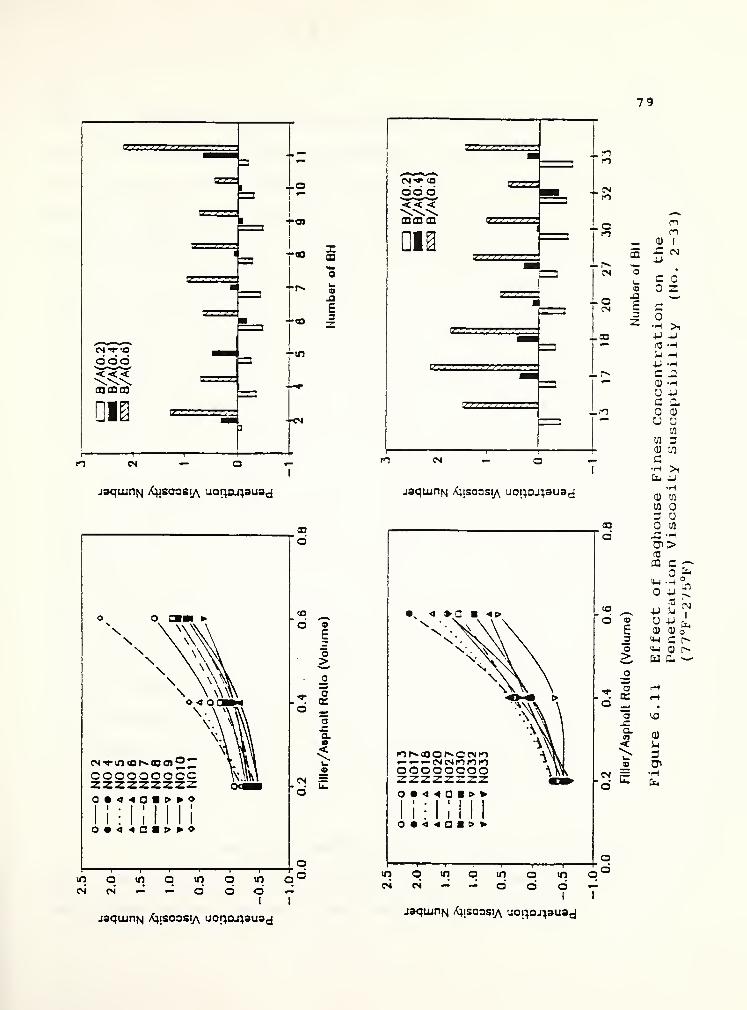
79
I J > > I > > > >J ft
B ' > 1
1
" ">
Z=
T°
1"«
7<n m
E
-«
-'•'
zzzzz=
tgZZZZZZZ
B332
e-zsszzszz
-
i*1
o
CN
aCN
03
3
— 03
_r"»
.1.1*1
jaquin^ Xaiso3Si,\ uotp^aus^ jsaujnvj \;:socsi_A joi:3-:aua c
ao
d
CO
d o
E3a>
o «a£aa
<u
3 E
i i i ii
i iinoinainomoI l
jaquiriN Xjisoosi/v uot}Dj}3U3^
m r» <n o r»o <n in»—— — r>j<Mi*ir-)mooooooooZZZ2ZZZ2
0«44QI»»
S3
d
CO
a aE_2a>
O _,
a
CM ~
in
c4q m qCN — — d
ad
i
m q"d <-
I I
jaqairiN X;isoosi/\ uonDj;auad
0)
au
Co
c
—
I
4J
ro
U4J
C
ucGu
03
nn
l
CN
->
c•H >,fa -
•Ha) ai
03 o3 U
03
a -h
ISOCT
4JIN
I
-J
10
UJJ
a) a) «r
'J3
3a*•Hfa

80
one can define % V^, the percent bulk volume of fines,
to describe the effect of bulk volume of fines on
rheological properties of asphalt mastics. Basic test
results are contained in Figure 6.12 and 6.13. These
semi-log plots indicate that the viscosities continue to
increase rapidly as the bulk volume of fines is
increased. These figures show pronouncedly viscosity
ratio increases between 60 to 80 percent bulk volume of
fines, especially between the 70 to 80 percent range.
Figure 6.14 illustrates a similar trend for a plot of
bulk volume of fines versus increase in softening point
temperature
.
3. Parameters developed from the simple dry compaction
method to get the void content in baghouse fines, such as
B/A, Vfa , and % V fB appear to be useful for correlation
with consistency tests such as penetration, viscosity,
ductility, and softening point which indicate the
stiffening effects of baghouse fines in asphalt mastics.
4. There appears to be a tendency for some baghouse fines to
significantly increase the stiffening of asphalt mastics.
This trend needs to be evaluated further in consideration
of designing mineral fillers for asphalt paving mixtures.
6.3.2 Characteristics of Fines/Asphalt Mastics
1. The penetration, ductility, and the ring and ball
softening point tests were observed to be useful for

81
demonstrating the characteristics of asphalt mastics.
In view of ANOVA, the significance (a = 0.05) of the
behavior of asphalt mastics is a function of different
types and concentrations of baghouse fines. Asphalt
mastics No. 11 and No. 17 appear to be significantly
different when compared to the other asphalt mastics on
the basis of viscosity and penetration.
The relationship between viscosity at 60°C,
concentrations, and different type of baghouses can be
defined by a linear model.

82
oooto
g
ieinO
>
100 r
20 40 60 30
BULK VOL OF FINES (VfB). PERCENT
100
Figure 6.12 % V,. Versus log Viscosity at 140°F
oa
g
tr
Ou'EL
>
100 -
20 4-0 60 30
BULK VOL OF FINES (VfB ). PERCENT
100
Figure 6.13 % Vfb
Versus log Viscosity at 275°F
20 40 60 ao
BULK VOL OF FINES (VfB). PERCENT
100
Figure 6.14 % Vfb
VersusA
SF

83
CHAPTER 7
ASPHALT PAVING MIXTURES WITH BAGHOUSE PINES
7 . 1 Introduction
An experimental design to assess the effects of different
baghouse fines on asphalt paving mixtures using the gyratory
testing machine, resilient modulus test apparatus and indirect
tensile test equipment was devised and performed. The general
laboratory procedures described in Chapter 4 were used to prepare
and to test the gyratory compacted specimens.
The main objectives of the experiment were as follows:
1. The gyratory testing machine was used for determining the
maximum permissible bitumen content consistent with intensity of
traffic load as simulated in laboratory.
2. Indirect tensile and resilient modulus tests were
performed to evaluate the effects of asphalt paving mixtures
containing baghouse fines on the tensile strength and resilient
modulus.
3. The rutting potential and the mix stiffness were
evaluated.
4. A statistical analysis was conducted to establish the
significance and relationships between test parameters. This was
done by performing analysis of variance and regression analysis.
The independent variables included the different types of
baghouse fines, the percent of baghouse fines added, the percent
asphalt cement added and the compactive effort. Gyratory

84
parameters were obtained during the compaction process. The
properties of the paving mixtures measured at various temperatures
were the resilient modulus, the Hveem stability, the indirect
tensile strength, and mix stiffness.
7.2 Method of Analysis
The response variables were analyzed with the aid of the
Analysis of Variance statistical method. The ANOVA determined
whether the effects of certain factors and/or interactions of
factors were statistically significant.
In most ANOVA problems the assumption which was historically
thought to have been most critical was homogeneous variances. The
assumption of homogeneity of variance was checked by using the
Bartlett's Test (38). If the Bartlett's test value was less than
the critical value at d=0.001, the assumption of homogeneity of
variance would be accepted. If it was rejected, the data should be
transformed in order for the ANOVA to produce meaningful results.
ANOVA and Bartlett's test statistical package programs were
available on the IBM 3 09 at the Purdue University Computing
Center.
The general statistical model for the gyratory parameters of
the resilient modulus in design No. 2 is shown below:
Yijki™ = M + Bi + * (i ,+ Pj + BP^ + Ak + BA^ + PAjk + BPAijk +
S(BPA) (ijk)1 + WiJkl + C,,, + BC^ + PCJn + BPC iJln + AC^ +
BAC^ + PACjkm + BPAC ijklI1 + S(BPA)C (ljk)ljI1 + Vijklm + Tn +
+ «ijki™. 7 ' 1

85
Where Y ijklmn = Response variable: GEPI, GSI, GCI, MR , ITS, S,
and J(t)
H = overall mean of response variable
Bi = Effect of different types of baghouse fines
Pj = Effect of the percent of baghouse fines added
Ak = Effect of percent of asphalt cement added
CL= Effect of compactive effort
Tm = Effect of testing temperature
S (BPA) (ijklu = Within error of BPA combination
<S,w,v = Restriction errors
e = Experimental error
BPij BAik BPACT ijkran= Effect of interactions of
factors i,j,k,n = 1,2,3 1 = 1,2 m = 1,2,3,4
The model followed the split-split plot experimental design.
The first restriction error, 6, was due to the fact that the
specimens were fabricated on different days. The second error, w,
was due to the fact that readings were taken from the same specimen
at the various revolutions. The third error, v, was due to the
fact that readings were taken from the same specimen at the various
testing temperatures.
This general model included all the factors, interaction terms
and error terms. Design No. 2 was a complete representation of the
response and independent variables.
7.3 Results
The gyratory parameters are tabulated in Appendix B-l. Test

86
results include data on each replicate tested as well as the
average of the two replicates tested.
Results of the resilient modulus test with respect to the
different type of baghouse fines, percent of baghouse fines,
percent of asphalt cement and test temperature have been tabulated
in Appendix B-2 . Test results cover data on each replicate tested,
and average values of modulus along two directions in which the
specimens were tested.
Computed values of mix stiffness, indirect tensile stress,
total tensile strain at failure, and Hveem stability are presented
in Appendix B-3 . Test results include data on each replicate
tested as well as the average of the test.
7.4 Analysis of Results
7.4.1 Gyratory Parameters
The gyratory parameters for the asphalt paving mixtures
containing baghouse fines were recorded during the compaction
process. ANOVAs were performed on the obtained data using the
following model:
YiJkl = /x + B, + 5 (i) + Pj + Ak + PAJk + BPi;)
+ BA^ + BPAiJk +€ ijkl —7.2
This is a complete randomized factorial design. The terms in the
model were defined earlier. The ANOVA results are presented in
Table 7.1.
Figure 7.1 depicts the gyratory indices as functions of
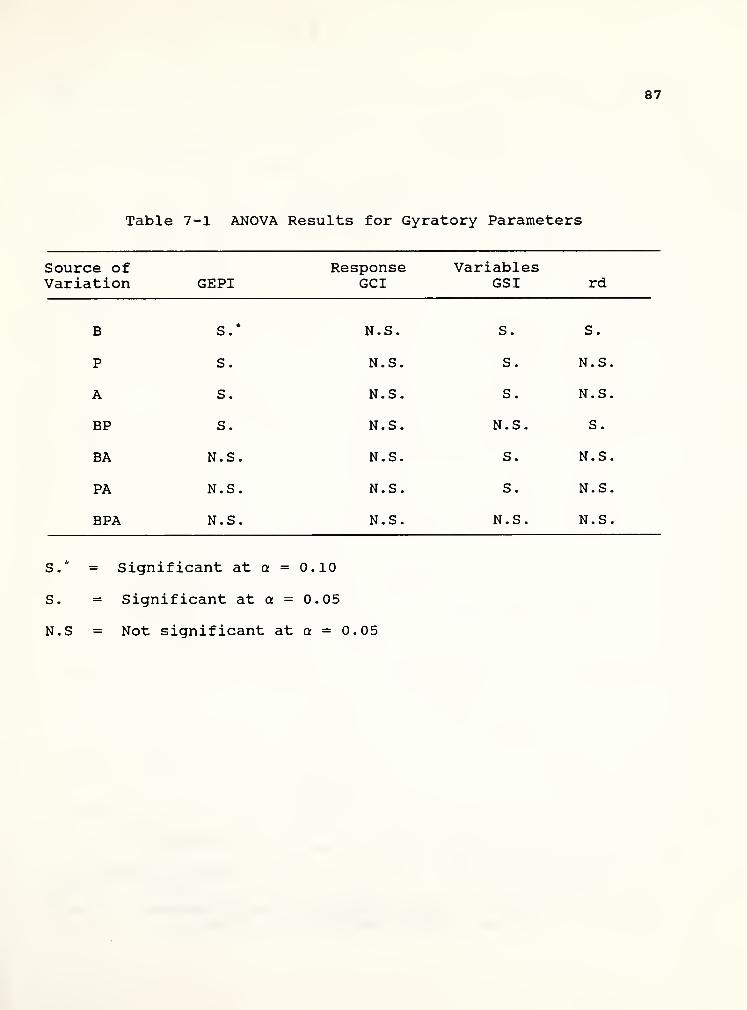
87
Table 7-1 ANOVA Results for Gyratory Parameters
Source of Response VariablesVariation GEPI GCI GSI rd
B S.* N.S. S. S.
P S. N.S. S. N.S.
A S. N.S. S. N.S.
BP S. N.S. N.S. S.
BA N.S. N.S. S. N.S.
PA N.S. N.S. S. N.S.
BPA N.S. N.S. N.S. N.S.
S.* = Significant at a = 0.10
S. = Significant at a = 0.05
N.S = Not significant at a = 0.05
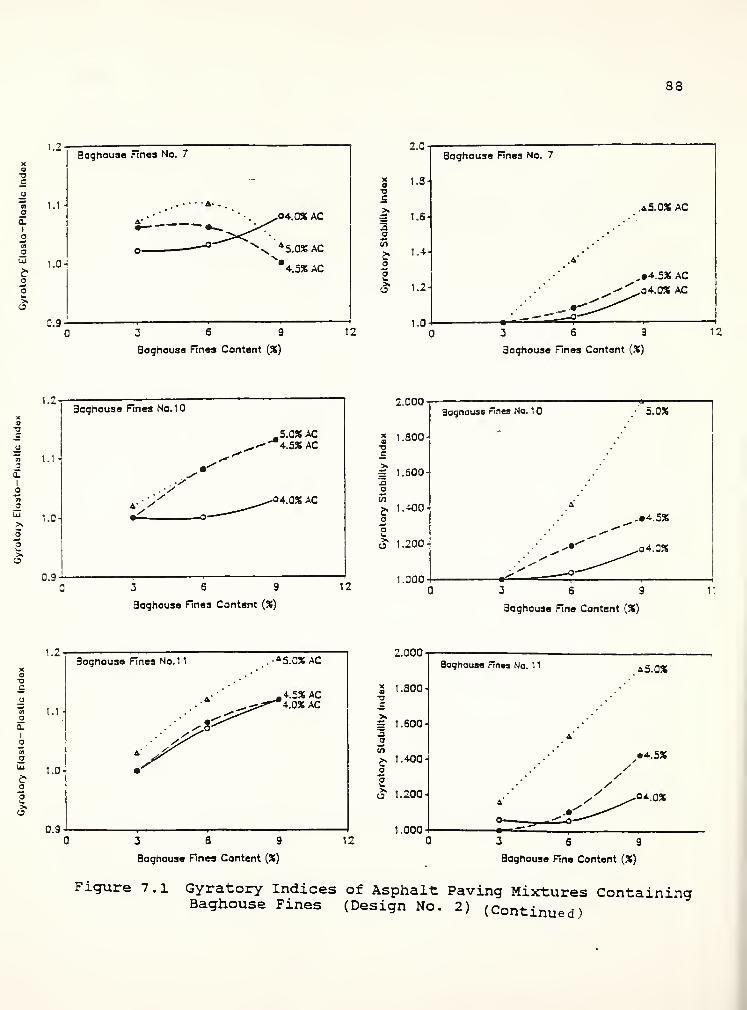
88
oa.
I
a
1.2-
1.1
1.0-i
aoghouso Finos No. 7
0.9-
O4..0X AC
4.558 AC
3 6 9
Baghouae Fines Content (56)
12
Xa•ac
2.0
1.3-
1 1 -S2aSi
Co
1.4
1.2-
1.0
Baghouse Fines No. 7
.aS.OX AC
-
.4'
•*'
-*-^ .^
**,•4.5* AC
,04.058 AC
3 6 9
Baghouse Fines Content (58)
12
1.2-
n 1.1aa.
I
o
Bogtiouse Rnes No. 10
a
1.C-
0.9-
sss
-S.0JS AC4.5XAC
34.056 AC
3 6 9
Baghouse Fines Content (%)
2.000
12
X 1.300 J
•ac>».— 1.S00-aaUl
fc1.400-
ai»
O 1 .200 -I
1.0003 6 9
Baghouse Fine Content (55)
1.2-Baghouse Fines No.1
1
"5 1.1 •
o_
a.I
o'rt
a
&oaw
a
1.0-
0.9-
.
4 5.0S6 AC
4.558 AC-s^"""" 4.058 AC
3 6 9
Baghouse Fines Content (58)
2.000
12
5 1.300o_c
S 1.S00-2aSi
g. 1.400-)o
o 1-200-
1.000
Baghouse Fines No. 1
1
A5.058
••4.5*
0^.058
3 6 9
Baghouse Fine Content (58)
Figure 7.1 Gyratory Indices of Asphalt Paving Mixtures ContainingBaghouse Fines (Design No. 2) (Continued)

89
2.500
K)
£ 2.450-
2.500
9agnou3a Fines No.
sz 2.400-o> a01
3 •-^ O'c3 2.350-
o—oi.oas• •4.558a— a5.GX
3 6 9
Baghousa Fines Content (35)
2.500
iO 2.4-50
Eu
o»
IT 2.400.co»
'o
- 2.350ca
2.300
Baghouse Fines No. 10• «4.5Xa 4.5.0X
3 6 9
Baghouse Fines Content (%)
12
2.500
2.400
Baghouse Fines No.1
1
ri 2.480-
Eu\
2.460- a•w
oo 2.440-
•w •c3 2.420-
O 4.GX• «4.53a A5.CX
123 6 9
Baghouse Fines Content (X)
Figure 7.1 Gyratory Indices of Asphalt Paving Mixtures ContainingBaghouse Fines (Design No. 2)

90
asphalt content and baghouse fines content. It can be noted that
the gyratory compactibility index was insensitive to the change in
percent of asphalt cement and baghouse fines added. The gyratory
stability index (GSI) remained relatively constant for less than 3%
baghouse fines added and increased drastically as the percent of
asphalt cement increased from 4.5% to 5.0% and the amount of
baghouse fines became greater than 6%.
7.4.2 Resilient Modulus
The resilient modulus values of the asphalt paving mixtures
containing baghouse fines as outlined in Design No. 2 are presented
in Figure 7.2 as a function of percent of baghouse fines, asphalt
content, and type of baghouse fines. It can be observed that the
resilient modulus at higher baghouse fines content decreased
significantly as asphalt content increased from 4.0% to 5.0%. It
can be also be observed that resilient modulus at lower baghouse
fines content had a peak value at an asphalt content of 4.5%. This
phenomenon appeared to be similar to the usual asphalt paving
mixtures design.
ANOVA were performed on the resilient modulus data using the
following statistical model:
Yijkn, = M + B ± + Pj + BPij + Ak + BA^ + PAJk + BPAijk + S(BPA) (iJk)1
+ W(iik)X + Tn + BT^ + PTJB1
+ BPT ijin + AT^ + BAT^ + PATjkn
+ BPATiJkn + S<BPA)T (iJk)lM + € iikla 7.3

Table 7.2 ANOVA Results for Resilient Modulus
91
Source of DF SS F PR>FVariation (10 10
)
B 2 1.21 2.61 0.0837
P 2 6.59 12.19 0.0002
A 2 11.86 21.94 0.0001
BP 4 8.21 7.60 0.0004
BA 4 9.49 0.88 0.4912
PA 4 3.84 3.24 0.0200
BPA 8 1.17 0.54 0.8133
S(BPA) 25 6.76
T 2 2511.00 5397.40 0.0001
BT 4 6.18 6.84 0.0001
PT 4 6.13 6.58 0.0002
AT 4 8.97 9.64 0.0002
BPT 8 9.74 5.23 0.0001
BAT 8 3.91 2.10 0.0001
PAT 8 2.17 0.78 0.0532
BPAT 16 2.89 2.69 0.7039
TS(BPT) 50 11.64
155 2604.89
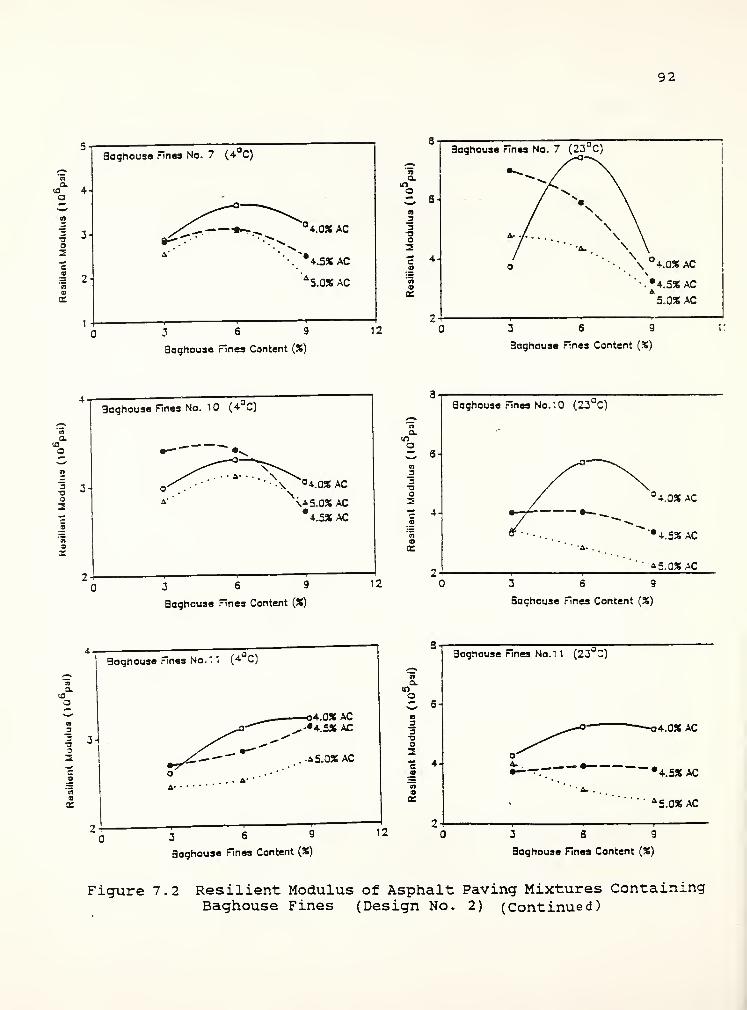
92
Q. .
tO 4a
3
1 3o2"c
I 2
Baghouse Finos No. 7 (4- C)
4.0% AC
4.5% AC
k5.0% AC
3 6 9
Baghouse Fines Content (%)
12
ama
n
-oO2
ae
4-
Baghouse Fines No. 7 (23 C)
\ o\ °4.0% AC
»4.5X ACk
5.0X AC
3 6 9
Boghouse Fines Content (%)
3.
3
23T3
Baghouse Fines No. 10 (4 C)
\ °4.0% AC
\*5.0% AC
*4.5% AC
3 6 9
Baghouse Fines Content (%)
12
a.inoC 6n_333O2
4-1
Baghouse Fines No.'.O (23 C)
4.0* AC
3 6 9
Baghouse Fines Content (%)
atoa
% ^
Baghouse Fines No. 1 1 (4 C)
2c
o4.0% AC-•4.5% AC
. -A 5.0% AC
o
A-A-
-
ama
as
J33-aO2c »a
3 6 9
Baghouse Fines Content {%)
12
Baghouse Fines No.1 1 (23°C)
34.0% AC
~* 4.5% AC
' *5.0% AC
3 6 9
Boghouse Fines Content (%)
Figure 7.2 Resilient Modulus of Asphalt Paving Mixtures ContainingBaghouse Fines (Design No. 2) (Continued)

a.
oC s
m33ao2c2
4-
Baghouse Fines No.
7
(40°C)
* 4.535 AC
A5.035 AC
3 5 9
Baghouse Fines Content (35)
12
93
a.
oC S
01
_33T3O
c 4a
o»
Baghouse Fines No 10 (40aC)
-
• y
o
"- -^ ° 4.035 AC
* 4.535 AC
• a5.035 AC
3 6 9
Baghouse Fines Content (35)
12
01
a.
aC 691
_33oO
C *j>
'35
atr
Baghouse Fines No.1 1 (40 C)
o-
A.
4.035 AC
4.535 AC
k
5.035 AC
3 6 9
Baghouse Fines Content (35)
12
Figure 7.2 Resilient Modulus of Asphalt Paving Mixtures ContainingBaghouse Fines (Design No. 2)

94
The model is similar to the general model described in the
previous section 7.2, with the exception that the compactive effort
terms were not considered. The results of ANOVA are presented in
Table 7.2.
The ANOVA results, indicate that the effects of baghouse fines
(B) ,percent of baghouse fines (P) , asphalt cement content (A) and
testing temperature (T) were all significant . The interaction
terms BP, BA, BT, PT, AT, BPT, BAT, PAT were also significant.
7.4.3 Indirect Tensile Strength and Hveem Stability
The test results as tabulated in Appendix B-3 were analyzed as
a factorial experiment comprising three types of baghouse fines,
three concentrations of baghouse fines, and three different asphalt
cement contents. Baghouse fines, percent of baghouse fines,
percent of asphalt content were regarded as fixed effects, since in
this study limited concern is only in the chosen baghouse fines and
asphalt cement content. The experiment has 52 treatment
combinations
.
The following linear model is assumed for any single
measurement in the experiment:
Yijkl = H + B L + Pj + Ak + PAJk + BPi;i
+ BA^ + BPAijk + £ iJkl 7.4
This is also a complete randomized factorial design. The
ANOVA results are presented in Table 7.3 The ANOVA results (Table
7.3) and Figure 7.3 indicate that the percent of baghouse fines

95
Table 7.3 ANOVA Results for Indirect Tensile Strength(Continuous)
Source of df SS MS F PR>FVariation
B 2 1293.99 646.99 2.15 0.1383
P 2 7487.76 3743.88 12.45 0.0002
A 2 17985.29 8991.15 29.90 0.0001
BP 4 3633.94 980.49 3.02 0.0376
BA 4 1245.96 311.49 1.04 0.4093
PA 4 14751.47 3777.68 12.56 0.0001
BPA 8 5042.52 631.62 2.10 0.0771
e 24 7218.50 300.77
50 63742.62
Table 7 . 3 ANOVA Results for Indirect Tensile Strength(Failure Tensile Strain)
Source of df SS MS F PR>FVariation
B 2 4.21 2.11 7.92 0.0003
P 2 2.54 1.27 4.78 0.0179
A 2 13.01 6.51 24.51 0.0001
BP 4 6.59 1.64 6.20 0.0014
BA 4 1.06 0.265 1.00 0.4269
PA 4 0.86 0.215 0.81 0.5311
BPA 8 15.17 1.90 7.14 0.0001
e 24 6.38 0.266
50 50.48

96
Table 7.4 ANOVA Results for Hveem Stability
Source of df SS MS F PR>FVariation
B 2 224.23 112.17 2.37 0.1150
P 2 2533.50 1266.8 26.77 0.0001
A 2 5322.44 2661.22 56.23 0.0001
BP 4 150.50 37.63 0.800 0.5401
BA 4 210.72 52.68 1.11 0.3934
PA 4 1603.22 400.81 8.47 0.0002
BPA 8 720.99 90.12 1.90 0.1063
e 24 1135.76 47.32 -
50 12558.34

«**
450
400
a»
| 350
a
1 300
o2 250
C
200 4
Baghouae Fines No. 7(23°C)
'4.OS AC
•4.555 AC
A5.03 AC
3 6 9
Baghouae Fines Content (%)
12
97
4.50
~ 400^
Baghouae Fines No. 10 (23 C)
01caim
o
350
c 300
1
u2 250-oc
200
O4.0X AC
3 5 9
Baghouae Fines Content {%)
12
450
n3 400£01c£ 350
c 300a
u£ 250•oc
200
Baghouae Fines No.1 1 (23 C)
3 6 9
Baghouae Fines Content (%)
12
Figure 7.3 Indirect Tensile Strength of Asphalt Paving MixturesContaining Baghouse Fines (No. 2)

•-**--
j3a
EQ>
60-Baghouse Fines No. 7
50- ~~~-°\.Q% AC
40-
'A.
30- '-.
20- *.
10-
A5.03S AC
98
3 6 9
Baghouse Fines Content {%)
12
60-
50-
n2 40
E<o j0X
20
10
Baghouse Fjpes No. 10
°4.0X AC
'•4.5X AC
A5.QXAC
3 6 9
Baghouse Fines Content {%)
12
60
50 -I
2 40
a5 30 -I
x
20-I
10
Baghouse Fines No.1
1
'4.0% AC
'4.5X AC
aS.OX AC
3 6 9
Baghouse Fines Content (35)
12
Figure 7.4 Hveem Stability of Asphalt Paving Mixtures ContainingBaghouse Fines (Design No. 2)

99
(P) , asphalt cement content (A) and their interactions PA, BP, BPA
were significant in indirect tensile strength. The effect of
baghouse fines was not significant.
Figure 7.4 presents the Hveem stability. The ANOVA results
(Table 7.4) indicate that types of baghouse fines (B) , percent of
baghouse fines (P) , percent of asphalt content (A) were
significant.
Figure 7.3 and Figure 7.4 depicting the indirect tensile
strength and Hveem stability are similar to Figure 7.2, in that the
higher the baghouse fines content, the lower will be the strength
of asphalt paving mixtures.
7.5 Summary of Results
The findings presented in this chapter, on the behavior of
asphalt paving mixtures containing with baghouse fines, are
summarized as follows:
1. The gyratory elasto-plastic index increased with
increasing baghouse fines content when the asphalt
content was above the optimum level.
2. The gyratory compactibility index was insensitive to
change in baghouse fines content, type of baghouse fines
and asphalt cement content.
3. The gyratory stability index was relatively insensitive
for the lower baghouse fines content (3%) or low asphalt
cement content (4.0%) but increased significantly as the
baghouse fines content was greater than 6% and the
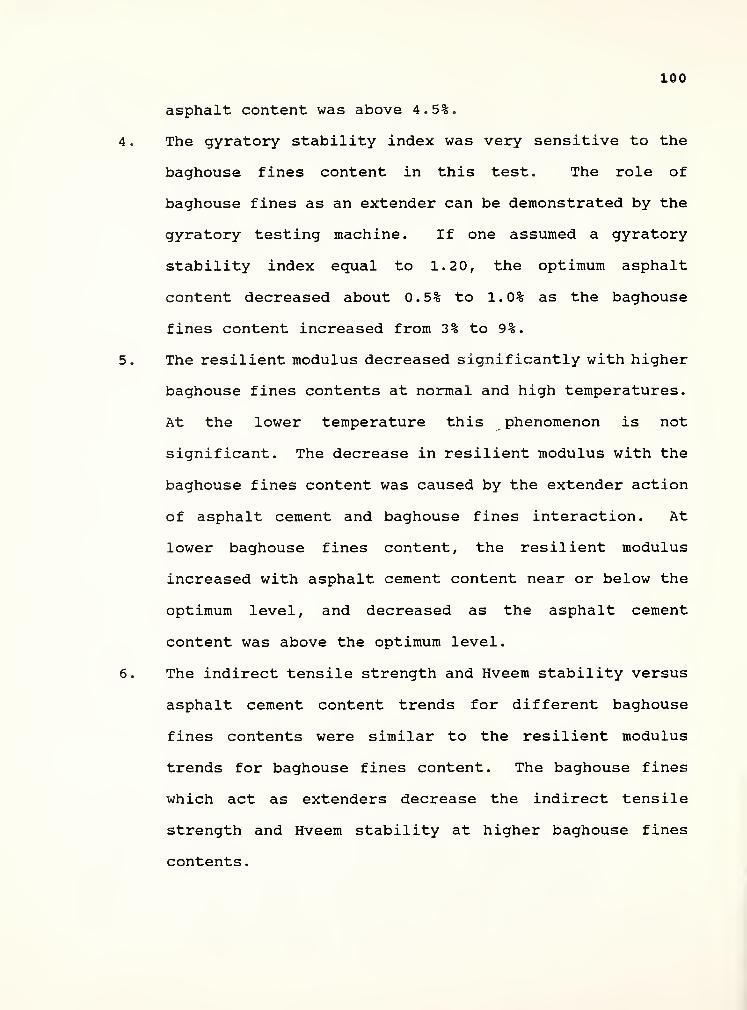
100
asphalt content was above 4.5%.
4. The gyratory stability index was very sensitive to the
baghouse fines content in this test. The role of
baghouse fines as an extender can be demonstrated by the
gyratory testing machine. If one assumed a gyratory
stability index equal to 1.20, the optimum asphalt
content decreased about 0.5% to 1.0% as the baghouse
fines content increased from 3% to 9%.
5. The resilient modulus decreased significantly with higher
baghouse fines contents at normal and high temperatures.
At the lower temperature this phenomenon is not
significant. The decrease in resilient modulus with the
baghouse fines content was caused by the extender action
of asphalt cement and baghouse fines interaction. At
lower baghouse fines content, the resilient modulus
increased with asphalt cement content near or below the
optimum level, and decreased as the asphalt cement
content was above the optimum level.
6. The indirect tensile strength and Hveem stability versus
asphalt cement content trends for different baghouse
fines contents were similar to the resilient modulus
trends for baghouse fines content. The baghouse fines
which act as extenders decrease the indirect tensile
strength and Hveem stability at higher baghouse fines
contents.

101
CHAPTER 8
CONDITIONING OF ASPHALT PAVING MIXTURESWITH BAGHOUSE FINES
8.1 Introduction
Conditioning of asphalt paving specimens in the laboratory for
the evaluation and design of mixtures includes both time and
traffic effects. This chapter discusses those changes of asphalt
paving mixtures due to time and traffic. Mixture conditioning
includes the simulation of plant aging and environmental aging,
moisture damage, and traffic densification.
One of the important factors in predicting the properties of
asphalt paving mixtures and how these properties vary with time is
the behavior of the asphalt cement with regard to aging hardening.
The procedure generated in the NCHRP AAMAS projects (30) is to age
the loose mix in a forced draft oven at 275°F for a period of 4
hours to simulate the production hardening in an asphalt plant.
Environmental or inservice aging used the forced draft oven set at
a temperature of 140°F for 2 days. After initial heating, the oven
temperature is increased to 2 2 5°F for an additional 5 days.
Moisture conditioning is also an important factor to be
evaluated for asphalt paving mixtures. Stripping or moisture
damage is one of the detrimental characteristics of mixtures.
Currently ASTM D4867 is the standardized procedure that has been
developed to evaluate moisture damage of asphalt paving mixtures
(29) .
Traffic densification of asphalt paving mixtures is defined

102
simply as an additional reduction in air voids after initial
compaction. The gyratory testing machine can be used to evaluate
how the properties of the mixture will vary with traffic loads and
tire pressures.
This chapter presents the results of the three sets of
experiments (Designs 3, 4, & 5) which dealt with the conditioning
behavior of the asphalt paving mixtures. In design No. 3 (shown in
Table 5.3), the asphalt paving mixtures tested were made from an
artificially aged condition. In design No. 4 (shown in Table 5.4),
the asphalt paving mixtures tested were made from a water
saturation condition. In design No. 5 (shown in Table 5.5), the
asphalt paving mixtures tested were made from a gyratory
densification condition.
The main objectives of those experiments were as follows:
1. The characteristics of asphalt paving mixtures under different
compactive efforts were evaluated using gyratory testing
machine.
2. The effects of substituting baghouse fines for asphalt cement
in asphalt paving mixture, while maintaining a constant volume
of baghouse fines plus asphalt cement, were studied by
performing indirect tensile and resilient modulus tests.
3
.
The effects of various methods of conditioning such as aging
behavior, water damage, and densification upon the performance
of asphalt paving mixtures were considered.
4. A statistical analysis was conducted to establish the
significance and relationships among test parameters.

103
The general laboratory procedure described in chapter 4 was
used to prepare and to test the asphalt paving mixtures. All loose
mixes were subjected to initial aging which simulated the
production in an asphalt plant. The aging was achieved in a forced
draft oven at 275°F for 4 hours. The specimens were then
fabricated by gyratory testing machine.
8.2 Aging Behavior
Compacted specimens of the asphalt paving mixtures containing
different kinds and contents of baghouse fines were artificially
aged by storage in a forced draft oven set at a temperature of
140°F for 2 days and then elevated to 225°F for 5 days. The
independent variables included the kinds of baghouse fines, the
baghouse fines/asphalt cement ratio added, (maintaining a constant
volume of baghouse fines and asphalt cement) , the aging time, and
the testing temperature. Gyratory parameters were obtained during
the compaction process. The properties of the asphalt paving
mixtures measured at various temperatures were the resilient
modulus, the indirect tensile strength, and failure tensile strain.
The above response variables were obtained at the same temperature
and compared with the same parameters obtained for non aged
specimens.
8.2.1 Gyratory Parameters
The gyratory parameters for asphalt paving mixtures containing
baghouse fines were collected during the compaction process.

104
ANOVAs were performed on the obtained data using the following
model
:
*iJki= M + Pi + *(i, + Bj + Pk + PBjk + G r + FB
i;i+ FPJk + FG^
8 .
1
+ P^jl + + € ijklm"
Where ijklm = Response variable: GEPI, GSI, GCI, and rd
/i = Overall mean of response variable
Fi = Effect of different time of fabricating
specimens
Bj = Effect of different kinds of baghouse fines
Pk = Effect of percent of baghouse fines and
asphalt cement content added
G l= Effect of aging
SL
= Restriction error
e = Experimental error
FB^ FP ik FGU FBPGijkl = Effects of intersections
of factors
i,l = 1,2 j,k = 1,2,3 n = 1,2
This is a randomized factorial design. The ANOVA results are
presented in Table 8.1. It can be noted that the gyratory
compactibility index, gyratory elasto-plastic index, and unit
weight of specimens were insensitive to the changes of baghouse
fines/asphalt cement ratio, different kinds of baghouse fines,
aging time, and fabricating time. Figure 8.1 indicates that the
gyratory stability index (GSI) increased with an increasing asphalt
content (decreasing baghouse fine/asphalt cement ratio) and then
decreased as the asphalt cement content increased above the optimum

105
1.2
3.3 4.3 4.3 5.3
Asphalt Cement Content (%)
5.3
3.3 4.3 4.3 5.3
Asphalt Cement Content (%)
5.3
Z.3 3.3 4.3 4.3 5.3
Asphalt Cement Content (%)
5.3
Figure 8.1 Gyratory Indices of Asphalt Paving Mixtures ContainingBaghouse Fines/Asphalt Cement Content (BH + AC =Constant; Design No. 3)

106
Table 8 . 1 ANOVA Results for Gyratory Parameters(Design No. 3)
Source of Response VariablesVariation GEPI GSI1 GSI2 GCI rd
F N.S. N.S. N.S. N.S. N.S.
B N.S. N.S. N.S. N.S. N.S.
P N.S. S. S. N.S. N.S.
G N.S. S. S.* N.S. N.S.
FB N.S. S.* N.S. N.S. N.S.
FP N.S. s. N.S. N.S. N.S.
FG N.S. N.S. S. N.S. N.S.
BP N.S. N.S. N.S. S.* N.S.
BG N.S. N.S. N.S. N.S. N.S.
PG N.S. N.S. S. N.S. N.S.
S. = significant at a = 0.05, N.S. = not significant at a = 0.05
S.* = significant at a = 0.10

107
level for both compactive efforts (GSI1=30 revolutions, GSI2=60
revolutions)
Results of the gyratory parameters are tabulated in Appendix
C-l. Test results include data on each replicate tested as well as
the average of the two replicates tested.
8.2.2 Resilient Modulus
The resilient moduli of asphalt paving mixtures containing
baghouse fines in Design 3 are presented in Figure 8.2 and 8.3, as
a function of asphalt cement content (baghouse fines/asphalt cement
ratio) , aging, and temperature. It can be observed that the
resilient modulus decreased as asphalt content increased (baghouse
fines/asphalt cement ratio decreased) , but at a higher asphalt
cement content, the change of the resilient modulus was minimal.
Drastic increases in the resilient modulus were caused by the
artificial aging process. The resilient modulus increased by 400%
to 1000% due to artificial aging for mixtures with different kinds
of baghouse fines especially at lower asphalt cement content
(higher baghouse fines/asphalt cement ratio) and the higher testing
temperature (40°C) . The resilient modulus only increased about 80%
to 200% at higher asphalt cement contents (lower baghouse
fines/asphalt cement ratio) at lower testing temperatures. This
could imply that the aging process may be more detrimental for
lower asphalt cement content (higher baghouse fines/asphalt cement
ratio) and at higher pavement temperatures.
ANOVA were performed on the resilient modulus data using the

108
following statistical model:
*um. = M + B i + pj + Bpij + S(BP) (ij)k + * ijk + O x +BOil + PO^
+ OBPijj. + S(BP)0 (ij)kl + Wijkl + T„ + BT^ + PTJni + OT^
+ . ... . Cj^jj^^———————————————————————————————— —
—
——— 8 . 2
The model is similar to the general model described in the
previous Chapter 7, with the exception that the compactive effort
terms were replaced by oven effect. The results of ANOVA are
presented in Table 8.2.
The ANOVA results indicate that the effects of asphalt cement
content (baghouse fines/asphalt cement ratio,. P) , aging time (O)
,
and testing temperature (T) were all significant at a = 0.05. The
interaction terms PO, BT, PT, TO were also significant.
Figure 8.2 presents the resilient modulus for various aging
conditions at a different testing temperatures. It can be noted
that the ratio of the resilient modulus for any condition divided
by the resilient modulus for non-aging (aging index) increased as
the testing temperature increased. Figure 8.3 presents the
resilient modulus of asphalt paving mixtures near optimum asphalt
content at different stages of aging.
The test results of resilient modulus are tabulated in
Appendix C-2 . Test results include data on each replicate test.
8.2.3 Hveem Stability
The test results of Hveem stability as tabulated in Appendix
C-3 were analyzed as a result of the factorial experiment

109
a.aa
23
o2
4*
Bagnouse Fines No. 7 (4 C)
•• Aging
NO Aging
3.3 3.3 4.3 4.3 5.3
Asonalt Cement Content (%)
5.3
a.too
_3
O2
Bagnouse Fines No. 7 (23 C)
i Aging
"O NO Aging
3.3 3.3 4.3 4.3 5.3
Asphalt Cement Content (%)
5.3
Q.ID
ao2
oa:
Bagnouse Fines No. 17 (4 C)
( Aging
NO Aging
a.
o
_33oO
a:
3.3 3.3 4.3 4.3 5.3
Asonalt Cement Content (%)
5.3
2-
Baghouse Fines No. 17 (23 C)
Aging
NO Aging
3.3 3.3 4.3 4.3 5.3
Asphalt Cement Content {%)
5.3
a.aa
_33oa
Bagnouse Fines No.20 (4 C)
3.2 3.3 4.3 4.3 5.3
Asphalt Cement Content (%)
5.3
a.COo
_33-3O
Baghouse Fines No.20 (23 C)
o NO Aging~ Aging
3.3 3.3 4.3 4.3 5.3
Asphalt Cement Content {%)
5.3
Figure 8.2 Resilient Modulus of Asphalt Paving Mixtures ContainingBaghouse Fines/Asphalt Cement Content (BH + AC =
Constant; Design No. 3) (Continue)

110
Q.ino
_23
O
13
10-
7-
3 4-
Baghouse Fines No. 7 (40 C)O-—-o NO Aging•-—• Aging 2 daya a Aging 7 day
3.3 3.8 4.3 4.8 5.3
Asphalt Cement Content (%)
5.8
ino
11
91
= 73Oo
2 5^c2'3i
» J
Baghouse Fines No.17 (40 C)o o NO Aging• • Aging 2 day& & Aging 7 day
3.3 3.3 4.3 4.3 5.3
Asphalt Cement Content (%)
5.8
11
a.
O
2 7-5o
t 5ca
a:
Baghouse Fines No.20 (40°C)o o NO Aging• • Aging 2 daya & Aging 7 day
3.3 3.8 4.3 4.8 5.3
Asphalt Cement Content (X)
5.3
Figure 8.2 Resilient Modulus of Asphalt Paving Mixtures ContainingBaghouse Fines/Asphalt Cement Content (BH + AC =
Constant; Design No. 3)

Ill
a.ooC. *.o
23-332S. 3J-
3.0
3agnouse ~nes No. 7 (- C)
4-
3.a
o-•-i-
-O a hrs•• 48 hrs-a. 168hrs
o +.a
Asonait Cement Content (%)
5.2
aa
a2
+.j 4.. a
Aspnalt Cement Content {%)
4.5
aaaC 4.0
nZ\
3ao3c 3.5-1
oIE
3.0
Saqnouse Fines Mo. 17 (4 Z)
3.3
-o hrs-• 48 hrs-i 1 68hrs
4.3 4.3
Asanait Cement Content {%)
5.2
a
_3
3-3a2
3.3 4.3 A.3
Asphalt Cement Content {%)
10.0
ao
_3
3oa2
|
aoqhouse Fines No.20 (4°C)
3.0
6.0
4.0-
2.0-
0.0 43.3
o-•-
-o hrs-• 48 hrs-a 168hrs a
o
_33oo2
4.3 +-3
Asphalt Cement Content (X)
5.3
3.0
2.5
2.0
1.5
1.0
0.5
Baghouse Fines No.20 (23°C)
3.3
O o hrs• • 48 hrsA & 158hrs
'4.3 4.8
Asphalt Cement Content (%)
Figure 8-3 Resilient Modulus of Asphalt Paving Mixtures withOptimum Asphalt Cement Content at Different AgingConditions (Design No. 3) (Continue)
5.3

112
4.50
a.tooC. +-00-I
013
O3r 3.50
3.00
Boghouae Fines No. 7 (40°C) °
3.8
o o hrs• • 48 hrsa & 168hrs
4.3 4.8
Asphalt Cement Content (%)
5.3
3.00
Q.m 6.00-o
-g 4.00 -l
o
c= 2.00-01
0.00
Baqnouse Fines No. 17 (40°C) o o hrs3 • • 48 hrs
a «. 168hrs
3.3 4.3 4.8
Asphalt Cement Content (%)
5.3
3.00
aa
2,3-ao2
Figure 8.3
6.00
4.00
caI 2.00
0.00
Baghouse Fines
No. 20 (40°C)
3.8
o-—o hrs• • 48 hrsa a 168hrs
4.3 4.8
Asphalt Cement Content {%)
5.3
Resilient Modulus of Asphalt Paving Mixtures withOptimum Asphalt Cement Content at Different AgingConditions (Design No. 3)

113
Table 8.2 ANOVA Results for Resilient Modulus(Design No. 3)
Source of df SS MS F PR>FVariation (10 10
) (10 10)
B 2 89.8 44.9 2.43 0.130
P 3 289.6 96.5 5.22 0.0155
BP 6 33.4 5.6 0.30 0.9247
S(BP) 12 222.0 18.5
2 160.4 80.2 22.05 0.0001
BO 4 10.4 2.6 0.71 0.5905
PO 6 97.4 16.3 4.46 0.0036
BPO 12 21.4 1.8 0.49 0.9006
S(BP)0 24 87.3 3.6
T 1 9926.1 9926.1 4614.60 0.0001
BT 2 39.4 19.7 9.18 0.0011
PT 3 43.1 14.4 6.67 0.0020
BPT 6 31.2 5.2 2.42 0.0570
S(BP)T 12 81.8 6.8 3.17 0.0078
OT 2 10.6 5.3 2.47 0.1055
BOT 4 9.9 2.5 1.15 0.3563
POT 6 27.1 4.5 2.10 0.0907
BPOT 12 13.3 1.1 0.51 0.8856
S(BP)OT 24 51.6 2.2
e 131 231.06
274 14899.33

114
comprising three kinds of baghouse fines, asphalt cement content
(baghouse fines/asphalt cement ratio), and aging time. ANOVAs were
performed on obtained data using the following model:
l ijkl = n + BA + Pj + BP^ + k +80^ + POjk + BPOijk + € ijkl—8.3
The terms in the model are as defined earlier. The ANOVA
results are presented in Table 8.3. Figure 8.4 depicts the
relationship between Hveem stability and baghouse fines/asphalt
cement ratio under aging condition. Results from Hveem stability
show that there are significant differences among asphalt cement
contents, (baghouse fines/asphalt cement ratio) , and aging
condition. The Hveem stability decreased for the aged condition at
asphalt cement contents less than the optimum and increased for
values greater than the optimum. The unaged condition displayed
only minor changes in Hveem stability at increasing asphalt cement
content.
8.2.4 Indirect Tensile Strength
Indirect tensile strength and failure tensile strain
measurements were collected on asphalt paving mixtures containing
different asphalt cement contents (baghouse fines/asphalt cement
ratio) . ANOVAs were performed on the obtained data using the same
statistical model as for the Hveem stability, with the addition of
the testing temperature terms and their interaction terms. The
ANOVA results are represented in Table 8.4 and Table 8.5. Figure

115
Table 8.3 ANOVA Results of Hveem Stability(Design No. 3)
Source ofVariation df SS MS F PR>F
B 2 174.93 87.47 4.76 0.0577
P 3 476.72 155.91 8.49 0.0140
1 126.04 126.04 6.87 0.0396
BP 6 42.18 7.03 0.38 0.8661
BO 2 79.31 39.66 2.16 0.1965
PO 3 168.13 56.04 3.05 0.1136
€ 6 110.13 18.36
23 1168.43
Table 8.4 ANOVA Results of Indirect Tensile Strength(Design No. 3)
Source ofVariation df SS MS F PR>F
B 2 318.38 159.19 0.19 0.8294
P 3 28631.23 954.37 11.31 0.0001
1 2451.02 2451.02 2.90 0.1018
T 1 1425196.69 1425196.69 1688.54 0.0001
BP 6 3988.96 664.83 0.79 0.5886
BT 2 4331.38 2165.69 2.57 0.1002
BO 2 4299.29 2149.6 2.55 0.0987
PO 3 1922.23 640.74 0.76 0.5285
PT 3 16441.23 5480.41 6.49 0.0024
OT 1 475.02 475.02 0.56 0.4607
e 23 19412.90
47 1507468.31
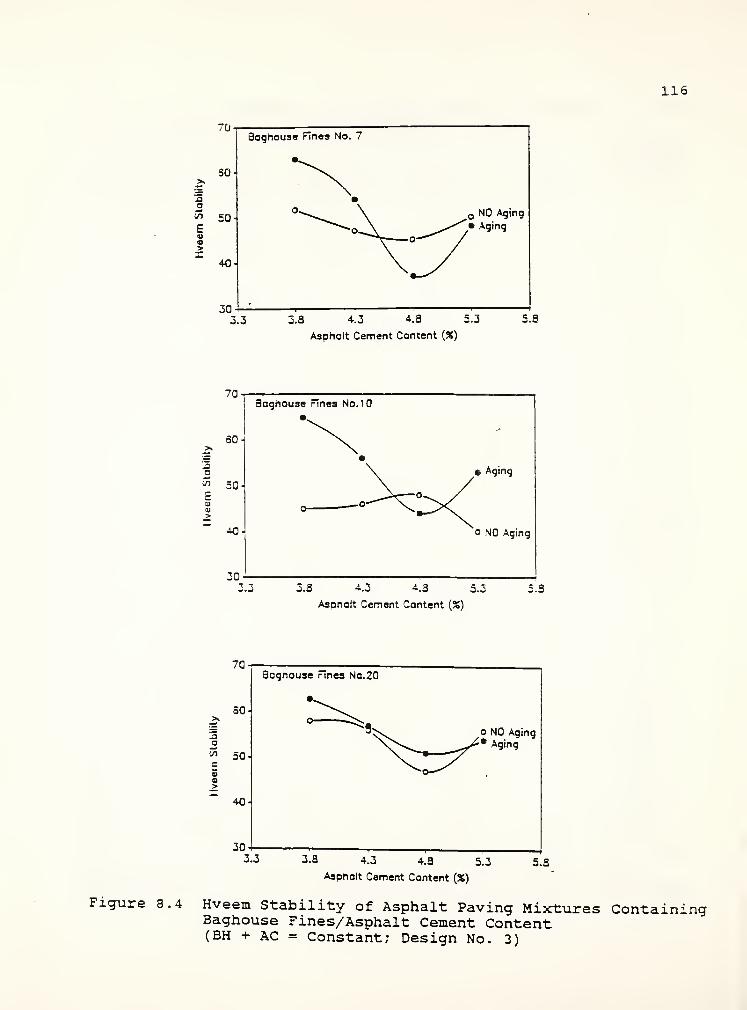
116
70
SO-
ao01 50E
>
40-
30
3aghouso Fines No. 7
NO Aging
Aging
3.3 3.3 4.3 4.3 5.3 5.
Asphalt Cement Content {%)
70
50
-3O<" 50E
40-
3agnouse rines No. 10
20
t Aging
o NO Aging
2.3 3.3 4.3 4.3 5.3
Asohalt Cement Content {%)
5.3
70
50->>
aK 50E
40-
30
Boghouse Fines No.20
o NO Aging• Aging
3-2 3.3 4.3 4.3 5.3
Asphalt Cement Content (X)
5.3
Figure 8.4 Hveem Stability of Asphalt Paving Mixtures ContainingBaghouse Fines/Asphalt Cement Content(BH + AC = Constant; Design No. 3)
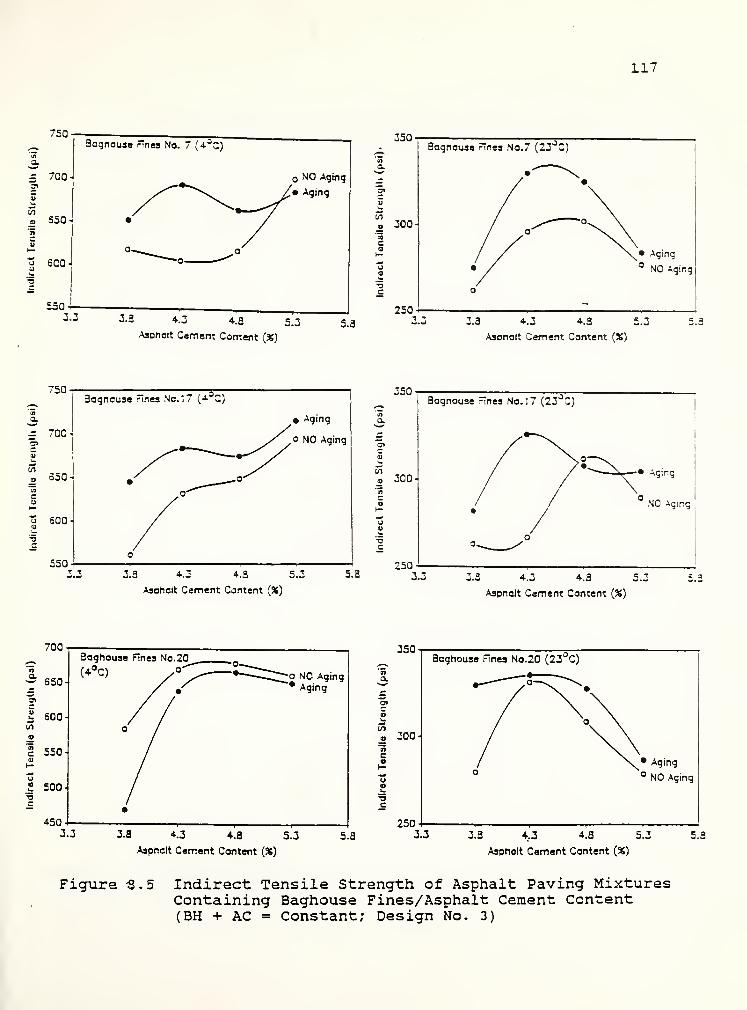
117
750
£ 7003»e
650
u SCO J
Bagnouse Fines No. 7 (43C)
"3
550-
o NO Aging
Aging
3-3 4.3 4.3 SJAsDfialt Carnent Content (X)
5.3
350-
c
300
250
Bagnouse Fines No.7 (23°C)
• Aging
NO Aging
3.3 3.3 4.3 4.3 5.3
Asonalt Carnent Content (%)
5.3
750-
^ 700-3<C
650-
o 500
"3
550
3agnouse nnes No.17 (a. C)
• Aging
o NO Aging
3.3 3.3 +.3 4.3 5.3
Asohalt Cement Content {%)
350
300-
5.3250
Bagnouse Fines No. 17 (23 C)
2.2 3.3 4.3 4.3
Aging
NO Aging
5.3
Aspnalt Cement Content (%)
5.3
700
* 650-
31c
600-
550-
500-
c
450
3aghouse Fines No.20
(4°C)-°'~
2.2 3.3 4.3 4.3
;o NO Aging*• Aging
5.3
Asphalt Cement Content (X)
5.3
350
300-
-oc
250
Baghouse Fines No.20 (23 C)
2.2 3.3 4,3 4.3 5.3
Asphalt Cement Content (%)
5.3
Figure 3.5 Indirect Tensile Strength of Asphalt Paving MixturesContaining Baghouse Fines/Asphalt Cement Content(BH + AC = Constant; Design No. 3)
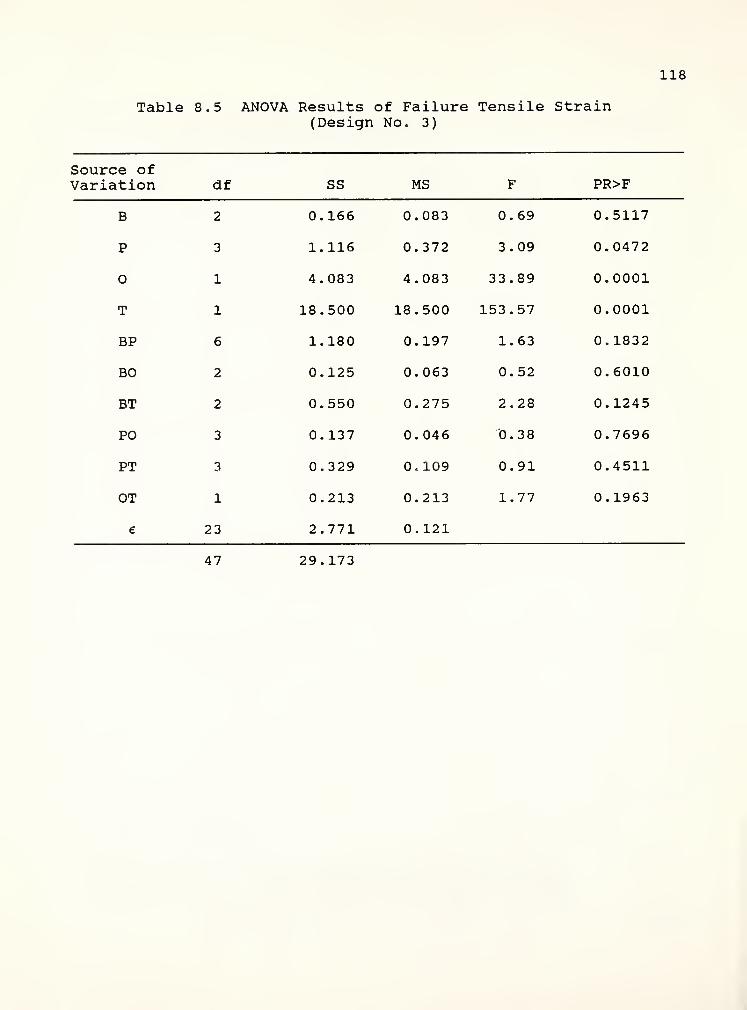
118
Table 8.5 ANOVA Results of Failure Tensile Strain(Design No. 3)
Source ofVariation df SS MS F PR>F
B 2 0.166 0.083 0.69 0.5117
P 3 1.116 0.372 3.09 0.0472
1 4.083 4.083 33.89 0.0001
T 1 18.500 18.500 153.57 0.0001
BP 6 1.180 0.197 1.63 0.1832
BO 2 0.125 0.063 0.52 0.6010
BT 2 0.550 0.275 2.28 0.1245
PO 3 0.137 0.046 0.38 0.7696
PT 3 0.329 0.109 0.91 0.4511
OT 1 0.213 0.213 1.77 0.1963
e 23 2.771 0.121
47 29.173

119
Sarnole Mumoer
17
Scmple Number
28
Figure 8.6 Failure Tensile Strain of Asphalt Paving MixturesContaining Baghouse Fines/Asphalt Cement Content(BH + AC = Constant; Design No. 3)

120
8.5 depicts the indirect tensile strength under different aging
conditions. The indirect tensile strength for asphalt paving
mixtures increased by different percentages due to the aging
process for mixtures that contained different baghouse fines and
asphalt cement contents (baghouse fines/asphalt cement ratio) at
room temperature. However no such trend was observed at the low
temperature.
Failure tensile strain decreased for all paving mixtures due
to aging. Artificial aging caused the failure tensile strain to be
less at lower temperatures than at room temperature (Figure 8.6).
The effect of different baghouse fines on indirect tensile
strength and failure tensile strain was not significant. However,
asphalt cement content (the baghouse fines/asphalt cement ratio)
,
aging condition, and testing temperature were significant. From
Figure 8.5 it can be seen that at room temperature the indirect
tensile strength was increased by aging asphalt paving mixtures,
but at low temperature the indirect tensile strength was only
increased by aging asphalt paving mixtures at higher baghouse
fines/asphalt cement ratio (lower asphalt cement content)
.
8.2.5 Summary of Results
1. The gyratory elasto-plastic index and the gyratory
compactibility index did not show any distinct trend for the
changes of the asphalt cement content (baghouse fines/asphalt
cement ratio) . The gyratory stability index was sensitive to
the changes in the level of asphalt cement content (baghouse

121
fines/asphalt cement ratio)
.
2. Artificial aging processes caused an increase in the indirect
tensile strength and resilient modulus as well as reduction in
the failure tensile strain values for asphalt paving mixtures.
Asphalt paving mixtures containing a low asphalt cement
content (high baghouse fines/asphalt cement ratio) tend to age
more rapidly than a high asphalt cement content (low baghouse
fines/asphalt cement ratio)
.
3. Resilient modulus and indirect tensile test parameters were
more sensitive to the aging condition of asphalt paving
mixtures than the Hveem stability. Both tests are potential
methods for the study of the aging behavior of mixtures.
4. The level of asphalt cement content (baghouse fines/asphalt
cement ratio) added to the asphalt had significant effect on
the resilient modulus, indirect tensile strength, gyratory
stability index.
5. The effects of different kinds of baghouse fines were not
significant, when asphalt cement was replaced with baghouse
fines in order to maintain a constant volume of asphalt cement
plus baghouse fines.
8.3 Water Sensitivity
ASTM D4687 and AASHTO T283 are currently the standardized
procedures that have been developed to evaluate moisture damage of
asphalt paving mixture. Four test specimens for each set of mix
conditions are tested. Each set of specimens is divided into two

122
groups and tested in a dry condition (stage 1) for indirect tensile
strength and resilient modulus. The other group is subjected to
vacuum saturation (stage 2) followed by a freeze and warm water
soaking cycle (stage 3) and then tested for resilient modulus and
indirect tensile strength. The independent variables included the
kinds of baghouse fines, baghouse fines/asphalt cement ratio added
(maintaining a constant volume of asphalt cement and baghouse
fines) , the saturation condition, and the testing temperature.
Gyratory parameters were obtained during the compaction process.
The properties of the asphalt paving mixtures measured at various
temperatures were the resilient modulus, the indirect tensile
strength, and the failure tensile strain. Hveem stability is
unacceptable for predicting moisture susceptibility of asphalt
paving mixtures (33) . The above response variables were obtained
at the same circumstances and compared with the same parameters
obtained for dry specimens.
8.3.1 Gyratory Parameters
The gyratory parameters for asphalt paving mixtures containing
baghouse fines were read during the compaction process. ANOVAs
were performed on obtained data using the statistical model which
was the same as section 8.2 (page ??? ). The ANOVA results are
presented in Table 8.6. It can be noted that the gyratory
compactibility index, gyratory elasto-plastic index, and unit
weight of specimens were insensitive to the changes of asphalt
cement content (baghouse fines/asphalt cement ratio) , aging time

Table 8.6 ANOVA Results for Gyratory Parameters(Design No. 4)
123
Source ofVariation GEPI
Response VariablesGSI1 GSI2 GCI rd
F N.S
B N.S
P N.S
G N.S
FB N.S
FP N.S
FG N.S
BP N.S
BG N.S
PG N.S
S. S. N.S. S.
s. s.* S. N.S.
s. s. N.S. N.S.
N.S. s. N.S. N.S.
N.S. N.S. N.S. N.S.
N.S. s.* N.S. N.S.
N.S. s.* N.S. N.S.
N.S. N.S. N.S. N.S.
N.S. N.S. N.S. N.S.
N.S. N.S. N.S. N.S.
S. = significant at a = 0.05, N.S. = not significant at a = 0.05,
S.* = significant at a = 0.10

124
1.4
1.3-
BOa
| 1-2-1
o"5 t.Hwa*O
1.0
0.9
Bagnouse Fines No. 5 —o GEPI•—• GSMa -a. GSI2* * GCI
3.8 4.3 4.3 5.3 5.3
Aspholt Cement Content (%)
6.3
a
aa
1.4Bagnouse Fines No. 8
1.3-
1.2-
1.1
1.0
0.9
o—o GEPI• • GSMa-— a. GSI2a * GCI
3.8 4.3 4.3 5.3 5.3
Aspnatt Cement Content (X)
S.3
c
&"3
>>o
1.4
Boghouse Fines No.20
1.3-
1.2
1.1 -
1.0
0.9
3.8 4.3
o GEPI• • GSI1a a GSI2* •» GCI
4-8 5.3 5.8
Asphalt Cement Content (X)
6.3
Figure 8.7 Gyratory Indices of Asphalt Paving Mixtures ContainingBaghouse Fines/Asphalt Cement Content(BH + AC = Constant; Design No. 4)

125
and fabricating time. Figure 8.7 shows that the gyratory stability
index (GSI) increased with increased asphalt cement content
(decreasing baghouse fines/asphalt cement ratio) . Results of
gyratory parameters are tabulated in Appendix C-5. The gyratory
compactibility index of baghouse fines No. 5 was higher than No. 8
and No. 20. This was probably due to the fine state of subdivision
of baghouse fines No. 5.
8.3.2 Resilient Modulus
The resilient modulus of asphalt paving mixtures containing
baghouse fines as outlined in Design 4 are presented in Figure 8.8
and Figure 8.9 as a function of asphalt cement content (baghouse
fines/asphalt cement ratio) , water saturation, and temperature. It
can be observed that the resilient modulus decreased as asphalt
cement content increased (baghouse fines/asphalt cement content
decreased) in dry condition. The moisture condition represented by
saturation (stage 3) in Figure 8.8 created the situation such that
the resilient modulus decreased as the asphalt cement content
increased (baghouse fines/asphalt cement ratio decreased) , reached
a minimum and then increased with high asphalt content. The trend
of resilient modulus increase may be caused by the pore pressure
existing in the voids of the specimen at room temperature. The
resilient modulus always decreased as asphalt cement increased
(baghouse fines/asphalt cement ratio decreased) at higher
temperatures (eg. 104°F) . This could imply that water damage may
be more severe for lower asphalt cement contents (higher baghouse
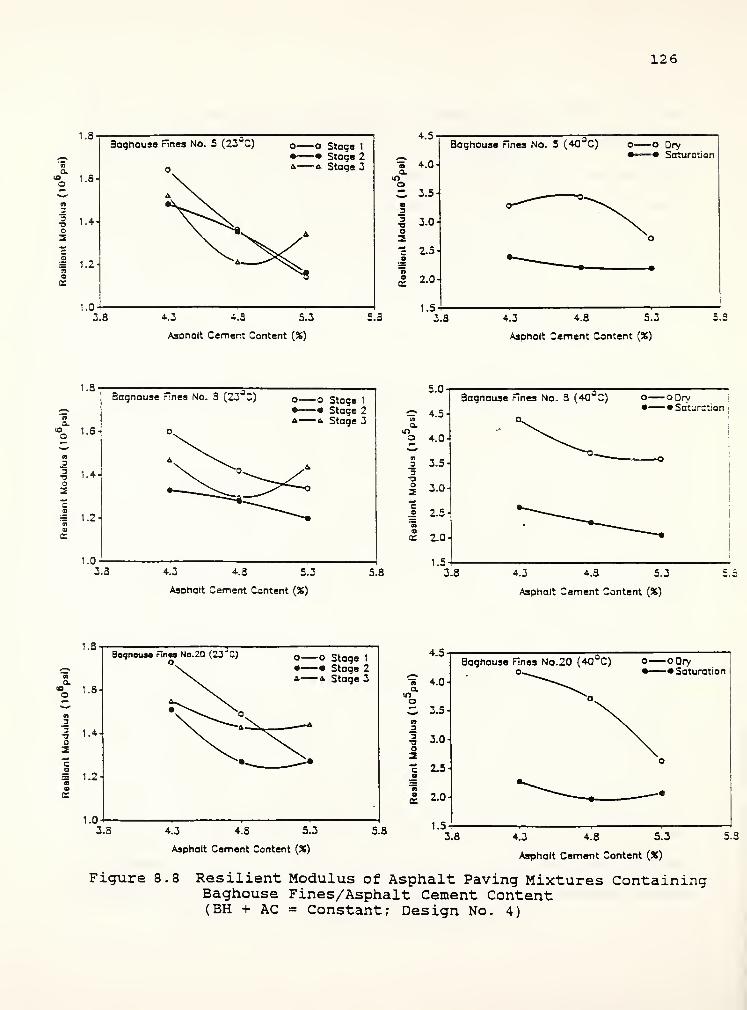
126
1.3
a.
•o 1 - S
4 1-4o2
i i.2-
1.0
Bughouse Fines No. 5 (23 C)
o
o—o Stage 1•—• Stage 24—a Stage 3
3.3 4.3 4.3 5.3
Asphalt Cement Content (%)
4.5
lT 4.0-a.moC 3.5a
I 3.0 Ha2c 2.5.2
"n
2.04
5.3
IT
1.5
Baghouse Fines No. 5 (40 C)
3.3
o o Dry•—• Saturation
4.3 4.3 5.3
Asphalt Cement Content (%)
5.3
a.
O
23•oo2
1.3
1.6
1.4
:•= 1.2
1.0
Bognouse rines No. 3 (23 C) o o Stage 1
•-—• Stage 24 4 Stage 3
3.3 4.3 4.3 5.3
Asphalt Cement Content (X)
5.0-
5.3
~ 4.5
o 4.0-
2 3.5-
% 3.0
I 2.5-1
k 2.0
1.5-
Bagnouse Fines No. 3 (40°C) o oOry• •Saturation
o.
-
3.8 4.3 4.8 5.3
Asphalt Cement Content {%)
I
5.5
1.8
2
O
1.S
1.4-
= 1.2
1.0
Boqnous* r in«s No. 20 (23 Z)O o—o Stage 1
• • Stage 24 4 Stage 3
3.8 4.3 4.8 5.3
Asphalt Cement Content (%)
5.8
4.5
~S 4.0a.moC 3.5n_2
-g 3.0o2c 2.5
I 2.0
1.5
Baghouse Fines No.20 (40 C)0.
o oOry• •Saturation
3.8 4.3 4.8 5.3
Asphalt Cement Content (%)
5.8
Figure 8.8 Resilient Modulus of Asphalt Paving Mixtures ContainingBaghouse Fines/Asphalt Cement Content(BH + AC = Constant; Design No. 4)

127
;oo-
a.ino
_2
a10-
Bagnouae .-tries 'ia.z
10 20 30
Temoercture ( Z)
Or/a—a 4.335
•— • 4.axa a. 5.335
SaturationA- A 4.335
a- -2 4.335
5.335
40 50
100-
a.ma
01
3-3O
10-
Baghouse ~nes No.
3
10 20 30
"ernperature (°C)
Drya—o 4.3X1• • J-.3X
|
a— a 5.335 i
Saturation I
a- A4.335|
a- 'CA.3X,
5.335
4C 50
100
a.mo
_2
ao2
10
c
Saghouse Fines No.20 Dryo
—
-o 4.395• • 4.835a— a 5.33SSaturation4- '
a- •
-
•a 4.335a4.3X
5.331
10 20 30 40 50
Temperature ( C)
'igure 8.9 Resilient Modulus of Asphalt Paving Mixtures ContainingBaghouse Fines/Asphalt Cement Content at DifferentTesting Temperature (Design No. 4)

128
fines/asphalt cement ratio) and at higher pavement temperatures.
ANOVA were performed on the results of resilient modulus test
using the following statistical model:
*iJkL. = M + Bi + Pj + BP^ + S(BP) (lj)k + S 1Jk + WL + BW±1 + PW^
+ BPWiji + S(BP)W (iJ)kl + Wijkl + TB + BT^ + PTjm + WT^
+ ... + fiijkia 8.4
The model is similar to the formula 8.2 described in the
previous section with the exception that the oven effect terms were
replaced by water saturation. The results of ANOVA are present in
Table 8.7.
The ANOVA results indicate that the effects of asphalt cement
content (baghouse fines/asphalt cement ratio, P) , water saturation
(W) , and testing temperature (T) were all significant at a = 0.05.
The interaction terms BT, PW, PT, WT, and BWT were also
significant. Figure 8.9 presents the effects of moisture condition
and different testing temperatures upon the resilient modulus.
Figure 8.10 presents the influence of the saturation condition upon
resilient modulus ratio (MMR) . It can be observed that the effect
of water on the asphalt paving mixtures decreased as the amount of
baghouse fines/asphalt cement ratio decreased or asphalt cement
content increased.
The test results of resilient modulus are tabulated in
Appendix C-6. Test results include data on each replicate test.

Table 8.7 ANOVA Results for the Resilient Modulus(Design No. 4)
129
Source ofVariation
df SS(10 10
)
MS(10 10
)
F PR>F
B 2 54.14 27.07 2.53 0.1339
P 2 483.85 241.93 22.65 0.0003
BP 4 22.99 5.75 0.54 0.7118
S(BP) 9 96.11 10.68
w 2 9141.80 4570.90 874.60 0.0001
BW 4 28.11 7.03 1.34 0.2920
PW 4 225.22 56.31 10.77 0.0001
BPW 8 13.32 1.67 0.32 0.9485
S(BP)W 18 94.07 5.23
T 2 9722.30 4861.15 1416.04 0.0001
BT 4 68.21 17.05 4.97 0.0071
PT 4 77.51 19.38 5.64 0.0040
BPT 8 27.04 3.38 0.98 0.4794
S(BP)T 18 136.35 7.58 2.21 0.0511
WT 2 85.31 42.66 12.43 0.0004
BWT 4 7.09 1.77 0.52 0.7249
PWT 4 14.74 3.68 1.07 0.3987
BPWT 8 6.29 0.79 0.23 0.9803
S(BP)WT 18 61.79 3.43
291

130
1.4
1.2
2* 1.0-
(/i
0.3
0.6
o—o TSR• • MMR Saturated (23° C)a & MMR Water le
Saturated (23°C)* * MMR Saturated (40
aC)
BH No.5
3.8 4.3 4.3 5.3
Asphalt Cement Content (35)
5.3
1.3
a:2 1.12
% 0.9 4
0.7
0.53.3
—o TSR• • MMR Saturated (23°C)a fi. MMR Water it
Saturated (23°C)a * MMR Saturated (40°C)
9H No.3
4.3 4.3 5.3
Asphalt Cement Content (55)
5.3
1.5
1-3-1
o TSR• • MMR Saturated (23°C)a a MMR Water ic
Saturated (23°C)a a MMR Saturated (40°C)
8H No.20
4-3 4.3 5.3
Asphalt Cement Content (X)
5.8
Figure 8.10 Resilient Modulus Ratio and Tensile Strength RatiAsphalt Paving Mixtures (Design No. 4)
o o

131
8.3.3 Indirect Tensile Strength
Indirect tensile strength and failure tensile strain were
measured on asphalt paving mixtures containing different asphalt
cement content (baghouse fines/asphalt cement ratio) under dry and
saturated conditions. ANOVAs were performed on the obtained data
using the same statistical model used as previously in section
8.2.4, with the exception that the oven effect terms were replaced
by water saturation. The ANOVA results are represented in Table
8.8 and Table 8.9. Figure 8.11 depicts the indirect tensile
strength under different conditions of water saturation. It can be
observed that the water sensitivity test significantly reduced the
indirect tensile strength of the asphalt paving mixtures. However,
the kinds of baghouse fines, asphalt cement content ( baghouse
fine/asphalt cement ratio) and their interaction were not
significant on the indirect tensile strength and failure tensile
strain of apshalt paving mixtures. The indirect tensile strength
ratio (TSR) for stage 3 exposure was presented in Figure 8.10. It
can be noted that the indirect tensile strength ratio was greater
than 75%. The effect of water on the asphalt paving mixtures
decreased as the amount of baghouse fines/asphalt cement content
decreased or asphalt cement content increased. This trend was the
same as for the indirect resilient modulus test. It can also be
noted that the water sensitivity test caused drastic reductions in
the indirect tensile strength of unaged asphalt paving mixtures.
The indirect tensile strength ratio of unaged asphalt paving
specimens was only about 80% of the asphalt plant simulated specimens.

132
Table 8.8 ANOVA Results for Indirect Tensile Strength(Design No. 4)
Source ofVariation df SS MS F PR>F
B 2 207.76 103.88 0.05 0.9528
P 2 1098.45 549.23 0.26 0.7762
BP 4 6324.24 1581.06 0.74 0.5758
W 1 31597.71 31597.71 14.73 0.0008
BW 2 1905.57 952.79 0.44 0.6465
PW 2 1314.01 657.01 0.31 0.7390
BPW 4 1062.54 265.64 0.12 0.9725
e 24 51473.33 2414.72
41 94983.62
Table 8.9 ANOVA Results for Failure Tensile Strain(Design No. 4)
Source ofVariation df SS MS PR>F
B 2 0.209 0.105
P 2 2.715 1.358
BP 4 3.881 0.970
W 1 4.600 4.600
BW 2 1.415 0.708
PW 2 1.411 0.706
BPW 4 0.615 0.154
e 24 24.598 1.025
41 39.444
0.10 0.9034
1.32 0.2847
0.95 0.4543
4.49 0.0447
0.69 0.5112
0.69 0.5122
0.15 0.9612

133
400
«- 330
31c
360-1
340
320 4-3
C
300
Bagnouse Fines No. 5 (23°C) ° °0ry•—•SatSaturation
3.3 4.3 4.3 5.3
Asphalt Cament Content (X)
5.3
400
2 350o
P 300
"3
Baghouse Fines No. 3 (23 C)
2503.3
o c-Ory• • Saturation
4.3 4.3 5.3
AsDholt Cement Content (%)
5.3
450
£ 400o>c
• 350'3
c
3 300-1woc
250
Baghouse Fines No.20 (23°C) ° °0ry• * Saturation
3.3 5.34.3 4.3 5.3
Asphalt Cement Content (X)
Figure 8.11 Indirect Tensile Strength of Asphalt Paving MixturesContaining Baghouse Fines/Asphalt Cement Content(BH + AC = Constant; Design No. 4)

134
8.3.4 Summary of Results
1. The indirect tensile strength of asphalt paving mixtures
appears to be quite sensitive to water damage. Since
Marshall test specimens are easily fabricated by most
national laboratories, the splitting indirect tensile
test lends itself quite well to evaluating moisture
sensitivity.
2. This test program indicated that the use of age hardening
improved the resistance of asphalt paving mixtures to
damage by water saturation.
3. The resilient modulus test performed on specimens after
saturation can give confusing results at room test
temperatures and high asphalt cement content (low
baghouse fines/asphalt cement ratio)
.
4. The addition of baghouse fines to the asphalt paving
mixtures decreased the effect of water sensitivity with
an increasing asphalt cement content or decreasing
baghouse fines/asphalt cement ratio.
8.4 Densification
Asphalt pavements with high initial air void levels at time of
construction will densify further under traffic loads. This
reduction in air voids is typically called traffic densification.
The change in air voids under traffic load can be evaluated in the
laboratory by using different compactive efforts and methods. The
Texas Gyratory and the U.S. Corps of Engineers Gyratory Testing

135
Machine (GTM) demonstrated a slight superiority in its ability to
produce specimens with material properties that simulate field
conditions (32) . ASTM D3387 and ASTM D4013 are standardized
procedures for compacting test specimens. The gyratory testing
machine is a versatile piece of equipment that simulates traffic
densification and can be used to prepare and compact asphalt paving
mixtures in the laboratory. In this test program, the GTM was set
at a 1 degree angle, 200 psi ram pressure, and 20 psi oil-filled
roller pressure to compact the specimens that had been placed in a
140°F oven for 24 hrs. The traffic densification simulation tests
were performed up to a total of 300 revolutions.
This section presents the results of Design No. 5 which dealt
with the behavior of asphalt paving mixtures having different kinds
of baghouse fines and asphalt contents. The independent variables
included the kinds of baghouse fines, the asphalt content, the
compactive effort, and the testing temperature. Gyratory
parameters were obtained during the compaction process. The
properties of asphalt paving mixture measured at various
temperatures were resilient modulus, the indirect tensile strength,
and the failure tensile strain. The general laboratory procedures
described in Chapter 4 were used to prepare and to test the asphalt
paving mixtures.
8.4.1 Gyratory Parameters
The gyratory indices for the asphalt paving mixtures in Design
No. 5 are presented in Figure 8.12. ANOVAs were performed on the

13 6
1.5-
1.5-i
« 1.4-
1 1-3.
&o i_7"3w
« 1.1
1.0-
3H No.7
0.3-!—+.0
-OGE?!-•CS11-aGS12
+.5 5.0
Aspnalt Cement Content (%)
5.5
1.5-
1.5-
« 1.4-ajj
I u-&° 1.2awO 1.1
1.0
BH No. 17
0.94.0
a—oGEPi• «GS114 AGSI2* *GCI
4.5 5.0
Asphalt Cement Content (X)
5.5
1.5-3H No.3
1.5-
1.4-
n_
U IjJ73
C
& 1.2-1
a
o , ,
i* 1.1 -i
1.0-
0.3-
4.0
o oGEPI•—•GSI1a 4GSI2* »GC!
4.5 5.0
Aspnolt Cement Content (%)
1.5
1.5
« 1.4o
1 IJ
5 1.2-o
a 1.1
1.0J
0.9
3H No.31
4.0
oGE51
•GSHaGSI2-*GC!
4.5 5.0
AsDno.lt Cement Content (%)
1.5-3H No.32
1.5-t
u
I 1.34
2 1.2-
6 1.1
1.0 4
0.9
4.0
I
I
2.500
o—-oGEPI• «GS11a 4GSI2 ^ 2.550-* *GCl
5 Z500-
4.5 5.0
Aspnolt Cement Content (X)
5.5
| 2.450
3 2.400-
2.350
CZ3 4.5SKAC. SORevVm 4.5XAC,300Rev
SS3 5.0XAC. SORevEZJ 5.0SKAC.3OORev
3:
8 17 32
Sample Number
31
Figure 8.12 Gyratory Indices of Asphalt Paving Mixtures ContainingBaghouse Fines (Design No. 5)
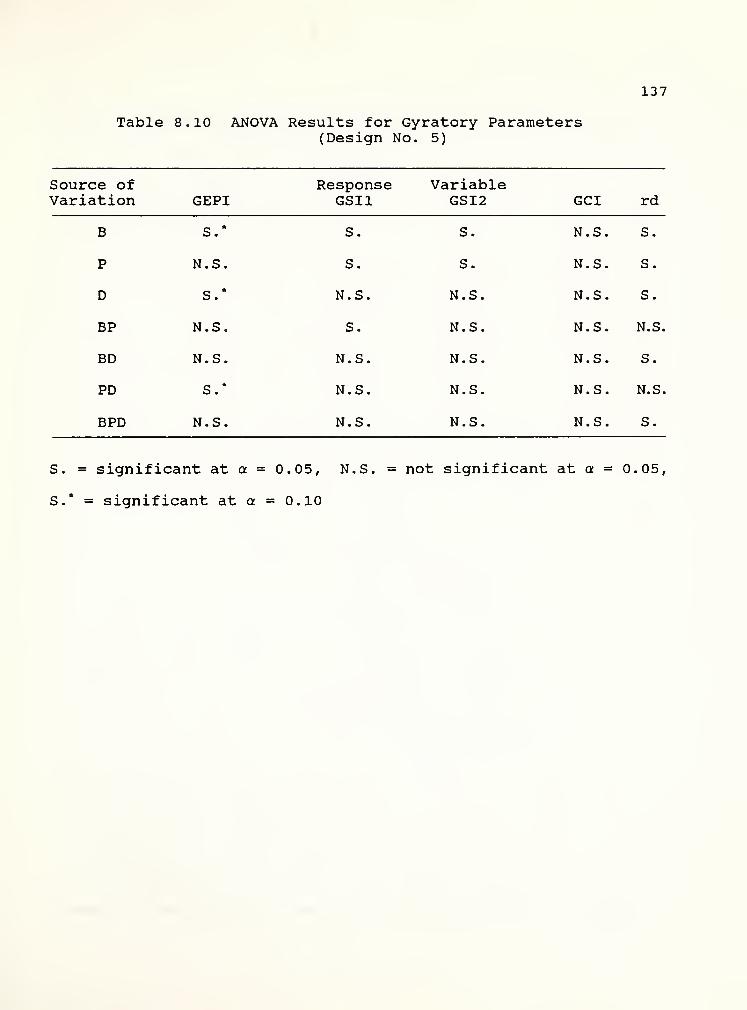
137
Table 8 . 10 ANOVA Results for Gyratory Parameters(Design No. 5)
Source of Response VariableVariation GEPI GSI1 GSI2 GCI rd
B S.* S. S. N.S. S.
P N.S. S. S. N.S. S.
D S.* N.S. N.S. N.S. S.
BP N.S. S. N.S. N.S. N.S.
BD N.S. N.S. N.S. N.S. S.
PD S.* N.S. N.S. N.S. N.S.
BPD N.S. N.S. N.S. N.S. S.
S. = significant at a = 0.05, N.S. = not significant at a = 0.05,
S.* = significant at a = 0.10

138
obtained data using the statistical model which was used in section
8.2. The ANOVA results are presented in Table 8.10. It can be
noted that the gyratory compactibility indices (GCI) were
insensitive to the kinds of baghouse fines and asphalt content.
The gyratory stability index (GSI) increased with increasing
asphalt cement content, except the No. 31 samples which contained
no baghouse fines or mineral fillers. The main factors (type of
baghouse fines, asphalt content, and densification) significantly
affected the unit weight of asphalt paving mixtures. The
interactions BD and BPD also were significant. The higher
compactive efforts and asphalt contents resulted in higher unit
weights of asphalt paving mixtures.
8.4.2 Resilient Modulus
ANOVA were performed on resilient modulus data using the
following statistical model:
*ijW = M + B t + Pj + BP^ + Ok + BO^ + POJk + BPO ijk +
S(BPO) (ijkU + 5 (ijk)1 + T,,, + BT^ + PTjm + OT^ + BOT^ +
POTjkm + BPOT iJkB1 + S(BPO)T (1Jk)lm + e 1JkLB 8.5
The model is similar to the linear model described in the
previous section 7.2 with the exception that the compactive effort
terms were replaced by the densification effort. The results of
ANOVA are presented in Table 8.11. The resilient modulus values
of asphalt paving mixtures in design No. 5 are present in Figure
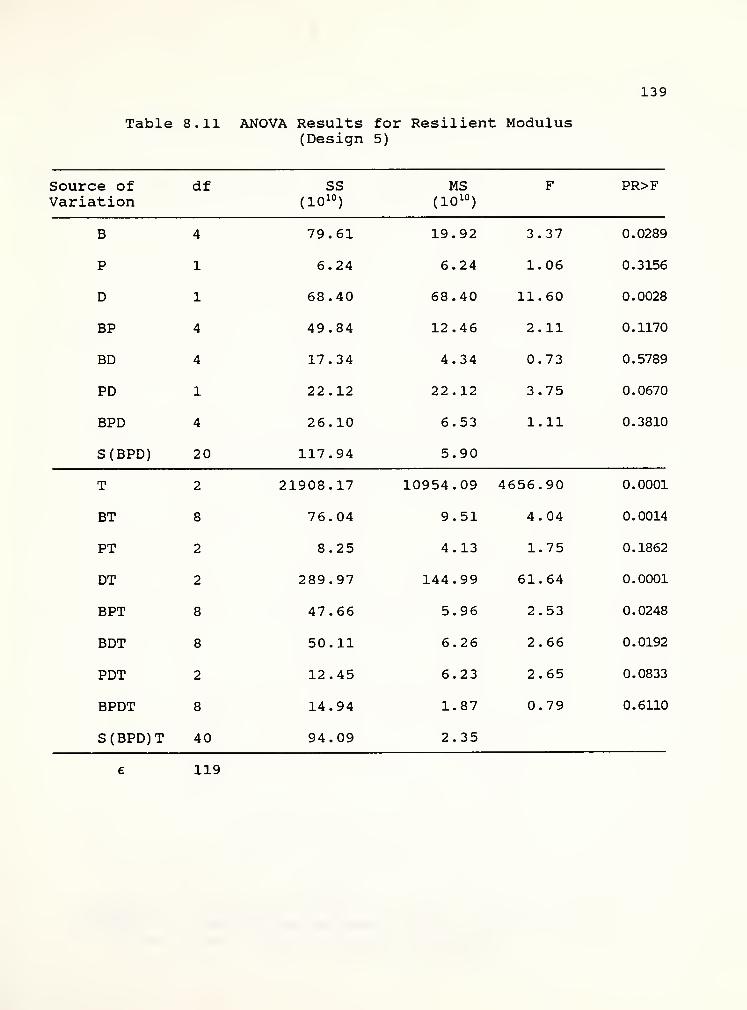
Table 8.11 ANOVA Results for Resilient Modulus(Design 5)
139
Source of df SS MS F PR>FVariation (10 10
) (10 10)
B 4 79.61 19.92 3.37 0.0289
P 1 6.24 6.24 1.06 0.3156
D 1 68.40 68.40 11.60 0.0028
BP 4 49.84 12.46 2.11 0.1170
BD 4 17.34 4.34 0.73 0.5789
PD 1 22.12 22.12 3.75 0.0670
BPD 4 26.10 6.53 1.11 0.3810
S(BPD) 20 117.94 5.90
T 2 21908.17 10954.09 4656.90 0.0001
BT 8 76.04 9.51 4.04 0.0014
PT 2 8.25 4.13 1.75 0.1862
DT 2 289.97 144.99 61.64 0.0001
BPT 8 47.66 5.96 2.53 0.0248
BDT 8 50.11 6.26 2.66 0.0192
PDT 2 12.45 6.23 2.65 0.0833
BPDT 8 14.94 1.87 0.79 0.6110
S(BPD)T 40 94.09 2.35
119

140
3.0-
«£zJ
1 2-0o2c
£ 1.5
1.0
3aghouse Fines No. 7 (22 C) O—O 4.5XAC• • 5.0XAC
3.0
o3" 2.5-
3 2.0o2=
= 1.54
60 120 180 240
Revolutions
ZOO 3601.0
Saghouse Fines No.31 (23°C) O—O 4.5X AC• • 5.0% AC
60 120 130 240
Revolutions
300 360
60 120 180 240
Revoluuons
3.0
•o"
| 2.0o
I 1.5
300 3611.3
3aghouse Fines No.32 (23 C) O O A.cXAC• • 5.0X AC
•""ss—
.
^^,' **—-•
60 120 180 240
Revolutions
300 360
3.0-
»o 2.5
-§ 2.0o
ca= 1.54
1.0
aaghouse Fines No. 17 (23°C) O-—O 4.5S AC• • 5.0X AC
60 120 180 240 300 360
Revolutions
Figure 8.13 Resilient Modulus of Asphalt Paving MixturesContaining Baghouse Fines (Design No. 5)
(Continue)

141
3.0-
« 2.5-
3agnousa Fines No.7 (4Q°C)
o.
2.0-o2
:•= 1.5-,
1.0-
O—O 4.3% AC• • 5.095 AC
120 180 240 300 360
Revolutions
3.0^
a^ 2.5o
§ 2.0o2
2 1.5nvK
Bagnouse Fines No.31 (40°C) O O 4.5% AC
g • • 5.0S; AC
1.0 4
SO 120 130 240
Revolutions
300 350
50 120 130 240 300 360
Revolutions
3.0
a.«Q 2.5
o2
:! 1.5
Bagnouse r:nes No.32 (40 C) O O 4.5* AC• • 5.0* AC
1.0-
60 120 130 240 300 360
Revolutions
3.0
a.-no 2.5
_3
-g 2.0o2
= 1.5«aas
1.0
Boqhouse Fines No. 17 (40 C) O O 4.5S5AC• • 5.0* AC
60 120 180 240 300 360
Revolutions
Figure 8.13 Resilient Modulus of Asphalt Paving Mixtures
Containing Bagnouse Fines (Design No. 5)

142
a.toa
_33-ao2
3.0
2.5
2.0
1.5
1.0-1
0.5
0.0 4
C3 4.5XAC. SORev4.5XAC.300Rev
S3 5.03SAC. SORevE2 5.0XAC,300Rev
(23°C)
17
Sample Number
32 31
a.ino
_33-3
a2
2-
c
i 1
4.5XAC. SORev4.5XAC.300Rev
E3 5.058AC. SORevZZ3 5.0XAC.300Rev
(40°C)
17
Sample Number
32 31
Figure 8.14 Resilient Modulus of Asphalt Paving MixturesContaining Different Types of Baghouse Fines(Design No. 5)
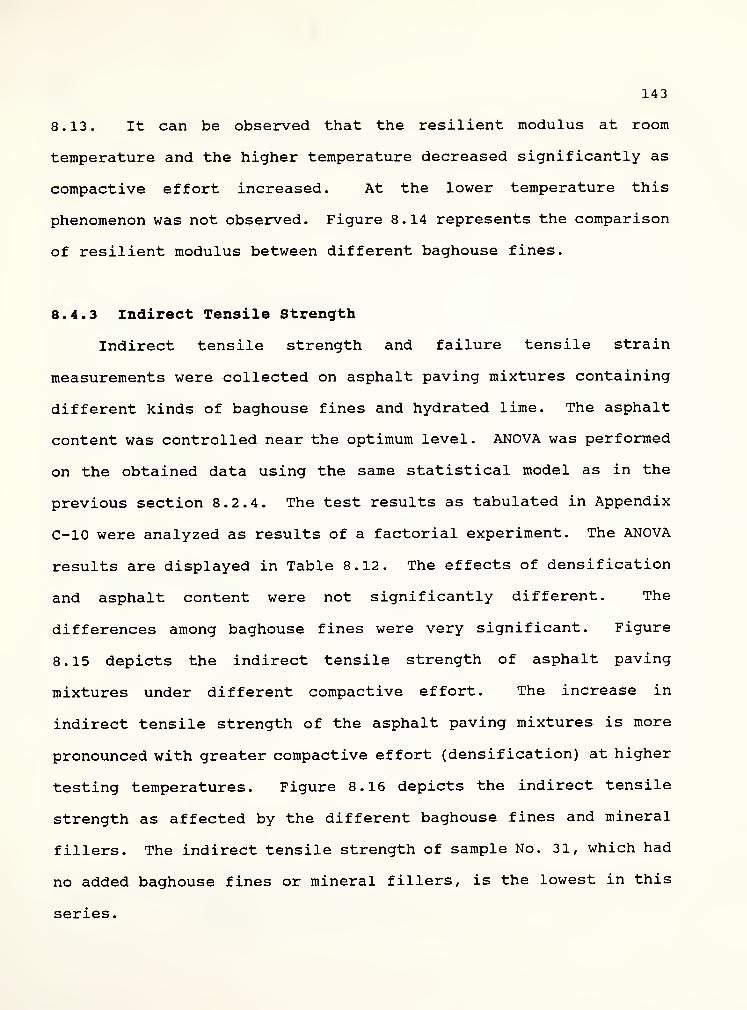
143
8.13. It can be observed that the resilient modulus at room
temperature and the higher temperature decreased significantly as
compactive effort increased. At the lower temperature this
phenomenon was not observed. Figure 8.14 represents the comparison
of resilient modulus between different baghouse fines.
8.4.3 Indirect Tensile Strength
Indirect tensile strength and failure tensile strain
measurements were collected on asphalt paving mixtures containing
different kinds of baghouse fines and hydrated lime. The asphalt
content was controlled near the optimum level. ANOVA was performed
on the obtained data using the same statistical model as in the
previous section 8.2.4. The test results as tabulated in Appendix
C-10 were analyzed as results of a factorial experiment. The ANOVA
results are displayed in Table 8.12. The effects of densification
and asphalt content were not significantly different. The
differences among baghouse fines were very significant. Figure
8.15 depicts the indirect tensile strength of asphalt paving
mixtures under different compactive effort. The increase in
indirect tensile strength of the asphalt paving mixtures is more
pronounced with greater compactive effort (densification) at higher
testing temperatures. Figure 8.16 depicts the indirect tensile
strength as affected by the different baghouse fines and mineral
fillers. The indirect tensile strength of sample No. 31, which had
no added baghouse fines or mineral fillers, is the lowest in this
series.
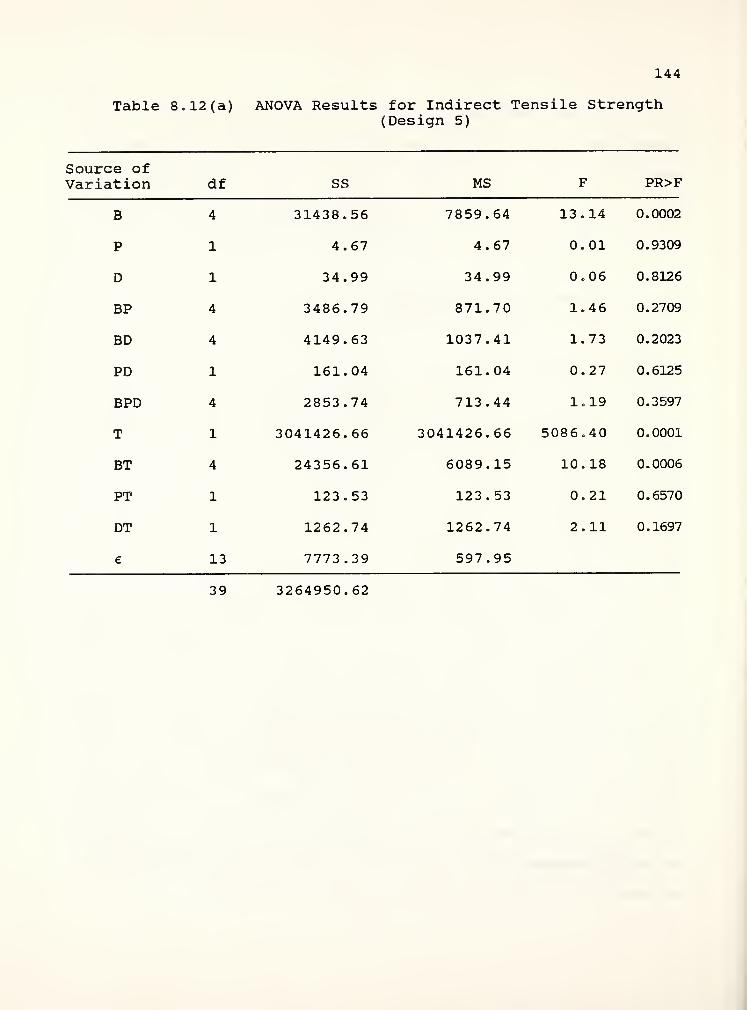
144
Table 8.12(a) ANOVA Results for Indirect Tensile Strength(Design 5)
Source ofVariation df SS MS F PR>F
B 4 31438.56 7859.64 13.14 0.0002
P 1 4.67 4.67 0.01 0.9309
D 1 34.99 34.99 0.06 0.8126
BP 4 3486.79 871.70 1.46 0.2709
BD 4 4149.63 1037.41 1.73 0.2023
PD 1 161.04 161.04 0.27 0.6125
BPD 4 2853.74 713.44 1.19 0.3597
T 1 3041426.66 3041426.66 5086.40 0.0001
BT 4 24356.61 6089.15 10.18 0.0006
PT 1 123.53 123.53 0.21 0.6570
DT 1 1262.74 1262.74 2.11 0.1697
e 13 7773.39 597.95
39 3264950.62
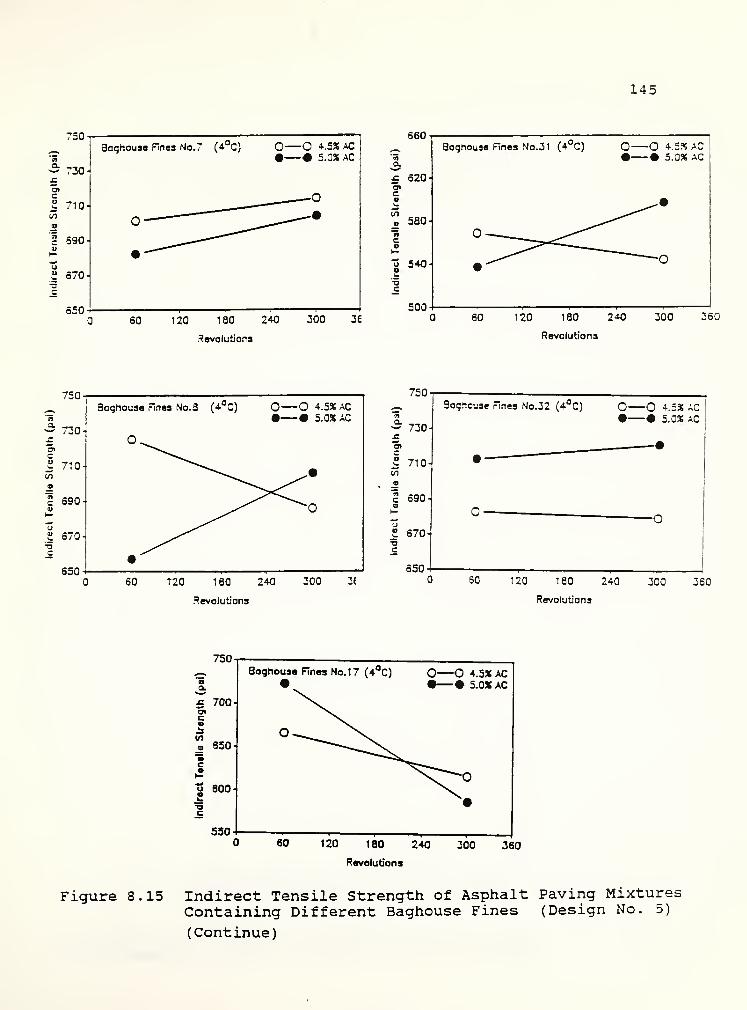
145
750
* 730-
4)
7101/1
»
c 690u
uula 670T3C
Baghouse Fines No.7 (4°C)
550 4
O O 4.5XAC• • 5.0% AC
60 120 ISO 240 300 36
devolutions
560
« 620
580-
o 540-
c
500
Baghouse Fines No. 31 (4 C) O O +.5S AC• • 5.0% AC
60 120 130 240 300 360
Revolutions
a. .,.
750
30
a*c
710
590
2 570--3
e
650
Baghouse Fines No.3 (4 C)
O.
O O 4.5XAC• • 5.0XAC
60 T20 180 240 300 3(
.Revolutions
750
* 730 -\
J 710i/i
1 690
Baghouse Fines No.32 (4°C) O O *=% AC
670
650
—
o
60 120 130 240
Revolutions
300 360
750
£ 700-o»
850-
o 800 ^S-oc
550
Baghouse Fines No. 17 (4°C) O O 4.5X AC• • 5.0X AC
60 120 180 240 300 360
Revolutions
Figure 8.15 Indirect Tensile Strength of Asphalt Paving MixturesContaining Different Baghouse Fines (Design No. 5)
(Continue)

146
ISO
a.
£ 130o>cV
! no
o 90-
e
-0
Boghouse Fines No.7 (40°C) O 4.5XAC• • 5.0X AC
——-~~*°
o—• ^_ •
•— '"""
150
60 120 ISO 240 300 360
Revolutions
130
co
110
90
70
Boghouse Fines No.31 (40°C) O O 4.5XAC• • 5.0* AC
^^m-^^Z-—* '
Q"^"
60 120 180 240
Revolutions
300 360
150
a
£ 130HOlcaLi
„ 110
"neb>—
u 90-
Boghouse Fines No.8 (40°C) O—O 4.5X AC• • 5.0X AC
60 120 ISO 240
Revolutions
I
300 360
150
£ 130ene
110-
o 90v
Boghouse Fines No.32 (40°C)
70-1
O—O 4.5XAC• • 5.0* AC
50 120 130 240 300 360
Revolutions
150
60 120 180 240 300 360
Revolutions
Figure 8.15 Indirect Tensile Strength of Asphalt Paving MixturesContaining Different Baghouse Fines (Design No. 5)

147
300
750
700
S50
S00
550-1
500
C2 50Rev, 4.5XACi SORev, 5.0XACE3 300Rev, 4.5XAC7771 300Rev, 5.0XAC
(4°C)
17
Sample Number
32 31
150
a^ 1303»cUu
i/i
9 110
90-
70
oORev, A.iaSAC
50Rev, 5.0XACG2 300Rev. 4.5SAC
ZZ2. 300Rev. 5.0XAC
(403C)
I
3 17 32
Sample Number
Figure 8.16 Indirect Tensile Strength of Asphalt Paving MixturesContaining Different Types of Baghouse Fines(Design No. 5)

148
8.4.4 Summary of Results
1. The kind of baghouse fines and asphalt cement content
affected the gyratory stability index and unit weight of
asphalt paving mixtures. In addition, densification was
significant on the unit weight of asphalt paving mixture.
2. The resilient modulus of asphalt paving mixtures
decreased significantly as compactive effort increased at
room temperature and at the higher testing temperature.
3. The indirect tensile strength of asphalt paving mixtures
increased significantly as compactive effort increased at
the higher testing temperature.

149
CHAPTER 9
COMPARISON OF ASPHALT PAVING MIXTURESWITH BAGHOUSE FINES AND MINERAL FILLERS
9 . 1 Introduction
The particle size distribution, particle shape, surface area,
surface texture, and minerological composition of baghouse fines
and mineral fillers all affect the properties of asphalt paving
mixtures. It is important to know the source of baghouse fines and
the characteristics of commercial mineral fillers being used, and
to compare their properties to those used for mixture design. The
objectives of this substudy on the evaluation of selected mineral
fillers and baghouse fines for use in the asphalt plant are
summarized as follows:
1. The gyratory testing machine will be used to evaluate the
stability and compactibility of asphalt paving mixtures
containing baghouse fines and mineral fillers collected by the
INDOT personnel.
2. Indirect tensile and resilient modulus tests will be performed
to determine the potentially beneficial effects of baghouse
fines and mineral fillers.
3. The influence of gradation of baghouse fines with a constant
mineralogical character upon the physical properties of
asphalt paving mixtures will be evaluated.
4. Statistical analysis will be conducted to test the
significance and to find the relationship among test
parameters
.

150
This chapter presents the results of Design 6 and 7, which
dealt with the behavior of asphalt paving mixtures with the
addition of baghouse fines or mineral fillers. In Design No. 6,
four mineral fillers (namely, hydrated lime, silica filler, fly
ash, and silica fume) , one baghouse fines, and one zero fines were
used as the additives to the asphalt paving mixtures. In Design 7,
two mineral fillers, two baghouse fines having a coarse and fine
gradation and one zero fines were used as the additives to the
asphalt paving mixtures.
The general laboratory test procedures that were followed had
been previous presented in Chapter 4
.
9.2. Results of Experimental Design No. 6
9.2.1 Gyratory Parameters
ANOVAs were performed on the obtained data (Appendix D-l)
using the following model:
Yijk = H + B±+ Pj * BP
ti* e
xijk 9.1
This is a completely randomized factorial design. The terms
in the model are as defined in Chapter 7, Section 7.2. The ANOVA
results are presented in Table 9.1.
Figure 9.1 depicts the gyratory indices of Design No. 6. It
can be noted that all the gyratory indices were significant to the
change of baghouse fines and mineral fillers content. The fillers
and fines content increased from 3% to 6%. The gyratory indices
increased in different amounts depending on the types of fines and

151
Table 9 . 1 ANOVA Results for Gyratory Parameters(Design No. 6)
Source ofVariation GEPI
ResponseGSII
of VariablGSI2
eGCI rd
B S. S. S. S. S.
P S. S. S. S. S.
P+B N.S. S. S. S. S.
S. = significant at a = 0.05, N.S. = not significant at a = 0.05
S.* = significant at a = 0.10
Table 9.2 ANOVA Results for Resilient Modulus(Design No. 6)
Source of df SS MS F PR>FVariation (10 10
) (10 10)
B 4 106.63 26.66 4.58 0.0087
P 1 6.13 6.13 1.05 0.3174
BP 4 14.34 3.59 0.62 0.6565
S(BP) 20 116.49 5.83
T 2 1640.74 820.37 3288.37 0.0001
BT 8 8.62 1.08 4.32 0.0008
PT 2 2.07 1.04 4.15 0.0230
BPT 8 12.11 1.51 6.07 0.0001
S(BP)T 40 9.98 0.250
89 1697.87

152
1.600
1.2003 6
Finos or Fillar Cement (X)
1.150
0.9503 5
Fines or Filler Content {%)
1.400
1.300- *
—
2? 1.200-
1.100-
1.000-
0.9003 6
Fines or Filler Content (X)
0.990
3 6
Fines or Filler Content (X)
2.500
u 2.500
3
2.400
2.3003 6
Fines or Filler Content (X)
Figure 9.1 Gyratory Parameters of Asphalt Paving MixturesContaining Mineral Fillers (Design No. 6)

153
fillers, except for the gyratory compactibility indices (GCI) when
silica fume was used.
9.2.2 Resilient Modulus (Design No. 6)
The resilient modulus of asphalt paving mixtures in Design No.
6 are presented in Figure 9 . 2 and Appendix D-2 . ANOVAs were
performed on the resilient modulus data using the following
mathematical model:
y±m = V+Pt+Bj+PBij+SlPB) Mt+lw+Tj+PTu+PTx+PBTm+SiPB) W)kl^ijkl
9.2
The model is similar to the general model described in the
previous Chapter 7, Section 7.4.2. The results of ANOVA are
presented in Table 9.2.
The ANOVA results and Figure 9.2 indicate that the effects of
fines or fillers content (P) were not significant, but the effects
of different kinds of fines or filler were significant. The
resilient modulus of asphalt paving mixtures with the addition of
silica fume seem higher than other fines or fillers when tested at
temperatures above room temperature. The effects of fines or
fillers content on resilient modulus were distinct between silica
fume and other fines or fillers. When silica fume was used as the
additive, the resilient modulus of asphalt paving mixtures
generally increased as the fillers content increased. This was due
to the stiffening of the asphalt paving mixtures caused by the
addition of the silica fume.

154
a.
O
_3
•oo2
3 S
Fines or Filler Content (%)
a.
a
a2
3 S
Fines or Filler Content (X)
ama
_23
O3
Fines or Filler Content (%)
8.,3 10
I 105
10"
—
o
U•—
•
Si
A A FAA A SFa—
a
No20BH3X
3•ao3
10 15 20 25 30
Temperature ( C)
45 10 15 20 25 30
Temperature (°C)
35 40
Figure 9.2 Resilient Modulus of Asphalt Paving Mixtures ContainingMineral Fillers (Design No. 6)
45

155
9.2.3 Indirect Tensile Strength
The indirect tensile strengths and failure tensile strain
measured at different temperatures were analyzed with the aid of
ANOVA statistical method using the following model:
Yijkl = ^ + Pi +B^Tk+PBij+PTik+BTjk+PBTijk+eiJk 9.3
This is a completely randomized design. The ANOVA results and test
data are presented in Table 9.3 and Appendix D.3. The influence of
fines and fillers on the indirect tensile strength of asphalt
paving mixtures was similar to the resilient modulus that was
reported in Section 9.2.2. The indirect tensile strength increased
as filler content increased at higher temperature. The indirect
tensile strengths decreased as the filler content increased at
lower temperatures.
9.3 Effect of Baghouse Fines or Mineral Fillers Gradation on
Asphalt Paving Mixtures
The effects of fines or fillers gradation, kinds of fines or
fillers, and content of fines or fillers on the behavior of asphalt
paving mixtures were evaluated. Two fines or fillers gradations
(coarse and fine) were used in the study.
9.3.1 Gyratory Parameters
The main factors (gradation, fillers or fines content, and
types of fillers or fines) significantly affected the gyratory
elasto-plastic index, gyratory stability index and unit weights of

156
Table 9.3 ANOVA Results for Indirect Tensile Strength(Design No. 6) (continuous)
Source ofVariation
df SS(10 10
)
MS(10 10
)
PR>F
B
P
BP
T
BT
PT
e
4
1
4
1
4
1
4
3884.89
6.05
5947.92
971.22 0.42
6.05 0.00
1486.98 0.64
1612211.33 1612211.33 697.09
9553.49 2388.37 1.03
361.25 361.25 0.16
9251.12 2312.78
0.7893
0.9617
0.6604
0.0001
0.4879
0.7129
19 1641216.05
Table 9.3 ANOVA Results for Failure Tensile Strain(Design No. 6)
Source ofVariation
df SS MS PR>F
B
P
BP
T
BT
PT
e
4 1.600 0.400 1.05 0.4827
1 0.242 0.242 0.63 0.4701
4 0.868 0.167 0.57 0.7014
1 1.250 1.250 3.27 0.1447
4 0.700 0.175 0.46 0.7659
1 0.032 0.032 0.08 0.7866
4 1.528 0.382
19 6.220

157
01cau—
acu
u
oc
730
saa-
530-
5S0-
5303 5
Baghouse Fines Content {%)
O 140-01
Q.
o»c01
in
ac
o
oc
no
Figure 9.3
3 6
Baghouse Fines Content (35)
Indirect Tensile Strength of Asphalt Paving MixturesContaining Mineral Fillers (Design No. 6)
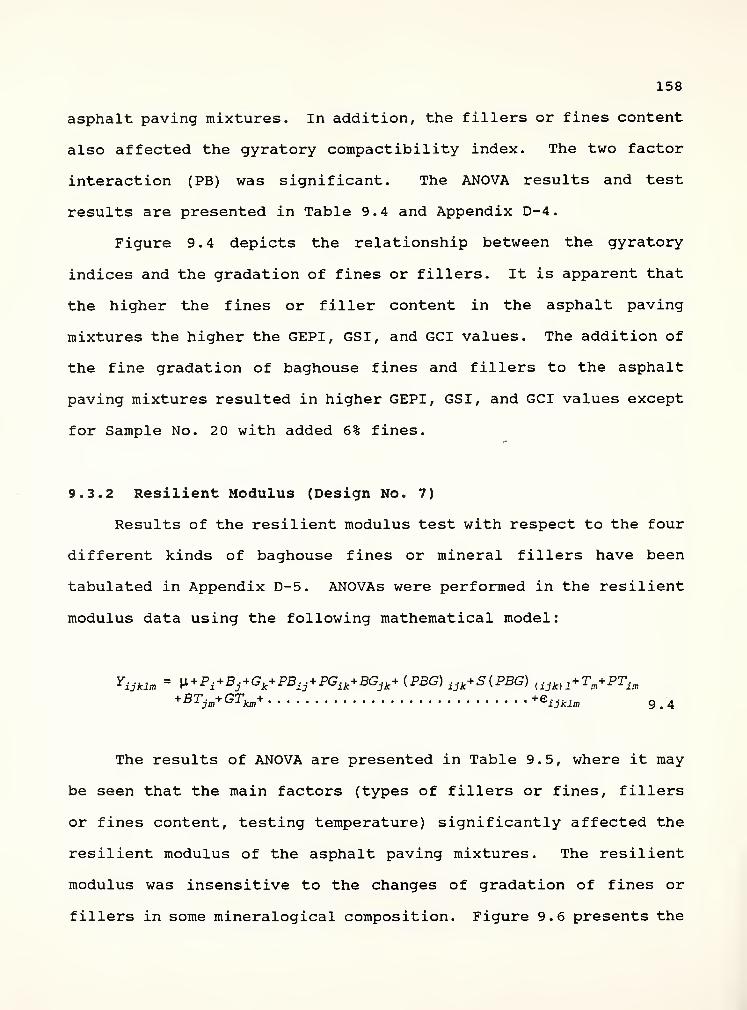
158
asphalt paving mixtures. In addition, the fillers or fines content
also affected the gyratory compactibility index. The two factor
interaction (PB) was significant. The ANOVA results and test
results are presented in Table 9.4 and Appendix D-4.
Figure 9 . 4 depicts the relationship between the gyratory
indices and the gradation of fines or fillers. It is apparent that
the higher the fines or filler content in the asphalt paving
mixtures the higher the GEPI, GSI, and GCI values. The addition of
the fine gradation of baghouse fines and fillers to the asphalt
paving mixtures resulted in higher GEPI, GSI, and GCI values except
for Sample No. 2 with added 6% fines.
9.3.2 Resilient Modulus (Design No. 7)
Results of the resilient modulus test with respect to the four
different kinds of baghouse fines or mineral fillers have been
tabulated in Appendix D-5. ANOVAs were performed in the resilient
modulus data using the following mathematical model:
Yijki* =V. +Pi+Bj
+Gk+PBi]+PGik+BGjk+{PBG) ijk+S(PBG) {ljk)1+Ta+PT±im+BTjm+GTkm+ +*uum 9 . 4
The results of ANOVA are presented in Table 9.5, where it may
be seen that the main factors (types of fillers or fines, fillers
or fines content, testing temperature) significantly affected the
resilient modulus of the asphalt paving mixtures. The resilient
modulus was insensitive to the changes of gradation of fines or
fillers in some mineralogical composition. Figure 9.6 presents the
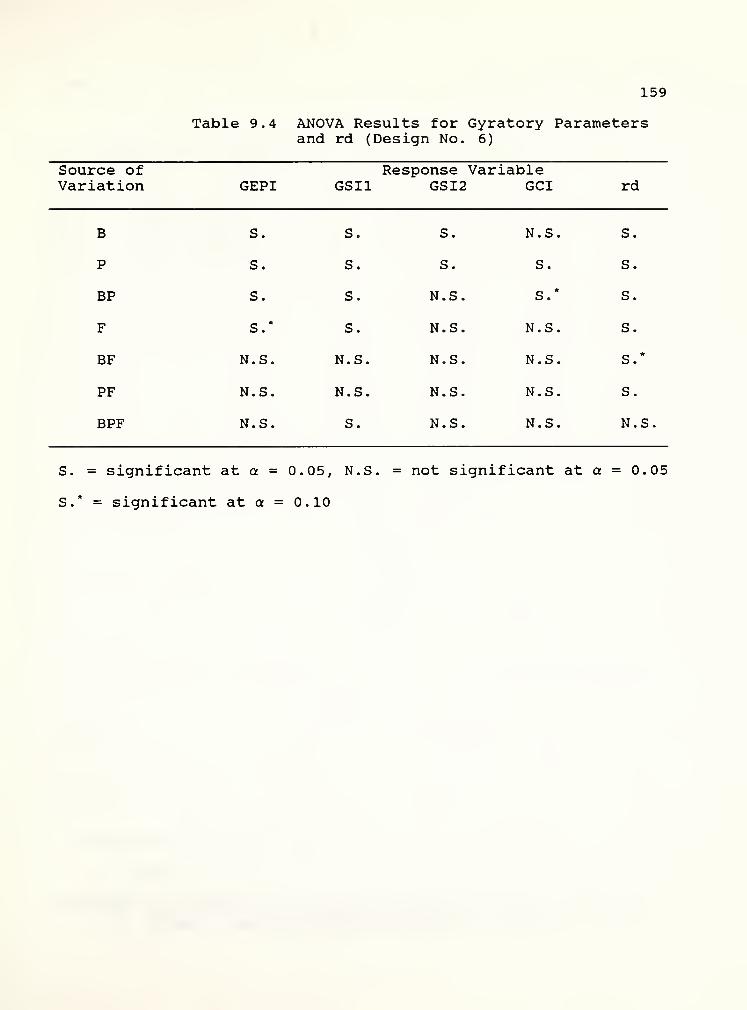
159
Table 9 . 4 ANOVA Results for Gyratory Parametersand rd (Design No. 6)
Source of Response VariableVariation GEPI GSI1 GSI2 GCI rd
B S. S. S. N.S. S.
P S. S. S. S. S.
BP S. S. N.S. S.* S.
F S.* S. N.S. N.S. S.
BF N.S. N.S. N.S. N.S. S.*
PF N.S. N.S. N.S. N.S. S.
BPF N.S. S. N.S. N.S. N.S.
S. = significant at a = 0.05, N.S. = not significant at a = 0.05
S.* = significant at a = 0.10

160
control 32
Fine
33 20
or Filler Number
1.5
§»+
Ei
aIn_o
a
oa
1.2-
1.0
3H 5X a cS3 P.
control 32 33 20
Fines or Filler Number
1.500
e
"S 1.500aQ.
I
a
o
O
1.4001
1.300
1.500-
i
3H No.20
oc
n 1.500-az
I
a
t 1.+O0co
*• 5% 3H
-O 3X 3H
1.300-
GradationGradation
1.S00-
-3
C
"s 1.500
x
3
2-
2"3w
u
1.400
1.300
3H No.321.500
.« 6X 3H
.0 3X 3H
c
n 1.500-
i
o
° 1.400-Co"3
a
1.300
BH No.33
5% BH
O 2% BH
Gradation Gradation
Figure 9.4 Gyratory Indices of Asphalt Paving Mixtures ContainingMineral Fillers or Baghouse Fines (Design No. 7)
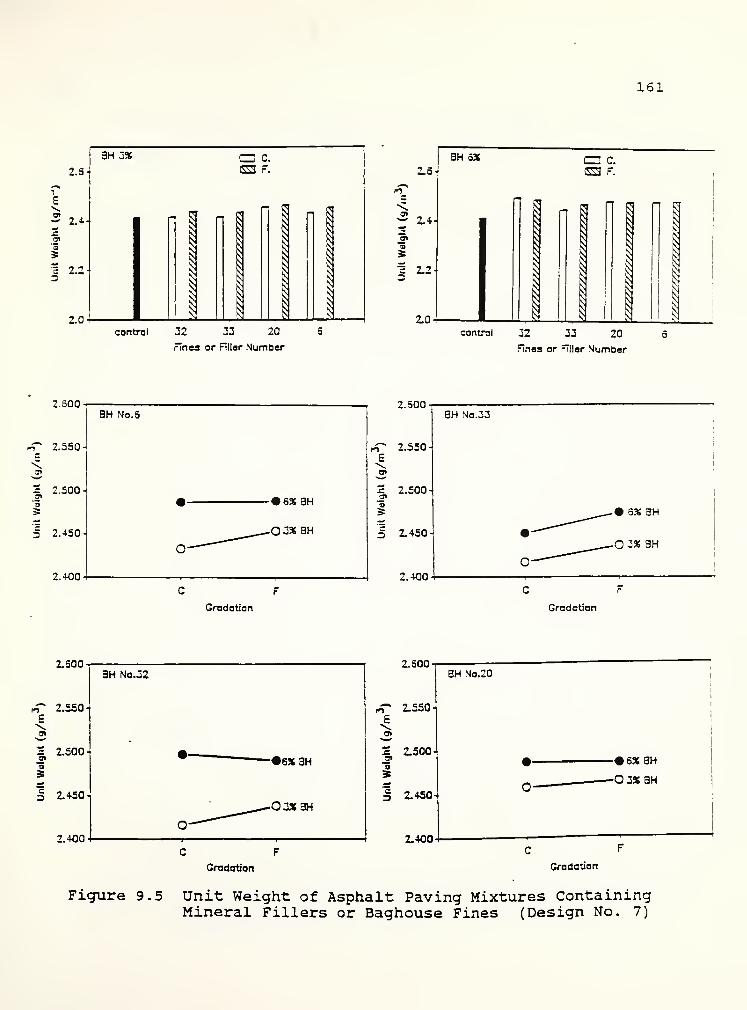
161
control 32 33 20
Fines or Filler Number
control 22 33 20
Fines or Filler Number
BH No.6
ST 2.550-
2 2.500-
o3
5 2.450-
o'
_Q 2% BH
2.400-
C F
Gradation
2.S00
ST 2.550E
S 2.500-2"
3
3 Z450
2.400
BH No.33
C F
Gradation
2.S00
n" 2.550
2 2.500Ok
a3
1 2.450
2.400
3H No.32
-•6X 3H
-03XBH
C F
Gradation
2.500BH No.20
kT 2.5501E
O3c3
2.500
2.450
2.400
•-
o-
I6XBH
-O 2% an
c F
Gradation
Figure 9.5 Unit Weight of Asphalt Paving Mixtures ContainingMineral Fillers or Baghouse Fines (Design No. 7)

162
Table 9.5 ANOVA Results for Resilient Modulus(Design No. 7)
Source of df SS MS ~F PR>FVariation (10 10
) (1010
)
B 3 68.14 22.71 9.96 0.0006
P 1 24.15 24.15 10.59 0.0050
F 1 1.24 1.24 0.55 0.4704
BP 3 19.03 6.34 2.78 0.0747
BF 3 23.08 7.69 3.37 0.0446
PF 1 3.25 3.25 1.42 0.2502
BPF 3 4.42 1.47 0.65 0.5964
S(BPF) 16 36.49 2.28
T 2 24721.40 1236.07 8348.67 0.0001
BT 6 70.54 1.18 7.94 0.0001
PT 2 11.09 5.55 3.75 0.0345
FT 2 10.30 5.15 3.48 0.0429
BPT 6 9.16 1.53 1.03 0.4234
BFT 6 27.98 4.66 3.15 0.6153
PFT 2 1.78 0.89 0.60 0.3551
BPFT 6 7.74 1.29 0.87 0.5267
S(BPF)T 32 47.38 1.48
G 18 99.14 5.50
113 25186.32

163
« 13a
ina
3
a2
control
o 12-
a.ina
_33ao2
32
Fine
33 20
or Filler Number
control 32 33 20
Fines ar Filler NumOer
14
a.>na
-3
32
10^\
o o No32• • No33A a No20A a No S
Coarse (23°C)
^.^
A
ai-
a
33"3
a2
Mi
14
10-
3X 6X
Fines or Filler Content (55)
o o No32• • No33a a Na2Qa a No o
Coarsa (-LQ Z)
3% 6%
Fines or Filler Content (35)
a.na
_o
3-3o2
-O No32• • No33* a No20* » No S
Fine (23°C)
to-
sat exFines or Filler Content (X)
3X SX
Fines or Filler Content (%)
Figure 9.6 Resilient Modulus of Asphalt Paving Mixtures ContainingMineral Fillers or Baghouse Fines (Design No. 7)
(Continue)

164
JO
25a.
oC- 20n33 15
2c 10.2
ai
« 5
8H 3X (40°C) en c.
ES3 F.
control 32 33 20
Fines or Filler Numbercontrol 32 33 20
Fines or Filler Number
13-
aina
2
12-
1 1
= 10-7i
2
3H 3% (23°C) o o No32• • No33a a No20a a No 5 a.
ina
23T3O2
11
10
9J
3 3-
3H oX (23" o-—
o
Mo32•—
•
Nojja—
a
No20A—
A
">io 3
Gradation
22
a.
o
12
9H 3X (40UC)
20-
18-
16-
14-
o No32• • No33a—-a No20A A No 6
14
"Z 12
3-oo2
10
BH 6* (40JC)
i a-
O O NOJ^• • \o33a a No20a a No 5
Gradation Graaation
Figure 9.6 Resilient Modulus of Asphalt Paving Mixtures ContainingMineral Fillers or Baghouse Fines (Design No. 7)

165
resilient modulus as related to gradation of fines or fillers and
fines or fillers content for different types of fines or fillers.
It is apparent that higher fines or fillers contents in the
mixtures result in lower resilient modulus values. The hydrated
lime resulted in higher resilient modulus than any of the other
fines or fillers at low filler content. The No. 20 samples
resulted in lower resilient modulus values than any other fines or
fillers at the higher fines content.
9.3.3 Indirect Tensile Strength
Results of the indirect tensile test with respect to the four
different kinds of baghouse fines or mineral fillers have been
tabulated in Appendix D-6. ANOVAs were performed on the indirect
tensile strengths and failure tensile strain using the same model
as in Section 9.2.3. The ANOVA results are presented in Table 9.6.
Indirect tensile strength were significantly affected by all of the
main factors together with some of the two-factor interactions.
The temperature showed the most significant effect on the indirect
tensile strength as compared to fines or fillers content and types
of fines or fillers.
Figure 9.7 presents the indirect tensile strength as related
to gradation of fines or fillers and fines or fillers content. It
is apparent that for specimens tested at lower temperature, the
finer filler or fines in the asphalt paving mixture will result in
higher indirect tensile strengths. Besides, the higher fines or
fillers contents in the asphalt paving mixtures will result in
166
Table 9.6 ANOVA for Indirect Tensile Strength(Design No. 7)
Source of df SS MS F PR>FVariation
B 3 1494.17 498.06 7.88 0.0022
P 1 0.11 0.11 0.9669
F 1 3602.63 3602.63 56.97 0.0001
T 2 2786945.44 1393472.72 22035.31 0.0001
BP 3 4194.62 1398.21 22.11 0.0001
BF 3 557.36 185.79 2.94 0.0673
BT 6 4661.62 776.94 12.29 0.0001
PF 1 155.97 155.97 2.47 0.1372
PT 1 5943.91 5943.91 93.99 0.0001
FT 2 4700.68 2350.34 37.17 0.0001
e 15 948.57 63.24
37 2813205.09

167
lOOOiC2 +°C C. S3 40°C. C.i +°C. .-. ZZ2 40°C. F.
3s aoo-JZ
o>c _ ^ m2 600-55
9
1
J
1
i 400-1
h—
O« 200- l \
a
0- m m ii ^ R0
32 23 20 5
Fines or Fillers Number
c
3H 535 (4°C) CZ J-^C. C. S3 4a°C, C.M 4°C. r. ZZ3 40'3 C. F.
aoo-
oOQ.n
P fl
(400-
1
1
1!
I
i j
200-
1
1
j
:
I
1
1
i
:
1i
II
1
1
ij
n- m m II
I
hei il M32 33 20 S
Fines or Filler Number
•50
-1
a 550
550eui 450to
3
*ai 350=u
250un
•3 150=
50
3H No.o
O4 C. 335 3H• •+°C. 635 3H
A40°C. 3X3HA-
a- CMC. SX3H I
750
550
550
450
350
250
150
50
3H No.20
O—C 4°C, 335 3H
°C. 5% ay-
A- • • A40°C, 335 3h
C^Q" 535
Gradation Graaation
750
650
550
450
350
250
150
50
No.32 (lime) _______-•
•—"~ —
-
•
O 04°C.BH3*• •4 C.3H 635
A • • A 40°C.aH 3X• • D 40°c.aH sas
1000
- aoo+
: 600--i
a
I 400--
200 -•
3H No.33
Q.
O O4 C.•—•4a5,A-
D
33S 3H•4U5. SX3H
A40°C. 3% SHa40°C, 535 3H
Figure 9.7
Gradation Gradation
Indirect Tensile Strength of Asphalt Paving MixturesContaining Mineral Fillers or Baghouse Fines(Design No. 7)

168
higher indirect tensile strengths at lower testing temperatures.
However, the phenomenon was opposite at the higher testing
temperature; the higher fines or fillers contents caused lower
indirect tensile strengths.
9.4 Summary of Results
The analysis and evaluation of the test data in this chapter
revealed a number of significant results that pertain to the effect
of baghouse fines and mineral fillers with different gradations on
the asphalt paving mixtures:
1. The types of baghouse fines or mineral fillers and percent of
baghouse fines or mineral fillers significantly affected all
the gyratory parameters of asphalt paving mixtures. The
percent increases of the gyratory indices varied depending on
the types of fines and fillers, with exception of the gyratory
compactibility indices of silica fume.
2. The effect of the two and three factor interactions with
temperature on the resilient modulus significantly affected
the resilient modulus of asphalt paving mixtures.
3. The indirect tensile strengths and resilient modulus values of
the asphalt paving mixtures were influenced in similar manner
by the baghouse fines and mineral fillers variables that were
incorporated in this substudy.
4. Gradation and percent of baghouse fines and mineral fillers
significantly affected the unit weight of the asphalt paving
mixtures. The higher amount or the finer gradation of

169
baghouse fines and mineral fillers resulted in higher unit
weights of mixtures.
The resilient modulus was insensitive to the gradation of
baghouse fines or mineral fillers, but the indirect tensile
strengths increased significantly with finer baghouse fines or
mineral fillers.

170
CHAPTER 10
CONCLUSIONS AND RECOMMENDATIONS
10.1 Conclusions
An extensive laboratory study of the asphalt paving mixtures
containing baghouse fines has been conducted through seven sets of
experimental designs. Fifteen different baghouse fines have been
used to produce asphalt mastics. In addition, eight different
baghouse fines also have been used as fillers to compare their
effects on the mechanical properties of asphalt paving mixtures.
It should be noted to indicate that the results obtained herein may
be limited to the baghouse fines used and the test conditions
applied. Major conclusion from this laboratory study are
summarized as follows:
1. The viscosity ratio and softening point may be used to
describe the effect of percent bulk volume of baghouse fines
on rheological properties of asphalt mastics. The viscosity
and softening point increase rapidly when the bulk volume of
baghouse fines is between 60 to 80%.
2. Parameters developed from simple dry compaction method to get
the void content in baghouse fines, such as B/A, and VfB%
appear to be useful for correlation with consistency tests
such as penetration, viscosity, ductility, and softening point
to indicate the stiffening effects of baghouse fines in
asphalt mastics.
3. The gyratory stability index (GSI) and gyratory elasto-plastic
171
index (GEPI) can be used to determine the effect of baghouse
fines on asphalt paving mixtures during the specimen
fabrication.
4. The gyratory stability index is very sensitive to baghouse
fines content and asphalt cement content. The role of
baghouse fines as extenders in asphalt paving mixtures can be
demonstrated by the gyratory testing machine.
5. The resilient modulus, indirect tensile strength, and Hveem
stability are decreased significantly with higher baghouse
fines content. The decrease in resilient modulus with the
baghouse fines is caused by the extender action of asphalt
cement and baghouse fines interaction.
6. Artificial aging processes to simulate the asphalt plant
hardening and in service aging caused an increase in resilient
modulus and the indirect tensile strength as well as a
reduction in the failure tensile strain values for asphalt
paving mixtures. Asphalt paving mixtures containing lower
asphalt cement content (high baghouse fines/asphalt cement
ratios) tend to age more rapidly than high asphalt cement
content (low baghouse fines/asphalt cement ratio)
.
7. Resilient modulus and indirect tensile strength test
parameters were more sensitive to age conditions of asphalt
paving mixtures than the Hveem stability test. Those test
methods would seem to have some potential for the study of the
aging behavior of asphalt paving mixtures.
8. When baghouse fines were added to the asphalt paving mixtures,

172
the effect of water sensitivity decreased with increasing
amount of asphalt cement content or with decreasing amount of
baghouse fines/asphalt cement content ratio.
9. Densification generally produces higher indirect tensile
strengths for the same asphalt cement content, but it also
produces lower resilient modulus values of asphalt paving
mixtures. The results from the gyratory densification study
may be used to predict field rutting and deformation that
occur under traffic.
10. The types of baghouse fines or mineral fillers and amount of
baghouse fines or mineral fillers content significantly
affected all the gyratory parameters of asphalt paving
mixtures. The gyratory indices increased in different amount
depending on the types of fines and fillers. The exception
was the gyratory compactibility index of silica fume.
11. The resilient modulus value was insensitive to the gradation
of baghouse fines or mineral fillers, but the indirect tensile
strength increased significantly with finer fines or fillers.
12. The stiffness of asphalt paving mixtures with baghouse fines
is sensitive to the grade of asphalt cement, but it is
insensitive to the grade of asphalt cement when the asphalt
paving mixtures did not include baghouse fines.
10.2 Recommendations
1. The use of HP-GPC analysis for the determination of the
amount and the appropriate type of the asphalt mastics

173
containing baghouse fines should be developed. Studies
should be conducted to determine a possible relationship
between HP-GPC data and the rheological properties of
asphalt mastics.
2. Fatigue properties of asphalt paving mixtures containing
different kinds and amounts of baghouse fines which also
govern the performance of asphalt pavement should be
studied. The relationship between the fatigue properties
of the asphalt paving mixtures and the parameters such as
the kinds and amounts of baghouse fines, should be
established.
3. Different compactive methods have been used by different
researchers and engineers to characterize the asphalt
paving mixtures. A study should be conducted to relate
these different variables to one another using
statistical models and an appropriate viscoelastic model
for the asphalt paving mixtures.
4. Mechanistic models of structural design are available
that can be used to calculate stresses, strains and
deflections within the pavement structure. There are
other models that can be used to predict fatigue
cracking, rutting, or serviceability with traffic and
environmental condition.
5. The effect of different grades of asphalt cement on
asphalt paving mixtures with baghouse fines should be
established.

174
REFERENCES
1. Anderson, D. A. and Tarris, J. P., "Adding Dust CollectorFines to Asphalt Paving Mixtures", National CooperativeHighway Research Program Report 252, Transportation ResearchBoard, Washington, D.C., 1982, 90 pp.
2. NAPA, "The Fundamentals of the Operation and Maintenance ofthe Exhaust Gas System in Hot Mix Asphalt Facility",Information Series 52, Second Edition, National AsphaltPavement Association, 1987.
3. Schenk, W. , "The Impact of Baghouses on Paving Industry",Proceedings, Canadian Technical Asphalt Association, Vol. 17,
1972, pp. 103-108.
4. American Society for Testing and Materials, "StandardSpecification for Mineral Filler for Bituminous PavingMixtures", ASTM D242-86, Philadelphia, PA, 1988.
5. Scrimsher, T. , "Baghouse Dust and its Effect on AsphalticMixtures", Research Report CA-DOT-TL-3 140-1-76-50, CaliforniaDOT, 1976.
6. Erick, J. H. and Shook, J. F. , "The Effects of Baghouse Fineson Asphalt Mixtures", Proceedings of Canadian TechnicalAsphalt Association, Vol. 23, 1978, pp. 78-125.
7. Ward, R. G. and McDougal, J. M. , "Bituminous Concrete PlantDust Collection System — Effects of Using Recovered Dust in
Paving Mix", Research Report FHWA/WV-79—003, West Virginia,Department of Highways, 1979.
8. Dukatz, E. L. and Anderson, D. A., "The Effect of VariousFillers on the Mechanical Behavior of Asphalt Concrete",Proceedings of the Association of Asphalt PavingTechnologists, Vol. 49, 1980, pp. 530-549.
9. Gietz, R. H., "Mineral Fines Effect on Asphalt Viscosity",Report 164, Washington State DOT, 1980.
10. Kandhal, P. S., "Evaluation of Baghouse Fines in BituminousPaving Mixtures", Proceedings of Association of Asphalt PavingTechnologists, Vol. 50, 1981, pp. 150-210.
11. Maupin, G. W. , "Effect of Baghouse Fines on Compaction of
Bituminous Concrete", Report VHTRC 81-R49, Virginia Highwayand Transportation Research Council, 1981.

175
12. Anderson, D. A. and Tarris, J. P., "Characterization andSpecification of Baghouse Fines", Proceedings of theAssociation of Asphalt Paving Technologists, Vol. 52, 1983,pp. 88-120.
13. Rigden, D. J., "The Rheology of Non-Agueous Suspensions",Technical Paper 28, Hammondsworth , Road Research Laboratory,1954.
14. Anderson, D. A. and Tarris, J. P., "Effect of Baghouse Fineson Mixture Design Properties", Quality Improvement Program102, National Asphalt Pavement Association, 1982, 24 pp.
15. Anderson, D. A., Tarris, J. P. and Brock, J. D. , "Dust CollectFine and Their Influence on Mixture Design", Proceedings ofthe Association of Asphalt Paving Technologists, Vol. 51,1982, pp. 363-397.
16. Anani, B. A. and Al-Abdul-Wahhab, H. "Effects of BaghouseFines and Mineral Fillers on Properties of Asphalt Mixes",Record 843, Transportation Research Board, Washington, D.C.,1982, pp. 57-64.
17. Eriech, A. J., "A Study of Factors which Influence Type IVSand Mix Performance", Heritage Research Group, Indianapolis,1985, pp. 1-38.
18. Anderson, D. A., "Guidelines for Use of Dust in Hot-MixAsphalt Concrete Mixtures", Proceedings of the Association ofAsphalt Paving Technologists, Vol. 56, 1987, pp. 492-516.
19. Anderson, D. A., "Guidelines on the Use of Baghouse Fines",National Asphalt Pavement Association, Information Series 101,1987, pp. 1-37.
20. Anderson, D. A. and Steven M. Chrismer, "Evaluation Test forCharacterizing the Stiffening Potential of Baghouse Dust inAsphalt Mixes", Record 968, Transportation Research Board,Washington, D.C., 1984, pp. 31-37.
21. American Society for Testing and Materials, "StandardSpecification for Hot-Mixed, Hot-Laid Bituminous PavingMixtures", ASTM D3515-84, Philadelphia, PA, 1988.
22. The Asphalt Institute, "Mix-Design Methods for AsphaltConcrete and Other Hot-Mix Types", Asphalt Institute, MS-2,1988, 103 pp.
23. California Department of Transportation, "Testing Manual",Vol. Ill, Test Method No. CF 905B - Calculations Pertaining toGradings and Specific Gravity, 1971.

176
24. McRae, J. L. , "Gyratory Testing Machine Technical Manual",Engineering Developments Company, Inc., Vicksburg,Mississippi, 1965, Revised 1970.
25. The Asphalt Institute, "Basic Asphalt Emulsion Manual", MS-19,Second Edition, 1987, 248 pp.
26. American Society for Testing and Materials, "Standard TestMethod for Resistance to Plastic Flow of Bituminous MixturesUsing Marshall Apparatus", ASTM D1559-82, Philadelphia, PA,1988.
27. American Society for Testing and Materials, "Standard TestMethod for Indirect Tension Test for Resilient Modulus ofBituminous Mixtures", ASTM D4123-87, Philadelphia, PA, 1988.
28. American Society for Testing and Materials, "Standard Methodfor Preparation of Bituminous Mixture Test Specimens by Meansof California Kneading Compactor", ASTM D1561-812,Philadelphia, PA, 1988.
29. American Society for Testing and Materials, "Standard TestMethod for Effect of Moisture on Asphalt-Concrete PavingMixtures", ASTM D4867-88, Philadelphia, PA, 1988.
30. Retsina Company, "Instructions for the Mark VI ResilientModulus Non-Destructive Testing Device", 1986, 13 pp.
31. American Society for Testing and Materials", Proposed StandardTest Method for Unconfined Static Creep Test on Asphalt MixSpecimens", Draft, Philadelphia, PA, 1989.
32. Von Quintus, H. L. , et al . , "Interim AAMAS - ProceduralManual", Asphalt-Aggregate Mixture Analysis System: Phase II,Volume I, National Cooperative Highway Research Program,Transportation Research Board, 1989, 256 pp.
33. Burton, J. W. , et al . , "Developmental Work on a Test Procedureto Identify Water Susceptible Asphalt Mixtures", ResearchReport 287-1, Texas Transportation Institute, The Texas A&MUniversity, 1982, 45 pp.
34. Schmidt, R. J., "A Practical Method for Measuring theResilient Modulus of Asphalt-Treated Mixes", Highway ResearchRecord No. 404, Highway Research Board, 1972, pp. 22-32.
35. Mamlouk, M. S., "Characterization of Cold Mixed AsphaltEmulsion Treated Bases", FHWA/IN/JHRP 79-19, PurdueUniversity, 1979, 173 pp.
177
36. Findley, W. N. , Lai, J. S. and Onaran, K. , "Creep andRelaxation of Nonlinear Viscoelastic Materials", North-HollandPublishing Company, 1981.
37. Ferry, J. D. , "Viscoelastic Properties of Polymers", ThirdEdition, John Wiley & Sons, Inc., 1980.
38. Anderson, V. L. and McLean, R. A., "Design of Experiments: ARealistic Approach", Marcel Dekker, Inc., New York and Basel,1974, 418 pp.

178
APPENDICES
This copy of this report does not include the Appendices
listed in the Table of Contents. These are identified as:
Appendix A: Test Data of Design No. 1
Appendix B: Test Data of Design No. 2
Appendix C: Test Data of Design No. 3, No. 4, and No. 5
Appendix D: Test Data of Design No. 6 and No. 7
Appendix E: Test Data of Design No. 8 and No. 9
Appendix F: Test Data of Design No. 10
Appendix G: X-ray Diffraction of Baghouse Fines No. 1-No. 3
Appendix H: Summary of Foster Burr Q-Test Results
Appendix I: ANOVA Results of Design No. 10 and No. 11
A copy of all or any of the above Appendices may be obtained
from the cost of reproduction from:
Joint Highway Research ProjectCivil Engineering BuildingPurdue UniversityWest Lafayette, IN 47907


z
2
co
-
2
: