the effects of analogous food color on ...facstaff.elon.edu/lgarber/misc/garber-effects-of...the...
TRANSCRIPT
THE EFFECTS OF ANALOGOUS FOOD COLOR ON
PERCEIVED FLAVOR: A FACTORIAL INVESTIGATION
Lawrence L. Garber, Jr.ab
a Elon University
CB 2075
Elon, NC, 27244, USA a Institute for Management Technology
Raj Nagar, Hapur Road,
Ghaziabad, Uttar Pradesh 201001, India
+1 1 336 278 5931
Eva M. Hyatt c
c Appalachian State University
Marketing Department
Walker College of Business,
Boone, NC, 28608, USA
Lubna Nafees d
dInstitute for Management Technology
Raj Nagar, Hapur Road,
Ghaziabad, Uttar Pradesh 201001, India
b Corresponding Author (to be reached c/o Elon University)
THE EFFECTS OF ANALOGOUS FOOD COLOR ON
PERCEIVED FLAVOR: A FACTORIAL INVESTIGATION
ABSTRACT
We extend research testing the effects of food color on flavor perception to analogous color.
Analogous colors are those found next to each other on the color wheel. Most prior food color
research tests the relative effects of complementary colors, which are those found apart from
each other on the color wheel. We therefore test smaller, or finer, color differences, providing a
more conservative test relative to most prior results.
Subjects were assigned the task of tasting and evaluating a fruit flavored beverage. Actual fruit
flavor at two levels and beverage color at three levels were manipulated in a full factorial,
between subjects design. Thus, each subject tasted and evaluated a single color/flavor
combination.
Results show that the small differences in food color represented by analogous color are
sufficiently distinct and meaningful to consumers to significantly affect their ability to correctly
identify the flavor of color-associated foods, as well as to form distinct flavor profiles and
particular preferences; much as the grosser distinctions represented by complementary food color
have been shown to do previously. These findings extend the evidence in support of the
robustness and primacy of food color as a flavor signal in color-associated foods. As with
complementary color, analogous food color dominates other flavor information including taste,
though the strength of the effect is generally less pronounced. Strategic alternatives for the
effective deployment of analogous food color for promotional purposes are recommended.
Keywords: food color; analogous color; complementary color; flavor; taste test
1
1. INTRODUCTION
The primacy of food color in determining consumer response to flavor in color
associated foods has been repeatedly demonstrated in a number of empirical studies (e.g.,
see Spence, Levitan, Shankar, & Zampini 2010). However, most of the experiments
conducted therein assigned complementary or opponent colors to the treatment levels of
their food color manipulations. Complementary colors are those found apart from each
other on the color wheel (e.g., orange and purple). They show the strongest contrast, and
their differences are therefore the most conspicuous to the human eye (Birren 2006). A
food color study incorporating treatments representing small color differences provides a
conservative test of the results of prior research using complementary food color, and
affords the opportunity to discover new or other color-flavor dynamics.
Will the effects on flavor that these treatment levels reveal also hold for treatment
levels representing smaller color differences? That question is the subject of this
research. Analogous colors are those found next to each other on the color wheel (e.g.,
orange and yellow). Relative to the high contrast of complementary colors, analogous
colors are harmonious, and blending (Bleicher 2011). Their differences in terms of the
wavelengths of light that comprise them are less than those of complements, but will this
lesser degree of physical difference be any the less apparent to the consumer? Will small
differences in color still be distinguishable, still evoke characteristic flavor meanings, and
drive varying levels of preference?
In the following we: (1) review and evaluate the extant research on the effects of
food color on flavor perception; (2) develop a conceptual framework that considers
consumer response to analogous food color at each of three stages in the individual
2
choice process, including flavor identification, perception and preference; (3) provide a
methodology that allows the researcher to decompose and estimate the effects of food
color separately at each of the three stages; (4) provide an empirical test of the models’
predictions; and (5) discuss managerial implications.
2. BACKGROUND
2.1 Analogous Food Color
Most prior research testing the effects of food color on perceived flavor treat
complementary color. There are exceptions. However, research that treats small
differences in food color is sparse and limited. It is limited because this research is
category-specific, and is not explicitly intended to examine analogous color as a
construct. Examples would include, for wines, Parpinello, Versari, Chinnici, and Galassi
(2009), who test the relative color preferences of 15 Italian reds, and Ough, and Amorine
(1967), who test preferences by color of five rosés; and, for teas, Wan et al. (2014)
demonstrate that blindfolded Chinese tea drinkers could not identify tea type by flavor
alone. These results support the notion that small differences in color affect consumer
evaluation of flavor, but not in a manner that can be systemized or generalized. This
research will be, to our knowledge, the first food color research that specifically treats the
effects of analogous color in a systematic manner.
2.2 Staged Models of Choice
We consider perceived food color to affect the consumer at each of several stages
in the choice process, as shown by the process model in Figure 1. There is much evidence
that consumers go through a multistage decision process when making a purchase
(Lussier & Olshavsky 1979). Following Roberts (1989), we present individual-level
3
choice as a phased process represented by a series of nested stages where behavior at
each stage is conditioned by the events of previous stages. Food color, the context in
which it is presented and viewed (such as on a store shelf), and actual flavor are proposed
as moderating and sequential effects, respectively, on flavor identification, flavor
perception and flavor preference formation respectively. Flavor identification, perception
and preference are our dependent variables in subsequent studies.
___________________
Figure 1 about Here
___________________
2.3 The Effect of Context
It is appropriate that we operationalize analogous color in this empirical research
by making comparisons between color levels, and between combinations of levels of
food color and taste, because color is a relative phenomenon. Note in Figure 1 that
color’s effect is moderated by “Context.” Color is a highly interactive, relative
phenomenon dependent for its effects on the entire visual field in which it is perceived,
the larger sensory environment in which it is encountered, and the disposition,
circumstances and situation of the viewer (Garber, Hyatt and Boya 2007). Land (1977),
for instance, demonstrated that color determination depends, “not...solely on the
wavelengths entering the eye from that patch but also on the wavelengths entering from
the other regions of the visual field” (Crick 1994, p. 53). In particular, color has been
shown to depend on an interaction with adjacent colors for its effect (Swirnoff 1989;
Albers 1963; Cheskin 1957). For example, red is made to look redder when it is
surrounded by green, its complement, as when a red Lava Soap pack sits next to a green
4
pack of Irish Spring. And red appears less salient when surrounded by red, its analogue,
as when Lava soap sits next to a red Lifebuoy pack.
Moreover, color effect is highly interactive with the other visual features of which
an object is composed, all of which must be integrated before the total effect can be
recognized (Crick 1994; Davidoff 1991; Bruce and Green 1990; Triesman 1988; Marr
1982; Triesman and Gelade 1980). An example would be Crystal Pepsi, whose
transparency caused the bottle form to appear lighter in weight, whereas regular Pepsi,
with its opaque dark color appears heavier and denser (Garber and Buff 1997). Indeed,
there are those who argue that color cannot be perceived and understood independently of
form (Collinson 1992, p. 145).
In addition, there are cultural, social and personal dimensions to color and its
meaning. Hine (1996) describes the cultural dimension as visual conventions that have
built up over time in respective societies. The usual example of differences in the
symbolic meaning of color across cultures is that black is the color of death in Western
societies, while it is white in many Asian countries. And in Japan, brighter colors are
reserved for packages representing foreign products whose people they consider to be
brash, and the more subtle soft gray hues are reserved for their own products. The
meaning of color is also highly situational, changing over time, as in fads and fashion
(Sharpe 1975; Danger 1969), and depends upon the subject category in whose context it
is considered (Bruce and Green 1990; Marr and Nishihara 1978). To illustrate the latter,
Hine (1996, p. 221) reports that a 1987 study showed the residents of four American
cities to believe that red means love, safety, danger, strength and warmth, but when asked
to think about products, they state that it means Coca-Cola.
5
And finally, color, along with visual perception in general, is known to interact
with the other senses, in that visual color sensation may make an impression in another
sense altogether (Ball 1965; Bullough 1909-10; Nelson and Hitchon 1995; Sharpe 1975),
an effect known as synesthesia. Therefore, the effect that a color has on a person may be
couched in terms of temperature (red is hot, blue is cool), weight (dark colors are heavy,
light colors are light), sound (loud, soft) or smell (fresh). In order to isolate the main
effect of analogous food color as a flavor signal, the purpose of this research, we control
for all of the above context effects.
3. CONCEPTUAL DEVELOPMENT
In the following we formulate hypotheses that are consonant with the results of
prior food color research, based on our contention that the color acuity of consumers is
such that finer degrees of food color difference than previously examined will also yield
significant results.
3.1 The Primacy of Food Color as a Flavor Signal in Color Associated Foods
We offer three reasons for food color’s robust effect on perceived flavor (DuBose,
Cardello and Maller 1980; Pangborn 1960). The first is temporal, the second
physiological, and the third comparative. For the first, food color is typically the first
piece of flavor information that the consumer encounters (Hutchings 1977) in the store
(DuBose, Cardello and Maller 1980). Food color can be resolved at a greater physical
distance than labeling, and is therefore processed sooner, perhaps as soon as the shopper
enters the grocery aisle (Garber, Burke and Jones 2000), and, of course, the food is tasted
only later, upon consumption. Thus, in Figure 1, we place food color as antecedent to
actual flavor as a determinant of perceived flavor.
6
The second reason is that flavor is a synesthetic1 stimulus, composed in the least
of taste, smell, mouth feel and texture (Francis 1977; Hutchings 1977), and, similarly, is
cued in a multimodal manner that includes appearance (Zellner, Bartoli and Eckard 1991;
Christensen 1985). Therefore, food color is seen as, “…virtually essential for the correct
identification of color-linked food flavors (odors and taste) such as cherry, lime and
orange [DuBose, Cardello and Maller 1980]…” (Christensen 1985, p. 755).
The third reason is that, relative to taste, food color is the more vivid, affect-
loaded and memorable stimulus (Cheskin 1957). Therefore, any discrepancies between
food color and actual flavor are resolved in favor of food color (Garber, Hyatt and Nafees
2013; Garber, Hyatt and Starr 2000).
In prior flavor identification research, food color has been shown to dominate
taste because subjects exposed to atypical color often misidentify its associated flavor as
being one that is normally associated with that color, an error which Oram et al (1995)
refer to as a “color biased identification error.” There are two possible reasons for this
kind of error, according to Oram et al. (1995, p.240): “… the color-biased identification
errors suggest that the subjects are either not aware that there is a color-flavor conflict, or,
if they are aware, that they cannot ignore the color. Consequently, it is quite possible that
such color-biased identification errors may reflect color being perceptually more salient
than flavor. Color may be perceptually more salient than flavor in those contexts because
color generates a stronger neural response than flavor, or because color is typically
perceived before flavor in eating experience.” We believe that for these same reasons,
1
Synesthesia refers to, “…the subjective sensation or image of another sense than the
one being stimulated, as in color hearing, in which the sounds seem to have characteristic
colors.” (G. & C. Merriam and Co. 1959, p. 862).
7
color will also dominate verbal flavor information just as it has taste information.
These factors, coupled with the existence of ingrained food color/flavor
associations, explain food color as a cue for specific flavor expectations, the mechanism
for food color’s effect on flavor perception, to the extent that, when presented with
uncharacteristic food color, the tendency is to recognize a flavor which is typically
associated with that color, rather than the correct flavor (Skrandies & Reuther, 2008;
Wei, Ou, Ronnier, & Hutchings, 2011). Therefore, we offer the following hypothesis.
H1: When mismatched food color and actual flavor are presented, the
discrepancy is resolved in favor of food color.
3.2 The Effect of Food Color on Flavor Identification
It is generally recognized that food color aids correct flavor identification, as
affirmed by several studies reported in the food science and sensory literatures (DuBose,
Cardello and Maller 1980; Hall 1958; Hyman 1983; Kanig 1955; Moir 1936; Oram,
Laing, Hutchinson, Owen, Rose, Freeman and Newell 1995; Stillman 1993). This is
particularly true for foods that assume many flavors (like beverages) and have no other
visual characteristics related to flavor identification (Christensen 1985). These studies
have generally found that matching color facilitates correct flavor identification, that
mismatching color hampers correct flavor identification, and no color neither facilitates
nor hampers (DuBose, Cardello and Maller 1980; Hall 1958; Hyman 1983; Kanig 1955;
Moir 1936; Pangborn 1960; and Stillman 1993). For example, Pepsi Gold, an amber-
colored cola with a “hint of lemon,” was introduced in India at the time of the 2007
World Cricket Championships, signifying the gold-colored World Cup Trophy. Its
failure has been attributed to a lack of acceptance of a cola as anything but dark brown in
8
color.
Oram et al. (1995) find the effects of color on flavor identification more
pronounced with children than adults, indicating that the association of food color with
flavor is learned early, and that the reliance on color as a flavor signal is greater when
product and flavor knowledge is limited. We therefore propose the following main effect
for food color on flavor identification:
H2a: Mismatching food color and actual flavor hamper correct flavor
identification.
H2b: Matching food color and actual flavor facilitate correct flavor
identification.
3.3 The Effect of Food Color on Flavor Meaning
Only a few studies have examined the effects of food color on flavor perception
or preference, and they present mixed or conflicting results. With respect to perception,
experiments have been of three types, though not necessarily mutually exclusive: those
requiring subjects to make differential judgments along a single dimension (Hyman,
1983) such as sweetness or thirst-quenching-ness; those which measure the effect of
different levels of intensity or saturation of a typical food color; and those which measure
the effects of food color on simple taste sensates (sweet, sour, bitter, salty).
Several studies have examined the effect of matching food color on perceptions of
sweetness or on a sweet-sour dimension. Pangborn (1960) had panels of trained and
untrained subjects evaluate the relative sweetness of a number of fruit flavored waters,
finding that red and orange colored drinks tasted sweeter, and green drinks tasted more
sour. Johnson and Clydesdale (1987) tested the effects of typical color intensity or
saturation on perceptions of sweetness. Using forty untrained subjects, they found that
9
level of perceived sweetness is directly proportional to the saturation level of red color.
Norton and Johnson (1987), however, using eighteen randomly selected subjects and
manipulating the intensity of four typical colors, found no relationship between color
intensity and flavor ratings on a sweet-sour dimension, or on a distinct-indistinct flavor
dimension. Norton and Johnson (1987) further conclude that taste is a much more
powerful determinant of flavor than color on these two dimensions.
In two other studies measuring the effects of food color on a single flavor
dimension, Duncker (1939) found that four of seven subjects report that white chocolate
tasted “milkier” than dark chocolate, and another two subjects find white chocolate to
have less chocolate taste or less taste in general. And Guinard et al. (1998), using twelve
subjects, purport to find that the color intensity of sixteen beers is inversely proportional
to its perceived thirst-quenching-ness (although the ten-level color manipulation was
described as ranging from light to dark, which is a range of values, not color intensity).
Using a multi-attributed approach in a crossed design, Maga (1974) examined the
relative effect of several colors (red, green, yellow and colorless) on the four taste
sensates (basic taste sensations shorn of the complexities of flavor found in whole foods)
of sweet, sour, bitter and salty, presented in water solutions, and found that green makes
sweet drinks seem sweeter (Pangborn 1960 found the opposite), and yellow makes them
seem less sweet. Yellow and green cause sour drinks to seem less sour, and red causes
bitter drinks to seem less bitter. Similarly, McCullough, Martinson and Moinpour (1978)
also manipulated basic taste sensates at two levels (sweet, sour) and color at two levels
(red, blue) to derive a perceptual space using multidimensional scaling. Their results
indicate that blue is perceived to be relatively sweet.
10
All of these studies fall short of offering results that are useful to, or approximate,
a consumer context. Moskowitz (1978, p. 163), in reviewing perceptual food color/flavor
studies to date, concludes that, “…no definitive study had appeared that systemizes the
effect of color upon sensitivity to taste, or to pleasantness of taste.” We feel that
Moskowitz’ conclusion continues to hold true. It remains our need as managers to
understand the effects of food color on full flavor profiles as defined by Wilkie and
Pessemier (1973), both on their nature and on their strength, and we propose a more
comprehensive approach to the problem in the methods section. We therefore test the
following hypotheses in a consumer context.
Given that foods and beverages that are colored provide more information about
their nature than those that do not, and that consumers will infer more about flavor when
presented with color, we predict that foods that are colored will be perceived more
readily and more definitely by consumers than foods that are without color.
The aforementioned hypothesized dominance of food color as a source of flavor
information over actual flavor suggest that food color predominates in the formation of
flavor perceptions. Therefore, we predict that flavor expectations are indicated by food
color, even in the presence of discrepant labeling, and are confirmed by tasting, even if
the flavor indicated by the food color is incorrect:
H3: Differently colored versions of otherwise identical foods evoke distinct
flavor profiles.
3.4 The Effect of Food Color on Flavor Preference
It is commonly believed that food color affects judgments of flavor and food
liking, though this belief is not unequivocally supported by the literature examining this
relationship. Nonetheless, researchers still offer broad testimonials asserting their belief
11
in this relationship. For examples, Maga (1974) states, “Color and flavor are two primary
factors that can influence food acceptability.” Christensen (1985, p. 755) says, “Color is
recognized as an important element in consumer ratings of food palatability, although the
reasons for its importance have not been elucidated.” More poetically, Birren (1963, p.
45) avers, “Color is forever a part of our food, a visual element to which human eyes,
minds, emotions and palates are sensitive. Perhaps through eons of time, man has come
to build up strong and intuitive associations between what he sees and what he eats. A
good meal, to say the least, is always a beautiful sight to behold.” And, again, DuBose,
Cardello and Maller (1980, p. 1393) claim that, “Color is an extremely important attribute
of most food products because it usually influences the consumer’s first judgment of the
product and also provides sensory information which may interact with gustatory,
olfactory, and textural cues to determine the overall acceptability of the product.”
Yet, oddly, neither the research these authors conduct nor the prior research they
cite addresses the relationship between color and preference. Maga (1974), for example,
investigates the effect of color on perceptual attributes such as sweet and sour, and
reviews literature that examines the effects of food color on flavor identifiability and
flavor perception. Christensen (1985) examines the effect of food color on perceptions of
flavor intensity, and reviews the literature on flavor identification. And Dubose, Cardello
and Maller (1980) study the effect s of food color on identification, and of the effects of
color intensity, though not color itself, on hedonic quality, while reviewing the literature
on flavor identification. Birren’s (1963) article is descriptive in nature.
Since prior results fail to show that tasting a beverage tends not to overrule
impressions of flavor formed by viewing its color, we reason that foods that exhibit
12
mismatching colors will be equally well liked as foods that exhibit matching colors, and
both will be preferred to colorless foods. We therefore propose:
H4a: Foods that exhibit mismatching colors and flavors will be equally well
liked as foods that exhibit matching colors and flavors.
H4b: Foods that exhibit colors will be preferred to foods that exhibit no color.
4. A TEST OF THE EFFECTS OF ANALOGOUS FOOD COLOR ON FLAVOR
IDENTIFICATION, PERCEPTION, AND PREFERENCE
4.1 Experimental Design
We follow the procedure introduced by Garber, Hyatt and Starr (2000), and
extended to India by Garber, Hyatt and Nafees (2015), who tested the effects of
complementary food color on flavor perception at three levels in the choice process--
identification, meaning and liking – as we do here, though the current test is with
analogous rather than complementary food colors and manipulates flavor as well as color.
4.2 Stimulus Development
We use fruit beverages in this empirical research for six reasons: 1) fruit
beverage presents no issues concerning condition (i.e., color is not an important indicator
of freshness, rancidness, spoilage, etc.); 2) it comes in many flavors; 3) fruit beverages
are a ubiquitous and familiar product easily evaluated by most international consumers;
4) there is a simple and well-known relationship between fruit colors and the fruit flavors
they represent; 5) fruit beverages are uniform in texture and mouth-feel across flavors;
and, 6) a clear form is commercially available.
The orange- and yellow-colored beverages used in this research were created by
adding flavorless food dyes to Catch, a popular Indian brand of clear, carbonated fruit
13
drink, according to instructions. As a manipulation check, to assure that the colors
generated credibly portrayed the flavors that they were intended to represent, several
subjects who did not participate in the experiment itself were shown samples of each
color of the beverage, in plain white cups that neither identified nor characterized the
beverages in any way, and were asked to identify them strictly by their appearance.
Without exception, they identified the yellow-colored drinks as lemon and the orange-
colored drinks as orange.
4.3 Subjects and Procedure
Five hundred thirty-one graduate students at an Indian Business School that
enrolls students from all parts of India (32.3% female and 67.6% male; 92% between 23
and 28 years of age) were assigned the task of tasting and evaluating a fruit flavored
beverage. Actual fruit flavor at two levels (orange flavor, lemon flavor), and beverage
color at three levels (orange, yellow and clear; the first two representing analogous
colors) were manipulated in a full factorial, between subjects design. Thus, each subject
tasted and evaluated a single color/flavor combination. Each combination may be
classified as either “wrong,” in the sense that the color and flavor are mismatched, as in
the case of a yellow-colored orange drink or an orange-colored lemon drink, or “right,” in
the sense that color and flavor are matching, as in the case of an orange-colored, orange-
flavored drink, or a yellow-colored lemon drink.
Half the subjects sampled orange-flavored Catch, a clear form of carbonated fruit
beverage ubiquitous in India, and half sampled lemon flavored Catch. Brand identity was
not revealed. Rather, subjects were told that a New Zealand beverage brand was being
launched in India, and the researchers wished to know what Indian consumers thought of
14
it. Each subject was furnished with a 3-oz. white cup served uniformly at room
temperature, a cracker to cleanse the palate before tasting, and a survey form to be filled
out after tasting. Within each actual flavor treatment, a third of the respondents sampled
orange-colored drinks, a third sampled yellow, and a third sampled clear-colored drinks.
That the subjects took notice of the color was confirmed by post-test debriefing.
The pencil-and-paper survey consisted of five parts. Part A asked respondents
about their knowledge and usage of fruit beverage products. Part B asked respondents to
rate the drinks they sampled across thirteen attitudinal statements (listed in Table 1) on a
five-point Likert-type scale, where “5” indicated strong agreement and “1” indicated
strong disagreement. The attribute list was developed from focus groups conducted for
this purpose. The list is designed to represent a comprehensive bundle of benefit
attributes that collectively define a fruit beverage product, from which an individual
beverage profile may be derived, according to the method prescribed by Wilkie and
Pessemier (1973). ________________
Table 1 about Here
________________
According to the mean ratings for the total sample, respondents generally found
the beverage they sampled, regardless of actual flavor, to be crisp and clean tasting, and
flavorful. They did not find it to be natural, good for you, or wholesome. This same
general attribute profile applies across all respondent groups and manipulation levels, and
is similar to that obtained by Garber, Hyatt and Nafees (2015) for an Indian student
sample, and by Garber, Hyatt and Starr (2000) for a US student sample; who found the
orange-flavored beverage they sampled to be flavorful, crisp, and clean, but neither
natural, wholesome nor good for you.
15
Unlike those two prior studies, this study also manipulates flavor at two levels.
Some significant differences in attribute ratings across flavor levels were found.
Subjects found the orange-flavored drink to be sweeter, more natural, more flavorful and
more wholesome, and found the lemon-flavored drink to have a crisper taste. Though
subjects rated their liking for the orange-flavored drink higher, they liked both drinks,
and the difference in liking between them is not significant.
The PROC FACTOR procedure (SAS Institute 2004) was applied to the beverage
attribute ratings in order to derive orthogonal flavor factors for use in subsequent tests.
Varimax rotation was used to derive the three factors retained by the MINEIGEN
(minimum eigenvalue) criterion whose loadings are shown in Table 2. Twelve of thirteen
flavor attributes load cleanly onto one of these factors, while the attribute “Is very tart”
loads relatively highly onto both Factors 2 and 3. We interpret this double loading to
mean that “is very tart” is qualitatively distinct from both factors, and therefore specify it
as a freestanding variable in subsequent analyses. Since Factor 3 consisted of two
attributes, one of these being the double-loaded “is very tart,” we specified the lone
remaining attribute in factor 3, “is very crisp,” as a freestanding variable in subsequent
analyses, as well. ________________
Table 2 about Here
________________
Part C asked respondents to evaluate their overall liking of the drink in and of
itself, and their liking of the “particular flavor” of the drink, on respective 7-point valence
scales ranging from “+3” (“Like it very much”) to “–3” (“dislike it very much”), with a
response of “0” indicating indifference or uncertainty. Part D asked subjects to identify
the fruit flavor they tasted by checking the boxes associated with the correct answers
16
from respective closed-form lists of fifteen fruit flavor alternatives, including all the usual
fruit flavors represented in the category plus “Mixed fruit flavors” and “Other.” In a
similar manner, subjects were asked in Part D what fruit flavor they expected prior to
tasting. Part E asked subjects to supply demographic information.
5. RESULTS AND DISCUSSION
Table 3 reports the means for those dependent measures used to test flavor
perception (information pertaining to testing H3) and preference (pertaining to
testing H4a, H4b). The dependent variables used to test flavor identification (pertaining to
testing H2a, H2b, and H1) are binary in nature and therefore not reported in Table 3. Two
covariates, gender and age, were also tested in preliminary analyses, but were omitted
from the final model specifications because they did not have significant effects on the
outcomes. ________________
Table 3 about Here
________________
5.1 Results for Flavor Identification
To test the effects of food color on the consumer’s ability to correctly identify
food flavor, we ran two logistic regressions using the SAS CATMOD procedure (SAS
Institute 2004). The general model specification is:
Y = β0 + βi=1to2*X i=1to2 + βj=1to2*X j=1to2
Where:
Y ≡ A binary dv in which a “1” indicates correct flavor
Identification..
X i ≡ A dummy variable representing the two levels of the actual
food flavor manipulation.
X j=1to2 ≡ A set of two dummy variables representing the three levels of
the food color manipulation.
17
Results in Table 4 show that the main effects of the “wrong color,” that is, orange
color in the case of lemon flavor, and yellow color in the case of orange flavor, are
significant and negative, indicating that “wrong” color significantly negatively affects
correct color identification, in support of H2a. The strength of the “wrong” color’s effect
is greater than that of actual flavor, in support of H1.
_______________
Table 4 about Here
________________
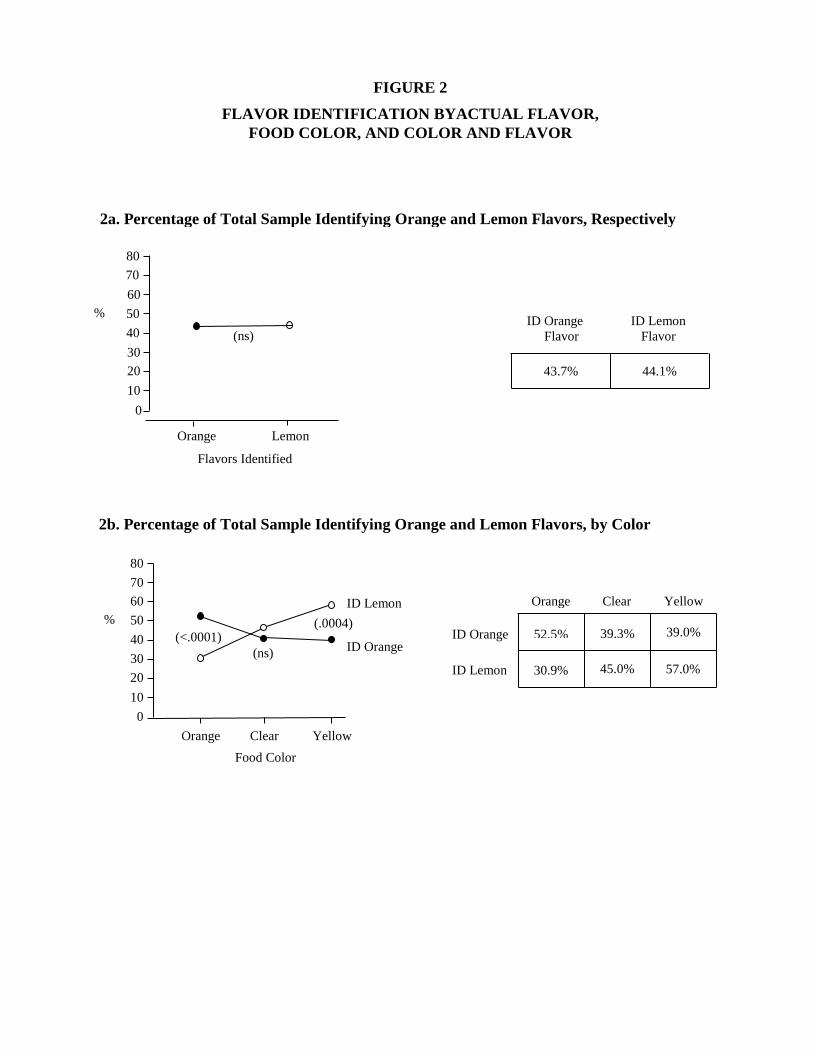
To further examine the ability of actual flavor and food color to affect correct
flavor identification, we compare the proportions of subjects who identify the drink they
sample as lemon or orange, as reported in Figure 2, testing the significance of the
differences between key proportions in the design using Kanji’s Test #5, “Z-test for the
equality between two proportions (binomial distribution)” (Kanji 1993, p.25). As a
manipulation check, we see that, in Figure 2a, subjects identified the orange- and lemon-
flavored drinks a roughly equal amount of the time, as expected, since the sample was
divided evenly in term of flavor sampled. In Figure 2b, we report the proportions of
those who identify their sample as orange or lemon flavored, by food color. We find that
when the drink sampled is orange in color, a significantly larger proportion identify the
drink as orange flavor rather than lemon, regardless of its actual flavor; when the drink
sampled is clear, the difference in proportions is not significant, and when the drink is
yellow, a significantly larger proportion identify it as lemon, regardless of its actual
flavor. This indicates that food color has a significant effect on the food flavor identified,
in support of H2b and H1.
18
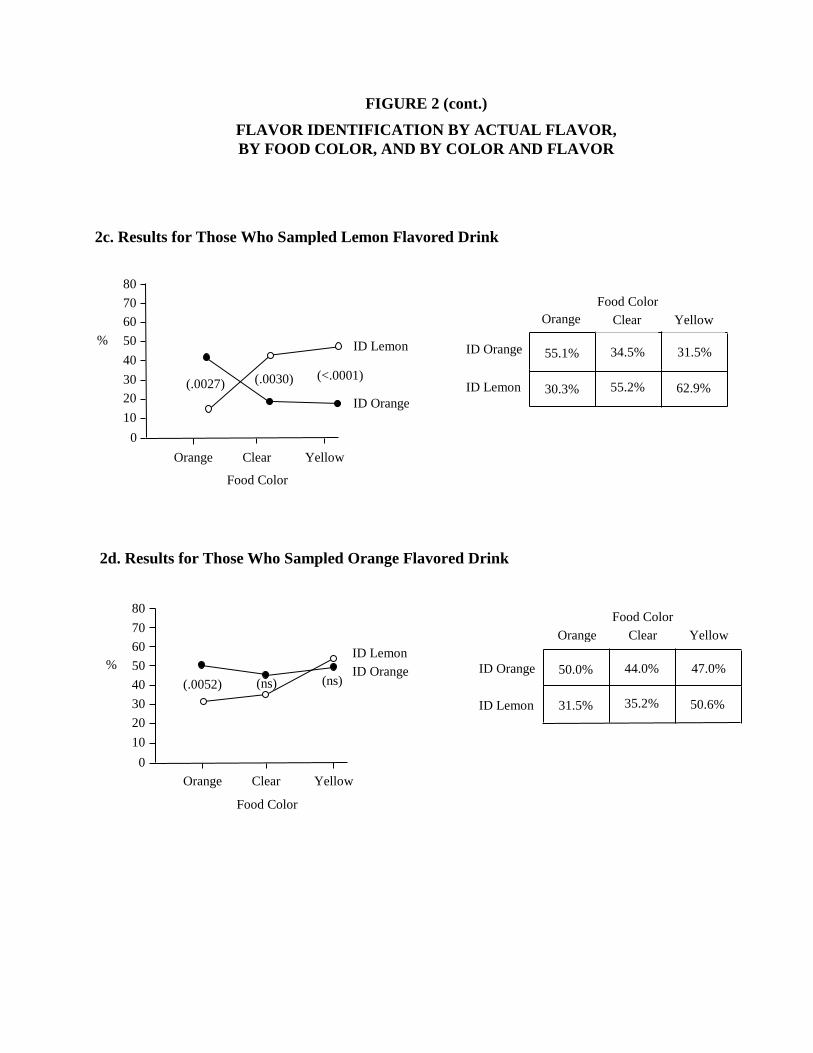
In Figures 2c and 2d, we compare the effects of food color by actual flavor. In
Figure 2c, we report the proportions who identify their sample as orange or lemon flavor,
among those who sampled the lemon-flavored drink. When the sample drink is orange in
color (the “wrong” color, in this case), we find once again that a significantly larger
proportion identify the drink as orange flavor, in spite of the fact that it is the “wrong”
color, mismatched with lemon flavor, in further support of H2b and H1. Moreover, a
significantly larger proportion of subjects who sampled the yellow colored lemon-
flavored drink (the “right” color) identified it as lemon, also in support of H2b. A
significantly larger proportion of those who sampled the clear colored lemon-flavored
drink also identified it as lemon, unsurprising since it was lemon.
In Figure 2d we report results for those who were given orange-flavored drink, by
color. Those exposed to the orange colored beverage (the “right” color) identified it as
orange flavor a significantly greater proportion of the time than those exposed to the
yellow-colored orange drink, in support of H2b. The differences in proportions of those
exposed to the clear drink is not significant, as expected. In the case of the yellow-
colored orange-flavored drink, a larger proportion identified the yellow-colored orange-
flavored drink as lemon, a reversal that is directionally correct though not significantly
so. We speculate that this lack of significance is due to an asymmetry in the effect of
individual colors. Whereas, in the minds of consumers, it may be that orange as a color is
relatively unlikely to ever represent or mean lemon flavor, this result suggests,
conversely, that consumers can more readily conceive of yellow as being more likely to
at times represent or mean orange color. Though not unequivocal due to a lack of
significance to this latter finding, the overall pattern of these results indicates the relative
19
strength of food color as a flavor signal over taste, in support of each of those hypotheses
related to the effects of food color on ability to correctly identify flavor in color-
associated foods: H2a, H2b and H1.
________________
Figure 2 about Here
________________
5.2 Results for Perception
The use of compensatory multi-attribute attitude models have long been used in
marketing to profile competitor brands according to how they are perceived by the
consumer (c.f., Hauser & Koppelman, 1979). In this research we take a similar
decompositional approach to test H3, by comparing the flavor profiles of differently
colored and labeled beverages across the flavor factors derived by the factor analysis
reported in Table 2. We test the main and interaction effects of actual flavor and food
color by fitting a series of four regressions with each of the two flavor factors and two
stand-alone flavor attributes serving as dependent variables, respectively, using the SAS
GLM procedure (SAS Institute 2004). The model specification follows the same general
form as that shown in the “Results for Identification” section above. Results are shown
in Tables 5 and 3.
_______________
Table 5 about Here
________________
We find that actual flavor has a significant main effect on the “Crisp,” “Flavorful,
All natural, Inexpensive,” and “Sweet” flavor factors, indicating that lemon- and orange-
flavored drinks have distinct flavor profiles. Specifically, lemon-flavored drinks are
20
perceived to be crisper in flavor, whereas, orange-flavored drinks are perceived to be
more flavorful, natural, inexpensive, and sweet.
Food color has a significant main effect on “Refreshing, Good for You” flavor
factor, indicating that food colors also have distinct flavor profiles, independent of actual
flavor. Specifically, yellow-colored drinks are seen as more refreshing and better for you
than clear or orange drinks, in support of H3.
The interaction of actual flavor and food color has a significant effect on “Sweet,”
indicating that food color indirectly affects flavor perceptions by mediating the
relationship between actual flavor and flavor perceptions. Specifically, clear lemon
drinks are perceived to be sweeter than colored drinks, whether yellow or orange. And,
perhaps conversely, yellow-colored, orange-flavored drinks are perceived to be sweeter
than orange-colored orange drinks, which are in turn perceived to be sweeter than clear-
colored orange drinks, in further support of H3.
5.3 Results for Flavor Preference
To test the effects of food color on liking or preference, an ANOVA model was
fitted to the data using the SAS GLM procedure (SAS Institute, 2004). Subjects rated
their liking of the beverage they sampled on two separate liking scales, overall flavor
liking and overall beverage liking. These proved to be highly correlated ( = .765),
indicating that both questions measure the same underlying construct. Therefore, a
composite liking measure was created by taking a simple mean of the two, which served
as the dependent variable. Results are shown in the last row of Tables 1, 3 and 5.
Food color has a significant main effect on liking. Interestingly, the main effect
of actual flavor is not significant, indicating the relative strength of food color as a flavor
21
signal over actual flavor, in support of H4a. Specifically, yellow-colored drinks are
preferred to orange drinks, and orange-colored drinks are preferred to clear drinks,
indicating that drinks with actual color, in contrast to a drink with no color, are preferred,
regardless of their actual flavor; in support of H4b. The interaction of actual flavor and
food color has no significant effect on flavor liking.
6. MANAGERIAL IMPLICATIONS
These results extend to analogous colors (fine color gradations) prior findings that
food color affects the consumer’s ability to correctly identify flavor as well as to form
distinct flavor profiles and preferences, and dominates other flavor information sources.
Put another way, these results suggest that that consumers’ acuity for food color is such
that even slight color differences lead to little diminution in food color’s effect on flavor
perception. Its further implication is that food color at all levels is inextricably linked to
expected flavor in the minds of consumers. These strong color associations can be used
by marketers of non-food products as well, such as pharma and hygiene products. For
example, medicines for children can incorporate colors to make them more palatable
since certain colors are associated with particular flavors in the minds of kids.
Implications for the soap and body wash industry suggest that using colors associated
with the fruits and vegetables in their products can be used to add differentiation and
meaning, thereby increasing the natural feel consumer appeal of these products. For
example, see http://www.originalsource.co.uk/ to see the Original Source line of bath and
shower products, which claim to be natural and have deep rich colors for each of their
“flavors,” like mint, raspberry, lemon, etc.
Consumers’ strong pre-conceived color-flavor associations make the deliberate
22
selection of mismatched food color (however subtle) attention-getting, a favorable quality
for marketing communications purposes. This can be problematic, though, if one’s
marketing objectives rely on detaching color’s meaning and its message from its flavor
implications. But not impossible. In the following, we present three possible strategies
for making the introduction of a novel food color viable for marketing communications
purposes. The first is to teach consumers to accept a novel color as characteristic, or
emblematic, of a particular food, as brown is for cola. When the appearance of a food
product is nondescript, then associating it with a new, more vibrant color can enhance its
noticeability, its distinctiveness and its appeal. Such has been the case with green for
peppermint or yellow for Mountain Dew and all its me-too competition (a me-too color
strategy). A problem with rendering a novel food color characteristic is that it will likely
be a lengthy and expensive process, requiring as it does the conditioning of consumers to
accept a new color as characteristic of a particular food product. Another obstacle is the
sheer diversity and multiplicity of food products (and their packages) on display. This
makes it hard for the marketer to find an empty visual niche, when compared to the days
when peppermint was made green or cola was made brown. Another drawback to
rendering a novel color no longer novel is that it loses its ability to surprise the consumer
into attention, which was the prime reason for utilizing novel color in the first place.
The second strategy is to celebrate the very incongruity of a novel food color, to
announce to the consumer that its novelty is there to surprise and delight, and the proper
response is to have fun and enjoy it. This is done by featuring novel color and its very
incongruence in the shelf presentation. The consumer therefore knows that the
incongruence is intended, is meant to be amusing, and is therefore made to feel welcome
23
to share in the fun. An example of this is Gatorade’s Blue Raspberry drink, an
uncharacteristically blue-colored beverage whose name calls attention to the
incongruence of the drink’s color and flavor.
The third strategy for the introduction of novel food color is to sever the food
color and flavor expectations connection, making it impossible for the consumer to
connect the two. If color and flavor are not connected, then novel food color cannot be
incongruent. First, the natural tendency of the consumer to connect color and flavor must
be deliberately blocked, to permit the introduction of other color themes and associations
to distinguish and contrast the brand, and lend it meaning. The most straightforward
means of unlinking food color and labeling is to mask food color. The focus of the
product can then be shifted to a more thematic association. Several drink brands have
elected this approach by packaging their drinks in opaque bottles or plastic labels that
cover the outside of the package, thus hiding the view of the actual product. An Indian
example of the masking of food color with an opaque package is Nescafe Iced
Cappuccino Mix (to see package, go to
http://www.nestle.in/brands/beverages/nescafecappuccino), which comes in opaque
boxes. The Vanilla Latte is blue and the Mocha purple, neither color a coffee-flavor-
associated color.
A more subtle approach to the disconnection of the food color/expected flavor
relationship is the selection or creation of food colors and flavors that are not flavor- or
color-associated. In denying the consumer the ability to readily categorize the flavor cues
that food color and labeling present, the consumer may be induced into a mode of more
elaborated information processing in order to understand and evaluate the product. This
24
opens an opportunity for the presentation of promotional ideas, symbols, meanings and
associations through the medium of novel food color. Gatorade goes so far as to withhold
specific flavor information in its “Nutritional Facts” label on its Frost line of beverages,
citing only “natural flavors.” The consumer is therefore blocked from falling back on old
flavor habits, and can have none of the usual flavor expectations prior to tasting. The
consumer is therefore forced to consider and evaluate the Frost line of drinks in an
entirely new context.
A related but somewhat different approach seeks an alternative appeal that is
cognitive in nature. For example, Gatorade India offers a beverage line called “Blue
Bolt,” (to see package, go to http://www.gatorade.co.in/gatorade-sports-drink/index.html)
whose color is an electric blue, not naturally or commonly associated with any fruit
flavor, whose name and body text refer to energy and activity, an alert and excited bodily
state, rather than to its flavor, and whose color is designed to be consistent with those
themes rather than with flavor. Additionally, as mentioned earlier, Pepsi India introduced
an amber colored form of Pepsi called Pepsi Gold, signifying the Cricket World Cup
Gold Trophy (to see package, go to http://blogger-2006.blogspot.com/2007/07/).
7. EXTENSIONS
Valuable future research would include generalizing on the results of this
experiment by manipulating other food flavors in additional food categories, along with
food color and label information. With respect to food flavor, this research implicitly
assumes that flavors differ purely on the basis of how well they are liked, and may
therefore be compared directly. However, flavors as complex multidimensional stimuli
each have their own particular character. By replicating this study with other flavors we
25
may account for any flavor-specific effects, as well as investigate the effects of the
particular meanings of specific colors. Looking at other families of colors as well as
looking at colors with even smaller differences between them might yield interesting
results. For example, future research could decompose the color comparisons, making
small changes to hue, saturation and value, with the idea that these changes may have
systematically different effects. Or perhaps the differences may be primarily contained in
one of these dimensions. Or each may carry their own difference in meaning; for
instance, dark to light may appear differently than warm to cool, or pale red (say) versus
deep red.
Investigating these effects in food categories other than beverages, such as solid
foods, might show that the relationship between food color and flavor varies from one
food category to another. Extending this research to flavor categories other than fruit
flavors might also yield managerially relevant findings.
Another interesting avenue for future research includes conducting taste tests in
other countries. Taste testers may vary in behavior from country to country. For
example, we observed Indian subjects sampling beverages in a manner which was far
more careful and deliberate than American subjects. They did not swig the drinks like
Americans, but would instead take many little sips and reflect on the experience each
time as well in a highly cognitive manner.
Comparisons across countries represent interesting avenues for study because
food and food consumption have social and cultural components. Such comparisons
could help to explain prior research results for example that showed that Indian
respondents liked purple drink significantly better than the correctly matched orange
26
colored beverage (Garber, Hyatt and Nafees 2015); perhaps they simply liked purple
better than orange color. Or, perhaps, there is a culture-specific meaning that caused
purple to be preferable in this context, over and above its flavor associations. Further
research is needed to test these possibilities.
Acknowledgements
We wish to gratefully acknowledge the generous assistance of: Robert Aitken with the
stimulus development portion of this research; Sailesh Agrawal, Sambhav Jain,
Omkumar Krishnan, Shivam Malhotra, A.R. Mishra, and Varun Singh with survey
administration; and Abhijit Biswas with aspects of the conceptual development. Authors
are listed alphabetically. Each contributed equally, and each has approved the final
article.
27
REFERENCES
Albers, J. (1963). Interaction of color. New Haven, CT: Yale University Press.
Ball, V.K. (1965). The Aesthetics of Color: A Review of Fifty Years of Experimentation.
Journal of Aesthetics and Art Criticism, 23, 441-452.
Birren, F. (2006), Color Dimensions: Creating New Principles of Color Harmony and
a Practical Equation in Color Definition, Whitefish, MN: Kessinger Publishing.
_______, (1963), Color, A Survey in Words and Pictures, NYC: Citadel Press.
Bleicher, S. (2011), Contemporary Color: Theory & Use, Clifton Park. NY: Delmar
Cengage Learning.
Bruce, V., & Green, P. R. (1990). Visual Perception: Physiology, Psychology
and Ecology. Hillsdale, NJ: Lawrence Erlbaum Associates.
Bullough, E. (1910), “The Perceptive Problem in the Aesthetic Appreciation of Simple
Color Combinations,” The British Journal of Psychology, 406-447.
Cheskin, L. (1957). How to Predict What People Will Buy. New York: Liveright.
Christensen, C. M. (1985), “Effect of Color on Judgments of Food Aroma and
Flavour Intensity in Young and Elderly Adults,” Perception, 14, 755-62.
Collinson, D. (1992). Aesthetic experience. In O. Hanfling (Ed.), Philosophical
Aesthetics, Cambridge: The Open University.
Crick, F. ( 1994 ). The Astonishing Hypothesis: The Scientific Search for the Soul. New
York, NY: Simon and Schuster.
Danger, E.P. (1969). How to use color to sell. Boston. MA: Cahners.
Davidoff, J. (1991 ). Cognition Through Color. Boston, MA: MIT Press.
DuBose, C.N., Cardello, A.V., & Maller, O. (1980). Effects of Colorants and Flavorants
on Identification of Perceived Flavor Intensity, and Hedonic Quality of Fruit-flavored
Beverages and Cakes. Journal of Food Science, 45, 1393-1399, 1415.
Duncker, K. (1939). The Influence of Past Experience Upon Perceptual Properties,”
American Journal of Psychology, 52, 255-265.
Francis, F.J. ( 1977 ). Colour and Appearances as Dominating Sensory Properties of
Foods, in G. Birch , J. Brennan, & K. Parker (Eds.), Sensory Properties of Foods (27
43). London, England: Applied Science.
Merriam-Webster On-Line (2014), http://www.merriam-webster.com/
Springfield, MA: G.&C Merriam and Co. Merriam-Webster On-Line.
Garber, L. L., Jr., Burke, R.R., & Jones, J.M. (2000). The role of package appearance
in consumer purchase consideration and choice. Boston: Marketing Science Institute
Working Paper Series.
_______,Hyatt, E.M. and Boya, Ü. Ö. (2007), “The Mediating Effects
of Product and Package Appearance on Consumer Behavior,” in H.N.J. Schifferstein
and P. Heckart (eds.), Product Experience: Perspectives on the Human-Product
Interaction, Amsterdam: Elsevier.
_______,Hyatt, E.M. and Nafees, L. (2015), “The Publications Effects of Food
Color on Perceived Flavor: A Factorial Investigation in India.” Journal of Food
Products Marketing. 21(5), forthcoming.
_______, Hyatt, E.M. & Starr, R.R. Jr. (2000). Placing food color experimentation
into a valid consumer context. Journal of Food Products Marketing, 7 (3), 3-24.
Guinard, J.-X., Souchard, A., Picot, M., Rogeaux, M. and Sieffermann, J.M. (1998),
28
“Sensory Determinants of the Thirst-quenching Character of Beer,” Appetite, 31, 101-
115.
Hall, R.L. (1958). Flavor study approaches at McCormack and Company, Inc. in A.D.
Little (Ed.), Flavor Research and Food Acceptance: A Survey of the Scope of Flavor
and Associated Research, Compiled from Papers Presented in a Series of Symposia
Given in 1956-1957. New York: Reinhold, p. 224-240.
Hauser, J.R., & Koppelman, F.S. (1979). Alternate perceptual mapping techniques:
relative accuracy and usefulness. Journal of Marketing Research, XVI,
(November), 495-506.
Hine, T. (1996). The Total Package. New York: Little, Brown and Company.
Hutchings, J.B. (1977), “The Importance of the Visual Appearance of Foods to the Food
Processor and the Consumer,” Journal of Food Quality, 1, 267-278.
Hyman, A. (1983). The influence of color on the taste perception of carbonated
water preparations. Bulletin of the Psychonomic Society, 21(2), 145-148.
Johnson, J., & Clydesdale, F.M. (1982). Perceived Sweetness and Redness in Colored
Sucrose Solutions. Journal of Food Science, 47, 747-752.
Kanig, J.L. (1955), “Mental Impact of Colors in Foods Studied,” Food Field Reporter,
23, 57.
Kanji, G.K. (1993). 100 Statistical Tests. London: Sage Publications Ltd.
Land, E. H. (1977). The Retinex Theory of Color Vision. Scientific American, 237,
108-128.
Lussier, D.A., & Olshavsky, R.W. (1979). Task Complexity and Contingent
Processing in Brand Choice. Journal of Consumer Research, 6 (September), 154-165.
Maga, J.A. (1974). Influence of Color on Taste Thresholds. Chemical Senses, Flavor, 1 ,
115-119 .
Marr, D. (1982), Vision: A Computational Investigation into the Human Representation
of Processing of Visual Information, San Francisco CA: W.H. Freeman and Co.
_______, & Nishihara, H.K. (1978). Representation and Recognition of the Spatial
Organization of Three-Dimensional shapes. Proceedings of the Royal Society of
London, Series B, 207, 187-216.
McCullough, J.M., Martinsen, C.S. and Moinpour, R. (1978), “Application
of Multidimensional Scaling to the Analysis of Sensory Evaluations of Stimuli with
Known Attribute Structures,” Journal of Applied Psychology, 65 (1), 103-9.
Moir, H.C. (1936), “Some Observations on the Appreciation of Flavor in Food Stuffs,”
Chemistry and Industry, 55, 145-8.
Moskowitz, H. R. (1978), “Taste and Food Technology: Acceptability, Aesthetics,
and Preference,” Handbook of Perception, VIA, 158-93.
Nelson, M.R. and Hitchon, J.C. (1995). Theory of Synesthesia Applied to Persuasion in
Print Advertising Headlines. Journalism & Mass Communication Quarterly, 346-360.
Norton, W.E., and F.N. Johnson (1987), “The Influence of Intensity of Color on
Perceived Flavor Characteristics,” Medical Science Research, 15, 329-330.
Oram, N., Laing, D.G., Hutchinson, I., Owen, J., Rose, G., Freeman, M., & Newell, G.
(1995). The influence of flavor and color on drink identification among children and
adults. Developmental Psychobiology, 28 (4), 234-246.
Pangborn, R.M. (1976), “Influence of Color on the Discrimination of Sweetnesss,”
American Journal of Psychology, 73, 229-38.
29
Roberts, J.H. (1989). A Grounded model of consideration set size and composition.
Advances in Consumer Research, 16, 749-757.
SAS Institute Inc. (2004). SAS/STAT User’s Guide, Version 9. Cary, NC: SAS Institute,
Inc.
Sharpe, D.T. ( 1975). The Psychology of Color and Design. Chicago, IL: Nelson-Hall
Company.
Skrandies, W., & Reuther, N. (2008). Match and mismatch of taste, odor,
and color is reflected by electrical brain activity in the human brain. Journal of
Psychophysiology, 22(4), 175-184.
Spence, C., Levitan, C.A., Shankar, M.U., & Zampini, M. (2010). Does food color
influence tasteand flavor perception in humans? Chemosensory Perception, 3(1), 68-
94.
Stillman, J.A. (1993). Color influences flavor identification in fruit-flavored
Beverages. Journal of Food Science, 58, 810-812.
Swirnoff, L. (1989). Dimensional color, Boston, MA: Birkhauser.
Treisman, A. (1991). Search, Similarity, and Integration of Features Between and
Within Dimensions. Journal of Experimental Psychology: Human Perception and
Performance, 40A, 201-37.
_______ & G. Gelade (1980). A Feature-Integration Theory of Attention. Cognitive
Psychology, 14, 107-141.
Wei, S.-T., Ou, L.-C., Luo, M.R., & Hutchings, J.B, (2012). Optimisation of food
expectations using product colour and appearance. Food Quality and Preference, 23,
49-62.
Wilkie, W.L., & Pessemier, E.A. (1973). Issues in Marketing’s Use of Multiattribute
Attitude Models. Journal of Marketing Research, 10 (November) 428-441.
Zellner, D. A., Bartoli, A. M., & Eckard, R. (1991). Influence of Color on Odor
Identification and Liking Ratings. American Journal of Psychology, 104, 547-561.
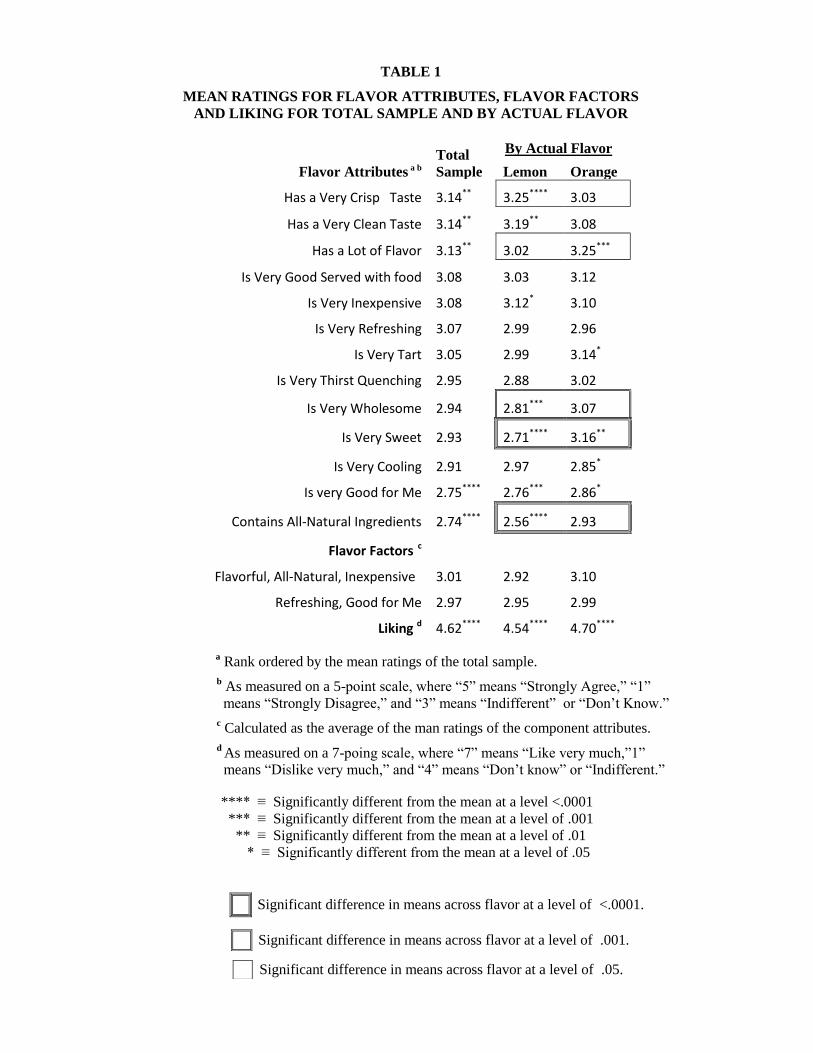
TABLE 1
MEAN RATINGS FOR FLAVOR ATTRIBUTES, FLAVOR FACTORS
AND LIKING FOR TOTAL SAMPLE AND BY ACTUAL FLAVOR
Flavor Attributes a b
Total
Sample
Lemon
Orange
Has a Very Crisp Taste 3.14** 3.25**** 3.03
Has a Very Clean Taste 3.14** 3.19** 3.08
Has a Lot of Flavor 3.13** 3.02 3.25***
Is Very Good Served with food 3.08 3.03 3.12
Is Very Inexpensive 3.08 3.12* 3.10
Is Very Refreshing 3.07 2.99 2.96
Is Very Tart 3.05 2.99 3.14*
Is Very Thirst Quenching 2.95 2.88 3.02
Is Very Wholesome 2.94 2.81*** 3.07
Is Very Sweet 2.93 2.71**** 3.16**
Is Very Cooling 2.91 2.97 2.85*
Is very Good for Me 2.75**** 2.76*** 2.86*
Contains All-Natural Ingredients 2.74**** 2.56**** 2.93
Flavor Factors c
Flavorful, All-Natural, Inexpensive 3.01 2.92 3.10
Refreshing, Good for Me 2.97 2.95 2.99
Liking d 4.62**** 4.54**** 4.70****
a Rank ordered by the mean ratings of the total sample.
b As measured on a 5-point scale, where “5” means “Strongly Agree,” “1”
means “Strongly Disagree,” and “3” means “Indifferent” or “Don’t Know.”
c Calculated as the average of the man ratings of the component attributes.
d As measured on a 7-poing scale, where “7” means “Like very much,”1”
means “Dislike very much,” and “4” means “Don’t know” or “Indifferent.”
**** ≡ Significantly different from the mean at a level <.0001
*** ≡ Significantly different from the mean at a level of .001
** ≡ Significantly different from the mean at a level of .01
* ≡ Significantly different from the mean at a level of .05
Significant difference in means across flavor at a level of <.0001.
Significant difference in means across flavor at a level of .001.
Significant difference in means across flavor at a level of .05.
By Actual Flavor
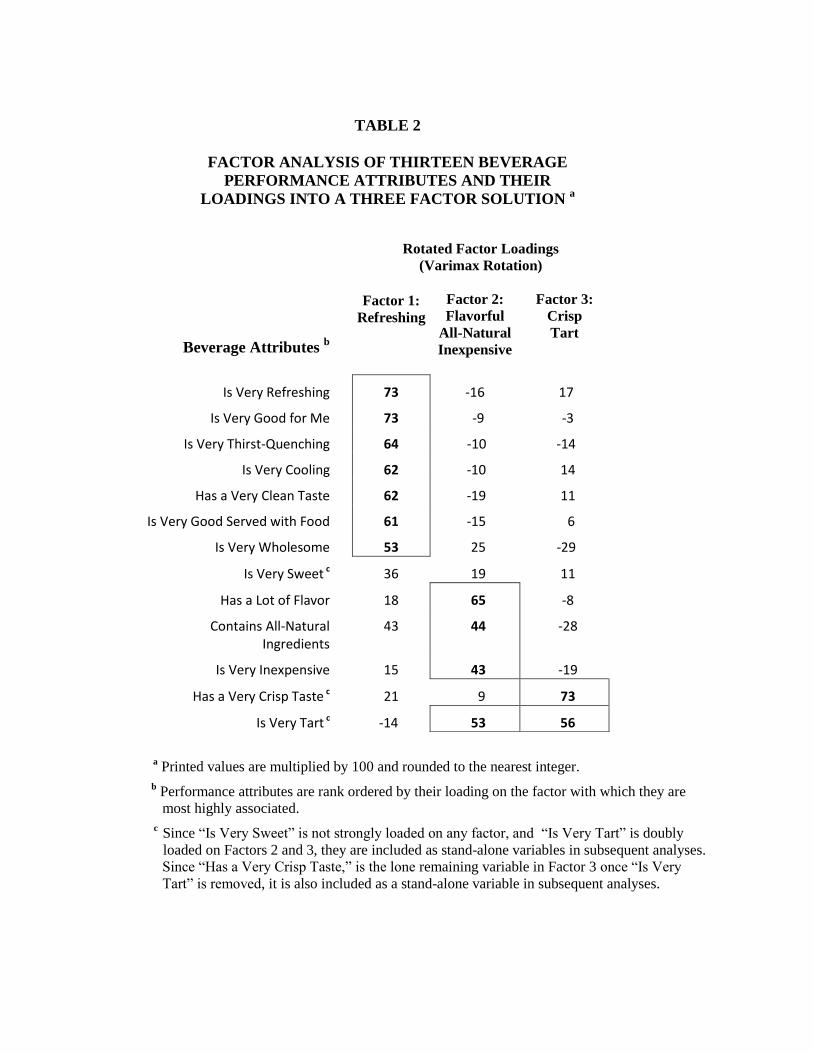
a Printed values are multiplied by 100 and rounded to the nearest integer.
b Performance attributes are rank ordered by their loading on the factor with which they are
most highly associated.
c Since “Is Very Sweet” is not strongly loaded on any factor, and “Is Very Tart” is doubly
loaded on Factors 2 and 3, they are included as stand-alone variables in subsequent analyses.
Since “Has a Very Crisp Taste,” is the lone remaining variable in Factor 3 once “Is Very
Tart” is removed, it is also included as a stand-alone variable in subsequent analyses.
TABLE 2
FACTOR ANALYSIS OF THIRTEEN BEVERAGE
PERFORMANCE ATTRIBUTES AND THEIR
LOADINGS INTO A THREE FACTOR SOLUTION a
Rotated Factor Loadings
(Varimax Rotation)
Beverage Attributes b
Factor 1:
Refreshing
Factor 2:
Flavorful
All-Natural
Inexpensive
Factor 3:
Crisp
Tart
Is Very Refreshing 73 -16 17
Is Very Good for Me 73 -9 -3
Is Very Thirst-Quenching 64 -10 -14
Is Very Cooling 62 -10 14
Has a Very Clean Taste 62 -19 11
Is Very Good Served with Food 61 -15 6
Is Very Wholesome 53 25 -29
Is Very Sweet c 36 19 11
Has a Lot of Flavor 18 65 -8
Contains All-Natural Ingredients
43 44 -28
Is Very Inexpensive 15 43 -19
Has a Very Crisp Taste c 21 9 73
Is Very Tart c -14 53 56
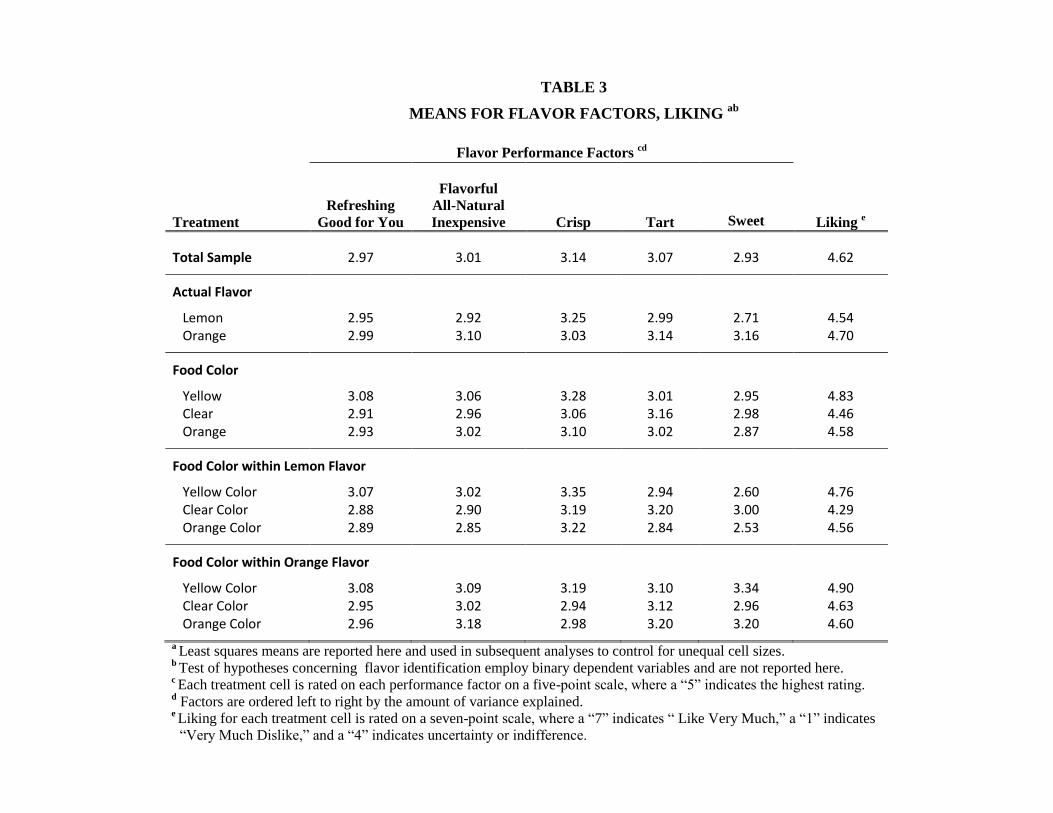
TABLE 3
MEANS FOR FLAVOR FACTORS, LIKING ab
Flavor Performance Factors cd
Treatment
Refreshing
Good for You
Flavorful
All-Natural
Inexpensive
Crisp
Tart
Sweet
Liking e
Total Sample 2.97 3.01 3.14 3.07 2.93 4.62
Actual Flavor
Lemon 2.95 2.92 3.25 2.99 2.71 4.54 Orange 2.99 3.10 3.03 3.14 3.16 4.70
Food Color
Yellow 3.08 3.06 3.28 3.01 2.95 4.83 Clear 2.91 2.96 3.06 3.16 2.98 4.46 Orange 2.93 3.02 3.10 3.02 2.87 4.58
Food Color within Lemon Flavor
Yellow Color 3.07 3.02 3.35 2.94 2.60 4.76 Clear Color 2.88 2.90 3.19 3.20 3.00 4.29 Orange Color 2.89 2.85 3.22 2.84 2.53 4.56
Food Color within Orange Flavor
Yellow Color 3.08 3.09 3.19 3.10 3.34 4.90 Clear Color 2.95 3.02 2.94 3.12 2.96 4.63 Orange Color 2.96 3.18 2.98 3.20 3.20 4.60
a Least squares means are reported here and used in subsequent analyses to control for unequal cell sizes.
b Test of hypotheses concerning flavor identification employ binary dependent variables and are not reported here.
c Each treatment cell is rated on each performance factor on a five-point scale, where a “5” indicates the highest rating.
d Factors are ordered left to right by the amount of variance explained.
e Liking for each treatment cell is rated on a seven-point scale, where a “7” indicates “ Like Very Much,” a “1” indicates
“Very Much Dislike,” and a “4” indicates uncertainty or indifference.
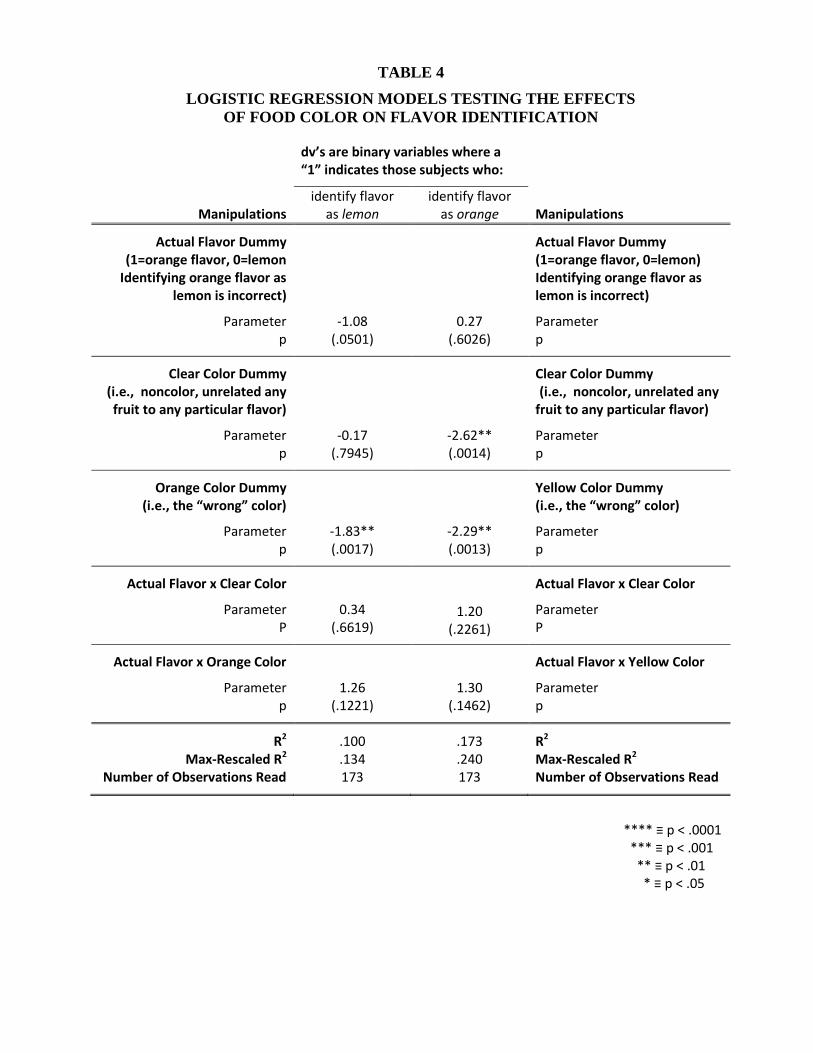
TABLE 4
LOGISTIC REGRESSION MODELS TESTING THE EFFECTS
OF FOOD COLOR ON FLAVOR IDENTIFICATION
dv’s are binary variables where a “1” indicates those subjects who:
Manipulations
identify flavor as lemon
identify flavor as orange
Manipulations
Actual Flavor Dummy (1=orange flavor, 0=lemon
Identifying orange flavor as lemon is incorrect)
Parameter p
-1.08 (.0501)
0.27 (.6026)
Actual Flavor Dummy (1=orange flavor, 0=lemon) Identifying orange flavor as lemon is incorrect)
Parameter p
Clear Color Dummy (i.e., noncolor, unrelated any fruit to any particular flavor)
Parameter p
-0.17 (.7945)
-2.62** (.0014)
Clear Color Dummy (i.e., noncolor, unrelated any
fruit to any particular flavor)
Parameter p
Orange Color Dummy (i.e., the “wrong” color)
Parameter p
-1.83** (.0017)
-2.29** (.0013)
Yellow Color Dummy (i.e., the “wrong” color)
Parameter p
Actual Flavor x Clear Color
Parameter P
0.34 (.6619)
1.20 (.2261)
Actual Flavor x Clear Color
Parameter P
Actual Flavor x Orange Color
Parameter p
1.26 (.1221)
1.30 (.1462)
Actual Flavor x Yellow Color
Parameter p
R2 Max-Rescaled R2
Number of Observations Read
.100
.134 173
.173
.240 173
R2 Max-Rescaled R2
Number of Observations Read
**** ≡ p < .0001 *** ≡ p < .001 ** ≡ p < .01 * ≡ p < .05
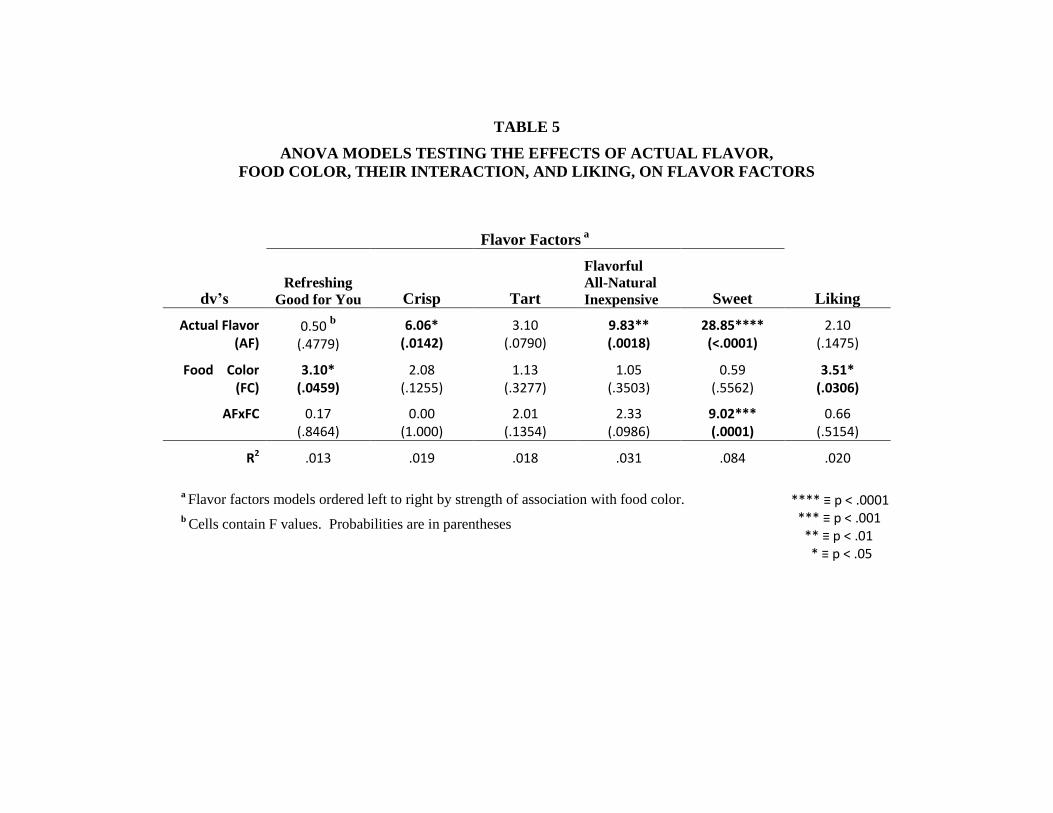
TABLE 5
ANOVA MODELS TESTING THE EFFECTS OF ACTUAL FLAVOR,
FOOD COLOR, THEIR INTERACTION, AND LIKING, ON FLAVOR FACTORS
Flavor Factors a
dv’s
Refreshing
Good for You
Crisp Tart
Flavorful
All-Natural
Inexpensive Sweet Liking
Actual Flavor (AF)
0.50 b (.4779)
6.06* (.0142)
3.10 (.0790)
9.83** (.0018)
28.85**** (<.0001)
2.10 (.1475)
Food Color (FC)
3.10* (.0459)
2.08 (.1255)
1.13 (.3277)
1.05 (.3503)
0.59 (.5562)
3.51* (.0306)
AFxFC 0.17 (.8464)
0.00 (1.000)
2.01 (.1354)
2.33 (.0986)
9.02*** (.0001)
0.66 (.5154)
R2 .013 .019 .018 .031 .084 .020
a Flavor factors models ordered left to right by strength of association with food color.
b Cells contain F values. Probabilities are in parentheses
**** ≡ p < .0001 *** ≡ p < .001 ** ≡ p < .01 * ≡ p < .05
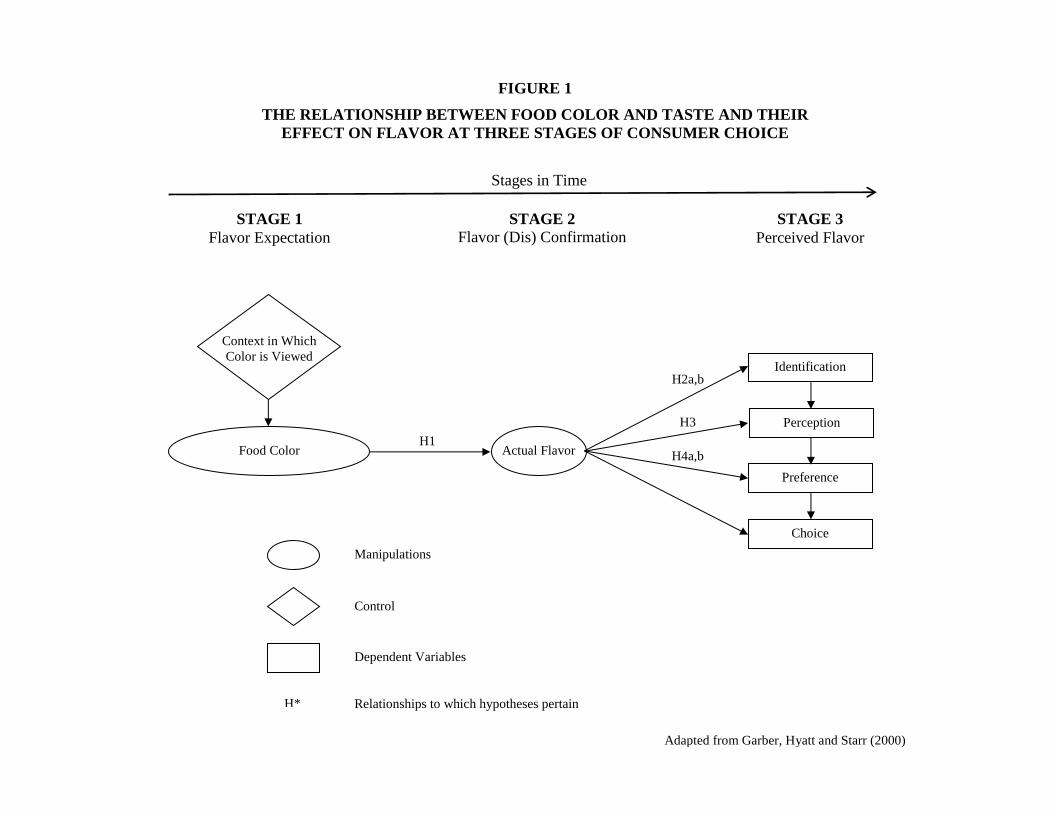
FIGURE 1
THE RELATIONSHIP BETWEEN FOOD COLOR AND TASTE AND THEIR
EFFECT ON FLAVOR AT THREE STAGES OF CONSUMER CHOICE
Adapted from Garber, Hyatt and Starr (2000)
Dependent Variables
Manipulations
Control
Relationships to which hypotheses pertain H*
Identification
Preference
Perception
Choice
Food Color
Context in Which
Color is Viewed
Actual Flavor H1
H2a,b
H4a,b
H3
STAGE 1
Flavor Expectation
STAGE 2
Flavor (Dis) Confirmation
STAGE 3
Perceived Flavor
Stages in Time
(.0004)
(ns)
(ns)
(<.0001)
FIGURE 2
FLAVOR IDENTIFICATION BYACTUAL FLAVOR,
FOOD COLOR, AND COLOR AND FLAVOR
2a. Percentage of Total Sample Identifying Orange and Lemon Flavors, Respectively
%
80
70
60
50
30
40
20
10
0
Flavors Identified
Orange
Lemon
ID Orange
Flavor
ID Lemon
Flavor
43.7% 44.1%
2b. Percentage of Total Sample Identifying Orange and Lemon Flavors, by Color
Food Color
%
70
60
50
80
40
30
20
10
0
Clear
Orange
Yellow
ID Orange
ID Lemon
ID Lemon
ID Orange
Orange Yellow Clear
52.5% 39.3% 39.0%
30.9% 45.0% 57.0%
(ns)
(ns)
(.0052)
(.0030)
(.0027)
ID Lemon
ID Orange
2c. Results for Those Who Sampled Lemon Flavored Drink
%
70
60
50
80
40
30
20
10
0
Food Color
Clear
Orange
Yellow
ID Lemon
ID Orange 55.1% 34.5% 31.5%
30.3% 55.2% 62.9%
Orange Yellow Clear
Food Color
ID Orange
ID Lemon
2d. Results for Those Who Sampled Orange Flavored Drink
ID Lemon
ID Orange 50.0% 44.0% 47.0%
31.5% 35.2% 50.6%
Orange Yellow Clear
Food Color
Food Color
Clear
Orange
Yellow
%
70
60
80
50
40
30
20
10
0
FIGURE 2 (cont.)
FLAVOR IDENTIFICATION BY ACTUAL FLAVOR,
BY FOOD COLOR, AND BY COLOR AND FLAVOR
(<.0001)
Figure Captions
FIGURE 1
THE RELATIONSHIP BETWEEN FOOD COLOR AND TASTE AND THEIR
EFFECT ON FLAVOR AT THREE STAGES OF CONSUMER CHOICE
FIGURE 2
FLAVOR IDENTIFICATION BYACTUAL FLAVOR,
FOOD COLOR, AND COLOR AND FLAVOR