the effects of alcohol consumption on planning for movement /...
TRANSCRIPT

THE EFFECTS OF ALCOHOL CONSUMPTION ON PLANNING FOR
MOVEMENT
by
REKHA DATAR
M.Sc (Occupational Therapy) Bombay University, India, 1982.
THESIS SUBMITTED IN PARTIAL FULFILLMENT OF
THE REQUIREMENTS FOR THE DEGREE OF
MASTER OF SCIENCE
in the School of
Kinesiology
O REKHA DATAR 1988 SIMON FRASER UNIVERSITY
AUGUST, 1988.
All rights reserved. This thesis may not be reproduced in whole or in part, by photocopy
or other means, without permission of the author.
Name :
APPROVAL
REKHA DATAR
Degree: Master of Science (Kinesiology)
Title of THESIS:
THE EFFECTS OF ALCOHOL CONSUMPTION ON PLANNING FOR MOVEMENT
Examining Committee:
Chairman: Dr. A. Chapman
DF. D. Goodman Senior Supervisor
/
D$ J. Dickinson
Dr. P. Bawa
B r r 3 . ~eyerste- Psyehehgy SFU External Examiner
Date Approved:

PARTIAL COPYRIGHT LICENSE
I h e r e b y g r a n t t o Simon F r a s e r U n i v e r s i t y t h e r i g h t t o l end
my t h e s i s o r d i s s e r t a t i o n ( t h e t i t l e o f which i s shown b e l o w ) t o u s e r s
of t h e Simon F r a s e r U n i v e r s i t y L i b r a r y , and t o make p a r t i a l o r s i n g l e
c o p i e s o n l y f o r . s u c h u s e r s o r i n r e s p o n s e t o a r e q u e s t from t h e l i b r a r y
o f a n y o t h e r u n i v e r s i t y , o r o t h e r e d u c a t i o n a l i n s t i t u t i o n , on i t s own
b e h a l f o r f o r one of i t s u s e r s . I f u r t h e r a g r e e t h a t p e r m i s s i o n f o r
m u l t i p l e copy ing of t h i s t h e s i s f o r s c h o l a r l y pu rposes may be g r a n t e d
b y me o r t h e Dean of Gradua te S t u d i e s . It i s u n d e r s t o o d t h a t c o p y i n g
o r p u b l i c a t i o n of t h i s t h e s i s f o r f i n a n c i a l g a i n s h a l l n o t b e a l l o w e d
w i t h o u t my w r i t t e n p e r m i s s i o n ,
T i t l e o f T h e s i s / ~ i s s e r t a t i o n :
A u t h o r :
( s i g n a t u r e )
(name )
J ( d a t e )

ABSTRACT
An investigation was carried out to determine the effects of a moderate dose of alcohol on the process of planning and execution of a voluntary movement. In the first experiment, twelve male subjects participated in simple, two, and four choice reaction time tasks. Each subject was given an initial block of sixty practice trials prior to being tested in counterbalanced alcohol and placebo conditions. The alcohol dose consisted of 2.2 milliliters per kilogram body weight of 40 percent vodka. Testing began one hour after alcohol consumption.
A 2 x 3 way repeated measure analysis of variance (ANOVA) indicated that the absolute reaction time means increased in the alcohol condition (p c .05) as compared to the placebo. The results are discussed in terms of one aspect of the information processing theory (Sternberg, 1969) and are consistent with the notion that alcohol slows the rate of "information processing".
The same 12 subjects performed a second experiment which employed the same alcohol conditions. In this experiment the precue technique was utilized as a means to consider further the results of the first experiment and to investigate the nature of movement preparation. It is known that advance information relating to an upcoming movement improves reaction time for making that movement. There has been considerable work utilizing behavioural paradigms, however, investigations examining the effects of alcohol on the preparation process have been sparse. Three different conditions, relating to the amount of prior information were employed: complete information, partial information and no information on the upcoming movement. The results indicated that subjects, when under the influence of alcohol (mean = 69.31 mg%) are not effectively able to use the advance information when compared to the placebo condition. Some practical implications of the results are discussed.
i i i

ACKNOWLEDGEMENTS
I am grateful to Dr. David Goodman for his ideas and constructive criticism all through the study and to other members of the thesis committee for their guidance and practical advice throughout.
My particular thanks Dale Parkyn, Rob Maskell, George Mah and Paul Nagelkerke for their expertise. I also wish to thank the "Steele Fundn for providing financial support for the course of this study.
I wish to express my sincere thanks to Joseph Laflamme for his help, understanding and advice at every stage of this study. Thanks also to Richard Carson for his help.

DEDICATION
This is dedicated to my parents, whose celtic spirit and gaelic ways,
love, support, constant encouragement, curiosity, practicality, and persistence
shaped this effort.
"There is a principle which is a bar against all information, which is proof
against all arguments and which cannot fail to keep a man in everlasting
ignorance ...... that principle is 'contempt prior to investigation' ".
Herbert Spencer

TABLE OF CONTENTS
APPROVAL ABSTRACT ACKNOWLEDGMENT LlST OF TABLES LlST OF FIGURES
I. INTRODUCTION Statement of the problem Hypothesis Significance of the study
11. REVIEW OF LITERATURE Information Processing Model Precue Studies Alcohol Studies -
Ill. MATERIAL AND METHOD (EXPERIMENT 1) Subjects Apparatus Experimental Procedure Design Task Beverage Experimental Conditions
IV. RESULTS Blood Alcohol Concentration Reaction Time Analysis Movement Time Analysis Error Analysis
i i iii i v i x X

ATERIAL AND METHOD (EXPERIMENT 2) Subjects Apparatus Experimental Procedure Design Task Beverage Experimental Conditions
VI. RESULTS Blood Alcohol Concentration Reaction Time Analysis Movement Time Analysis Error Analysis
VII. GENERAL DISCUSSION 72
VIII. SUMMARY AND CONCLUSIONS 83
APPENDIX 86 Appendix A. Subject Consent Form Appendix B. Listing of Control Program 87 Appendix C. Subject Information Sheet (Experiment 1) 99
Appendix D. Demographic Information and Medical History 100 Appendix E. Pilot Work 102 Appendix F. Subject Height, Weight, and Dosage Chart 104 Appendix G. Collection, Storage, and Analysis of Blood Samples 105 Appendix H. Subject Information Sheet (Experiment 2) 1 06 Appendix I. ANOVA TABLES (Experiment 1 and 2) 108
REFERENCES 119

LIST OF TABLES
TABLE PAGE
4.1 Blood alcohol levels obtained during the experiment
4.2 Mean reaction time values in the placebo and alcohol condition
4.3 Mean reaction time differences among reaction time conditions
4.4 Mean movement time values in the placebo and alcohol condition
4.5 Mean movement time differences among reaction time conditions
4.6 Percentage errors in the placebo and alcohol condition
4.7 Percentage difference in the placebo and alcohol condition
6.1 Blood alcohol levels obtained during the experiment
6.2 Mean reaction time values in the placebo and alcohol condition
6.3 Mean reaction time differences among precue conditions
6.4 Mean reaction time in the partial precue condition
6.5 Mean movement time values in the placebo and alcohol condition
6.6 Mean movement time in the partial precue condition
6.7 Percentage errors in the placebo and alcohol condition

LIST OF FIGURES
FIGURE
3.1 Schematic diagram of the apparatus used in the experiment
3.2 Duration of events in a typical trial
4.1 Mean blood alcohol levels obtained during the experiment
4.2 Reaction time plotted as a function of uncertainty
4.3 Mean movement time for alcohol and placebo conditions
4.4 Average number of errors in placebo and alcohol conditions
5.1 Schematic diagram of the apparatus used in the experiment
5.2 Duration of events in a typical trial
6.1 Mean blood alcohol levels obtained during the experiment
6.2 Mean reaction time for alcohol and placebo conditions
6.3 Reaction time plotted as a function of uncertainty
6.4 Mean movement time for alcohol and placebo conditions
PAGE

CHAPTER l
INTRODUCTION
The debilitating effects of alcohol on motor performance are well researched and documented, yet the processes are still not fully understood, nor are the findings entirely consistent. What does emerge, however, as a general pattern is that a moderate dose of alcohol can produce impaired performance in a wide range of perceptual and psychomotor tasks. The decrease in speed of movement initiation with alcohol intake is a consistent finding (Clayton, 1980). This has been shown in both simple and choice reaction time paradigms. Alcohol related effects are also observed when considering stimulus-response compatibility and speed-accuracy relations hips (Rundell and Williams, 1979). Given these well known effects, it is of little surprise that much of the research on the effects of alcohol on motor performance is motivated by a concern for vehicular driving behaviour.
Over thirty years ago, Bjerver and Goldberg (1950) demonstrated that alcohol dose of 0.5 - 0.6 grams per kilogram body weight was sufficient to impair driving skills. Drew, Colquhoun and Long (1958) have shown performance decrements in skills similar to driving with blood alcohol concentrations as low as 20 - 30 milligrams per 100 milliliters of blood. In his recent review, Clayton (1980) concluded that impairment of performance on driving tasks or driving related skills was detectable at blood alcohol concentrations as low as 40 - 50 milligrams per 100 milliliters. While the behavioral research has produced voluminous amounts of descriptive details on response slowing with alcohol, there has been only a limited effort to link these deficits with motor processes. While a considerable amount of research has been conducted to document the negative effects of alcohol on driving, it is probably fair to say that the majority of it is motivated by the link between alcohol consumption and automobile accidents; e.g., Greenberg, 1968; Kahneman et al, 1973; Linnoila et al, 1973; Mitchell, 1985; Mihal et al, 1976; Moskowitz, 1973; Shillito et al, 1974; Shinar, 1978; Vogel, 1958.
Despite this research effort, there are still major gaps in our understanding of both the mechanisms and the effects of alcohol on human
performance. Particularly lacking are studies concerned with the interactive effects of alcohol in combination with information processing, in particular with respect to the stages which may be most vulnerable to the effect. This has been in spite of considerable methodological advances in the literature on human performance, in particular information processing, in the period since the first "subtractivew procedures of Donders in 1869. Sternberg's (1 969) suggestion of a methodology for studying processing stages using an additive factors approach has met with some success. One can thus look at the independent and conjoint effects of a number of manipulations on reaction time. The present research is an attempt to fill some of the those gaps by examining the effects of alcohol on an individual's ability to process information selectively.
An enduring problem in motor control and learning is to understand the mechanisms by which we prepare for an action. Since the growth of an information-processing perspective in psychology, cognitive psychologists have developed an increasingly rich conception of the mental operations that take place between the presentation of the stimulus and the subsequent production of a response. In the first of the two experiments, reported here, Sternberg's additive analysis was utilized to study the information processing stages. According to this model, there is a series of processes that lead from a stimulus to a response, and no new process can start until the one before it is completely finished. Thus, the process that prepares the physical response must wait for all the preceding processes to be completed.
Within this information processing framework, the effects of alcohol on planning a voluntary movement have been studied in an attempt to determine the influence of alcohol consumption on speed of producing a response. It has been assumed that alcohol induces performance decrements in tasks requiring coordination of sensory input and motor output. Diverse measures have been used in tests of this assumption, differing in the specific sensory modalities and motor skills required, as well as the complexity of the task. One popular measure, reaction time, taps the maximal speed of response to a signal. Reaction time tasks may be classified according to whether the required response is always made to a single signal (simple reaction time) or whether different responses are required depending on which of two or more stimuli are present (choice or complex reaction time).

In recent years, a new technique introduced by Rosenbaum (1980) has become very popular and widely employed as a means to study motor programming. The movement precuing technique, which is an extension of the partial advance information paradigm of Leonard (1958), is designed to reveal the major information-processing steps that lead to the execution of voluntary movements. Information about some of the defining characteristics is presented to the subject in advance of the movement and then one observes how long it takes the subject to perform the response when the imperative stimulus to move is presented (Rosenbaum, 1980). Manipulating the amount or type of advance information allows one to examine the motor programming processes in greater depth.
In the experiments to be described, a partial advance information paradigm that utilizes precues about the upcoming movement was applied to forward and backward movements of the right and left arm. The precues and the stimulus were presented such that there was compatible stimulus-response mapping. Reaction times obtained were analyzed when precues gave no information, partial information or complete information about the upcoming movement parameters.
Advance information of an upcoming movement is known to improve reaction time for making that movement. What is not yet clearly understood is the nature of the movement preparation process. Considerable work has been carried out in a behavioral paradigm (Goodman & Kelso, 1980; Rosenbaum, 1980) but only a few investigators have examined how alcohol affects the movement preparation process.
In general, preparatory processes are viewed as facilitating performance by reducing reaction time and increasing accuracy when performing a task for which preparations are made. There are many different procedures that can be used to induce preparatory states and processes, for example instructions, priming, precues, probability biases, and sequencing events. The actual operation of preparatory processes can be inferred, either from overt behavioral aspects of performance such as reaction time, movement time, and accuracy measures or from the intercepted aspects of performance that involve more

physiological measures (EMG, EEG, etc.,). In the second experiment of the present study, the behavioural technique is used to investigate the time course and possible mechanisms of preparatory processes using the precue technique.
The proposed investigation is concerned with the ability to use advance information in planning and executing a task. In particular, the 'precue' paradigm is incorporated in order to determine if the general slowing with alcohol which has been frequently observed could be partially explained by demonstrating an inability to use advance information effectively.
HYPOTHESIS
The general purpose of the investigation was to examine alcohol effects from the perspective of an information processing model (Sternberg's additive factor model), determine whether alcohol slows the rate at which information is processed by the brain, and provide some indication of the locus of the effect of alcohol within the processing sequence. The first study was undertaken to confirm earlier findings that alcohol influences the more central (cognitive) rather than the more peripheral (sensation and response execution) aspects of information processing (Huntley, 1972; Moskowitz, 1973). The first study further explored whether simple and complex functions are differentially affected by moderate doses of alcohol.
Before the influence of alcohol upon the central processes could be examined, it was imperative to demonstrate that the time taken by these processes increases with stimulus-response uncertainty; i.e., as the stimulus- response uncertainty increases, the reaction time should also increase. Alcohol, which is a central nervous system depressant, has previously been shown to cause a further increase in the reaction time as the stimulus-response possibilities are increased compared to a placebo condition (Huntley, 1972; Bradshaw, 1970; Carpenter, 1959; Moskowitz, 1971 ).
The following research hypotheses were examined in this study.
Hypothesis 1 : Reaction time will be shortest in the simple reaction condition, next
shortest in the two choice reaction time, and longest in the four choice reaction time condition.
SRT < 2CRT < 4CRT
where: SRT is simple reaction time, 2CRT is two choice reaction time and 4CRT is four choice reaction time.
Hypothesis 2: This increase in reaction time with an increasing number of stimulus-
response conditions will be greater in the alcohol than in the placebo condition.
where: RTA is reaction time when under the influence of alcohol, RTp is
reaction time in placebo condition. -
Rationale: Previous studies examining the relation between reactibn time and the number of stimulus-response possibilities have shown that as the number of stimulus-response alternative increases, the reaction time also increases (Bartz, 1971 ; Brainard et al, 1962; Hick, 1952; Lamb et al, 1965; Morin, 1962). Studies conducted by Bradshaw (1 WO), Huntley (1 972), Moskowitz and Burns (1971), have further demonstrated that the effects of alcohol become greater as stimulus-response alternatives increase.
Hypothesis 3: Subjects will be able to use partial advance information of an upcoming
movement in planning of the movement as indicated by a reduced reaction time to the imperative stimulus. When complete information is given, the reaction time is expected to be the shortest, followed by the partial precue condition. In the condition in which no precue is given, the reaction time is expected to be the longest.

where: RTc is reaction time in complete precue condition, RTp is reaction timein partial precue condition, and RTN is the reaction time in no precue
condition.
Hypothesis 4: Subjects under the influence of alcohol will not be able to use the
advance information in planning of the movement to the same extent as when not under the influence of alcohol. This will be indicated by increased reaction time compared to a placebo condition.
RTpA > RTpP
where: RTpA in reaction time in the precued alcohol condition, RTpP is reaction time in the precued placebo condition.
Rationale: Previous studies (Bishop-and Harrison, 1983; Goodman and Kelso, 1980; Reeve and Proctor, 1984; Rosenbaum, 1980; Zelaznik and Hahn, 1985) have shown that the subjects are able to use advance information as indicated by a reduction in reaction time. After alcohol consumption the amount of information processed is reduced (Huntley, 1972; Moskowitz, 1971) and therefore subjects under the influence of alcohol will not be able to effectively use advance information.
Hypothesis 5: Movement time is expected to be equal in both the alcohol and placebo
condition. Once the decision is made, the movement time should not be altered with alcohol and with increase in stimulus-response alternatives.
MTA = MTp
where: MTA is movement time in alcohol condition, MTp is movement time in
placebo condition.

Rationale: Chiles and Jennings (1 970) reported that alcohol had no effect on movement time. While Wood and Reeve (1984) and Stelmach (1987) found no effect of precue on movement time.
Hypothesis 6: The number of errors will be greater in alcohol than in the placebo
condition.
ERRORS A > ERRORS p
where: ERRORSA is errors when under the influence of alcohol and ERRORSp
is errors in placebo condition.
Rationale: A number of studies (Carpenter, 1962; Huntley, 1972; Linnoila, 1973; Ross and Pihl, 1985) have reported that after alcohol consumption the number of errors increased as compared to the placebo condition.
The hypotheses were tested by comparison of the reaction time, movement time and number of errors with alcohol and placebo condition. A 3 X 2 repeated measure ANOVA was utilized to analyze the descriptive statistics for the variables measured. Where appropriate, Tukey's HSD procedure was used to locate the source of significant differences. For all main effects and interactions, an alpha level of 0.05 was adopted.
SIGNIFICANCE OF THE STUDY
In order to understand the nature of movement preparation and the use of advance information in preparation of movement it is necessary to establish testable theories. One such theory of information processing and precue information proposed by Rosenbaum. The study will provide some preliminary information concerning the nature of movement preparation. Reaction time will increase in alcohol compared to the placebo condition. When advance information is given to the subject the reaction time will be faster. After alcohol consumption the subjects will not be able to effectively use advance information.

CHAPTER ll
REVIEW OF LITERATURE
Introduction:
The review of literature is divided into three sections. The first section provides an overview of the information processing model considered in this experiment. In the second section, precue studies are reviewed. The last section deals with the effects of alcohol.
Information Processing Model
Human functioning in the environment can be conceptualized and studied in many ways. One of the most popular ways is based on the fundamental notion that humans are processors of information. It is assumed that information is available in the environment, that the individual accepts the information into various storage systems called memory, and that the information is processed. The term processed means that the information is coded, its code can be changed from one form to another, the information may be combined with other information, etc. (Schmidt, 1978).
This information processing model of functioning begins with the input of information from the environment through one or more of the sense organs, and considers what happens to this signal once inside the system. This information is processed in various ways until eventually the output is observable as motor activity. The most common approach is to consider the temporal aspects of information processing, concentrating on the duration of the various processes. This basic chronometric approach (Posner, 1978), makes heavy use of the reaction time measure. This method is popular, as reaction time is a very simple measure in experimental settings and it is a sensitive measure of the group of individual event durations that occur between the presentation of a stimulus and the evocation of a response.
Although the notion that these are separate stages or processes between a stimulus and response has been popularized by the cognitive-psychological
viewpoint, the notion of stages of processing is quite old. For over a century, reaction time methods have become increasingly popular in the analysis of human information processing since their early application by the Dutch physiologist, Donders, in 1868. He assumed that total response latency is composed of a number of successive, partially independent processes, with the time for each process being additive. The subtraction method involves comparing the reaction times from two different tasks, the difference between the time for the two tasks being a measure of the time taken for the processes involved in one task which were not part of the other task. It is assumed that the task with the longer reaction time requires all the processes of the other, plus some additional process. Donders took the difference between simple reaction time and choice reaction time and assumed it to be the time required to discriminate the stimulus and choose the correct response. Initially, his results were encouraging. However, around the turn of the century, part of his work was attacked and to a great extent discredited due to lack of empirical support. The main criticism was due to the fact that introspective data suggested, that it might be difficult to devise experimental tasks that would add or delete one of the stages between stimulus and response without altering other stages. In the last few years there has been a renewed interest in reaction time and information processing, and it is now perhaps the most researched topic in the field of motor behaviour.
An extension of the subtraction method of Donders, the additive factor method, led to a revitalization in the use of reaction time to study human performance (Sternberg, 1966). The basic idea is that one can choose factors that will affect the durations of mental processes to aid in understanding the motor preparation process and the prestructuring of commands to the musculature prior to the initiation of movement (Keele, 1968, 1980; Klapp, 1977). The additive factor method was introduced by Sternberg (1969), for using reaction time measurements to study stages of information processing. This method overcomes the limitations of Donders subtraction method, and permits the discovery of stages, assessment of their properties and separate testing of the additivity, a result that is relevant to the formulation of mathematical models of reaction time.

The additive factor method opens up new possibilities for inferring the organization of mental operations from reaction time data without requiring procedures to add or delete stages. Unlike Donders method, it does not lead to the measurement of stage durations, but it can be used to help establish the existence and properties of stages, and the relations among them.
According to Sternberg's theory, the time between stimulus and response is occupied by exhaustive serial comparison processes. In the additive factor method, one can study stages of processing between the stimulus and response, without inserting or deleting hypothesized stages but by changing their durations. This method has its limitations as well. It leads to the decomposition of a set of stages but it cannot decompose reaction time itself and the absolute durations of the stages discovered are not determined. This method cannot give the order of a set of stages it distinguishes but it can presuppose the existence of processing stages, and by exposing their relations to experimental factors, help to ascertain their properties. Its power stems from the fundamental significance of additivity, which in turn depends on the existence in reaction time experiments of a basic measure, that of physical time.
Stages of Information Processing:
Several models of information processing postulate a sequence of distinct processes or stages which intervene between presentation of a stimulus and initiation of a response (Norman, 1970; Smith, 1968; Sternberg, 1969). The overall duration of a stage is more difficult to study and of less interest than whether there is such a stage, what influences it, what it accomplishes and what its relation is to other stages. A typical sequence of such hypothetical stages adopted from Sternberg's (1 969) model are:
1. Stimulus identification stage: The subject must acknowledge that a stimulus has occurred and identify
it. This stage is further subdivided by Posner (1973) and Sternberg (1968) into stimulus encoding; i.e., transforming the stimulus from physical to biological codes and stimulus identification is involved in identifying it.

The variables that affect the stimulus identification stage relate to the nature of the stimulus that is presented for example, stimulus clarity and stimulus intensity and also an ability to extract patterns of movement from the environment.
2. Response selection stage: After a stimulus has been identified, the subject must decide what
response to make. The decision can be to do one of a number of actions, or the stimulus can be ignored in favour of no action at all. The factors that affect this stage are stimulus-response compatibility and the effect of practice.
3. Response programming stage: After the stimulus has been identified, and the proper response has been
selected, the system must ready itself for the appropriate action and must initiate that action. After response selection, the task is to translate this abstract idea of a response into a set of muscular actions that will achieve it. Response complexity affects this stage.
- -
Boyka (1964) made an extensive review on experimental variables which affect reaction time. His review delved into the type of stimulus used: auditory, visual or tactile; the intensity of the stimulus; the effect of alcohol, drugs and lack of sleep, the effect of varying foreperiods; the effect of repeated stimuli; the effect of choice (number of alternatives); the effect of age and the effect of instructions on reaction time. Recently such variables as stimulus-response compatibility, motivation, fatigue, anxiety, and i nter-trial interval have been shown to be important. There is an obvious inter-dependence between the variables cited and the interested reader is directed to Welford (1976) for a thorough discussion of many of these variables affecting reaction time. This portion of the review will focus on a single variable: the number of stimulus- response alternatives.
It is now well known that reaction time is a monotonically increasing function of the number of stimulus-response alternatives. An important insight into the problem of why reaction time rises with degree of choice was made by Hick (1952), who proposed that, when making choices, subjects resolve uncertainty or gain "information" at a constant rate. Hick based his view on the

analysis of two sets of experimental data, his own and those of Merkel (1885). In these experiments there were, in different trials, from 1 to 10 alternative signals, each responded to by pressing a different key. Hick (1 952) proposed a model which indicated that reaction time is a linearly increasing function with log2 of the number of equiprobable alternatives. In several experiments, using thousands of trials, Hick found the familiar relationship between reaction time and stimulus uncertainty holds good.
The study of Hick (1 952) along with that of Hyman (1 953), demonstrated that the relationship holds good when the stimulus uncertainty is manipulated by varying the number of alternatives. The formal relation that has come to be known as "Hick's Law" states that the choice reaction time is linearly related to the log2 of the number of stimulus alternatives. In equation form, it is stated as follows:
Choice RT = a + b [ Log2 (N) ]
where N is the number of stimulus-response alternatives and a and b are empirical constants.
The reason that this relationship holds true, appears to be due to the fact that when selecting a response, a subject makes a series of subdecisions which progressively select, first, a broad group of responses such as those by one hand as opposed to the other, and then smaller groups until a single response is chosen. Several different strategies are possible in making this series of subdecisions, some more efficient than others. The strategy employed is affected by the arrangement of the display and can be to some extent varied at will. The time taken to make subdecisions can be calculated, and reaction times can be predicted in certain circumstances with remarkable precision.
The rise of choice reaction time with degree of choice is greater when the relationship between the signal and response is complex than when the it is straightforward; presumably complexity implies additional work by the translation mechanism. When relationships between signal and response are extremely direct, as when signals are tactile stimuli to responding fingers, there may be hardly any rise of reaction time with increase in the degree of choice.
The same occurs with familiar couplings such as speaking names of digits or letters seen visually (Welford, 1976). In this case, a direct connection between signal and response appears to develop which avoids the normal calculations made in the translation mechanism.
In the Hick-Hyman relation, the intercept (a) is that value of reaction time associated with log2N that equals zero or when the line crosses the reaction time axis. The intercept of the Hick's Law curve is a measure of the overall "speed" of the motor system exclusive of any time required for decision about the response to make.
The slope (b) is a measure of the amount of inclination of the line, the amount of increase in choice reaction time as log2N is increased by one unit (1 bit). The slope is the "speed" of decision making by the response-selection stage of processing. The slope and intercept measure two different underlying processes in human performance.
A number of studies are reported in the literature, utilizing information processing theory and the effect of alcohol. The rate of central processing, as affected by alcohol has been studied by Moskowitz and Burns (1971) in a study of the psychological refractory period. An alcohol dose of 0.69 gramslkilogram body weight significantly increased refractory period, suggesting that the alcohol slowed central processes. An experiment by Moskowitz and Roth (1971) examined the effects of alcohol on the task of naming a visually presented object. The alcohol dose of 0.52 gmlkg body weight was smaller but the increased latency of response was larger than that of Moskowitz and Burn's study. It is thought that the larger effect of alcohol is due to the greater complexity involved in retrieving the name of an object, as compared to a key press reaction time in the Moskowitz and Burns study.
Huntley (1972) examined the effect of a 0.97 gmlkg body weight dose of alcohol on the time to locate a projected dot in a cell matrix. There were several possible cells varying from 1 to 3 bits of stimulus uncertainty. They found that the reaction time increased with increase in stimulus-response uncertai nity. The effect was greater after alcohol consumption.

Galarneau and Krenek (1971) as reported by Moskowitz (1973), examined reaction time in situations involving several levels of stimulus and response uncertainity. Subjects were examined under 0.00%, 0.04% and 0.08% BAC's. While simple reaction time was essentially unaffected by alcohol, there was an increasingly greater effect on reaction time by alcohol as the stimulus and response uncertainty increased.
On the other hand, Moskowitz and Burn (1 971 ) also examined reaction times to a highly compatible stimulus-response series, using 0.69 gmlkg body weight. Alcohol significantly increased reaction time, but in an information theoretic analysis, the only interaction between alcohol and information load occurred between the condition of no uncertainty and any of the five levels of stimulus uncertainty. The alcohol effect was no larger with five bits of information than with, for example, two bits of information. This apparent contradiction can be partially explained by the fact that the subjects in Moskowitz et al experiments were very familiar with the task and the task was easier as compared to Galarneau and Krenek (1 971 ).

PRECUE STUDIES
For over two decades, motor behaviorists have been trying to understand the processes that underlie programming and the subsequent execution of voluntary movements. The human motor system takes time to react after the presentation of a stimulus. As indicated previously, this reaction time depends on stimulus response properties, and on subject factors such as preparedness, information processing capacity, etc.. Reaction time plays a decisive role in circumstances where responses have to coincide with the external events and/or in task situations in which the spatial-temporal characteristics of the target are continuously changing.
Fitts and Seeger (1953) demonstrated that the time to respond to a particular stimulus depends not only on the properties of the set of stimuli or the properties of the set of responses but also on the relation between the two. Responses are faster and more accurate if the left and right stimulus-response locations are assigned to the left and right response locations respectively, than if the alignment is reversed (Brebner, 1973). In general, responses are faster when the stimulus location corresponds to the location of the correct response (Simon, 1969).
When a rapid, goal directed action is to be performed, the necessary motor programs are thought to be structured and organized before the movement actually begins (Keele, 1968). One of the fundamental concerns has been to understand how a motor program is constructed. A widely adopted experimental approach has been to vary the nature of the response parameters (e.g., arm of movement, direction of movement, extent of movement) that are likely to be contained in a motor program (Klapp, 1977; Klapp and Erwin, 1976). The underlying assumption is that programming time, as indexed by reaction time, will be a direct function of the response parameter(s) included in the task (Henry, 1981) and that the programming process is decomposable into separate operations, each having a measurable duration (Requin et al 1984).
Experimental studies have shown that providing advance information to an individual results in an increase in the performance level as indicated by

decreased reaction time of the actual action (Goodman and Kelso, 1980; Hendrikx, 1986; Rosenbaum, 1980; Sudevan, 1987). From the analysis of the relationship in the different precue conditions, inferences can be drawn about the changes that advance information triggers in the functional state of the processing systems which are presumably responsible for this intended action.
In 1980, Rosenbaum introduced a modification in the partial advance information procedure originally developed by Leonard (1958) and used subsequently by Shaffer (1966) and Kantowitz and Sanders (1972). Termed the movement "precuing" method, it differs from the partial advance information procedure, in that it has more data analytic elaboration and a greater emphasis on motor preparation. Its use provides another tool for examining the motorial decisions underlying the programming process (Goodman and Kelso, 1980; Rosenbaum, 1980) and the examination of those mental operations which are antecedent to movement itself (Stelmach and Diggles, 1982). The movement precuing technique has so far been used to investigate the selection of manual responses differing with respect to arm, direction, and extent (Dixon and Just, 1980; Goodman and Kelso, 1980; Rosenbaum, 1980) direction and extent only (Larish, 1980), direction, extent and duration (McCracken, 1979), and finger and hand (Miller, 1982; Reeve and Proctor, 1982). The method has also been applied to the study of reflex modulation prior to leg movements (Requin, 1980) and decisions concerning the side of the body (right or left), limb (arm or leg), and direction (forward and backward) of simple and ballistic movements (Rosenbaum, 1978).
The movement precuing technique is designed to reveal the major information processing steps that lead to the execution of voluntary movements. The unique feature of the technique is that it allows some assessment of the relative time costs of specifying different underlying dimensions of movement, unconfounded by differences in the movements themselves (Stelmach et al, 1986). The main goal of the technique is to supply the subjects with partial information about the defining characteristics of a motor response and then observe how long it takes the subject to perform the response when its corresponding reaction signal is presented. The fundamental assumption is that one can preprogram the parameter(s) specified by the precue and that the motorial decisions associated with unspecified movement parameters are

completed only after a reaction signal has been presented. Therefore, the response latency primarily reflects the motorial programming time of any parameters remaining unspecified prior to the reaction signal. In addition, the precue leads to a reduction in the number of stimulus alternatives and therefore could also influence reaction time (Zelaznik, 1978).
In the precuing method, prior to the arrival of the imperative stimulus, the subject receives a cue, which conveys information concerning the to-be- produced response. This cue can provide partial or full information about the motor act. Full information about the upcoming response makes the response completely certain and is then a simple reaction time task. The theoretically interesting situations are when certain features of the movement are known in advance, but others must be specified after the imperative stimulus. From a detailed analysis of the set of reaction times observed, Rosenbaum concluded that each movement dimension is independently specified, specification times differ as a function of the dimensions considered, and specification operations occur serially, but without a strict order.
--
In Rosenbaum's studies (1980), subjects performed, without visual control, pointing movements towards targets whose spatial location could be described by combining three binary spatial dimensions: the arm to be moved, the direction of movement and the extent of movement. The imperative signal was formed by the presentation of a colored dot on a display panel, with a one- to-one mapping of colors to targets. Before reacting, a precue supplied the subject with information about either 0, 1, 2 or 3 movement dimensions. It was formed by a set of either 1, 2 or 3 letters, each indicating the value that each precued dimension had, and was changed to a cross symbol when the corresponding dimension was not precued.
Goodman and Kelso (1980) and Stelmach and Larish (1981) have criticized the technique used by Rosenbaum in which the mapping of stimuli to responses was not "natural" and it possesses a substantial cognitive-motor translation process. Rosenbaum used letters to precue the subjects, and previously learned color-coded labels were signals to respond, raising the possibility that translation (verbal code to position code) processes (Greenwald, 1970; Fitts and Seeger, 1953; Teichner and Krebs, 1974) may have influenced

the produced reaction times. Instances in which the reaction stimulus and its associated response are indirect and relatively unpracticed, non motor, cognitive processes (stimulus-response translations) make an unavoidable and significant contribution to reaction time. To overcome this potential problem, Goodman and Kelso (1980) and Stelmach and Larish (1981) visually precued the subjects directly with compatible stimulus-response mapping, thus minimizing the translation processes required to execute a response. These studies found that although the reaction times decreased as a function of the number of parameters precued, there were no systematic effects of precuing on arm and direction parameters.
In addition to showing that such a translation process can increase mean reaction time up to 40 %, Goodman and Kelso (1980) and Larish (1986) demonstrated that the programming relationships between arm, direction, and extent of movement can be masked by the recording process. A similar problem may also underlie the findings reported by Kerr (1976) and Megaw (1972). Conclusions about the program characteristics of direction and extent of movement were based on compakons between spatially compatible and spatially incompatible conditions. In Kerr's study, the inconsistent results may have also occurred because the reaction time data were often confounded by tradeoffs in speed and accuracy and movement time.
However, Bonnet, Requin and Stelmach (1982), using a spatially "compatible" stimulus-response code with an experimental set in which display panels for stimuli and for targets were spatially isomorphous, collected data leading to conclusions quite similar to Rosenbaum's. The crucial problem raised by the generality, and even the reality of a parametric specification model of movement programming, thus remains unresolved.
Klapp (1977) utilized the precue technique to examine the organization of the digit selection and response timing processes in a key press task. In this experiment the duration of the upcoming key press was cued in half of the trials and not cued in the other half. The "dah" key press exhibited a longer reaction time than the "dit". When the digit was not cued reaction time was longer than when digit was cued, and these two factors interacted in an underadditive

fashion. Based upon these results, Klapp, concluded that the response timing and digit selection processes were organized in parallel.
The interpretations of the Klapp (1977) and Rosenbaum (1980) experiments are weakened by a methodological difficulty. Although the precue technique was designed to examine characteristics of response programming after the cognitive (nonmotor) decisions have been made, there is reason to question whether Rosenbaum's (1980) initial experiment satisfied this fundamental experimental assumption.
Differential effects of movement precuing have been obtained by Miller (1982), using two orthogonal parameters (i.e., hand and finger) that specified four distinct finger movements. Any two out of four possible responses were precued. At short intervals (i.e., less than one second), precuing was beneficial when the precued responses were on the same hand, whereas the precuing of fingers from different hands was not beneficial. Miller (1 982) concluded that precuing differentially facilitates motor processes because programming is hierarchical, that is, in programming-responses, movement parameters related to which hand to use should always be specified before other aspects of the responses from different hands. This conclusion was challenged by Reeve and Proctor (1 984), who showed that this 'same-hand advantage' depends on particular spatial properties of the precuing signals and not on an ability to program same-hand responses more rapidly: a similar precuing advantage could be obtained for different-hand responses by changing the signal- response mapping. Reeve and Proctor therefore concluded that the differential precuing effects did not reflect motor programming but could be explained as differential facilitation of non-motor, decisional processes which depend on the spatial characteristics of the precuing signals, that is, on cue compatibility.
Recently, Larish and Frekany (1985) and Larish (1986) re-examined the programming relationships among arm, direction, and extent via a spatially compatible stimulus-response ensemble, and further modified the precue task to preclude perceptual and decision processing attributed to differences in set size, a change suggested by Zelaznik et al (1982). Although the data from the Rosenbaum (1 980) study indicated that these parameters were programmed serially and without regard to a specific order, the results from the Larish et al
experiments showed that they were programmed in a parallel fashion. In addition, a hierarchial arrangement best characterized the relationship among the three parameters. The later finding also conflicts with one of the principal conclusions made by Rosenbaum (1980). Thus it appears that the precue method may still be a useful tool for understanding how motorial decisions are made prior to movement initiation, but only when a compatible stimulus- response ensemble is used (Larish, 1986).
Zelaznik (1 978) and Zelaznik et a1 (1 982) identified another potential source of confound when the precue method is used. As the number of precued parameters increases, the number of remaining stimulus-response alternatives decreases. For example, in the above studies when no parameters were precued, the number of possible stimulus-response pairs was eight. When, one parameter was precued, the number of stimulus-response pairs was reduced to four, when two parameters were precued, the number of stimulus-response pairs was reduced to two, and when all the three parameters were precued, the number of stimulus-responses was reduced to one. Thus, the number of parameters specified by the precue-not only changed the motor planning and preparation component of the task, but the precue information also affected other perceptual and decision-making processes associated with the number of stimulus-response alternatives, and hence produced a potential source of confound (Zelaznik, 1982).
In an impressive series of experiments Goodman and Kelso (1980) provided support for Zelaznik's argument. They observed that the manipulation of the total amount of information in the stimulus-response set, without reducing uncertainties on any movement dimension, produced the same pattern of results with respect to reduction in reaction time with increased precue information, observed by Rosenbaum. These results lend no support to a feature construction hypothesis. Moreover, by using an ambiguous precue as opposed to a movement related precue, an equivalent reduction in reaction time was observed. Goodman and Kelso (1980) argued that, under compatible conditions, movements are not constructed in parts, but rather are constructed based upon the movemen's dynamic properties, and thus the program can be viewed as a whole process.

Zelaznik and colleagues (1982), cognizant of the problems associated with the precue paradigm, attempted to devise a modified method of precuing. In this method, precues were manipulated by changing the stimulus-response mapping in a two choice reaction time paradigm. This method was able to maintain an invariant number of stimulus-response alternatives (two), but manipulated the underlying motor dimension uncertainty. Their results supported Klapp (1 977), in that the duration of the response behaves as though it can be programmed in advance when it is cued, independently of whether the digit is cued or not-cued. When the duration was not cued, it cannot program in advance, and thus one obtains the relatively reliable "dit-dah" effect (Kerr, 1979; Klapp et al, 1974; Klapp and Wyatt, 1976). This method produced a qualitative change in the nature of the task which was a serious drawback. The conditions that involved different levels of response uncertainty were between subjects, with one set of the subjects performing under one level of digit and/or duration uncertainty.
Studies have also been carried out using the advance information paradigm in elderly subjects. BotwitXck (1970), and Rabbitt (1967) have shown that older people relatively speaking do not use advance information for response planning. Moreover, Gottsdanker (1980) found that there is a marked age difference in simple reaction time when advance preparation is manipulated, and he concluded that only when preparation is easy are reaction time differences minimal. Similarly, Birren et al (1962) and Brinley (1965) observed that when movement preparation is long or when the response is complex, aging subjects show disproportionately longer reaction time. Recently, Stelmach et al (1987) supported the view that the delays commonly observed in the elderly can be supported by increased time required to specify a dimension of movement. With age there is decrease in the ability to react and move quickly. They, however, concluded that the elderly subjects are able to use the precue information, but show a slowness in using this information for response selection purposes, particularly as the amount of information increases.

ALCOHOL
The extensive use and misuse of alcoholic beverages provides a powerful incentive for acquiring accurate knowledge about this drug but also creates obstacles against such knowledge. The large amount of information available about alcohol is mingled with a great deal of misinformation, and much of the literature is distorted and burdened with an evaluative purpose, either to attack or to defend the social use of the beverage.
Although alcoholic beverages have been used in many human societies for thousands of years, nearly all the scientific knowledge about the effects of alcohol has been obtained within the past few decades. It is surprising that so little is known about the mechanisms of actions of alcohol, inspite of its widespread use. Previous accumulation of experience with alcohol effects had led to some accurate and enlightening observations, such as the famous passage in Shakespear's Macbeth (Act 2, Scene 3) in the seventeenth century, an excellent book by Magnus Huss (Alcoholisms Chronicus) in the nineteenth century. Alcohol is also referred to in Homer's Iliad, as follows,
Inflaming wine, pernicious to mankind, Unnerves the limbs and dulls the noble mind.
Included among the earlier writings there was clearly a great deal of fiction and misinformation about alcohol.
Alcohol is known to be a very potent drug with its main pharmacological action, depression, manifested on the central nervous system. It also produces tolerance and dependence, and appears to be one of the dependence-inducing drug, the consumption of which is legally sanctioned. It is now recognized that the therapeutic value of alcohol is much more limited than its social value, although it was once used as an anaesthetic (Bradley, 1980). Recently Biary et al (1985) have reported that an intravenous infusion of a 250 ml, of 10% ethanol solution decreased dystonic scores in five of the seven patients with spasmodic torticollis. They concluded that alcohol may temporarily decrease some forms of dystonia but no explanation for their results were reported.
Reviews of the empirical literature have revealed few consistent findings and many contraindications on how alcohol affects human beings. There is little doubt that alcohol affects human performance. However, little is known about which aspects of performance and what specific kinds of tasks are most and least affected and under what dosage effects begin to appear. Such information would be especially relevant in generalizing the effects of different amounts of alcohol consumption on particular task requirements: job behavior, driving, etc..
This rather confused picture, is partly associated with the unsatisfactory experimental procedures employed in many of the earlier investigations, which make it impossible to differentiate between the effects on performance related to changes in blood alcohol and concomitant effects of practice and fatigue. Clearly replication of results and confirmations of conclusions reported by independent experimenters is required. The use of controlled experiments, in which the "independent" variable (alcohol dosage) is manipulated and measured, and the effects on a "dependent" variable are assessed, has to be an essential basis for the development of authoritative knowledge about alcohol effects. This scientific method was not applied on a large scale until the early twentieth century.
Reviews of literature (Carpenter, 1962; Jellinek and McFarland, 1940; Levine et al, 1975; Parsons, 1986; Wallgren and Barry, 1970) are available to provide some leads, but they do not effectively integrate the research findings as there is a surprising dearth of agreement regarding alcohol's effects on most types of psychological processes and capacities. This is due, in part, to several characteristics of the alcohol literature which cause difficulty in any attempt at generalization or integration. The effects of alcohol depend on a number of interacting factors. Much of the reported discrepancy can undoubtedly be attributed to such methodological variables as practice, parameters of task, blood alcohol levels and level of pre-experimental skills (Carpenter, 1962). For the purpose of this review, these issues are broadly divided into three main factors: physiological and behavioral effects of alcohol, subject factors, and the experimental conditions, each of which is further subdivided and discussed below.

Alcohol
Effect of alcohol on the central nervous system:
The central nervous system is more markedly affected by alcohol than any other system of the body. The effects of alcohol on the central nervous system are associated with a wide repertoire of behavioral alterations. The magnitude of these effects vary with individual and with dose. Some persons appear to be greatly affected by alcohol, while some show little or no change. The question whether or not alcohol is a "stimulant" has long been debated. Although the predominant effect resulting from alcohol are considered to be central nervous system depression, recent research shows this to be an oversimplification. Goldberg (1 969), for instance, has developed a model which suggests that alcohol acts primarily on the reticular activating system, whereby a low dose acts as a stimulant to increase arousal, while a higher dose acts as a depressant to lower the resting level of arousal. According to Kalant (1970), it is equally clear, like other "narcotics" such as barbiturates and volatile anesthetics, alcohol often produces an initial stimulation at low concentrations. The physiological and behavioral studies supporting the notion of alcohol's biphasic action: stimulation at low concentrations and inhibition at higher concentration, have been reviewed by Jubis (1986) the main finding supporting Goldberg's (1 969) contention that, depending on the dose, alcohol has biphasic effects. Whether a stimulating or depressing effect is found also depends on the response systems being measured. Because of these complexities, it is difficult to predict whether the effect of alcohol will be depressant or stimulant. However, there seems little doubt that alcohol, like other general anesthetics, is a primary and continuous depressant of the central nervous system. The apparent stimulation most probably results from the unrestrained activity of various parts of the brain that have been freed from inhibition as a result of the depression of inhibitory control mechanisms (Ritchie, 1970).
Electrophysiological studies suggest that alcohol exerts its first depressant action upon those parts of the brain involved in the most highly integrated functions. The polysynaptic structures of the reticular activating system and certain cortical sites are particularly susceptible (Himwich and Callison, 1972). The cortex is thus released from its integrating control. As a

result, various processes related to thought may occur in a jumbled, disorganized fashion and the smooth operation of motor processes becomes disrupted. The first mental processes affected are those that depend on training and previous experience and that usually make for sobriety and self restraint. The finer grades of discrimination, memory, concentration, and insight are dulled and then lost.
Carefully performed experiments have shown that, in general, alcohol improved neither mental nor physical abilities. Although the individual may firmly believe that his performance is greatly improved, psychometric tests involving typewriting, target practice, and complicated mental problems indicate that efficiency is, in fact, decreased. Tasks requiring minimal skill, thought, and attention are less markedly affected, especially if they are mechanical in nature (Wallgren and Barry, 1970). Alcohol, however may cause some improvement in performance in special circumstances, for example, if a person's mental inhibition prevents him from carrying out a task at which he is normally skilled, moderate amounts of alcohol, by relieving the inhibitions, may allow him to function more effectively (Ritchie, 1970).
A number of factors, either singly or in- combination with others, greatly affect the physiological and behavioral changes that occur with alcohol consumption. the following is a list of the more important factors that need to be controlled when conducting research involving the administration of alcohol.
1. Type of alcohol: Alcoholic beverages are produced through a variety of natural
products. Types of beverages are distinguished on the basis of their raw materials, production process, and the technique of distillation in the case of distilled spirits. Among other differences, each type has its own rate of absorption into the bloodstream and thereby may influence performance differentially (Levine et al, 1975).
2. Dosage of alcohol consumed: Ideally, dosage should depend on the body weight of each subject, but
often it is administered as a fixed dose. Blood volume is highly correlated with body weight, and thus, in order to achieve approximately equal concentration of

alcohol in the blood of different subjects, the alcohol should be administered on the basis of body weight or body surface. An early review (Jellinek and McFarland, 1940) indicated that in 76 % of experiments conducted standard doses were given to all subjects. This is still the practice in a number of contemporary studies (e.g., Linnoila et al, 1973, 1980; Maylor et al, 1987; Moskowitz et al, 1971 ). Other studies ( Billings, et a1,1973; ldestrom et al, 1968; Ward and Lewis, 1987) have used multiple doses especially when the experimental tasks were too long.
3. Concentration of alcohol: The effect of alcohol is greater if taken in concentrated rather than in
weak solution (Egglenton,1941). No consistency was observed. While some studies have given a fixed amount of the liquid ( Shillito et al, 1974, Linnoila et al, 1980) others have diluted in the ratio anywhere from 1 :6 (Huntley, 1974), 1 :5 (Ross and Pihl, 1988; Williams, 1981) 1 :4 (Rundell et al, 1979; Sher, 1985; Tharp et al, 1974), 1 :3 (Oborne et a1,1983), 1 :2 (Collins, 1980), 1 :1 (Baloh et al, 1979; Shillito et al, 1974). Some workers have used orange juice (Huntley, 1974), grapefruit juice (Lewis et al, 1969) while others have used carbonated drinks for dilution, (Carpenter, 1968; Collins, 1980). Carbonated beverages are known to speed absorption Carpenter (1959). Some studies have mixed alcohol with a strongly flavored liquid (peppermint oil) to disguise the odor and dose of alcohol (Idestrom et al 1968). As early as 191 5, Dodge et al, criticized this procedure, pointing out particularly the fact that any substance sufficiently strong enough to disguise the taste of alcohol must itself have a pharmacological effect. The desirability of a disguised dose is apparent but such effect as "suggestion" may have had upon the experimental results cannot be great, since, in general, the magnitude of the effect varies with the amount of alcohol and with the dilution. Further, the chronaxy, the patellar tendon reflex, etc., which are not susceptible to suggestion, give corroborative results.
4. Route of administration of alcohol: The action of alcohol is proportional to the concentration of alcohol
present in the brain. It follows from the factors governing the distribution of alcohol that the intensity of action depends not only on the dose, but also very much on the route and the circumstances of administration (Wallgren and Barry, 1970). Oral administration is by far the most common way of introducing alcohol

into the body and is usually employed in experiments with human subjects. In oral administration, diffusion from the stomach is relatively slow and therefore, the main absorption occurs after the alcohol solution has passed through the pylorus into the small intestine. Administration by intravenous injection results in more uniform blood alcohol levels than does oral administration since the complications associated with uptake from the gastro-intestinal tract are circumvented (Wallgren et al, 1 970).
5. Contents in the stomach: Mallanby (191 9) and Widmark (1 933), have in extensive studies shown
that the rate of absorption from the gastro-intestinal tract is influenced by its contents. Food delays absorption, produces a slower rise and lower peak value of the blood alcohol in fed as opposed to fasting subjects. Alcoholic beverages differ in the rate of absorption because of differences in dilution and presence of other compounds in the stomach. Therefore the preferable procedure for securing reasonably uniform blood-alcohol levels after oral administration is to deprive the subjects of food until they are in the postabsorptive state, but to give access to water.
The time period for experiments on the effects of alcohol seem to vary considerably. Some studies have utilized 4 hours of fasting (Huntley, 1972; Tharp et al, 1974) while others had their subjects fasting 2 hours (Shillito et al, 1974). In some experiments, the subjects were required to fast overnight (Collins, 1980).
6. Time course of alcohol effect: Egglenton (1 941), found that perceptual-motor performance of several
subjects was more impaired during the absorption of alcohol into the blood than during the elimination at comparable blood alcohol levels. Jones et al (1972) reported that the greatest behavioral impairment is observed on the ascending limb (when the blood alcohol level is rising), where the subject must make continuous adjustments for a changing and increasing physiological phenomenon. Similarly, Ekman et al (1964), ldestrom et al (1968) reported, greater impairment of performance shortly after the ingestion of alcohol (30 to 60 minutes) with a return to baseline following repeated testing within several hours. However, it is not clear from these studies whether subjects were on the
ascending or descending limb of the blood alcohol curve. Repeated testing of subjects also makes it difficult to assess drug effects independently of practice and fatigue.
Young (1970) attempted to control practice and fatigue effects during a reaction time task by comparing subjects in an alcohol condition with their own performance during a placebo condition over the same time period. He reported that performance was poorer only on the ascending limb and was also related to blood alcohol level while performance on the descending limb was not related to blood alcohol level. But it was not possible to compare performance on the ascending with descending limb since all the subjects were not tested at the same blood alcohol level. One can only conclude from this investigation that after considerable practice, subjects perform better on the descending part of the curve. The study of Mirsky et al (1941) implied that return to normal performance after alcohol consumption is related in some fashion to the length of time alcohol is in the system rather than a change in the rate at which alcohol is removed from the tissues i.e., alcohol has a greater effect on the ascending limb as compared to the descending limb.
Studies also vary in terms of the time allowed to consume the alcohol, the time of the day alcohol was ingested, and the time allowed to pass from the beginning of drinking to the beginning of testing. These parameters are often uncontrolled and yet may markedly influence performance. Levine (1975) suggested that, the effects on performance of time between the beginning of drinking and the initiating of performance testing were marked and depend upon the abilities required by the task. The greatest impact of alcohol upon performance occurred when an hour or more was permitted to elapse between the beginning of drinking and the initiation of testing. When performance was initiated within 30 minutes of alcohol administration, the impact of alcohol appeared to be minimized, undoubtedly because the alcohol had not yet been sufficiently absorbed into the bloodstream. This was evident in tasks ranging from Bourdon test (which is a simple cancellation of letters) to stimulated driving.
The inadequacy of using a standard time interval between the dose and test is due to the fact that the central nervous system is affected not only by the

alcohol concentration in the blood but also by the rate and direction of its change.
7. Concentration of alcohol achieved in the blood: The effects of alcohol depend largely on its concentration in the body
tissues and fluids. The concentration, on the other hand, depends, everything else being a constant, on the mass of tissue and the fluids that it enters.
Although the metabolism of most drugs follows first order kinetics the metabolism of alcohol (except at very low levels) is apparently zero order, i.e., rate independent of blood alcohol levels (Jacobsen, 1952).
8. Fast versus slow drinkers: Drinking time is an important variable in alcohol studies, although the
contributions of psychological and physiological factors is not clear (Jones and Vega, 1973). In general, the slow drinkers had a slower absorption rate and a faster elimination rate than fast drinkers. They concluded from their studies that fast drinkers performed more poorly on a cognitive test and demonstrated a slower elimination rate than did slow drinkers when they drank at their own rate. Since elimination rate has been reported to be fairly constant for a given individual, it appears that the fast elimination rate of the slow drinkers probably is not related to drinking time per se but rather to individual differences in subject characteristics. Therefore, differences between between fast and slow drinkers should be considered when imposing an arbitrary time limit on alcohol consumption. The subjects, should therefore be given the same amount of time for drinking. Since absorption starts immediately after drinking, all tests and blood analysis schedules should use this as the reference rather than the cessation of drinking.
9. Acute and chronic tolerance: Pharmacologists have traditionally considered tolerance to be a form of
homeostatic or adaptive response to the presence of a drug in the body, specifically in the central nervous system (Kalant et al, 1980). The disturbing influence of the drug is presumed to be offset by compensating cellular changes which counteract the drug effect (tolerance), and which, in the absence of the drug, are revealed as a withdrawal disturbance or abstinence syndrome

opposite in direction to the original drug effect (Hug, 1971 ; Kalant et al, 1971 ). Tolerance as defined by pharmacologists refers to diminution in effect of a drug occurring with the same dose of drug that is due to previous administration of the drug. The repeated use of alcohol results in the development of tolerance, so that larger doses must be taken in order to produce the same characterteristic effects (~itchie, 1970). It is clear from studies in both animals and humans that tolerance may occur. Experimental studies have found that some degree of tolerance may even occur after a single dose of alcohol (Mitchell, 1985).
10. Diurnal effect: Endogenous variables such as diurnal variations and personality factors
affect the basal level of arousal. According to Jubis (1986), the arousal increases rapidly between 0800 to 1100 hours, rises gradually over the next nine hours, and rapidly decreases over the night. In a review by Hockey and Colquhoun (1972) it has been shown that diurnal changes in arousal affect performance on a wide range of tasks.
1 1. Blood alcohol concentration: Another important factor is the determination of blood alcohol content.
Alcohol is distributed in the body by simple diffusion. As it passes easily through biological membrane and is freely miscible with water, it eventually becomes uniformly mixed with the body water. Diffusion alone is a relatively slow process, and therefore, vascularization and blood flow are very important for the concentrations reached in various organs, particularly during the initial phases of distribution. Rate of passage from the stomach and the rate of intestinal peristalsis are important after oral administration. These phenomenon give a basis for psychogenic effects on the rate of absorption of alcohol. The least variable blood alcohol levels after oral administration are obtained if the subjects are fasted until the stomach is empty. Determination of alcohol in blood is least sensitive and specific with chemical methods. Analysis from expired air is not entirelly reliable, the reliability coefficents ranging from 97 to 99 percent but may be preferred when the disturbance of the subject must be minimized. Blood alcohol concentration is best measured directly from drawn samples (Gustafson, 1986). While a few studies have employed urine analysis (Goldberg, 1943) most have used breath samples (Collins, 1980; Jennings and

Wood, 1976) while others have used both the blood and breath analysis (Billings et al, 1973).
Subject Variables
The effect of a given dose of alcohol varies from one individual to another, and also in the same individual on different occasions. The subject factors which are important and which might produce conflicting results are:
Control conditions: Studies tend to differ in the type of control conditions used. Subjects may
be used as their own control or there may be a separate control group. The former condition often leads to results which may be confounded by practice effects while the latter condition increases inter subject variability.
Important factors concerning the subject population are often not considered by the experimenter. Such factors include sex, weight, age, and type of drinker.
1. Type of drinker: Klein and Jex (1975), found no obvious difference between scores
obtained by moderate and heavy drinkers in each blood alcohol concentration interval, but the moderate drinkers performed more poorly than the heavy drinkers, while Prag (1953) showed that abstainers have a lower consumption tolerance than either moderate or heavy drinkers. Goldberg (1 941 ) found differences on the sensory, motor and intellectual tasks between abstainers, moderate drinkers and heavy drinkers. Some investigators have not mentioned the drinking habits of their subjects and others state that they have used mixed samples. Any quantitative statement as to the effect of alcohol must be qualified relative to the drinking habits of the subject.
2. Age of subjects: Some investigators have described additive deleterious effects of age
and alcohol on human performance. The older the subjects, the more impaired they are at a given blood alcohol concentration. Moskowitz and Burns (1971),

studying effects of alcohol on psychological refractory period, found the detrimental effect of alcohol increased with age in 10 healthy men aged 21 to 40. They concluded that the speed of the central processing of information by the brain is slowed by both age and alcohol, and that the two variables have an additive deleterious effect on the rate of information processing. Verhaegen et al (1975) described an effect of age and alcohol on the rate of decision making in healthy male volunteers, aged 21 to 28, performing a 30 minute compensatory task. Synergistic effects on tracking performance of age and alcohol have been confirmed by Linnoila et a1 (1 980).
3. Weight of subjects: Apart from the large differences in actual weight of different subjects,
alcohol is more widely distributed in some than in others, since it is present in only small quantity in fatty tissue. Therefore, of two subject's of the same weight, but different shape, given the same dose of alcohol, the short fat one will show a higher concentration of blood alcohol than the lean muscular one, since the alcohol is distributed in a smaller weight of tissue (Egglenton, 1941).
4. Sex of subjects: In alcohol research, little attention has been paid to possible differences
on the effects of alcohol between males and females. Some evidence exists that the effects of alcohol on females are different from those of males (Jones and Jones, 1977) and females are more sensitive to alcohol induced deficits than are men (Linnoila et al, 1978). After alcohol consumption, females worked faster than males and made more errors. Females are more affected by instructions and pacing than males. Quicker performance of females is also reported in the literature for tasks requiring finger dexterity for fine manipulations and tasks requiring perceptual speed (Anastasi, 1958; Tyler, 1965). And this was attributed to the structure of the female hand and to greater sensitivity of the females to touch (Garai et al, 1968). However, Price (1 986) reported that females were faster and made more errors in a reaction time task. Collins (1980), on the other hand found that males tended to have better scores on tracking, reaction time and the fatigue factor. Linnoila et al (1980), concluded that females have longer reaction times than males and also have less reserve capacity in tracking skills when challenged by increased demands of a task.
5. Personality variables: The wide individual variations in performance in response to alcohol
remaining when all the above factors are taken into account have been attributed to temperamental differences, especially those differences related to extraversion-introversion. Differences along this dimension have been noted in other contexts. Extraverts have been shown to be relatively less concerned with accuracy of performance (Himmelweit, 1946), to deteriorate more rapidly during continuous work (Broadbent, 1965; Eysenck, 1957), and to be less consistent in performance (Venables, 1956). A theory postulating a greater susceptibility of extraverts to depressant drugs due to reduction of cortical control was first put forward by McDougall (1929) as reported by Wallgren et al (1970) and has been extended by Eysenck (1957). Eysenck (1967) has related the personality dimension introversion/extraversion, to performance. Introverts are believed to have higher basal arousal than extraverts. Experimental confirmation of greater susceptibility of extraverts to the depressant action of amylobarbitone sodium has been published by Shagass (1 954, 1956).
6. Expectancy concerning the effects of alcohol: As alcohol ingestion is, for most subjects, associated with expectations of
changes in psychomotor efficiency and emotional tone, it is difficult to separate the effects of autosuggestion and the "true" effects of alcohol if a double blind technique is not applied (Nash, 1962). Brown et al (1980) argue that studies that are not double blind do provide useful information.
In a recent review, Marlatt and Rohsenow (1980) have cited a number of studies in which subject's expectancies about the alcohol content of the beverage they drank were as potent as pharmacological factors in determining behavioral outcomes. The realm in which expectancy effects have been shown to predominate, however, are primarily social and affective in nature (Brown et al, 1980; Marlatt et al, 1980). In some studies, expectancy effects have not proven as potent as alcohol effects. While alcohol alone impaired pursuit motor tracking, reaction time (Vuchinich et al, 1 W8), and word recall (Miller et al, (1 978), expectancy alone only slowed reaction time. Williams et al (1 981), have demonstrated for the first time that awareness of alcohol consumption might actually result in improved, rather than impaired, task performance but no explanation for these results was given.

While Sher (1985) and Southwick et al (1981) have shown that
individuals hold rather specific expectancies for various alcohol effects, and the effect of alcohol on subjective state is highly dependent on a number of factors, including the time elapsed since beverage consumption, setting, and individual differences in alcohol expectancies.
7. Situational context in which drinking occurs: The importance of alcohol expectancies in determining a number of
effects originally thought to be direct pharmacological actions is now well established (Marlatt and Rohsenow, 1980). However, the research focus of the experimental literature to date has been on assessing the influence of beverages content (i.e., telling subjects they are consuming an alcoholic or a nonalcoholic beverage) and thereby bringing personally held expectancies resulting from these instructions to bear on their behavior. The influence of individual differences on the strength of alcohol expectancies has been largely neglected. Kalin et al, (1965), Sher (1985), have demonstrated that the situational context in which drinking occurs is an important determinant of subjective effects of alcohol.
Experimental Variables
1. Nature of the experiment: Impairment of performance due to ingestion of alcohol depends in part
on the ability requirements of the task (Levine et al, 1975). Studies are concerned with a wide variety of tasks with a wide range of dependent and independent variables. No consistent index of performance is used, making it very difficult to compare studies to one another. Alcohol has been reported to have little or no effect on simple reaction time at moderate (Carpenter, 1959) or even moderately high doses (Dengerink et al, 1978). Similar findings have been reported for complex reaction time tasks (Dengerink et al, 1978; Huntley, 1972; Moskowitz, 1973; Pearson et al, 1970; Shillito et al, 1974; Zirkle et al, 1959). Other studies have actually reported that alcohol facilitates complex reaction time performance (Carpenter, 1968 Shillito et al, 1974; Vogel, 1958; Wilkinson et al, 1968).

While, Linnoila (1973) and Moskowitz et al (1968) argue that alcohol reduces overall ability to process information, Huntley (1972) posits a specifically cognitive impairment at moderate doses, rather than a purely sensory or response execution type. He found alcohol had no effect on complex reaction time performance when the stimulus-response associations were familiar, but resulted in impairment when associations were unfamiliar and response selection became more difficult. Huntely (1972), Tharp et al (1974), Birnbaum and Parker (1 977), Weingartener and Murphy (1 977), have refined the conclusion still further in suggesting alcohol impairs response encoding rather than stimulus recognition or response execution. Further refinement of the model has been achieved by researchers who believe that degree of impairment is related to the complexity of a given task. Using an information processing model to analyze the pattern of results obtained from this class of experiment, Chiles and Jenning (1970) noted that movement time is not always affected by alcohol and postulated an alcohol-induced deterioration in a central attentional or decisional mechanism.
Complex reaction time performance, according to Teichner and Krebs (1972) "is probably the sum of a sensory lag, an energy or intensity lag, and a lag which depends on attentional, cognitive and motivational factors" (p. 357). A real controversy surrounds the issue of whether higher (i.e., cognitive- attentional) mental processes are less susceptible than lower (i.e., sensory and motor) processes to the effects of alcohol. Practice, original performance level, prior task experience and task complexity and novelty all may affect the influence of alcohol on performance. However, the above studies clearly demonstrate that while alcohol can impair a variety of motor functions and is mediated by a range of variables, the most consistent effect is impairment of a person's ability to perform a variety of tasks concurrently (Ross and Pihl, 1 985).
2. Effect of practice and fatigue: One problem in a number of experimental investigations on the effects of
alcohol consumption is the failure to control for the effects of repeated measurements, i.e., practice and fatigue. Since a small, though significant effect may be sufficient to influence a small drug effect, the minimum requirement for adequate experimentation is to be able to evaluate practice and drug effects

without mutual contamination. The "well-practiced subject" is a myth since it is impossible to know in advance how much practice makes a well-practised subject (Mowbray and Rhoades, 1 959).
The importance of the practice effect in a placebo condition in influencing subsequent performance under alcohol may contribute to the understanding of the inconsistent findings of the influence of alcohol on cognitive ability. Lewis et al (1969) "stabilized learning and practice effects" by administering the cognitive and motor tests six times at weekly intervals before testing under alcohol. They state that "a striking finding of the present study was the resistance of the cognitive and motor task performances to the deleterious effects often attributed to alcohol ingestion. The extended practice given before administration of alcohol could have stabilized test performance."
However, practice concerning the method of solution may not produce the same type of effects. Carpenter et al (1961, 1965), reported cognitive impairment following alcohol ingestion, and demonstrated the use of problem solving and memory matching but presented new problems during the alcohol condition. Both these tasks were very complex compared to most cognitive tasks used. Frankenhaeuser et al (1962) found impairment on two of four cognitive tasks.
The variable effects of practice may partially explain the inconsistent results of several state-dependent learning studies where dissociation was not found in the placebo-alcohol condition for some tasks (Storm et al, 1967; Goodwin et al, 1969). Some of the contradictory findings reported concerning the effects of alcohol on cognitive abilities may be resolved if the practice effects observed in counterbalanced designs and the potent effects of extended practice in plateau designs are considered (Jones, 1972).
Price et al (1986) reported practice effects on visuomotor coordination, Stroop, and reaction time tests and stated that the more accustomed the subjects were to a test, the less the results were affected by alcohol. In a later passage, they concluded, "one phenomenon which appears to interfere seriously with the effects of drugs is training". Tarter et al (1971) using similar tasks to those of Price (1986) concluded that after only one practice session,

alcohol did not interfere with performance competency upon subsequent testing.
3. Motivation: The pharmacological action of alcohol may be counteracted when
subjects are motivated to "act sober," either by experimenter's setting a behavioral standard of sober performance, or by manipulations aimed at forcing the subjects to take personal responsibility for their performance, instead of blaming the booze" (Critchlow, 1983).
4. Stimulus-Response characteristics: Stimulus characteristics are important determinants of reaction time.
Many experiments do not report much more than the sensory modality. Many experimenters are satisfied to report that various coloured lights were used or simply, that a light was used as a stimulus. Such characteristics as size and location of visual field are seldom considered (Gruner et al, 1953, visual stimulus at the periphery of the eyes) whether or not both eyes were used (Carpenter, 1959, one eye), room illumination, dark adaptation, duration of stimulus, etc. Some experimenters do not respect the difference between senses enough to keep observations from different modalities separate when processing and reporting results.
Response characteristics are not available in quite a few studies. In many cases only the barest statement about response characteristics is made, such as levers and pedals being operated. Whether the preferred or nonpreferred hand is used is not stated in most of the experiments.

CHAPTER Ill
MATERIALS AND METHOD
Experiment I
SUBJECTS
The subjects were 12 healthy, male volunteers ranging in age from 22 to 30 (mean 25.67) years. Only male subjects were selected, as there has been some evidence of a differential susceptibility to alcohol between genders (Jones, 1977; Price et al, 1986). All subjects had normal or corrected to normal vision. Subjects were selected on the basis that all were right handed, light to moderate social drinkers, and had no medical condition to contraindicate alcohol consumption. None of the subjects were taking any prescribed medications or were presently taking drugs of any kind. There was no history of alcohol abuse. All the procedures and conditions were explained fully to the subjects. Subjects accepted the conditions of the experiment by signing a consent form (see Appendix A) prior to experimentation. All subjects were paid for their services.
APPARATUS
The experiments were carried out in an isolated, dimly illuminated experimental chamber free of any distraction. The subject sat in a straight backed chair of adjustable height in front of a table 60 cm long, 75 cm wide and 73.5 cm high upon which the apparatus was mounted as depicted in Figure 3.1.
In front of the subject and parallel to the sagittal axis were two rows of three keys. The middle keys were designated the home keys, the upper and lower set were the target keys. Keys were mounted on a 17 cm x 28 cm rectangle mounted on a wooden platform and secured to the table. The two home keys were placed 8 cm apart and centered on the base. The four target keys were situated such that two were directly above and two were directly below each home key, at a distance of 9.5 cm from the home keys. Home keys were Unimec

VIDEO MONKOR
1 TARGETKEYS
FESPONSE PANEL
FIGURE 3.1 : Schematic diagram of the apparatus used in the experimental procedures.

Modular Push Button Switches with key cap system for Panel Mounting, requiring a force of 2.0 Newton for the switches to close. The target keys were General Purpose Push Button (Mode 44-530-0). The width of the target keys was increased by mounting a 4 cm diameter button on each one of them.
Stimulus lights corresponding to the target keys were mounted on a black square poster board, situated about 70 cm away from the subject's eyes and level with them. The lights were four red electroluminescent diodes (LED) approximately 3 mm in diameter. The lights were arranged so as to be spatially compatible with the target keys. The control program was a combination of Applesoft BASIC with 6502 machine language subroutines. An assembly language routine was used for the low level control required to achieve millisecond timing of LED display onset and offset and changes in switch status. The keys (target and home), the LEDs, and warning buzzer were interfaced with the Apple Ile microcomputer via the paddle port connector, which was installed with a Mountain Hardware Apple Clock. The computer program controlled the warning tone, stimulus lights, as well as collected responses (reaction time and movement time) with millisecond accuracy, and calculated the number and type of performance errors. All the data were stored on a floppy disk for later off-line analysis. A complete listing of the control program is provided in Appendix B.
EXPERIMENTAL PROCEDURE
On arrival for the experimental session, subjects were given an information sheet to read about the experiment to be performed (Appendix C), demographic information was collected (Appendix D), and adherence to the requested period of abstinence from food and alcohol was confirmed. That is, subjects were instructed not to ingest alcohol or any other drugs for at least 48 hours nor to eat or drink anything except water for 4 hours prior, to the experimental session. Potential subjects who failed (two subjects) to meet the established requirements were rescheduled for participation at a later date. Subjects were weighed and from this information the dosage of vodka and placebo was determined. Based on pilot work (detailed in Appendix E), a dose of 2.2 milliliters per kilogram body weight of vodka was used. This dosage resulted in

a blood alcohol concentration of approximately 80 milligram per 100 milliliters. Refer to Appendix F for the height, weight and dosage chart for all the subjects.
DESIGN
Each subject served as his own control and therefore participated in the three reaction time conditions (simple, 2-choice, 4-choice) within each of the blood alcohol levels (placebo and approximately 80 mg%). The order of beverage treatment was counterbalanced across subjects. The subjects were "blind" as to condition but the experimenter was aware of the condition (alcohol or placebo) in which the subjects were. Six subjects were randomly assigned to group I and performed in the alcohol condition on the first day and then in the placebo condition, whereas for the other six subjects the situation was reversed. There was a gap of two days between each session, thus each subject participated in two experimental sessions lasting approximately two hours each. Testing time was arranged such that all the subjects were tested at the same time of the day to control for possible diurnal effects on the rate of alcohol absorption (Chandler, 1977). Each subject was individually tested. An initial block of 60 practice trials was performed for familiarization purpose. The subjects were given a one minute rest after 20 trials and a 3 minutes rest period after 80 trials to prevent discomfort and to promote concentration throughout the period of testing. The order of presentation of the trials was constant. The testing session consisted of 80 trials of simple reaction time followed by 120 trials of 2-Choice reaction time followed by 80 trials of 4-Choice reaction time.
TASK
During testing, the subject sat in a chair at the table overlooking the LED'S. Subjects started by depressing the appropriate home key with the index fingers of each hand. The subjects were required to move to each of the target keys as soon as the target light was illuminated. The target keys on each side were depressed by the ipsilateral index finger. The contralateral finger had to be kept on its respective home key. A warning tone activated by the computer signaled the onset of each trial. Following the tone, there was a variable foreperiod (500 millisecond to 1500 millisecond) followed by the stimulus to move (dependent on the condition). The stimulus remained on until the subject responded.
Random foreperiods reduced the probability of anticipatory responses. A trial was completed when the subject completed his movement to the target keys. Following the subject's response there was one second inter-trial interval (ITI). The duration of events in a typical trial is illustrated in Figure 3.2.
On each trial, three measurements were taken: 1. Reaction Time, defined as the time between the onset of the LED and release of either of the home keys, 2. Movement Time, defined as the time between the release of either of the home key and the first depression of the target key, 3. Accuracy, where an error was defined either as (a) the release of an incorrect home key, (b) depression of an incorrect target key (wrong target key or wrong direction), (c) anticipation error (minimum reaction time was 100 msec and movement time was 50 msec) taken as denoting a false start or guessing since the reaction was probably too fast to be a response to the signal, (d) inattentiveness error (maximum reaction time was 800 msec and movement time was 600 msec) indicating that the subject had for some reason failed to respond. Trials resulting in an error were rerun at the end of each block so that the required number of correct responses was always made in any given block. The subjects were not given knowledge of results. The actual testing session lasted approximately 50 minutes.
BEVERAGE
Each subject performed on two test days, one in each of the two beverage conditions, with only one beverage being experienced each day. The beverage was either a placebo, consisting of orange juice flavored with vodka or in the alcohol condition, vodka (commercial vodka, Smirnoff 40% alcohol per volume). Vodka was selected since its comparative absence of flavor and odor prevented accurate knowledge of the strength of dose on the part of the subject.
The dose was varied according to the body weight of the subject such that the blood alcohol concentration at any given point in time could be expected to be approximately the same in all subjects. Alcohol was administered in the ratio of 3:1 of orange juice to vodka. The placebo dose contained 2 ml of vodka floating on top of enough orange juice to match the volume of liquid in the alcohol condition. The drink was divided into five equal
portions. The subjects were given two minutes to finish one fifth of the drink. Thus, subjects consumed the drink in 10 minutes. This was done as the literature indicates that slow drinkers have a slower absorption rate and a faster elimination rate than fast drinkers (Jones et al, 1973). Testing began one hour after consumption of the drink. Without food in the stomach, the amount of alcohol consumed is thought to be completely absorbed and the maximum level attained in the blood in about an hour's time (Greenberg, 1968). Blood samples for analysis were drawn from fingertips at the beginning of the experiment, after 20 minutes from the start of the experiment and at the end of the experiment. The blood samples were sent to a commercial laboratory for analysis. Refer to Appendix F for details of the specimen collection, storage and analysis. Post testing, subjects were instructed not to drive and operate machinery for at least four hours.
EXPERIMENTAL CONDITIONS
Trials were conducted under three separate experimental conditions with and without alcohol, as follows:
1. Simple Reaction Time. In order to obtain base line measures, simple reaction time measures
were obtained for each of the four movements (forward and backward movements of the right and left hand). This necessitated four blocks of twenty trials each.
2. Two Choice Reaction Time. All possible combination of two choice reaction time were performed. Six
blocks of twenty trials were carried out.
3. Four Choice Reaction Time. In this condition all the four responses were equiprobable. Four
blocks of twenty trials were carried out.

Warning Tone variable Foreperiod Stit'nIJlIJs Response IT1 Warning Tone
.5 sec .5 - 1.5 sec 1 sec Next Trial
FIGURE 3.2: The duration of events in a typical trial.

CHAPTER lV
RESULTS
Blood Alcohol Concentration-:
Blood alcohol analysis performed at B.C. Biomedical Laboratories indicated an average blood alcohol concentration (BAC) of 56.80 mg %
(standard deviation 13.20) just prior to the onset of the experiment (60 minutes after drinking), 58.46 mg % (standard deviation 11.35) 20 minutes from the start of the experiment and 53.74 mg % (standard deviation 11 .SO) upon completion of the experiment. The complete data are provided below in Table 4.1.
TABLE 4.1: Blood Alcohol Levels before, during, and after completion of the experiment.
Subject Prior to the 20 minutes completion start of the after the start of the experiment of experiment experiment
(mg %) (mg w (ms "/.I

It therefore, appears that there was little change in BAC's throughout the course of the experiment (average pre- to post-testing change was 3.06 mg %). Other studies, with similar doses but with more frequent measurements of the blood alcohol curve, support the conclusion that only nonsignificant fluctuations in blood alcohol levels occur within the time intervals used for testing in the present study (Ekman et al, 1 963 Gustafson, 1986).
The mean values for blood alcohol concentration during the experiment as determined by direct analysis of blood are shown in Figure 4.1. While the
alcohol dose given orally had been chosen so as to produce an intended blood alcohol concentration of approximately 80 mg %, these levels were not achieved.
Separate 3 (3 levels: simple, 2 choice, 4 choice) x 2 (alcohol and placebo) way repeated measure ANOVAs were utilized to analyse the three dependent variables of interest. Repeated measure design was utilized as the same subjects participated in the alcohol and placebo condition. Reaction time, movement time and error differences between the alcohol and placebo conditions in simple, 2-choice, and 4-choice reaction time condition were analyzed. Main effects and interactions significant at the 0.05 level are discussed below. Where appropriate, the Tukey's HSD procedure was used to locate the source of significant differences, for post hoc comparison.
Reaction Time Analysis:
Mean Reaction Time increased from simple reaction time to 2 choice reaction to 4 choice reaction time in both the alcohol and placebo conditions as demonstrated in Table 4.2.
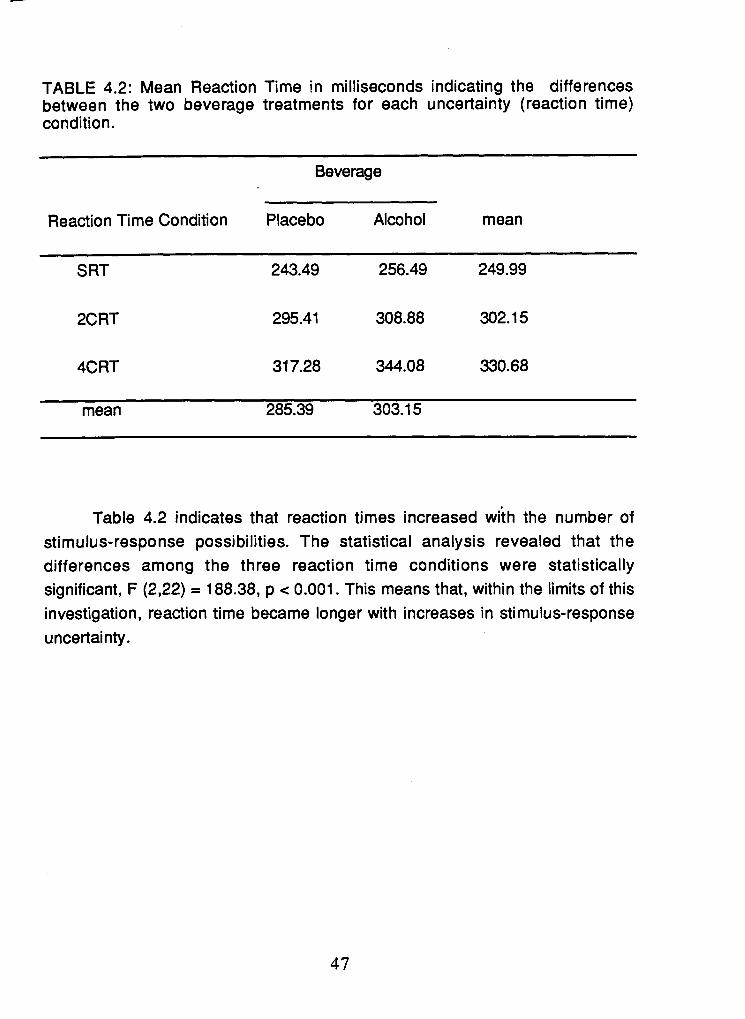
TABLE 4.2: Mean Reaction Time in milliseconds indicating the differences between the two beverage treatments for each uncertainty (reaction time) condition.
Beverage
Reaction Time Condition Placebo Alcohol mean
SRT
4CRT 31 7.28 344.08 330.68
mean 285.39 303.1 5
Table 4.2 indicates that reaction times increased with the number of stimulus-response possibilities. The statistical analysis revealed that the differences among the three reaction time conditions were statistically significant, F (2,22) = 188.38, p < 0.001. This means that, within the limits of this investigation, reaction time became longer with increases in stimulus-response uncertainty.

MEAN B.A.C. DURING TESTING SESSION 7 0,
4 0 55 60 65 70 75 80 85 90 95 100 105
BEGIN TESTING HALF-WAY END OF TESTING
Time period (minutes) after alcohol consumption.
FIGURE 4.1 : Mean and (+/-I) standard deviation of blood levels of alcohol before, during and after testing.
CENTRAL PROCESSING UNCERTAINTY
FIGURE 4.2: Reaction time plotted as a function of uncertainty in placebo and alcohol conditions.

Regarding the overall influence of alcohol, Figure 4.2 indicates that alcohol increased reaction time in all the three conditions. Alcohol was associated with an average increase in these reaction times by 6.07 %. When the data were analyzed statistically, it was found that the beverage effect was significant F (1,11) = 7.88, p < 0.05. But, when the beverage x condition interaction was examined, it was statistically non-significant F (2,22) = 1.43, p >
0.05, indicating that alcohol did not influence reaction time differentially in any of the three conditions.
TABLE 4.3: Reaction time (milliseconds) differences among means.
Post hoc analysis using Tukey's HSD (Table 4. 3) procedure confirmed that the simple reaction time condition was responded to the fastest. The next fastest was the 2 choice reaction time condition followed by the 4 choice reaction time condition.
Movement Time Analysis:
The mean Movement Times as seen in the Table 4.4 increased with increase in stimulus-response uncertainty.
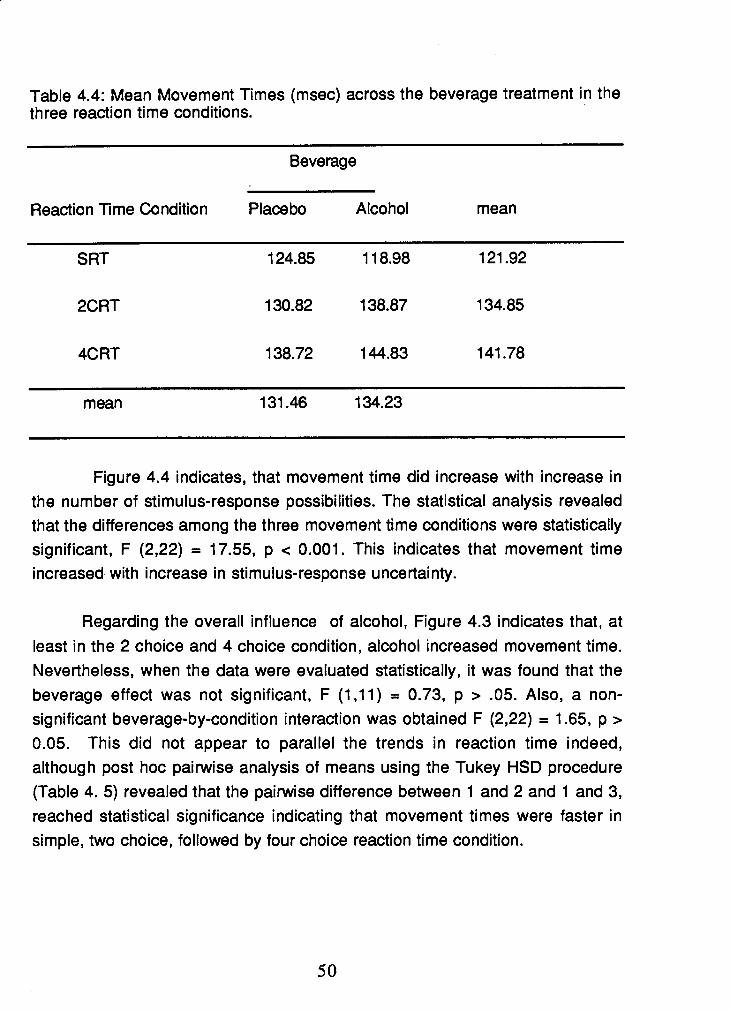
Table 4.4: Mean Movement Times (msec) across the beverage treatment in the three reaction time conditions.
Beverage
Reaction Time Condition Placebo Alcohol mean
SRT
2CRT
4CRT
mean
Figure 4.4 indicates, that movement time did increase with increase in the number of stimulus-response possibilities. The statistical analysis revealed that the differences among the three movement time conditions were statistically significant, F (2,22) = 17.55, p < 0.001. This indicates that movement time increased with increase in stimulus-response uncertainty.
Regarding the overall influence of alcohol, Figure 4.3 indicates that, at least in the 2 choice and 4 choice condition, alcohol increased movement time. Nevertheless, when the data were evaluated statistically, it was found that the beverage effect was not significant, F (1,11) = 0.73, p > .05. Also, a non- significant beverage-by-condition interaction was obtained F (2,22) = 1.65, p >
0.05. This did not appear to parallel the trends in reaction time indeed, although post hoc pairwise analysis of means using the Tukey HSD procedure (Table 4. 5) revealed that the pairwise difference between 1 and 2 and 1 and 3, reached statistical significance indicating that movement times were faster in simple, two choice, followed by four choice reaction time condition.

TABLE 4.5: Movement time (milliseconds) differences among means.
Error Analysis:
The average errors for the alcohol and placebo groups are shown as a function of the three uncertainty conditions. As can be seen in Figure 4.4, alcohol increased the number of errors as compared to the placebo condition. In order to determine if the indicated trends represented real effects, a 3 x 2 way ANOVA with repeated measure design was performed on these data.

MOVEMENT TIME (NO ALCOHOL VS. ALCOHOL)
1 1 4 . . . . . . . . . . . . . . . . . . . . . . . . . . . 4
.6 .8 1 1.2 1.4 1.6 1.8 2 2.2 2.4 2.6 2.8 3 3.2 3.4 SRT 2CRT 4CRT
FIGURE 4.3: Mean movement time for placebo and alcohol as a function of stimulus-response uncertainty.
Errors with and without alcohol in the three reaction time conditions
2 6 0 L
IG .c 0 4 & n E 3 Z 2 Placebo
8 .Alcohol
0
Reaction Time Conditions FIGURE 4.4: Average number of errors for placebo and alcohol as a function of reaction time condition.

Figure 4.4 indicates that, errors did increase with alcohol as compared to the placebo condition. Table 4.6 indicates the percentage error in the three reaction time conditions.
TABLE 4.6: Percentage err-ors indicating the differences in the two beverage treatments between the three uncertainty conditions.
Reaction Time Condition Percentage Errors
SRT Placebo Alcohol
2CRT Placebo Alcohol
4CRT Placebo Alco hol
As indicated in Figure 4.4 and Table 4.6, alcohol had an influence on the total number of errors, although no particular pattern in terms of the type of error was found. Similarly, Table 4.6, above indicates that alcohol was associated with an average increase in these errors by 117 %. When the data were evaluated statistically, it was found that the beverage effect was significant; F (1,11) = 27.87, p < .001. However, a non-significant interaction of condition; F (2, 22) = 0.09, p > .05 and also a non-significant effect of condition x beverage was obtained, F (2,22) = 0.09, p > .05.

Table 4.7: Differences in absolute and percentage errors between the two beverage treatments for each condition.
Difference
Reaction Time Condition Absolute Percentage
SRT 3.50 1 23.67
Although the number of errors increased in the alcohol condition as compared to the placebo condition, no particular trend regarding the type of error is observed within the three reaction time conditions.
The results of Experiment 1 indicate that the reaction time and number of errors increased after alcohol consumption when compared to the placebo condition. In order to examine the role of alcohol in the precuing effects, it was necessary to design a control experiment, maintaining the same experimental design as in the previous experiment. Therefore, before the precue technique was used for studying movement preparation processes, it was thought necessary to demonstrate that the reaction time shortening found in the different precuing conditions could not necessarily result from, or only from, reducing the programming component of reaction time. In the second experiment the precue technique is incorporated as a means to consider further the results of the first experiment and to investigate the nature of movement preparation.

CHAPTER V
METHOD
Experiment II
SUBJECTS
The same twelve males, who participated in the previous experiment served as subjects.
APPARATUS
The apparatus was the same as that employed in the previous experiment. In addition, a 22 cm video monitor (CRT) was placed behind the LED display at a distance of 74 cm on a 73.5 cm high table. The schematic diagram of the experimental procedure is depicted in Figure 5.1. The subjects were seated in a chair directly in front of the response panel such that they lined up their head and eyes with the center of the video display. An LED display panel was mounted on the video screen. The four LED'S were positioned on the corners of a 5.5 cm diameter circle. Each LED corresponded to one of the four keys, such that the most compatible arrangement was employed; i-e., the upper left LED signified the upper left response key, lower right signified the lower right key etc.. The center of the LED display was cut out, such that information projected at the center of the CRT could be seen by the subject.
The precue display consisted of capital letters displayed on the video screen. As the required movements differed with respect to two dimensions of arm (right or left) and direction (forward or backward) it was possible to provide precues that gave advance information about 0, 1, or 2 of the parameters defining any of the four movements. Letters conveying arm information were "R" (right) or "L" (left). Letters conveying direction information were "U" (up) and "D"
(down).

ESWNSE PANEL
Figure 5.1 : Schematic diagram of the apparatus used in experimental procedures.
For the ambiguous condition the slash keys denoting "/" (right up and left down) and "\" (left up and right down) were used. In the complete precue condition, the precue consisted of two letters. In the partial precue condition, the precue consisted either of only one symbol (letter or slash). In the no precue condition, the letter 'X' was used as a filler which conveyed no information of the upcoming movement to be performed. When complete information was given subjects were required to withhold their responses until the reaction signal appeared, making this condition essentially a simple reaction time task.
EXPERIMENTAL PROCEDURE
The same experimental procedure as in the previous experiment was followed. Adherence to the requested period of abstinence from food and alcohol was confirmed. Subjects were given an information sheet about the experiment to be performed (Appendix H), instructed about the nature of the task, the manner in which the precues would be presented and the goal of the task.
DESIGN
The subjects participated in all the three precue conditions (all, partial and no precue) within both the blood alcohol levels (placebo and approximately 80 mg %). Three subjects from group I and three subjects from group II of the previous experiment were given alcohol on the first day and placebo on the second day. The situation was reversed for the other six subjects. There was a gap of two days between the two sessions. Thus, as in the previous experiment, each subject participated in two experimental sessions lasting approximately two hours each.
An initial block of 48 trials was performed for familiarization purposes. The order of presentation of trials was constant for all subjects. The subjects were given 2 minutes rest after 40 trials. Testing session consisted of 80 trials of the 'all precue' condition, followed by 40 trials of 'arm precue' condition, 40 trials of 'direction precued' condition and 40 trials of 'ambiguous precue' condition. The last set consisted of 80 trials in the 'no precue' condition.
TASK
During testing the subject sat in a chair at the table looking at the center of the video screen. The subjects were told the meaning of the precues, were instructed to attend to the precues and to take advantage of this prior information for preparaing for the movement. Subjects were told that the precues would always give reliable information about the movement that would be required, so that the response signal was always to one of the precued targets. Their task was to make use of the precue and to move to the corresponding target key with the appropriate index finger as rapidly and as accurately as possible following the presentation of the response signal. Each trial began with the subject depressing the home keys, after which a warning signal was presented, followed by a variable foreperiod of 500 millisecond to 1500 millisecond. After a one second precue display period had elapsed, the reaction stimulus was illuminated following a random variable period of 500 to 1500 millisecond. When the reaction stimulus appeared, the task was to release the home key and to move to the specific target key as quickly and accurately as possible. No knowledge of their performance was provided to the subjects. The LED'S remained illuminated until the subject responded. Following the subjects response the're was a one second inter-trial interval (ITI) before the onset of the next trial. The duration of events in a typical trial are shown in Figure 5.2.
For each trial reaction time, movement time and errors were calculated by the computer software. Trials resulting in errors were rerun at the end of each block. The actual testing session lasted approximately 50 minutes.
BEVERAGE
The same procedure as in the previous experiment was followed with respect to the administration of alcohol.
EXPERIMENTAL CONDITIONS
Three conditions, which differed in the amount of information provided in the precues, were used. The subjects participated in all the three conditions with and without alcohol in a counterbalanced design.

1. All precue condition. Complete advance information was provided to the subject as to
which arm to move and the direction of movement prior to the imperative stimulus to move. There were two blocks of 40 trials each.
2. Partial precue condition. In this condition only partial information was provided to the
subjects. The precues provided information either of the arm to be moved (arm precue), the direction of movement(direction precue) or no specific movement related information (ambiguous precue), leading to three types of partial precue conditions.
a. Arm precue condition. In this condition advance information was provided during the
precue interval as to which arm (right or left) was to be moved, with the direction of movement remaining uncertain until the imperative stimulus to move. A total of 40 trials were performed in this condition.
b. Direction precue condition. In this condition advance information was provided during the
precue interval as to the direction (forward or backward) of movement, with the arm to be moved remaining uncertain until the imperative stimulus to move. A total of 40 trials were performed in this condition.
c. Ambiguous precue condition. In this condition the precue served to reduce the stimulus
response uncertainty without specifying either the arm to be moved or the direction of movement until the imperative stimulus to move. When the 'r slash appeared the subjects were instructed to prepare for the right up and left down movement while they were asked to prepare for left up and right down movement when '\ ' slash appeared. 40 trials were carried out by the subject in this condition.

3. No precue condition. In this condition no advance movement related information was
provided to the subject as to the arm to be moved or the direction of movement until the imperative stimulus to move. Two blocks of 40 trials were performed by the subjects.
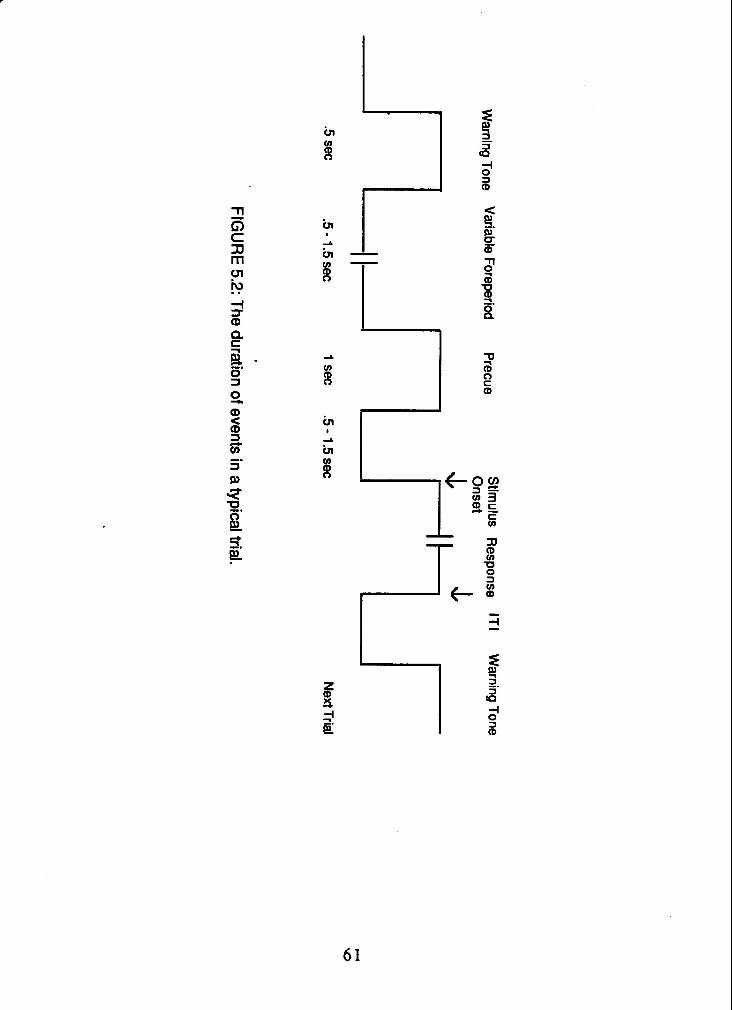
Warning Tone
Variable Foreperiod P
recue Stim
ulus R
esponse IT
I W
arning Tone O
nset
.5 sec .5 - 1.5 S
~C
1 S
~C
.5
- 1.5- N
ext Trial
FIGU
RE
5.2: The duration of events in a typical trial.

CHAPTER VI
RESULTS
Blood Alcohol Concentration:
Analysis of the blood alcohol data at the B. C. Biomedical Laboratories indicated that the average Blood Alcohol Concentration (BAC) level was 72.78 mg % (standard deviation 14.69) just prior to the onset of the experiment (i.e., 60 minutes after drinking), 70.71 mg % (standard deviation 15.40) after 30 minutes after the start of the experiment and 64.45 mg % (standard deviation 10.90) just after completing the experiment. The complete data are provided below in Table 6.1.
1 TABLE 6.1: Blood alcohol level before, during and on completion of the experiment.
Subject Prior to the 30 minutes completion number start of the after the of the
experiment experiment began experiment (mg%) (mg%) (mg%)

The mean blood alcohol levels obtained during the experiment by direct analysis of blood are shown in Figure 6.1. The analysis that follow will be discussed with respect to the three dependent variables analyzed.
Reaction Time Analysis:
Figure 6.2, shows mean reaction times for each of the six responses in each of the three precue conditions. The data contributing to each point in the figure and to the analysis below, are means averaged over all the subjects mean reaction times for errorless trials.
Mean reaction times increased monotonically with the number of values to be specified after the reaction signal increased i.e., reaction times decreased with an increase in the amount of information conveyed by the precue increased. There was a significant effect of precue condition [ F (2,22) =
126.44, p < 0.011. The completely precued condition was responded to the fastest. The next fastest was the condition in which a single parameter was specified, while the no precue condition had the longest reaction time. Post hoc analysis using Tukey's HSD procedure (Table 6.3) indicated that the differences were statistically significant.

MEAN B.A.C. DURING TESTING SESSION
404 . , . I . 1 . 1 . 1 . I . I . 1 5 0 60 70 8 0 9 0 100 110 120 130
BEGAN TESTlNG HALF-WAY END OF TESING
Time period (minutes) after alcohol consumption.
FIGURE 6.1: Mean and standard deviations of blood levels of alcohol after a single dose of alcohol ingestion before, during and after testing.
REACTION TIME (NO ALCOHOL VS. ALCOHOL)
400 1
ALL PARTIAL
PRECUE CONDITIONS
PLACEBO ALCOHOL
FIGURE 6.2: Mean reaction time for placebo and alcohol as a function of precue conditions.

TABLE 6.2: Mean reaction time (msec.) indicating the difference in the two beverage treatments for each of the three precue conditions.
- Beverage
Precue Condition Placebo Alcohol mean
All 243.60 268.38 255.99
Partial 295.44 338.36 31 6.90
No 31 8.1 9 352.96 335.58
mean 31 9.90 285.74
TABLE 6.3: Mean reaction time (milliseconds) differences among precue conditions.

The subjects with alcohol were notably slower than the placebo condition, F (1 ,I 1) = 14.28, p < 0.01. The beverage x precue condition interaction was also found to be significant [ F (2,22) = 5.45, p < 0.051 indicating that subjects did make use of the precues in preparing for the upcoming movements but were not as effective under the influence of alcohol as compared to the placebo condition. Alcohol was associated with an average increase in these reaction times of 1 1 38%.
One precued parameter:
In the partially precued condition, there were three different conditions depending on the precue displayed. In the placebo condition, when the direction of movement was precued the reaction time was the shortest, followed by the condition in which the subjects knew in advance which arm was to be moved. But, in the alcohol condition the situation was reversed. The effect of response movement of arm, direction and ambiguous condition was not significant, F (2, 22) = 1.79, p > 0.05, nor was the interaction between beverage x condition. This is consistent with the Goodman et al (1980) experiment in which they also incorporated an ambiguous precue condition and found no significant effect of condition. Subjects were slower after alcohol consumption and a significant effect of beverage was found F (1,11) = 14.91, p < 0.01. The Table 6.4 indicates the mean reaction time in the three precue conditions.

TABLE 6.4: Mean reaction time in milliseconds indicating the difference between the two beverage treatments for each of the three partial precue condition.
Beverage
Partial Precue Condition Placebo Alcohol mean
Arm 296.41 341 -74 31 9.08
Direction 294.80 334.98 31 4.89
Ambiguous 302.85 340.85 321.19
mean 297.86 339.1 9
The mean reaction times for each uncertainty level for each condition are shown in figure 6.3. Comparison between the two beverage conditions on reaction time across uncertainty levels reveals consistent relationships across the groups. Both the groups exhibited linear trends. Regression equations calculated on these same uncertainty data demonstrate differences in the slope of the beverage x uncertainty level trends. The obtained values for the alcohol group were y = 277.61 + 42.29x, and for placebo group, y = 248.45 + 37.30x, where y = reaction time, and x = log 2 of the number of response alternatives. The main finding was that subjects under the influence of alcohol were significantly different in linearity as compared to the placebo condition. The longer reaction times for the alcohol condition are partially explainable by the slowing of the response selection processes.

A supplementary analysis was carried out to find if there were any differences between the arms (right or left) and direction (up or down) of movement. When the effect of arm is considered, there was no difference between right and left arm [ F (1 ,I 1 ) = 0.26, p > 0.051, but the effect of alcohol was significant F (1,11) = 11.94, p < 0.01. Also, a nonsignificant beverage x condition interaction was obtained F (1,11) = 0.01, p > 0.05. When the direction of movement is considered, there was no difference between upward or downward movement, F (1,11) = 3.75, p > 0.05. But the effect of beverage was significant F (1,11) = 12.76, p < 0.01, the beverage x condition interaction was also significant, F (1,11) = 4.96, p < 0.05. This nature of the interaction was interesting; i.e., the effect changed across the beverage conditions.
Movement Time Analysis:
The mean movement times for each condition are shown in Figure 6.4 and Table 6.5. The alcohol subjects were markedly slower than the controls, F (1, 11) = 4.63, p c 0.05. Decreased accuracy has been demonstrated after alcohol consumption by Rundell and Williams (1979) and by Wood and Jennings (1 976). The subjects, after alcohol consumption, were observed to hit the edge of the key surface more frequently than in the placebo condition.
TABLE 6.5: Mean movement time in milliseconds indicating the difference between the two beverage treatments for each of the three precue condition.
Beverage
Precue Condition Placebo Alcohol mean
All 99.33 1 12.38 105.86
Partial 1 04.09 1 18.93 11 1 .51
No 107.91 1 18.04 1 12.98 .
mean 103.78 1 16.45

bl ALCOHOL. y = 2//.61 + 42.29X H = 0.94
PLACEBO y = 248.448 + 37.295~ R = 0.98
230 ! I I i
0 1 2 3 BITS OF INFORMATDN
FIGURE 6.3 : Reaction times for alcohol and placebo conditions plotted as a function of uncertainty.
MOVEMENT TIME (NO ALCOHOL VS. ALCOHOL) 0 Alcohol ONo- Alcohol
.5 1 1.5 2 2.5 3 3.5 COMPLETE PARTIAL NO PRECUE
FIGURE 6.4: Mean movement time for alcohol and placebo as a function of precue condition.

There was no effect of condition, F (2,22) = 3.17, p > 0.05, indicating that once the decision was made the movement time did not differ in the three conditions. The beverage x condition interaction was non-significant, F (2,22) =
0.43, p > 0.05.
One precued parameter: The mean movement times for the three partially precued are shown in
the Table 6.6. Movement times were faster in the placebo than in the alcohol condition (1 1.92 milliseconds). However, no effect of alcohol [ F (1,11) = 2.88, p > 0.051, beverage x condition [F (2,22) = 2.191 nor condition [ F (2,22) = 0.68, p > 0.051 was found. Movements of the right arm were approximately 3 milliseconds faster than those of the left [ F (1, 11) = 0.85, p > 0.051 , downwards movements were 9 milliseconds faster than upwards movements, [ F (1 ,I 1) = 1.77, p > 0.051, but both were not significant. There was no significant effect of beverage, and beverage x condition interaction was also non-significant in the arm and direction precued movements.
TABLE 6.6: Mean movement time in milliseconds indicating the difference between the two beverage treatments for the three partial precue condition.
Beverage
Partial Precue Condition Placebo Alcohol mean
Arm 103.07 1 18.99 111.03
Direction 105.10 1 18.88 1 1 1.99
Ambiguous 105.50 111.56 108.53
mean 104.56 1 16.48
Error Rate Analysis:
Percentage errors differentiated by the type of error, are presented as a function of precue condition, in the alcohol and placebo conditions in Table 6.7. Most of the errors were inattentiveness errors mainly in the complete precue

condition and no precue condition. Response error were very low, less than I%, and there is no evidence that these errors increased with translation difficulty.
TABLE 6.7: Percentage errors categorized by error type as a function of precue and alcohol condition.
Type of error All Arm Direction Ambiguous No
Anticipations Placebo 2.29 0.42 0.42 1.04 0.73 Alcohol 4.48 0.31 0.52 0.31 0.31
lnattentivenessb Placebo 2.60 2.92 2.40 1.98 3.65 Alcohol 4.58 1.88 2.29 1.67 4.1 7
Responsec Placebo 0.00 0.1 0 0.52 0.42 0.62 Alcohol 0.31 0.00 0.42 0.21 1.67
aReaction time < 100 milliseconds, b~eact ion time > 800 milliseconds, clnitiated movement with wrong hand, struck wrong key, or missed target altoget her.
Although the number of errors, averaged across precue condition and beverage type, ranged from 0 to 596, suggesting that error rate, at least in this experiment, bore no relationship to stimulus-response uncertainty. Analysis of variance revealed a non-significant effect of beverage [ F (1,11) = 2.93, p > 0.051, precue condition [ F (2,22) = 1.37, p > 0.051, and beverage x condition interaction [ F (2,22) = 2.82, p > 0.051. Please refer to Appendix I for the summary tables for Analyses of Variance for Experiments 1 and 2.

CHAPTER VII
DISCUSSION
In the present study, efforts were made to conceal from the subjects but not the experimenter whether or not alcohol was given. However, in post testing all the subjects in the alcohol condition were aware that they were under the influence of alcohol. In the first experiment, all the subjects were tested in the evening. The same twelve subjects in the second experiment were all tested in the morning. There was, however, difference in the blood alcohol levels, between morning and evening subjects when the amount of alcohol given was same. Similar results were also reported by Hamilton and Copeman (1970). The absolute difference between these morning and evening scores appears to be a combination of inter-subject differences and time of the day effect (diurnal effect).
The alcohol dose administered to the subjects was intended to produce BAC's of 80 mg %. According to the analysis of the blood alcohol levels, however, the actual BAC's were somewhat lower, with a substantial degree of variation from one subject to another. The highest BAC was 77.38 mg % and the lowest 30.40 mg % in Experiment 1, while the highest blood alcohol concentration was 100.88 mg O/O and the lowest was 47.91 mg % in Experiment 2, at the start of the experiment. The average blood alcohol levels were 56.33 mg % and 69.31 mg % in the first and second experiment, respectively. While the intention was to produce BAC's at 80 mg %, the levels obtained deemed appropriate for the purpose of this experiment.
In Experiment 1, no difference in BAC levels achieved was found in the subjects who were administered alcohol (group I) on the first day as compared to the subjects who received placebo (group II) on the first day. In the second experiment three subjects from group I and three subjects from group II were given alcohol on the first day and placebo on the second day. The condition was reversed for the other group.
A feeling of nausea and discomfort was reported in three subjects, after alcohol consumption. However, the effect was transitory and the subjects reported that they had recovered when testing began.
The results of Experiment 1 indicate that when blood alcohol levels up to 56 milligram per cent are attained, simple reaction time is lengthened. This relationship is statistically significant (p < 0.001) but it should be noted that the difference between simple reaction time with and without alcohol was only 13 milliseconds. In simple reaction time the subjects know what to do the only uncertainty was when to do.
According to Carpenter (1969) the literature on alcohol is consistent in that alcohol increases reaction time, regardless of form, and even in small amounts. Conger (1958) reports that "It has been pretty clearly established that alcohol, even in small doses, increases reaction time - as, for example, in applying a foot brake after seeing a red light" (p.32). The results of the experiment reported here do not contradict Conger's statement but do call attention to the magnitude of increase. Carpenter (1 969) reported an increase of reaction time by 12 milliseconds from 0 mg %to 80 mg%.
The 12 millisecond increase in reaction time between the high and zero doses of alcohol represents a change of 6% and should be contrasted with the degree of practice effect measured between the first and the last experimental session. According to Carpenter (1969), without proper separation of practice and drug effects, the 12 millisecond change attributable to alcohol could either have been completely obscured or more than doubled when mixed with the change due to practice. This illustrates Jellinek and McFarland's (1940) chief criticism of research on alcohol and on various psychological measures, including reaction time.
The minuteness of the changes due to alcohol must be considered in terms of the amount of alcohol given, i.e., about 2.2 milliliters per kilogram body weight of 40 % proof vodka for an average 70 kilogram man, post absorptive taken over a 10 minute period in conjunction with orange juice, with reaction times being measured at or near the peak of alcohol absorption. On the basis of crude observation during the experiment, the subjects appeared to be

intoxicated, and spontaneously described themselves as being in that condition. It is therefore surprising that the alcohol which produces such obvious changes in gross behaviour should have had such a small effect on simple reaction time.
According to Mitchell (1985) simple reaction time largely reflects perception rather than motor function. According to Wallgren and Barry (1970) BAC below 80 mgldl have very little effect on simple reaction time, between 80 and 100 mgldl, approximately a 10% decrement is observed and large decrements are observed only with BAC's above 150 mgldl. The degree of impairment may be greater above this level (Mitchell, 1985). However Carpenter (1 969), Gustafson (1 986), Teichner (1 954) and Young (1 970) have found an increase in simple reaction time at much lower blood alcohol levels.
The increase in choice reaction time under the alcohol condition is consistent with previous research findings. In fact, a lack of an effect would have been quite surprising, since ldestrom and Cadenius (1968) found significant increase in reaction times at a somewhat lower blood alcohol level when 0.4 gram of alcohol per kilogram body weight was administered. Simple and choice reaction time do not refer to the same behavioural process, the course of deterioration may be differentiated for each over the same range of alcohol doses, with a more complicated process being more susceptible to a given dose (Jellinek, 1940). However, in the present data the interaction between beverage x condition failed to reach significance. In the present study it was found that absolute difference between alcohol and placebo increased from 13 milliseconds to 27 milliseconds from two choice to four choice reaction time.
While choice reaction time as influenced by alcohol has received its share of attention, the results are not particularly clear cut. For example, Gruner and Ptasnik (1953), report a 200 % increase at 1.5 mllkg, and Lambercier and Martin Du Pan (1 946) found only a 1 0 % increase at 1.26 mllkg. The present study found an average increase in reaction time of 6%.

Interpreting the Hick-Hyman Law: The obtained relationship between reaction time and stimulus-response
uncertainty as shown in figure 4.1 is a reliable finding and has been reported in the literature (Bartz, 1971 ; Hick, 1952; Huntley, 1972; Lamb and Kaufmann, 1965; Morin and Forrin, 1962). Although there is considerable controversy about the nature of the cognitive processes reflected by the slope of the reaction time function, it at least seems sure that the slope represents the more central aspects of information processing as distinguished from the purely sensory and response elements of the processing sequence.
Since the time taken to detect the mere presence of a stimulus is independent of the size of the population of potential stimuli and responses, the time taken to detect and respond would seem to be independent of the number of the stimulus response options. On the other hand, since the recognition of the stimulus and the selection of the appropriate response (i.e., the more central aspect of the task) must become more complex as the number of possible stimuli and responses becomes greater, logically, increases in reaction time associated with such changes could be interpreted as a reflection of increases in complexity of the central activity. Therefore, any treatment which influences the magnitude of the increase in reaction time associated with increases in the number of stimulus and response possibilities may be said to have somehow altered these central processes.
The equation, Choice RT = a + b log2 N associated with each linear
function in Figure 5.1, gives the intercept values and the changes in reaction time associated with each additional "uncertainty unit". The equation values were derived from the straight line functions rather than the raw data. The reaction time functions diverge and do not share the same Y intercept. Since the only difference between the two conditions was in the response, and the slopes as well as the intercepts of the corresponding reaction time function were different, it follows that uncertainty effects occur primarily in the response aspects of processing and influence both response selection and execution.
The derived equation for the alcohol condition illustrated an increase of 44 milliseconds for each unit of uncertainty while in the placebo condition it was 37 milliseconds. The Y intercept for the alcohol condition is 260 milliseconds

and 249 milliseconds for the placebo condition. Thus it may be concluded that alcohol affects both the central and the peripheral aspects of response processing, i.e., the selection and the execution of the response.
By differentiating between the effect of alcohol upon the slope and intercept of reaction time uncertainty functions, Huntley (1972) on the other hand, reported that alcohol has relatively negligible effect upon the neurologically more peripheral aspects of information processing, but suggested that it markedly reduces the speed of the more central aspects of selection performance. Thus, he concluded that the locus of the alcohol effects in the information processing sequence appears to be in the stimulus-response translation process, i.e., in response encoding rather than with the stimulus recognition per se or response execution.
Tharp et al (1974), using the information processing model, suggested that alcohol selectively impairs the stages of response selection but not the stimulus identification. In explaining effects similar to those described here, Hawkins and Underhill (1971) have speculated that the processing uncertainty is the result of response conflict which they assume to increase with increase in '
the number of response options. They propose that the response conflict increases with the number and extent of competing response tendencies elicited by each stimulus.
Auxiliary evidence to support the findings that information processing is slowed by alcohol comes from an eye movement study by Belt (1969) as reported by Moskowitz (1973). He reported longer reaction times while driving under the influence of alcohol. Very recently similar results are reported by Ross and Pihl (1988) with complex reaction time and also by Linnoilla et al (1980). Erwin et al (1978) report that alcohol impairs detection and prolongs reaction time. Experiments with reverse masking have shown that even small amounts (0.41 gmlkg) of alcohol increase reaction time and that a considerable part of this increase is due to a slowing of the decision making processes (Pogrebinskii, 1983).
One way of interpreting the results of the precue experiment is in terms of uncertainty. That is, a single precue reduces the potential number of

stimu1us:responses to two, while two precues make the situation very similar to a simple reaction time condition. By applying the Hick-Hyman relationship to the mean data from the precue trials one can further examine the effects of alcohol on precuing time. While for the placebo conditions in Experiment 1 and 2 resulted in very similar estimates of slope and intercept, this was not the case with respect to the alcohol conditions. Although it is acknowledged that cross experimental comparisons are somewhat tenous the increased slope of the best fitting line applied to the reaction time's is garnered in the precue Experiment over the slope in the reaction time Experiment.
When the precue data were plotted as a function of uncertainty the equation obtained for the placebo condition (y = 248.45 + 37.30~) was similar to the placebo condition in the reaction time experiment (y = 248.49 + 36.90~) but a difference in the intercept in both the alcohol conditions was found, (y = 277.61 + 42.29x, for precue condition; y = 259.36 + 43.80~) but the slopes were the approximately the same. Thus, the subjects under the influence of alcohol are not able to effectively make use of advance information; there is a decrease in the ability to react and move quickly. Further, both the groups were able to use the precue information since reaction time decreased as the number of movement dimensions to be specified at the time of response signal decreased. Ward (1987) concluded from his study that people under the influence of alcohol are capable of analyzing stimuli into components, but they require unusually long periods of time to do so.
The effect of alcohol on the incidence of errors is quite obvious. The frequency of errors did increase after alcohol consumption. The task is not one in which large error scores are usually found (Shellito et al, 1974), the preservation of speed at the cost of some loss of accuracy, may be the strategy adopted by some subjects. However, considering the trends in mean reaction time and number of errors, the data imply that alcohol caused a deficit in processing efficiency, not simply a bias towards speed over accuracy. A study conducted by Jennings et a1 (1976) and Rundell and William (1979) using different alcohol doses clearly demonstrated decreased systematic, dose related decline in the slope of the speed-accuracy tradeoff function, a decrease in the rate of growth of accuracy over time.
What is clear from all of these studies is that tasks measuring the time for complex information processing show greater alcohol induced performance decrement than simpler processing situations. Whether this is the result of interference with some processing of the potential range of stimuli and response implied by an information theoretic view, or whether it is due to the task, is of less concern than the unanimous agreement that alcohol causes greater response impairment when the response requires complex information processing than when only simple motor reaction times are involved.
In discussing the results of the second experiment, it is emphasized that the movements studied were brief, rapid and discrete, and that no inferences about preparatory processes in more sustained or complex movements are implied. The subjects under the influence of alcohol moved more slowly, made more errors and did not make use of advance information in preparation of the movement to the same extent as in the placebo condition.
When a precue is given sufficiently in advance of a stimulus, the speed of a person's response to that stimulus shows a marked improvement. The time period between the presentation of the precue and stimulus to move, can be thought of as a preparatory period, during which the subjects attends to the stimulus and prepares for the response.
Subjects were given advance information about all possible combinations of values on two dimensions prior to the presentation of reaction signals that indicated which one of the four possible responses was required on an individual trial. From the results, it can be concluded that in the placebo condition subjects made use of advance information but in the alcohol condition the subjects were not able to utilize the advance information to the same extent. The difference between completely precued and partially precued condition was 40 milliseconds and it was 23 milliseconds between no information and partial information condition. These results are in agreement with those of Schellekens et al (1986).
In the alcohol condition the difference between complete and partial information was 70 milliseconds. While it was only 15 milliseconds between no precue and partial precue condition, indicating that subjects with alcohol did not

effectively make use of the advance information. The beverage x condition interaction reached significance, indicating that under the influence of alcohol, subjects were not able to effectively use advance information in preparing for the upcoming movements to the same extent as in placebo.
These results with respect to the use of precue information and reaction time are in general agreement with those of Bonnet et al (1982), Goodman and Kelso (1 980), Rosenbaum (1 980), and Stelmach and Larish (1 981). That is, as the number of stimulus-response alternatives was reduced (i.e., as more parameters were precued), there was a corresponding reduction in reaction time. Thus reaction time increased with the number of possible choices, whether this involved arm (Glencross, 1973) or direction (Ells, 1973; Kerr, 1 976).
Comparing studies utilizing a precue paradigm where advance information was given about a forthcoming movement (Bonnet et al, 1982, 1986; Goodman and Kelso, 1980; Larish and Frekany, 1985; Lepine and Requin, 1983; Rosenbaum, 1980) indicates that the reaction time data are very much in agreement with those previously published with this paradigm.
Debriefing interviews indicated that blocking was subjectively experienced as one subject responded "I saw the signal but somehow I didnlt get around to pressing the switch immediately". This implies that alcohol may interfere with decision processes. Gustafson (1986) also reported a similar finding on an auditory reaction time task and concluded that "when attending to the internal continuum of consciousness alcohol delays the switching back of attention to the external event calling for attention and an appropriate response".
One precued parameter: The direction and arm preknowledge condition failed to produce
significantly different reaction times. Goodman and Kelso (1 980), Harrison and Bishop (1 985) also failed to produce significantly different reaction times when direction and arm were precued. This is in contrast to the Bishop and Harrison's (1983) study which showed that when a two choice reaction time task is utilized

using short and long Morse key presses executed with the same hand, reaction times are faster than when both hands perform the same duration of key press.
In the present experiment, no effect of arm, direction, or ambiguous precue was found. These results are in general agreement with those of Goodman and Kelso (1980) who also found a null effect of precue condition, but they reported that the ambiguously precued condition resulted in a slightly higher error rate than the other conditions. This difference in the ambiguous condition was not found in the present experiment.
In terms of stimulus information content, the most complex task was the RU:LD or LU:RD pairing, and yet, surprisingly, it did not produce longer reaction time in alcohol and placebo conditions. It could be that information content of a stimulus, as defined by the number of parameters it identifies, is not the only factor that must be considered, another is the potential confusability of the alternative responses. When responses share common components, the information content of the reaction signal is lower, but the existence of these common features may also operate to slow down or confuse identification.
An alternative explanation is simply that subjects defer preparations until both the arm and direction were known; such 'wait and see' strategies have also been reported by Davis (1964) and Bishop and Harrison (1983). It would seem that a critical factor is the time pressure subjects are working under. If they have sufficient time to utilize a more protracted selection and preparation strategy, reaction time will not be affected, but if effective time-constraints apply, the sub-optimal nature of the strategy will be revealed (Bishop and Harrison, 1 983).
It may well be true that subjects can utilize a wide range of selection and programming strategies (Goodman and Kelso, 1980; Rosenbaum, 1980), but not necessarily with equal facility. Confusability of responses may be another factor which contributes to task complexity which may not be taken account of by controlling the information content of the reaction signal, for this only standardizes number of undisclosed parameters (Bishop et al, 1983).
Another major problem is that response identification and response programming contributions cannot be separated. A completely different set of response parameters may be required to promote programming, as Goodman and Kelso (1980), and Kerr (1978) have pointed out. It may be that acceleration, force and timing data are needed for programming purposes, and that these cannot be extrapolated from direction and arm data until the action is completely defined. Another problem with the procedures used is that, experimental demands may force the subjects to use anticipatory strategies which are in no sense representative of his normal performance.
Several authors (Goodman and Kelso, 1980; Stelmach and Larish, 1981 ; Zelaznik 1978, 1982) have argued that for some precuing situations, non- motoric factors are confounded with motoric factors in the reaction time measure. When incompatible stimulus-response mapping is used, a non- motoric transformation or response selection process is required that can differentially affect reaction time for the various preparation condition (Goodman and Kelso, 1980; Stelmach and Larish, 1981). Response selection has not been considered to be a factor however, when stimulus-response mappings are compatible. Such appears to be the case in the present experiments, when the precuing interval allows sufficient time to process the precue.
Some studies are reported using the precue technique in the elderly subjects and subjects with Parkinsonism. Bloxham et al (1984) carried out experiments with Parkinsonian patients and concluded that 'Parkinsonian patients have no difficulty in using prior information to plan in advance the form of a movement but do have difficulty in using this information to initiate or select a movement'. While Stelmach (1986) concluded that 'decreases in reaction time with more advance knowledge were no less for a Parkinsonian subjects than for the controls in a task using aiming movements of the hand'. He further added that the slowing of input andlor output stages, i.e., stimulus detection and classification, response programming and production may be a manifestaion of .
the disease, but intervening processes involving memory searching or response selection are not. He suggested that the longer reaction times shown by the Parkinsonian subjects are not primarily caused by impairment in response selection.
While Stelmach (1987) concluded from his data that the elderly appear to have little difficulty in using prior information to plan in advance the movement they are about to make, but they do show slowness in using this information for response selection purposes, particularly as the amount of information increases. When the subjects had to specify more movement dimensions (less precue information) response selection processes were increasingly stressed. They found that the elderly group was twice as slow as the young group.
The fact that movement time was not affected by alcohol suggests that the alcohol causes deterioration in some sort of central attentional or decision process (Chiles and Jennings, 1970) rather than a direct alteration of the state of the subject's neuromuscular system. However, if this is in fact the case, the inference applies to tasks in which the motor response, once initiated, does not involve any particular degree of precision in its execution. Wood and Reeve (1984) also found no effect of precue on movement time, but they did not give any explanation for their results. Similar results are also reported by Stelmach (1987). The movement time results in their experiment displayed very little change as the number of movement dimensions to be specified increased. This was found in all the three age groups (young, middle, and elderly movement times were not affected by additional movement dimensions specified even though the reaction times showed significant slowing.
The present results are in contrast to those of Fitts and Peterson (1
, the to be
9641, Goodman and Kelso (1980), and Kerr (1976), who reported that movement times follow the reaction time pattern, thus providing no evidence for a reaction time-movement time trade-off. Their results indicated that when no parameters were precued, movement times were slowest, next slowest were the single precued condition followed by the two precued conditions. The totally precued condition exhibited fastest movement times.
The number of errors in the alcohol group were greater compared to the placebo group. The most frequently committed errors in both the groups were inattentiveness errors. Surprisingly, the response errors (movement initiated with the wrong hand, struck wrong key, or missed target altogether) were the least with and without alcohol. However, the number of errors in the beverage condition failed to reach significance in the second experiment.

CHAPTER Vlll
SUMMARY AND CONCLUSIONS
Summaty of Results:
Reaction time increased across the conditions of simple, 2 choice and 4 choice reaction time tasks in Experiment 1 and in complete, partial and no precue conditions in Experiment 2. Reaction time increased significantly for alcohol conditions compared to placebo conditions in Experiment 1 and 2.
Subjects are able to use advance information in planning for a movement as evidenced in the placebo condition of Experiment 2. Under the alcohol condition however, subjects are not able to effectively use advance information to the same extent as in the placebo condition.
For movement time, the main effect of condition was significant in Experiment 1, while in Experiment 2 the main effect of beverage was significant. Number of errors significantly increased in the alcohol condition for Experiment 1 only.
Concluding Remarks:
The conclusions to be drawn from this study with respect to the effects of alcohol on movement preparation support the previously reported findings that moderate blood alcohol levels produce performance decrements. Based on the results of 12 subjects, it appears that alcohol decreases reaction time performance.
Alcohol has an effect on simple visual reaction time in single-signal situations demanding no division of attention. The functioning of simple reaction time is altered to such a small extent under moderate doses of alcohol that the changes need not be an important factor in the behaviour otherwise identifiable as mild intoxication. This conclusion does not deny that the behaviour in question is affected by alcohol, but it does maintain that when people are called

upon to make a specific simple response to a specific single stimulating condition, they are able to do so with negligible impairment from alcohol.
The present results also clarify the influence of alcohol on choice reaction time performance, and also identify the specific functional processes impaired by alcohol. The'results of these studies suggest that alcohol affects both the peripheral and the central information processing stages.
Subjects under the influence of alcohol are capable of analyzing stimuli into components, but they require a longer period of time to do so. It is important to note that the delayed processing is in a time range that would scarcely be apprehended by any introspective techniques. The deficit produced by alcohol would mainly exhibit itself in situations where safety is dependent on a differential of milliseconds in response time and where more than one source of information is waiting for simultaneous analysis as there is slowing of the brain's ability to process information. In the present study, subjects knew the stimulus-response uncertainty obtained in the given experimental session, a condition which is not always the case in a real life situation.
A partial advance information paradigm that utilized movement precues about the upcoming movement, was applied to forward and backward arm movements. By analyzing reaction times obtained when precues gave either no information, partial information or complete information about the movement parameters, it was found that reaction times varied as a function of amount of advance information. Reaction times were fastest in the completely precued condition, followed by the partial precue condition and the no precue condition. With regard, to the type of parameter to be programmed, no conclusions can be drawn as to whether the arm or the direction were faster as there were no significant differences.
The results established that the subjects under the influence of alcohol had slower reaction times, movement times and information transmission rates as compared to the placebo condition. The subjects under the influence of alcohol could not effectively use precue information to prepare for an upcoming movement as compared to the placebo condition. The data is interpreted as providing evidence that part of the slowing in reaction time observed after
alcohol consumption could be due to the increased time to specify a dimension of movement. This is a important, as tasks which require use of cues and information available from the environment will be affected after alcohol consumption.
Drivers under the influence of alcohol have their information processing capacity reduced and thus must restrict some of the informatiorl inputs, which might normally be processed concurrently. A conclusion regarding reaction time experiments can be ventured despite the considerable variability of results in the literature. Simple reaction will usually exhibit a small and statistically significant increased reaction time by BAC'c of 58 mg%. On the other hand, studies involving choice reaction time will exhibit a wide range of alcohol influence from small to quite large effects. It is suggested that the source of this great variability lies in the differing degree of participation of various central processing functions depending on the particular stimulus and response configurations and the variables like stimulus-response conditions.
It is important to know how aware individuals are that their rates of information processing have been slowed by alcohol. In the formal setting of a laboratory task, individuals appear to compensate by taking more time to perform the task. The extent to which individuals attempt to compensate in real world settings is not clear, but this appears to be a topic worthy of study. The effects of rate of information processing may be much more extreme under more realistic conditions.
Areas of potential exhibition of defects induced by slowed processing time are characteristics of automobile driving. Driving involves monitoring and performing a tracking task and maintaining sensitivity and responsiveness to a wide range of signals of potential danger, such as traffic signals, other vehicles, etc.. Driving is also an activity that occasionally demands utmost speed in interpreting and reacting to a stimulus complex such as a potential collision.

APPENDIX A
INFORMED CONSENT BY SUBJECTS TO PARTICIPATE IN A
RESEARCH PROJECT EXPERIMENT
Note: The University and those conducting this project subscribe to the ethical conduct of research and to the protection at all times of the interests, comfort, and safety of subjects. This form and the information it contains are given to you for your own protection and full understanding of the procedures, risks and benefits involved. Your signature on this form will signify that you have received the document described below regarding this project, that you have received adequate opportunity to consider the information in the document, and that you voluntarily agree to participate in the project.
Having been asked by Rekha Datar of the Kinesiology Department of Simon Fraser University to participate in a research project experiment, I have read the procedures specified in the document entitled:
Information sheet for subjects:
THE EFFECTS OF ALCOHOL CONSUMPTION ON PLANNING FOR MOVEMENT
I understand the procedures to be used in this experiment and the personal risks to me in taking part. To the best of my knowledge I am in good health. I understand that I may withdraw my participation in this experiment at any time.
I also understand that I may register any complaint I might have about the experiment with the chief research named above or with Dr. J. Dickinson, Director of the Kinesiology Department, Simon Fraser University.
I may obtain a copy of the results of this study, upon its completion, by contacting Rekha Datar.
I agree to participate by sitting in the chair provided, while measures of reaction time, movement time are obtained as described in the document referred to above, during the period January 15, 1988 to May 15, 1988 at Motor Behaviour Lab. K9601, S.F.U.

APPENDIX B
LISTING OF THE APPLE II CONTROL PROGRAMME
10 HIMEM: 32760 11 GOT019 12 POKE - 16368.0: RETURN : REM CLEAR KEY INPUT 19 DW$ = CHR$ (27) + CHR$ (14) 20 POKE 33'40: REM NORMAL WIDTH SCREEN 30 REM REKHA MOTOR BEHAVIOR PROGAM 40 REM BY DALE PARKYN 421 -4137 SFU 1987O6,1988O412 50 REM 60 REM LAST UPDATE 19880413 70 REM 80 REM REM ZZf**ff*****CCCIC*******ttt****t***Ct*CtC****
100 REM CONSTANTS - if changed save a new version of program with the SAME NAME "REKHA - MAIN PROGRAM"
1 10 TI = 10: REM Inter Trial Interval : TI 0.1s = seconds 120 N = 50: REM MAXTRIAL# 130 MO$ = "Rekha's Reaction Roulette" 140 FR = 75:DU = 20: REM BUZZER FREQUENCY AND DURATION. 1 50 DIM MT(2), RT(2) 160 RT(1) = 100:RT(2) = 800: REM MIWAX REACTION TIMES FOR ERROR RECOGNTION 170MT(1)=50:MT(2)=600: REM MIIWMAXMOVEMENTTIMES FORERROR RECOGNITION 171 HOME : PRlNT MO$: VTAB 5: HTAB 10: INVERSE : PRlNT "SET TIMES": NORMAL 172 VTAB 10: CALL - 956: PRlNT "CURRENT SETTINGS"
173 VTAB 11 : CALL - 956: PRINT : PRlNT "MINIMUM REACTION TlME ";RT(1): PRINT : PRINT "ENTER NEW VALUE OR PRESS 'RETURN'": PRlNT "TO KEEP CURRENT SETTING": INPUT "VALUE (# OR 'RETURN') ";QA$: IF VAL (QA$) < > 0 THEN RT(1) = VAL @A$)
174 VTAB 11: CALL - 956: PRINT : PRINT "MAXIMUM REACTION TIME ";RT(2): PRINT : PRlNT "ENTER NEW VALUE OR PRESS 'RETURN'": PRlNT "TO KEEP CURRENT SETTING": INPUT "VALUE (# OR 'RETURN') ";CIA$: IF VAL @A$) < > 0 THEN RT(2) = VAL @A$)
175 VTAB 11 : CALL - 956: PRlNT : PRlNT "MINIMUM MOVEMENT TlME ";MT(1): PRINT : PRlNT "ENTER NEW VALUE OR PRESS 'RETURN'": PRlNT "TO KEEP CURRENT SEITING": INPUT "VALUE (#OR 'RETURN') ";CIA$: IF VAL (QA$) < > 0 M E N MT(1) = VAL @A$)
176 VTAB 11 : CALL - 956: PRINT : PRlNT "MAXIMUM MOVEMENT TlME ";MT(2): PRINT : PRlNT "ENTER NEW VALUE OR PRESS 'RETURN'": PRINT ''TO KEEP CURRENT SETTING": INPUT "VALUE (#OR 'RETURN') ";QA$: IF VAL ( a $ ) < > 0 THEN MT(2) = VAL (QA$)
178 VTAB 11 : CALL - 956: PRINT : PRINT "REACTION MIN ";RT(I): PRlNT " MAX ";RT(2): PRlNT : PRlNT "MOVEMENT MIN ";MT(I): PRlNT " MAX ";MT(2)
179 VTAB 20: CALL - 868: GOSUB 12: INPUT "ARE THESE CORRECT (YIN) ? ";AN$: IF AN$ < > "Y" M E N 171 189 REM ***f********f*ff**fC**CC+ZCZf*C*l*t*******ttt
190 REM 200 REM DIMENSHIONED VARIABLES 210 REM 220 DIM DA(N,2),SO(N,2),ME(2),T1(2),AV(2),SD(2),EC(3,2),ET(20),LC(16,3),SV(N),PC$(20) 221 REM 222 REM LOAD PRECUE STRINGS 223 REM

224 PC$(O) = " " 225 PC$(1) = " LU " 226 PC$(2) = " RU " 227 PC$(3) = " LD " 228 PC$(4) = " RD " 229 PC$(5) = " L "
230 PC$(6) = " R " 231 PC$(7) = " L " 232 PC$(8) = " R "
233 PC$(9) = " U " 234 PC$(10) = " U " 235 PC$(11) = " D " 236 PC$(12) = " D " 237 PS(13) = " " + CHR$ (92) + " " 238PC$(14)=" / " 239PC$(l5) = " / " 240 PC$(16) = " " + CHR$ (92) +" " 241 PC$(17)=" X " 242 PC$(18) = " X " 243 PC$(19) = " X " 244 PC$(20) = " X " 248 REM 249 REM LOAD MACHINE LANGUAGE SUBROUTINES 250 REM 260 PRlNT CHR$ (4);"BLOAD REKHA - $8000.1 988" 270 PRlNT CHR$ (4);"BLOAD REKHA - BUZZER": REM $320HEX 280 REM 290 REM CLEAR LEDS 300 REM
31 0 DATA -1 6292, -1 6291, -1 6294, -1 6293, -1 6290, -1 6289, -1 6296, -1 6295 : REM SW#1 ... 4 LED ON, LED OFF
320 DIM SW(4.2): REM X,l=LED ON ; X,2=LED OFF 330 FOR X = 1 TO 4: READ SW(XI1),SW(X,2): NEXT X 340 FOR X = 1 TO 4: POKE SW(X.2),0: NUCT X: REM TURN ALL LEDS OFF . .. 350 REM 360 REM LOAD LED CODES 370 REM
380 DATA 1,0,0,0, 2,0,0,0, 3,0,0,0, 4,0,0,0, 1,2,0,0, 3,4,0,0, 1,3,0,0, 2,4,0,0, 1,4,0,0, 2,3,0,0, 1,21384
381 DATA 1,2,3,4, 1,2,3,4, 1,2,3,4, 1,2,3,4, 1,2,3,4 390 FOR SC = 1 TO 16: FOR X = 0 TO 3: READ LC(SC,X): NEXT X: NEXT SC 400 REM 410 REM TESTS RUN? 420 REM 430 HOME : PRINT MO$ 440 VTAB 5: PRlNT "YOU SHOULD HAVE RUN M E LED DISPLAY" 450 PRlNT "CHECK AND PUSH BUlTON CHECK TESTS BY NOW 460 PRlNT "IF YOU HAVE NOT PLEASE DO SO NOW B Y 470 PRINT "TYPING 'CHECK' AND PRESSING 'RETURN'." 480 PRlNT "OTHERWISE, JUST PRESS 'RETURN'." 490 GOSUB 12: INPUT "ENTER HERE..."-AN$ 500 IF AN$ = "CHECK" THEN PRlNT CHR$ (4);"RUN HELLO" 510 GOT0 4150: REM JUMP TO MENU 520 REM 530 REM 540 REM JUMP HERE TO REPEAT SEQUENCE OF TRIALS 550 REM TASK ENTRY 560 REM

570 HOME : PRINT MO$ 580 IF NA$ = M E N A = 1 : GOSUB 4340: GOT0 570: REM GET A NAME 590 VTAB 3: PRlNT "SUBJECT NAME: ";NA$ 600 VTAB 5: CALL - 868:T4 = 10: PRlNT TAB( T4 - 6);"1,2,3,4 = LED'S #l,2,3,4" 601 PRlNT TAB( T4);"5 = LED 1 OR 2" 602 PRlNT TAB( T4);"6 = LED 3 OR 4" 603 PRlNT TAB( T4);7 = LED 1 OR 3" 604 PRIM TAB( T4);"8 = LED 2 OR 4" 605 PRlNT TAB( T4);"9 = LED 1 OR 4" 606 PRlNT TAB( T4 - l);"10 = LED 2 OR 3" 607 PRINT TAB( T4 - 1);"11 = LED 1,2,3, OR 4" 608 PRlNT TAB( T4 - 5);"VISUAL PRECUE:" 609 PRlNT TAB( T4 - 1);"12 = ALL RU,RD,LU,LD" 61 0 PRlNT TAB( T4 - 1) ;"I 3 = ARM" 61 1 PRlNT TAB( T4 - 1);"14 = DIRECTION" 61 2 PRlNT TAB( T4 - 1);"15 = DIAGONAL" 613 PRlNT TAB( T4 - 1);"16 = NO PRECUE 'X" 650 VTAB 4: CALL - 868: GOSUB 12: INPUT "WHICH S:R CODE (M-MENU) ";AN$ 660 IF AN$ = THEN PRlNT CHR$ (7): GOT0 650 670 SC = VAL (AN$) 680 IF (SC < 1 OR SC > 19) AND (SC < > 0) THEN PRlNT CHR$ (7): GOT0 650
690 IF NOT SC THEN PRINT CHR$ (4);"CLOSEW: RETURN : REM BACK TO MENU TO USE END
700 CALL - 958: REM CLEAR MINI MENU 710 VTAB 5: CALL - 868: GOSUB 12: INPUT "HOW MANY TRIALS ";TR 720 IF TR < 2 THEN PRlNT CHR$ (7)iNO WAY ... MINIMUM 2 TRIALS": GOT0 710 730 IF TR > N THEN PRlNT CHR$ (7);"MAXIMUM TRIALS ARE ";N;".": GOT0 71 0
740 IF (TR / 2 < > INT (TR / 2)) AND SC > 4 THEN PRlNT CHR$ (7);"SORRY - MUST BE EVEN NUMBER": GOT0 71 0
745 IFSC-11 ORSC=12ORSC=19THEN IFTR/4< > INT(TR/4)THEN PRlNT CHR$ (7);"SORRY - MUST BE A MULTIPLE OF 4": GOT0 710
750 CALL - 868: GOSUB 12: INPUT "ENTER FILE SUFFIX FOR SAVING DATA ";FI$ 760 FOR SP = 1 TO TR:SV(SP) = 0: NEXT SP: REM RESET SV 770 IF SC > = 1 AND SC < = 4 THEN GOSUB 1030: GOT0 1330 780 Dl = 2: REM sv(x) = (0,1 790 IF SC > 10 THEN Dl = 4: REM SV(X) = (0,1,2,3) 800 REM 810 REM NOW FOR CODES 5...11 820 REM 830 FOR DY = 1 TO Dl - 1 : REM WILL ALWAYS GO ONCE AT LEAST 840 FORXX=lTOTR/DI 850 SP = INT ( RND (XX) ' (TR - 1) + 0.5) + 1 860 IF SV(SP) THEN 850: REM SPOT ALREADY TAKEN 870 IF SP > 3 M E N X = SP - 3: GOT0 890 88OX= 1 890 IFSP>TR-3THENY=TR-3:GOTO910 900 Y = SP 910 SV(SP) = DY 920A=X
930 IF SV(A) = DY AND SV(A + 1) = DY AND SV(A + 2) = DY AND SV(A + 3) = DY THEN SV(SP) = 0: GOT0 850: REM TRY AGAIN
940 IFA<YTHENA=A+l:GOTO930 a50 REM CANT FIND FOUR IN LINE THEREFORE O.K. 960 NEXTXX 970 NEXT DY 980 REM SOME TRIALS HAVE BEEN SET AS NONE ZERO 990 GOSUB 1 100: GOT0 1330
1000 REM

1010 REM PRINT OUT SV 1020 REM 1030 FORSP= 1 TOTR 1040 PRlNT SV(SP);: IF SP / 10 = INT (SP / 10) THEN PRINT 1 050 NEXT SP 1060 RETURN 1070 REM 1080 REM CHECK ZEROES 1090 REM 11ooz=o 1110 FORSP=1 TOTR 1120 IF NOTSV(SP)THENZ=Z+1:GOTO1140 1130Z=O 1140 IFZ<4THEN 1280 115OL=SP-2 1160 REM LOCATE A SWAP SITE 1170L1 = lNT(RND(L)'(TR-1)+0.5)+1 1 180 IF SV(L) = SV(L1) THEN 1 170 1190 IF L1 > 3 THEN X= L1 -3: GOT0 1210 1200X= 1 1210 IFL1 >TR-3THENY-TR-3:GOTO1230 1220 Y = L1 1230 SV(L) = SV(Ll):SV(Ll) = 0 l24OA= X
1250 IF NOT SV(A) AND NOT SV(A + 1) AND NOT SV(A + 2) AND NOT SV(A + 3) M E N SV(L1) = SV(L):SV(Ll) = 0: GOT0 11 70: REM TRY AGAIN
1260 IFA<YTHENA=A+l:GOTO1250 1270 Z = 2: REM NEW ZERO COUNT 1280 NEXT SP 1290 RETURN 1300 REM 1310 REM DISPLAY TASK DATA 1320 REM 1330 HOME : PRINT MO$ 1340 VTAB 10: HTAB 25: PRlNT "NEXT S:R : ": CALL - 868 1350 VTAB 5 1360 PRINT " S:R CODE : ";SC 1370 PRINT " # OF TRIALS : ";TR 1380 PRINT "SAVING DATA IN : 'DATA.";FI$;"" 1390 VTAB 12: HTAB 25: PRINT "TRIAL OF ";TR 1400 PRINT : HTAB 25: PRINT "HOME KEY :" 141 0 HTAB 29: PRINT "TIME :" 1420 PRINT : HTAB 23: PRINT "TARGET KEY :" 1430 HTAB 29: PRlNT "TIME :" 1440 PRINT : HTAB 18: PRlNT "TRIALS - GOOD :" 1450 HTAB 25: PRINT "- RE-DO :" 1460 POKE 769,Tl: REM INTER TRIAL INTERVAL $301 H 1470 REM 1480 ER = 0:EO = 0:GT = 0:BT = 0: REM CLEAR ERROR COUNT AND ET POINTER 1490 REM 1500 VTAB 22: CALL - 958: GOSUB 12: INPUT "ENTER 'GO' TO BEGIN TRAILS ..."; AN$ 1501 IF AN$ = "Mu M E N 570: REM GO TO THE MENU 1502 IF AN$ < > "GO" THEN PRINT CHR$ (7): GOT0 1500 1515 FOR X = 1 TO N: FOR T = 0 TO 2:DA(X,T) = 0: NEXT T: NEXT X 1516 FOR EO = 1 TO 10:ET(EO) = 0: NEXT E0:EO = 0
1520 FOR X = 1 TO 3: FOR XX = 1 TO 2:EC(X,XX) = 0: NEXT XX: NEXT X: REM CLEAR ERROR TYPE COUNTS
1530 REM

1540 REM AUTOMATED TRIAL SEQUENCE 1550 REM 1558 MP = 0: REM CLEAR ERRONEOUS TRIAL COUNTER 1559 POKE - 16368,O: REM CLEAR KEYBOARD 1560 FOR TX- 1 TOTR 1561 VTAB 20: HTAB 1 : INVERSE : PRlNT "'ESCAPE' ACTIVE": NORMAL 1562 IF PEEK ( - 16384) < > 155 THEN 1570: REM ESCAPE CODE 1563 VTAB 20: HTAB 1 : CALL - 956: REM CLEAR BOlTOM 1564 FLASH : PRINT "IN-'PAUSE' STATE" 1565 PRINT "PRESS 'CTRL G' TO RESUME": NORMAL 1566 IF PEEK ( - 16384) < > 135 THEN 1566: REM CTRL-G CODE 1567 VTAB 20: PRINT " ": PRINT " I
1570 SR = LC(SC,SV(TX)): POKE 768,SR: REM SR PAIR $300H 1580 VTAB 10: HTAB 37: PRINT SR
1590 POKE 779,DU: POKE 780,FR: REM $30B1$30C FOR BUZZER ROUTINE CALLED BY ML ROUTINE
1600 POKE 770. INT ( RND (3) 20 + 0.51 + 10: REM VALUE BETWEEN 10 AND 30 DECISECONDS' '
1601 POKE 783,O:XX = 0: REM XX PICKS PRECUE STRING FROM PC$(XX) 1602 IF SC > 11 THEN POKE 783. INT ( RND (3) * 10 + 0.5) + 5:XX = (SC - 12) 4 + SR: REM
1609 FOR X = 0 TO 5: POKE 784 + X, ASC ( MID$ (PC$(XX),X + 1 ,I)) + 128: NEXT : REM 1 CHARACTER OF PRECUE STRING
161 0 CALL 32768: REM $8000H 1620 REM 1630 REM ANALYZE TRIAL DATA 1640 REM 1) KEY ERROR(S) 1650 REM 1660 E l = 0:E2 = 0:E3 = 0:E4 = 0:E5 = 0:E6 5 0:E7 = 0:E8 = 0: REM ZERO ERROR CODES 1670 HK = PEEK (771):RK = PEEK (772): REM CLEAR ERROR CODE 1680 IFSR<=2THEN IFRK=OTHENEl=l:REM DOWN 1690 IFSR>2MEN IFRK=lTHENE2=1:REM UP 1700 IF SR / 2 = INT (SR / 2) THEN IF HK = 1 THEN E3 = 1 : REM LEFT 1710 IFSRI2e > INT(SRl2)MEN IFHK-OWEN E4=1:REM RIGHT 1720 REM 1730 REM CALCULATE RAW TIMES 1740 REM 1750 FORX=OTO2 1760TH= PEEK(773+2*X):HU= PEEK(774+2*X) 1770WW= INT(ll4/16) 1780XX-TH-W*16 1790 W = INT (HU / 16) 1 8 0 0 n = H U - W * 16 1810~(X)=10*WW+XX+1000*W+lOO*ZZ 1820 NEXT X 1830 REM 1840 REM CONVERT RAW TIMES TO ELAPSED TIMES 1850 REM 2) TIME ERROR(S) 1860 RT = Tl(1) - TI(0): IF RT < 0 THEN RT = RT + 16000: REM REACTION TIME 1870 MT = n(2) - n( i ) : IF MT < o THEN MT = MT + 16000: REM MOVEMENTTIME 1880 IF RT < RT(1) THEN E5 = 1 : REM TOO SHORT - NOT PROPERLY SET? 1 890 IF RT > RT(2) THEN E6 = 1 : REM TOO LONG 1900 IF MT < MT(1) THEN €7 = 1 : REM TOO SHORT - NOT PROPERLY SET? 1 91 0 IF MT > MT(2) THEN E8 = 1 : REM TOO LONG 1930 IF E l OR E2 THEN EC(1,2) = EC(1,2) + 1: REM DIRECTION ERRORS 1940 IF E3 OR E4 THEN EC(l '1) = EC(l '1) + 1: REM HAND ERRORS 1950 IF E5 THEN EC(3,l) = EC(3,l) + 1: REM RT SHORT ERRORS 1960 IF E6 THEN EC(2,l) = EC(2,l) + 1: REM RT LONG ERRORS
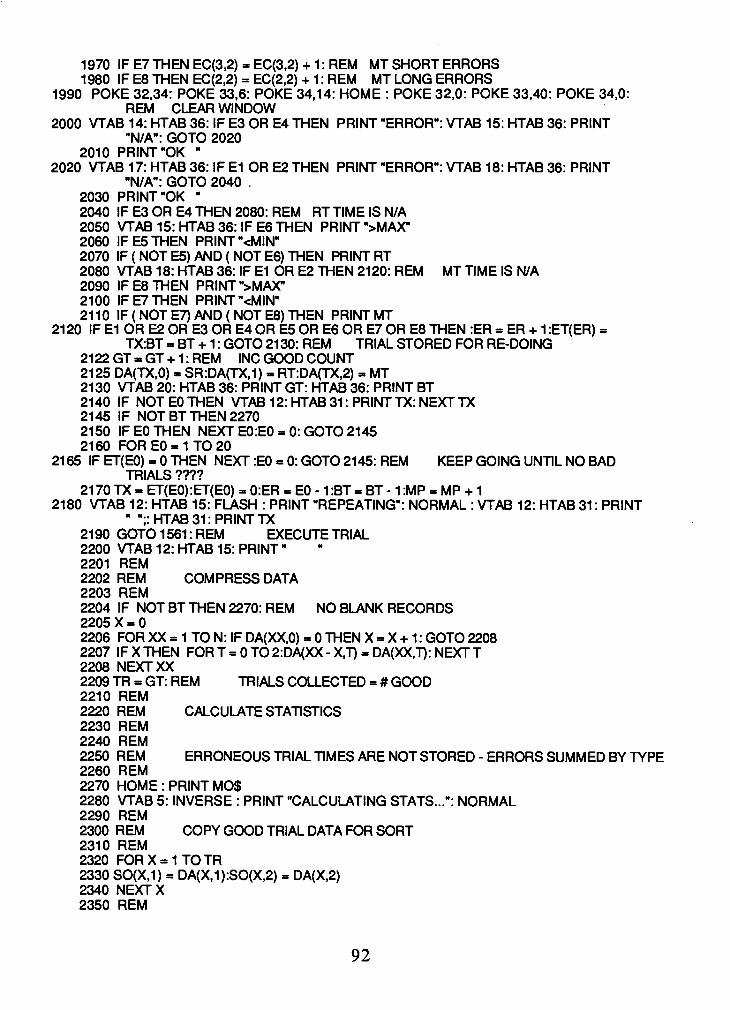
1970 IF E7 M E N EC(3,2) = EC(3,2) + 1: REM MT SHORT ERRORS 1980 IF E8 THEN EC(2,2) = EC(2,2) + 1: REM MT LONG ERRORS
1990 POKE 32,34: POKE 33,6: POKE 34,14: HOME : POKE 32,O: POKE 33,40: POKE 34,O: REM CLEAR WINDOW
2000 VTAB 14: HTAB 36: IF E3 OR E4 THEN PRlNT "ERROR": VTAB 15: HTAB 36: PRlNT "N/AW: GOT0 2020
2010 PRINT "OK " 2020 VTAB 17: HTAB 36: IF E l OR E2 THEN PRlNT "ERROR": VTAB 18: HTAB 36: PRlNT
"NJA": GOT0 2040 . 2030 PRINT "OK " 2040 IF E3 OR E4 M E N 2080: REM RT TlME IS N/A 2050 VTAB 15: HTAB 36: IF E6 M E N PRlNT ">MAX" 2060 IF E5 M E N PRINT "<MINm 2070 IF ( NOT E5) AND ( NOT E6) THEN PRlNT RT 2080 VTAB 18: HTAB 36: IF E l OR E2 THEN 2120: REM MT TlME IS N/A 2090 IF E8 THEN PRlNT ">MAX" 2100 IF E7 M E N PRINT "<MINN 21 10 IF ( NOT E7) AND ( NOT E8) THEN PRlNT MT
2120 IF E l OR E2 OR E3 OR E4 OR E5 OR E6 OR E7 OR E8 THEN :ER = ER + 1 :ET(ER) = TX:BT = BT + 1 : GOT0 2130: REM TRIAL STORED FOR RE-DOING
2122 GT = GT + 1 : REM INC GOOD COUNT 2125 DA(TX,O) = SR:DA(TX,l) = RT:DA(TX,2) = MT 2130 VTAB 20: HTAB 36: PRlNT GT: HTAB 36: PRlNT BT 2140 IF NOTEOMEN VTAB 12:HTAB31: PR1NTTX:NEXTTX 2145 IF NOTBTMEN2270 2150 IF EO M E N NEXT E0:EO = 0: GOT0 2145 21 60 FOR EO = 1 TO 20
21 65 IF ET(E0) = 0 THEN NEXT :EO = 0: GOT0 2145: REM KEEP GOING UNTIL NO BAD TRIALS ????
2170 TX = ET(EO):ET(EO) = 0:ER = EO - 1 :BT = BT - 1 :MP = MP + 1 2180 VTAB 12: HTAB 15: FLASH : PRINT "REPEATING": NORMAL : VTAB 12: HTAB 31 : PRlNT
" ";: HTAB 31 : PRlNT TX 2190 GOT0 1561: REM EXECUTE TRIAL 2200 VTAB 1 2: HTAB 15: PRINT " " 2201 REM 2202 REM COMPRESS DATA 2203 REM 2204 IF NOT BT M E N 2270: REM NO BLANK RECORDS 2205 X = 0 2206 FOR XX = 1 TO N: IF DA(XX.0) = 0 THEN X = X + 1: GOT0 2208 2207 IF X THEN FOR T = 0 TO 2:DA(XX - X,T) = DA(XX,T): NEXT T 2208 NEXT XX 2209 TR = GT: REM TRIALS COLLECTED = # GOOD
REM REM CALCULATE STATISTICS REM REM REM ERRONEOUS TRIAL TIMES ARE NOT STORED - ERRORS SUMMED BY TYPE REM HOME : PRlNT MO$ VTAB 5: INVERSE : PRlNT "CALCULATING STATS ..." : NORMAL REM REM COPY GOOD TRIAL DATA FOR SORT REM FORX-1 TOTR
2330 SO(X,1) = DA(X,1):SO(XI2) = DA(X,2) 2340 NEXT X 2350 REM

2360 REM CLEAR SWAP FLAG AND CYCLES 2370 REM 2380 SW = 0:CY = 0 2390 REM 2400 REM BUBBLE SORT BOTH RT AND MT 2410 REM 2420 FOR XX = 1 TO 2 2430 CY = 0: VTAB 20: CALL - 868: IF XX = 1 THEN PRINT "RT SORT - "; 2440 IF XX = 2 THEN PRINT "MT SORT - "; 2450 PRINT " CYCLE : " 2460 FORXs1 TOTR-1 -CY 2470 REM VTAB 15: HTAB 10: PRINT "Line 677 X= ";X;" "; TAB( 30) ;Urn = -;XX;~ " 2480 IF SO(X,XX) < = SO(X + 1 ,XX) THEN 2500 2490 T = SO(X,XX):SO(X,XX) = SO(X + 1 ,XX):SO(X + 1 ,XX) = T:SW +: 1 2500 NEXT X 251 0 VTAB 20: HTAB 20: PRINT CY + 1 ;" " 2520 IF SW THEN SW = 0:CY = CY + 1 : GOT0 2460 2530 NUCT XX: REM DO MT ONLY WHEN RT SORTED 2540 REM 2550 REM FIND MEDIAN 2560 REM 2570 FOR X = 1 TO 2
2580 IF TR 12 = INT (TR 12) THEN 2610: REM EVEN NUMBER OF TRIALS - AVERAGE TWO VALUES
2590 REM ODD # TRIALS - USE CENTRAL 2600 ME(X) = SO( INT (TR 1 2 + 0.501),X): GOT0 2630 2610T=TR/2 2620 ME(X) = (SO(T,X) + SO(T + 1 ,X)) 12 2630 NEXT X 2640 REM 2650 REM FIND MEANS 2660 REM 2670 AV(1) = 0:AV(2) = 0: REM CLEAR PREVIOUS VALUES 2680 FOR X = 1 TO TR 2690 FORXX-1 TO2 2700 AV(XX) = AV(XX) + DA(X,XX) 2710 NEXT XX: NEXT X 2720 AV(1) = AV(1) I TR 2730 AV(2) = AV(2) I TR 2740 REM 2750 REM FIND STANDARD DEVIATIONS 2760 REM 2770 SD(1) = OzSD(2) = 0: REM CLEAR OLD 2780 FOR X = 1 TO TR 2790 FOR XX = 1 TO 2 2800 SD(XX) = SD(XX) + (DA(X,XX) - AV(XX)) A 2 2810 NUCTXX: NEXTX 2820 SD(1) = SQR (SD(1) I (TR - 1)) 2830 SD(2) = SQR (SD(2) I (TR - 1)) 2840 REM 2850 REM DISPLAY STATISTICS 2860 REM 2870 HOME : PRINT MO$; TAB( 27);"- DATA" 2880 VTAB 3: PRINT "S:R CODE : ";SC
2890 VTAB 5: PRINT "#"; TAB( 4);"SRW; TAB( 9);"RT"; TAB( 15);"MT; TAB( 20);"#"; TAB( 23);"SRW; TAB( 28);"RTW; TAB( 34);"MT"
2900 POKE 345: REM SET TOP MARGIN OF TEXT WINDOW TO MAINTAIN TITLES 291 0 VTAB 6
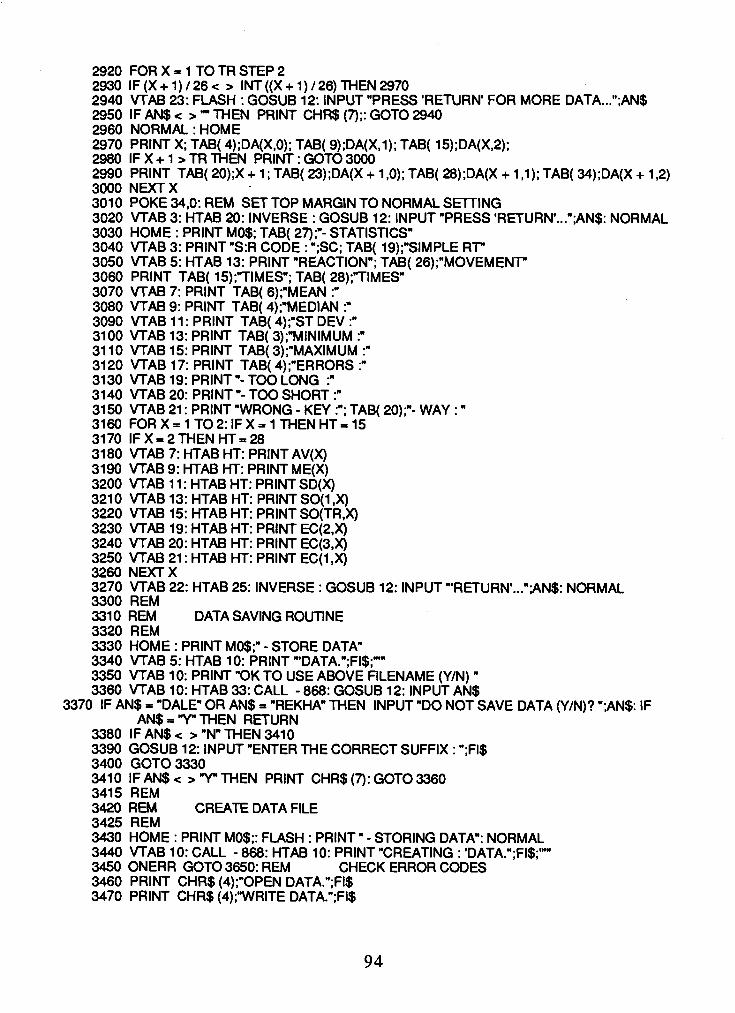
2920 FOR X = 1 TO TR STEP 2 2930 IF (X + 1) / 26 < > INT ((X + 1) / 26) THEN 2970 2940 VTAB 23: FLASH : GOSUB 12: INPUT "PRESS 'RETURN' FOR MORE DATA ..."; AN$ 2950 IF AN$ < > M E N PRlNT CHR$ (7);: GOT0 2940 2960 NORMAL : HOME 2970 PRlNT X; TAB( 4);DA(X,O); TAB( 9);DA(X,1); TAB( 15);DA(X,2); 2980 IF X + 1 > TR THEN PRINT : GOT0 3000 2990 PRlNT TAB( 20);X + 1 ; TAB( 23);DA(X + 1'0); TAB( 28);DA(X + 1 ,I); TAB( 34);DA(X + 1'2) 3000 NEXT X 3010 POKE 34'0: REM SET TOP MARGIN TO NORMAL S m I N G 3020 VTAB 3: HTAB 20: INVERSE : GOSUB 12: INPUT "PRESS 'RETUR N'..."; AN$: NORMAL 3030 HOME : PRINT MO$; TAB( 27);"- STATISTICS" 3040 VTAB 3: PRlNT "S:R CODE : ";SC; TAB( 19);"SIMPLE RT" 3050 VTAB 5: HTAB 13: PRINT "REACTION"; TAB( 26);"MOVEMENT" 3060 PRlNT TAB( 15);"TlMES"; TAB( 28);"TlMESW 3070 VTAB 7: PRlNT TAB( 6);"MEAN :" 3080 VTAB 9: PRlNT TAB( 4);"MEDIAN :" 3090 VTAB 11 : PRlNT TAB( 4);"ST DEV :" 3100 VTAB 13: PRINT TAB( 3);"MINIMUM :" 31 10 VTAB 15: PRlNT TAB( 3);"MAXIMUM :" 31 20 VTAB 17: PRlNT TAB( 4);"ERRORS :" 3130 VTAB 19: PRINT "- TOO LONG :" 3140 VTAB 20: PRlNT "- TOO SHORT :" 3150 VTAB 21 : PRINT "WRONG - KEY :"; TAB( 20);"- WAY : " 3160 FORX=lT02: IFX= lMENHT=15 3170 IFX=2THENHT=28 31 80 VTAB 7: HTAB HT: PRINT AV(X) 3190 VTAB 9: HTAB HT: PRlNT ME(X) 3200 VTAB 11 : HTAB HT: PRINT SD(X) 321 0 VTAB 13: HTAB HT: PRlNT SO(l ,X ) 3220 VTAB 15: HTAB HT: PRlNT SO(TR,X) 3230 VTAB 19: HTAB HT: PRlNT EC(2,X) 3240 VTAB 20: HTAB HT: PRlNT EC(3,X) 3250 VTAB 21: HTAB H i : PRlNT EC(1,X) 3260 NEXT X 3270 VTAB 22: HTAB 25: INVERSE : GOSUB 12: INPUT "'RETUR N'..."; AN$: NORMAL 3300 REM 3310 REM DATA SAVING ROUTINE 3320 REM 3330 HOME : PRINT MO$;" - STORE DATA" 3340 VTAB 5: HTAB 10: PRlNT "'DATA.";FI$;"'" 3350 VTAB 10: PRlNT "OK TO USE ABOVE FILENAME (Y/N) " 3360 VTAB 10: HTAB 33: CALL - 868: GOSUB 12: INPUT AN$
3370 IF AN$ = "DALE" OR AN$ = "REKHA" M E N INPUT "DO NOT SAVE DATA (YIN)? ";AN$: IF AN$ = "Y" M E N RETURN
3380 IF AN$ < > "Nu THEN 341 0 3390 GOSUB 12: INPUT "ENTER THE CORRECT SUFFIX : ";FI$ 3400 GOT0 3330 3410 IF AN$ < > "Y" M E N PRlNT CHR$ (7): GOT0 3360 3415 REM 3420 REM CREATE DATA FlLE 3425 REM 3430 HOME : PRINT MO$;: FLASH : PRINT" - STORING DATA": NORMAL 3440 VTAB 10: CALL - 868: HTAB 10: PRlNT "CREATING : 'DATA.";FI$;"" 3450 ONERR GOT0 3650: REM CHECK ERROR CODES 3460 PRINT CHR$ (4);"OPEN DATA.";FI$ 3470 PRlNT CHR$ (4);"WRITE DATA.";FI$


3900 PRlNT TAB( T4);" ST DEV ";SD(1);: POKE 36,T5: PRINT SD(2) 3910 PRlNT TAB( T4);" MINIMUM ";S0(1 ,I);: POKE 36,T5: PRINT S0(1,2) 3920 PRlNT TAB( T4);" MAXIMUM ";SO(TR,l);: POKE 36,T5: PRINT SO(TR,2) 3930 PRINT : POKE 36,17: PRINT DW$;"ERRORSW 3940 PRINT TAB( T4);" TOO LONG ";EC(2,1);: POKE 36.T5 + 2: PRlNT EC(2,2) 3950 PRlNT TAB( T4);" TOO SHORT ";EC(3,1);: POKE 36,T5 + 2: PRlNT EC(3.2)
3960 POKE 36,T4: PRlNT " WRONG KEY ";EC(1 ,I);: POKE 36,19: PRlNT "WRONG WAY";: POKE 36,29: PRlNT EC(1,2)
3965 PRlNT "ERRONEOUS'TRIALS -- ";MP 3970 PRINT : PRINT : PRINT : PRINT : POKE 36,13: PRlNT DW$;"TRIAL DATA": PRlNT 3979 PRINT CHR$ (27) + CHR$ (108) + CHR$ (20) 3980 PRINTw# S:R RT MT # S:R RT MT" 3990 FOR TX = 1 TO TR STEP 2 4000 PRlNT TX; TAB( 5);DA(TX,O); TAB( 9);DA(TX, 1); TAB( 14);DA(TX,2);
4001 IF TX + 1 < = TR THEN PRlNT TAB( 21);TX + 1 ; TAB( 25);DA(TX + 1,O); TAB( 29);DA(TX + 1 ,I); TAB( 34);(DA(TX + 1,2))
4030 N W T X 4040 PRINT CHR$ (12): PR# 0: POKE 33,40: REM RESET TO VIDEO 4050 RETURN 4060 REM 4070 REM END ROLmNE 4080 REM 4100 HOME : PRINT CHR$ (4);"CLOSEw: VTAB 10: PRINT" NORMAL COMPLETION - BYE" 4110 END 4120 REM 4130 REM MENU ROUTINE 4140 REM 4150 HOME : PRINT MO$;" - MENU" 4160 VTAB 5: HTAB 10: PRINT "CHOOSE OPTION BY NUMBER" 4170 PRlNT "1) ";: FLASH : PRINT "CHANGE";: NORMAL : PRlNT " THE SUBJECT NAME"
4180 PRlNT "2) ";: FLASH : PRlNT "HARDCOPY";: NORMAL : PRINT " TRIALS AND STATISTICS"
4190 PRlNT "3) ";: FLASH : PRlNT "EXECUTE";: NORMAL : PRINTw ANOTHER SET OF TRIALS"
4200 PRlNT "4) ";: FLASH : PRINT "END";: NORMAL : PRINT " - FINISHED FOR NOW 4210 REM PRlNT "5) ";: FLASH : PRINT "RELOAD";: NORMAL : PRINT " DATA FOR
HARDCOPY" 4220 VTAB 11 : PRINT "ENTER OPTION # " 4230 VTAB 1 1 : HTAB 16: CALL - 868: INPUT AN$: IF AN$ = '" THEN 4270 4240 IF AN$ = "DALE" THEN A = 6: GOT0 4280 4250 A = VAL (AN$) 4260 IF A > = 1 AND A < = 5 THEN 4280 4270 PRlNT CHR$ (7): GOT0 4230 4280 QG = 0: ON A GOSUB 4340,4440,570,4070,4440,4830 4290 REM LEAVE REM IN 4300 GOT0 41 50 4310 REM 4320 REM ENTEWCHANGE SUBJECT NAME 4330 REM 4340 HOME : PRINT MO$;" - SUBJECT NAME"
4350 VTAB 18: FLASH : PRINT "NOTICE";: NORMAL : PRlNT " : When you start a set of trials": PRINT "on a NEW subject remember to use :": PRINT : PRlNT "'CHANGE SUBJECT NAME' - menu option 1"
4360 VTAB 10: PRlNT "CURRENT NAME : ";NA$ 4370 PRINT " NEW NAME : ": CALL - 868 4380 VTAB 11 : HTAB 16: GOSUB 12: INPUT NA$ 4390 IF NA$ = "" THEN PRlNT CHR$ (7): GOT0 4360 4400 RETURN
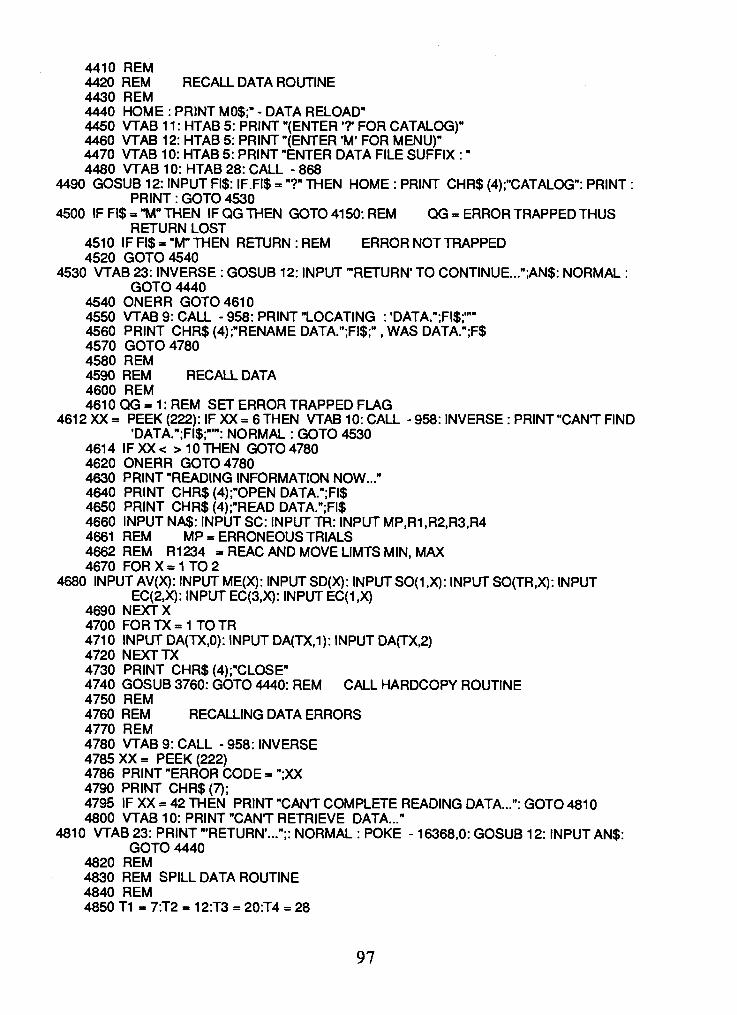
4410 REM 4420 REM RECALL DATA ROUTINE 4430 REM 4440 HOME : PRINT MO$;" - DATA RELOAD" 4450 VTAB 11 : HTAB 5: PRlNT "(ENTER 'T FOR CATALOG)" 4460 VTAB 12: HTAB 5: PRlNT "(ENTER 'M' FOR MENU)" 4470 VTAB 10: HTAB 5: PRlNT "ENTER DATA FILE SUFFIX : " 4480 VTAB 10: HTAB 28: CALL - 868
4490 GOSUB 12: INPUT FI$: IF.FI$ = "?"MEN HOME : PRINT CHR$ (4);"CATALOGW: PRINT : PRlNT : GOT0 4530
4500 IF FI$ = "Mu THEN IF QG THEN GOT0 4150: REM QG = ERROR TRAPPED THUS RETURN LOST
4510 IF FI$ = "M" M E N RETURN : REM ERROR NOT TRAPPED 4520 GOT0 4540
4530 VTAB 23: INVERSE : GOSUB 12: INPUT "RETURN' TO CONTINUE ..."; AN$: NORMAL : GOT0 4440
4540 ONERR GOTO4610 4550 VTAB 9: CALL - 958: PRlNT "LOCATING : 'DATA.";FI$;"'" 4560 PRlNT CHR$ (4);"RENAME DATA.";FI$;" , WAS DATA.";F$ 4570 GOT0 4780 4580 REM 4590 REM RECALL DATA 4600 REM 4610 QG = 1 : REM SET ERROR TRAPPED FLAG
4612 XX = PEEK (222): IF XX = 6 THEN VTAB 10: CALL - 958: INVERSE : PRlNT "CANT FIND 'DATA.";FI$;"'": NORMAL : GOT0 4530
4614 IFXXc > 10THEN GOTO4780 4620 ONERR GOTO4780 4630 PRINT "READING INFORMATION NOW ..." 4640 PRlNT CHR$ (4);"OPEN DATA.";FI$ 4650 PRlNT CHR$ (4);"READ DATA.";FI$ 4660 INPUT NA$: INPUT SC: INPUT TR: INPUT MP,R1 ,R2,R3,R4 4661 REM MP = ERRONEOUS TRIALS 4662 REM R1234 =REACANDMOVELlMTSMIN,MAX 4670 FOR X = 1 TO 2
4680 INPUT AV(X): INPUT ME(X): INPUT SD(X): INPUT SO(1,X): INPUT SO(TR,X): INPUT EC(2,X): INPUT EC(3,X): INPUT EC(l ,X)
4690 NEXT X 4700 FOR TX = 1 TO TR 4710 INPUT DA(TX,O): INPUT DA(TX'1): INPUT DA(TX,2) 4720 NUCT TX 4730 PRlNT CHR$ (4);"CLOSE" 4740 GOSUB 3760: GOT0 4440: REM CALL HARDCOPY ROUTINE 4750 REM 4760 REM RECALLING DATA ERRORS 4770 REM 4780 VTAB 9: CALL - 958: INVERSE 4785 XX = PEEK (222) 4786 PRlNT "ERROR CODE = ";XX 4790 PRlNT CHR$ (7); 4795 IF XX = 42 THEN PRlNT "CAN'T COMPLETE READING DATA...": GOT0 4810 4800 VTAB 1 0: PRlNT "CAN'T RETRIEVE DATA ..."
4810 VTAB 23: PRlNT "'RETURN'...";: NORMAL : POKE - l6368,O: GOSUB 12: INPUT AN$: GOT0 4440
4820 REM 4830 REM SPILL DATA ROUTINE 4840 REM 4850 T I = 7:T2 = 12:T3 = 20:T4 = 28

4851 HOME : PRlNT "PLEASE PREPARE PRINTER" 4852 PRlNT W P E 'MORE' TO CONTINUE..."; 4853 GOSUB 12: INPUT ANS$ 4854 IF ANS$ c > "MORE" M E N 4851 4855 PR# 1 4856 PRlNT
4860 PRlNT " S:R"; TAB( T1);"RT"; TAB( T2);"MT"; TAB( T3 - 3);"SORT RT"; TAB( T4 - 3);"SORT MT"
4870 FOR X = 1 TO TR 4880 PRlNT X; TAB( 4);SV(X); TAB( Tl);DA(X.l); TAB( T2);DA(X.2); TAB( T3);SO(X,1); TAB(
T4);SO(X,2) 4890 NEXT X 4900 STOP 491 0 RETURN : REM TO MENU 4999 END 5000 FI$ = "SOURCE.LIST" 5001 PRlNT CHR$ (4);"OPEN ";FI$ 5002 PRINT CHR$ (4);"WRITE ";FI$ 5003 LIST 5004 PRlNT CHR$ (4);"CLOSE" 5005 END
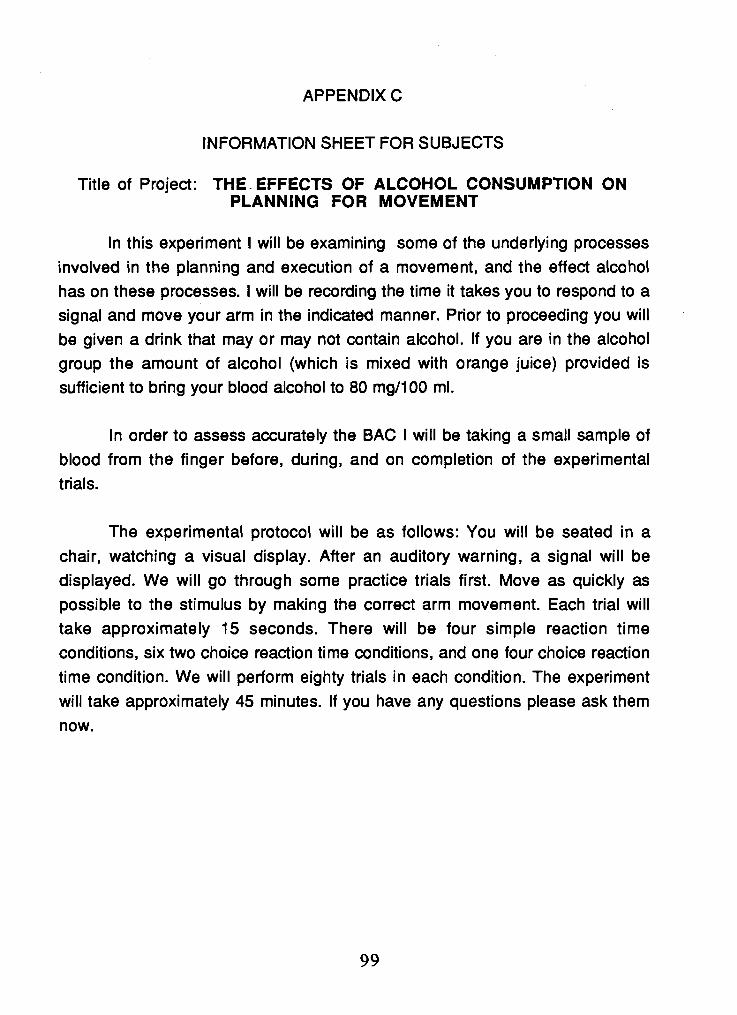
APPENDIX C
INFORMATION SHEET FOR SUBJECTS
Title of Project: THE. EFFECTS OF ALCOHOL CONSUMPTION ON PLANNING FOR MOVEMENT
In this experiment I will be examining some of the underlying processes involved in the planning and execution of a movement, and the effect alcohol has on these processes. I will be recording the time it takes you to respond to a signal and move your arm in the indicated manner. Prior to proceeding you will be given a drink that may or may not contain alcohol. If you are in the alcohol group the amount of alcohol (which is mixed with orange juice) provided is sufficient to bring your blood alcohol to 80 mgI100 ml.
In order to assess accurately the BAC I will be taking a small sample of blood from the finger before, during, and on completion of the experimental trials.
The experimental protocol will be as follows: You will be seated in a chair, watching a visual display. After an auditory warning, a signal will be displayed. We will go through some practice trials first. Move as quickly as possible to the stimulus by making the correct arm movement. Each trial will take approximately 15 seconds. There will be four simple reaction time conditions, six two choice reaction time conditions, and one four choice reaction time condition. We will perform eighty trials in each condition. The experiment will take approximately 45 minutes. If you have any questions please ask them now.

APPENDIX D
DEMOGRAPHIC AND MEDICAL INFORMATION
1. NAME:
2. AGE:
3. HEIGHT:
4. WEIGHT (KILOGRAM): 5. TYPE OF DRINKER: (ABSTINENT, MODERATE, HEAVY, OR A SOCIAL
DRINKER):
6. WEEKLY CONSUMPTION: TOTAL AMOUNT
BEER (PINTS)
OR WlNE
OR ANY OTHER LIQUOUR
7. MONTHLY CONSUMPTION:
BEER (PINTS)
OR WlNE
OR ANY OTHER LIQUOUR
TOTAL AMOUNT
8. WHEN WAS THE LAST TlME YOU HAD ANY ALCOHOLIC BEVERAGES?
WHAT?
AMOUNT?
9. WHEN WAS THE LAST TlME YOU HAD ANY FOOD?
WHAT?
10. HAVE YOU BEEN KEEPING REGULAR SLEEPING HOURS LATELY?
IF NOT, HOW HAVE THEY BEEN DIFFERENT?
11. ARE YOU CURRENTLY TAKING ANY MEDICATIONS?
WHAT? (INCLUDE VITAMINS)
12. DO YOU SMOKE? IF YES, HOW MANY?

MEDICAL HISTORY
NAME:
AGE:
WEIGHT:
HEIGHT:
CHECK (X) IF ANSWER IS YES:
PAST HISTORY
HAVE YOU EVER HAD
RHEUMATIC FEVER ( )
HEART MURMUR ( 1
HIGH BLOOD PRESSURE ( )
ANY HEART TROUBLE ( 1
DISEASE OF ARTERIES ( )
VARICOSE VEIN ( 1 LUNG DISEASE ( 1
OPERATIONS ( )
EPILEPSY ( )
SPELLS OF SEVERE DIZZINESS
PRESENT SYMPTOMS
HAVE YOU RECENTLY HAD
CHEST PAINS
SHORTNESS OF BREATH
HEART PALPITATIONS
COUGH ON EXERTION
COUGHING OF BLOOD
BACK PAIN
SWOLLEN, STIFF OR PAINFUL
JOINTS
MUSCLE OR TENDON INJURY
IS THERE A GOOD PHYSICAL REASON NOT MENTIONED HERE WHY YOU
SHOULD NOT PARTICIPATE IN CERTAIN TYPES OF PHYSICAL ACTIVITY,
EVEN IF YOU WANTED TO ?
SUBJECTS SIGNATURE:

APPENDIX E
PILOT WORK
Preamble: Prior to conducting experiments on the effects of alcohol on movement
preparation, it was necessary to obtain initial information on the blood alcohol curve over the planned test time. Below is the method used in the establishment of the blood alcohol curve.
Subject : Four subjects between 20 and 30 years of age served as subjects. The
subjects were accustomed to alcohol and had no medical conditions that
contraindicated alcohol consumption. The subjects were not taking any prescribed medications or taking drugs of any kind.
Beverage: The alcohol dose consisted of 2 milliliters of vodka per kilogram body
weight. The subject were instructed not to consume alcoholic beverage outside the experimental situation and to fast for four hours minimum, prior to the testing session. The scheduled dose was combined with four parts of orange juice.
Blood Samples After the consumption of the drink, blood samples were with drawn from
finger tips. The drink was divided in five equal parts and subjects were required to finish one fifth of the drink in two minutes. Thus, they were given ten minutes to complete the drink. The first blood sample was taken 15 minutes after consumption of the drink and repeated every 15 minutes until six samples were obtained.
Results: The blood samples were sent to B. C. Biomedical Laboratories for
analysis. Data of one subject had to be discarded as not enough blood was obtained from the finger tips. In one subject only four samples were obtained.

Time Subject 1 Subject 2 Subject 3 (mg%) . (mg%) (mg%)
15 minutes 18.00 46.52 29.94 30 minutes 27.64 57.58 45.00 45 minutes 41 .OO 54.81 50.00 60 minutes 43.30 58.04 54.80 1 hour and 15 minutes 52.51 50.67 1 hour and 30 minutes 50.67 53.43
As the BAC reached a maximum of only 58.04 mg%, an increase in amount of alcohol was thought to be necessary. Gusfatson (1986), also used vodka and he has reported to achieve a BAC of 80 mg % using 2.2 ml of vodka per kilogram body weight diluting it with orange juice in the ratio of 1:3. Therefore, an alcohol dose of 2.2 milliliters of alcohol per kilogram of body weight was administered to the subjects during the experimental sessions.

APPENDIX F
HEIGHT, WEIGHT AND DOSAGE CHART.
SUBJECT AGE HEIGHT WEIGHT ALCOHOL PLACEBO (#) (YEARS) (FEET) (KG) (ML) (ML)
Alcohol was diluted with orange juice in the ratio of 1 : 3. In the placebo condition 2 milliliters of vodka was added on top of the orange juice and also on the rim of the glass. Both the drinks were given chilled.

APPENDIX G
Specimen Collection, storage and analysis:
The site of finger puncture was cleaned and disinfected. Sterile disposable lancets were used. About 250 milliliters of blood was withdrawn. The blood specimen was placed in a chemically clean, dry vials with plastic rubber liners. The vials contained anticoagulants and preservative. The blood was mixed thoroughly with the anticoagulant and preservative and stored at 4
degrees Celsius. The samples were then sent to the B. C. Biomedical Laboratories for analysis. The blood alcohol was analyzed according to the Calbiochem-Ethyl Alcohol Reagents, based on the procedure originally developed by Behring Diagnostics (1986). The sensitivity of the method is 0.01 gram alcohol per dL sample.

APPENDIX H
INFORMATION SHEET FOR SUBJECTS
TITLE OF THE PROJECT: THE EFFECTS OF ALCOHOL CONSUMPTION ON PLANNING FOR MOVEMENT
In this experiment I will be examining some of the underlying processes involved in the planning and execution of a movement, and effect alcohol has on these processes. I will be recording the time it takes you to respond to a signal and move your arm in the indicated manner. Prior to proceeding you will be given a drink that may or may not contain alcohol. If you are in the alcohol group, the amount of alcohol (vodka mixed with orange juice) provided is sufficient to bring your blood alcohol to 80 mg/100 ml.
In order to assess accurately the BAC (Blood Alcohol Concentration) a small amount of blood from the finger tips will be taken before, during, and on completion of the experimental trials.
The experimental protocol will be as follows: You will be seated in a chair watching a visual display. After approximately 5 seconds a precue will be displayed on the monitor. (We will go through some practice trials first so you can learn to use the precue in preparing the movement). When the precue is displayed try to plan and prepare for the upcoming movement. The precue display will go off after one second and then the imperative stimulus to move will be displayed. Move as quickly and as accurately as possible to the stimulus by making the correct arm movement. Each trial will take approximately 15
seconds.
There will be three separate precue conditions and eighty trials in each condition. In the all precue condition, either the 'RU' or 'RD', or 'LU' or 'LD' will appear indicating which arm is to be moved and the direction of movement. In the no precue condition an 'X' will appear. Their are three different conditions in the partial precue condition. Either the letter 'R' or 'L' will appear in the arm precue condition, in the direction precue condition the letter 'U' or 'D' will

appear. In the diagonally precued condition either the symbols 'r will appear for RU or LD (right up or left down) or '\' for LU or RD (left up or right down). You will be given a short rest period between each condition. The experiment will take approximately one hour. If you have any questions please ask them now.

APPENDIX I
SUMMARY TABLES FOR ANALYSES OF VARIANCE, EXPERIMENT 1 AND 2.

Mor
ning
and
Eve
ning
Diff
eren
ces
in E
xper
imen
t .l
and
2.
SaJ
RC
E
SLlM
OF
DK
;IREE
OF
MEA
N
F
TA
IL
GR
EEN
-KXI
SE
W
SQU
AR
ES
FREE
DOM
SQ
UA
RE
PRO
B.
GEI
SSER
PR
OB
. FE
LDT
PRO
B.
MEA
N
283365.14
1 283365.14
703
0
WR
OR
4433.89
11
403.08

Mea
n R
T in
the
thr
ee r
eact
ion
time
cond
ition
s w
ith a
nd w
ithou
t al
coho
l.
SOUR
CE
SU
MO
F D
EGR
EEO
F M
EAN
F
TA
IL
CB
Em
aS
E
I-LJY
w
SQU
AR
ES
FREE
DOM
SQ
UA
RE
PRO
B.
GEI
SSER
PR
OB
. FE
LDT
PRO
B.
MEA
N
62
34
79
4.2
9
1
62
34
79
4.2
9
82
3.4
8
0
E3F
m
83
28
3.8
8
11
75
71 -2
6
c.
c..
BEV
ERA
GE
56
80
.89
1
5
68
0.8
9
7.8
8
0.0
1 7
o
E3m
m
79
28
.56
1
1
72
0.7
8
CO
ND
ITIO
N
80
38
0.8
7
2
401
90
.44
1
88
.38
0
0
0
Em
OR
4
69
3.7
1
22
21
3.3
5

Mea
n M
T in
the
thr
ee r
eact
ion
time
cond
ition
s w
ith a
nd w
ithou
t al
coho
l.
SaJ
F?C
E
SU
MO
F D
EGR
EEO
F M
EAN
F
T
AIL
G
REE
NH
OU
SE
Hp/r\H
SQU
AR
ES
fTE
EM
SQ
UA
RE
PRO
B.
3EIS
SER
PR
O6
FELD
T PR
OB
.
MEA
N
12
70
61
1.7
4
1
12
70
61
1.7
4
20
1.9
5
0 ER
ROR
69
21
0.1
8
11
6
29
1.8
3
BEVE
RAG
E 1
37
.48
1
13
7.4
8
0.7
3
0.4
1 0
8
ERRO
R 2
06
8.6
1
1
18
8.0
5
CO
ND
ITIO
N
48
78
.14
2
24
39
.07
17
.55
0
0
0 E
Fm
R
30
58
.32
2
2
13
9.0
1

Mea
n E
rror
s in
the
thr
ee r
eact
ion
time
cond
ition
s w
ith a
nd w
ithou
t al
coho
l.
SOUR
CE
SU
MO
F DK
;WEE
OF
MEA
N
F
TA
IL
GR
EEI\H
OU
SE
HM
\H
SQU
AR
ES
FREE
DOM
SQ
UA
RE
PRO
B.
3EIS
SER
PR
OB
FEL
DT
PRO
B.
MEA
N
13
95
.68
1
1
39
5.6
8
48
.87
0
aRROR
31
4.1
5
11
2
8.5
6
BEVE
RAG
E 1 9
0.1
3
1
19
0.1
3
27
.87
0
.00
03
sWOR
75.0
4 1
1
6.8
2
CO
ND
ITIO
N
1.36
2
0.6
8
0.0
9
0.9
1 7
5
0.9
1 0
8
0.9
1 7
5 eWOR
173.
31
22
7
.88

Mea
n R
T in
the
thr
ee p
recu
e co
nditi
ons
with
and
with
out
alco
hol.
SOU
RC
E S
UM
OF
DEG
REE
OF
MEA
N
F TA
IL
GR
EaH
OU
SE
H
J)T
\H
SQU
AR
ES
FREE
DOM
SQ
UARE
PR
OB.
3E
ISSE
R P
RO
B F
ELD
T PR
OB
.
MEA
N
66
02
49
5.7
1
1
66
02
49
5.7
1
63
4.5
8
0
m3m
1
14
44
9.8
6
11
1
04
04
.53
BEV
ERA
GE
21
00
3.9
6
1
21 0
03
.96
14
.28
0.0
03
1
m3m
16
1 7
7.0
9
11
1
47
0.6
4
CO
ND
ITIO
N
83
1 46
.42
2
41
57
3.2
1
126.
44
0
0
0
BW
oR
72
33
.3
22
3
28
.79

Mea
n M
T i
n th
e th
ree
prec
ue c
ondi
tions
with
and
with
out
alco
hol.
SOUF
aCE
SUM
OF
DEG
REE
OF
MEA
N F
T
AIL
G
REEN
HOUS
E M
M\H
SQ
UA
RES
FR
EEDO
M
SQU
AR
E PR
OB.
3E
ISSE
R P
RO
6 FE
LDT
PRO
B.
MEA
N
87
30
04
.8
1
87
30
04
.8
77
5.4
7
0
ElW
m
12
38
3.4
5
11
1
125
.77
c.r P
BEV
ERA
GE
28
92
.56
1
2
89
2.5
6
4.6
3
0.0
54
4
ER
R33
6
86
5.8
3
11
6
24
.1 7
CO
ND
ITIO
N
6 7
7.6
2 2
33
8.8
1
3.1
7
0.0
61
7
0 .0
63
8
0.0
61
7 E
tTm
23
51 -6
4
22
1
06
.89
bc
68
.06
2
3
4.0
3
0.4
3
0.6
53
2
0.6
48
4
0.6
53
2
ERRO
R 17
24.3
6 2
2
78
.38

Mea
n E
rror
s in
the
thr
ee p
recu
e co
nditi
ons
with
and
with
out
alco
hol.
SOUR
CE
SUM
OF
ffiR
EE
OF
M
EAN
F
TA
IL
GR
EeW
OU
SE
. tU
YN
i SQ
UA
RES
FR
EEDO
M
SQU
AR
E PR
OB.
3E
ISSE
R P
RO
B F
ELD
T PR
OE3.
wl
BEV
ERA
GE
34
.72
1
3
4.7
2
2.93
0
.1 1
49
W
FK
)R
130.
28
11
1
1.8
4
CO
ND
ITIO
N
22.5
3 2
1 1
.26
1.
37
0.2
75
4
0.2
70
5
0.2
71
4
EnFl
oR
181.
14
22
8
.23

Mea
n R
T i
n th
e th
ree
part
ial
prec
ue c
ondi
tions
with
an
d w
ithou
t al
coho
l.
SOU
RC
E S
UM
OF
DEG
REEO
F M
EAN
F
T
Al L
G
REEN
HOUS
E M
MV
l SQ
UA
RES
Fl
TED
GM
SQ
UA
RE
PRO
B.
3EIS
SER
PR
OB
FEL
DT
PRO
B.
MEAN
7304850.26
1 7304850.26 51 6.71
0
C
EfW
OR
15551 0.68
11
141 37.33
C
m
BEVE
RAGE
30749.89
1 30749.89
14.91
0.0026
ER
Fm
22688.6
11
2062.6
CONDITION
552.05
2
276.02
1.79
0.1 897
0.1 92
0.1897
Em
oR
3383.52
22
153.8

Mea
n M
ovem
ent
Tim
e in
the
thr
ee p
arti
al p
recu
e co
nditi
ons
with
an
d w
ithou
t al
coho
l.
SOUR
CE
SU
MO
F D
EGR
EEO
F M
EAN
F
T
AIL
G
REEN
-1O
USE
Hw
N-.I
SQU
AR
ES
FR
EE
EM
SQ
UA
RE
PRO
B.
GEI
SSER
PR
OB
. FE
LDT
PRO
B.
MEA
N
87
93
96
.47
1
8
79
39
6.4
7
66
9.4
7
0
w
WR
OR
1
44
49
.22
1
1
13
13
.57
C
I
CO
ND
ITIO
N
152.
75
2 7
6.3
7
0.6
8
0.5
17
1
0.4
72
5
0.4
85
6
WR
OR
2
47
1.8
2
22
1
12
.36

Mea
n E
rror
s in
the
thr
ee
part
ial
pre
cue
cond
ition
s w
ith a
nd
with
out
alco
hol.
SOUR
CE
SUM
OF
DEG
REE
OF
MEA
N F
TA
IL
GE
EN
iOU
SE
H
M\H
-
~
SQU
AR
ES
FREE
DOM
SQ
UA
RE
PRO
B.
3EIS
SER
PR
O6
FELD
T PR
OB
.
C
+
00
BEVE
RAG
E 7.35
1 7.35
2.1
0.1 752
I3=U
aR
38.49
11
3.5
CO
ND
ITIO
N
0.25
2 0.13
0.1
0.9092
0.8029
0.814
WR
OR
28.75
22
1.31
bc
4.69
2 2.35
1.4
0.2685
0.2691
0.2689
ERRO
R 36.97
22
1.68
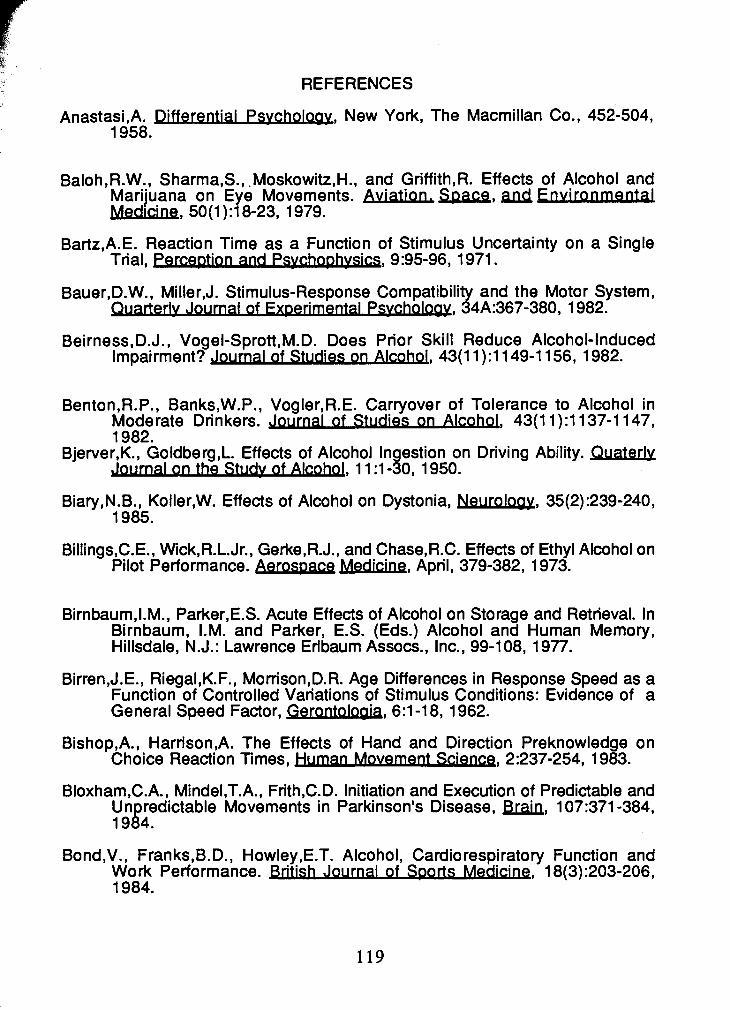
REFERENCES
Anastasi,A. Differential Psvchology, New York, The Macmillan Co., 452-504, 1958.
Baloh,R.W., Sharma,S., .Moskowitz,H., and Griffith,R. Effects of Alcohol and Marijuana on Eye Movements. Aviation. w, and Emironmental Medicine, 50(1) 11 8-23, 1 979.
Bartz,A.E. Reaction Time as a Function of Stimulus Uncertainty on a Single Trial, perception ,and P ~ y c h o ~ h v s i ~ ; ~ , 995-96, 1 971 .
Bauer,D.W., Miller,J. Stimulus-Response Compatibility and the Motor System, erlv Journal of Fx~etVnental Psv-, 34A:367-380, 1982.
Beirness,D.J., Vogel-Sprott,M.D. Does Prior Skill Reduce Alcohol-Induced Impairment? journal of on Alcqhpl, 43(11):1149-1156, 1982.
Benton,R.P., Banks,W.P., Vogler,R.E. Carryover of Tolerance to Alcohol in Moderate Drinkers. Journal of w d i e s on A U , 43(11):1137-1147, 1982.
Bjerver,K., Goldberg,L. Effects of Alcohol Ingestion on Driving Ability. Quaterlv Journal on the Studv of Alcohol, 1 1 :1-30, 1950.
Biary ,N.B., Koller,W. Effects of Alcohol on Dystonia, Neurology, 35(2) :239-240, 1985.
Billings,C.E., Wick,R.L.Jr., Gerke,R.J., and Chase,R.C. Effects of Ethyl Alcohol on Pilot Performance. pero- M e d i a , April, 379-382, 1973.
Birnbaum,l.M., Parker,E.S. Acute Effects of Alcohol on Storage and Retrieval. In Birnbaum, I.M. and Parker, E.S. (Eds.) Alcohol and Human Memory, Hillsdale, N.J.: Lawrence Erlbaum Assocs., Inc., 99-108, 1977.
Birren,J.E., Riegal,K.F., Morrison,D.R. Age Differences in Response Speed as a Function of Controlled Variations of Stimulus Conditions: Evidence of a General Speed Factor, Gero-, 6:1-18, 1962.
Bishop,A., Harrison,A. The Effects of Hand and Direction Preknowledge on Choice Reaction Times, Human Movement Science, 2:237-254, 1983.
Bloxham,C.A., Mindel,T.A., Frith,C.D. Initiation and Execution of Predictable and Unpredictable Movements in Parkinson's Disease, Brai R, 1 07:371-384, 1984.
Bond,V., Franks,B.D., Howley,E.T. Alcohol, Cardiorespiratory Function and Work Performance. -rnal of Sgorts M e d m ,
. . . . 1 8(3):203-206,
1984.

Bonnet,M., Requin,J., Stelmach,G.E. Changes in Electromyographic Responses to Muscle Stretch, Related to the Programming of Movement Spatial Parameters, in press.
Bonnet ,M., Requin,J., Stelmach,G.E. Specification of Direction and Extent in Motor Programming, w e t i n of Psvcho~mic Society, 19(1):31-34, 1982.
Botwinick,J. Geropsychol.ogy , Annual Review of Psv-, 21 :239-272, 1 970.
Boyko,Ye.l. Vremya Reaktsii Cheloveka. Meditsina Publishing House, 1964. Translated by JRRS as Reaction Time of man, JRm:27, TT:64-51954, 1964.
Bradley,P.B. P s v ~ ~ a r m ~ o l o g y o f , Ed.Sandler, M, Raven Press, New York, 1980, pps i-iv.
Bradshaw,J.L. Pupil Size and Drug State in a Reaction Time Task. Psvchonomic Science, 18(2):112-113, 1970.
Brainard,R.W., Irby,P.M., Fitts,P.M., Alluisi, E.A. Some Variables Influencing the Rate of Gain of Information, Journal of E-ental Psvchology, 56305- 1 10, 1962.
Brebner,J. S-R Compatibility and changes in RT with Practice, Acts m, 37:93-106, 1973.
Brinley,J.F. Cognitive Sets and Accuracy of Performance in the Elderly. In A.T. Welford & J.E. Birren (Eds.), Behavior, aging and the nervous system. Springfield, IL:.Charles C. Thomas, 1965.
Broadbent,D.E., Gregory,M. On the Interaction of S-R Compatibility with Other Variables Affecting Reaction Time,mt~sh Journal of Psvchology
. . , 56:61- 68, 1965.
Brown,S.A., Goldman,M.S., Inn,A., Anderson,L.R. Expectations of Reinforcement from Alcohol: Their Domain and Relation in Drinking Patterns, &urnal of C o n s u l t i m a n d a Psvchology, . . 48 14 1 9-426, 1980.
Carpenter,J.A. Contributions from Psychology to the study of Drinking and Driving, Qjm J- Pf Studies pf Alcohol, Supplement No. 4, 234- 251, 1968.
Carpenter,J.A. Effects of Alcohol on Some Psychological Processes, A Critical Review: With Special Reference to Automobile Driving Skill. Quarterlv
pf Stu- Pf a, 23:274-314, 1962.
Carpenter,J.A. The Effect of Caffeine and Alcohol on Simple Visual Reaction Time. Journal pf C o v r a t i v e P h v s i o l o ~ p s v c h o l ~ , 52:49l- 496, 1959.
Carpenter,J.A., Moore,O.K., Snyder,C.R., Lisanki,E.S. Alcohol and Higher-Order Problem Solving. Quarterlv Journd Pf W J pf Alcohol, 22:183-222, 1961.

Carpenter,J.A., Ross,B.M. Effects of Alcohol on Short Term Memory, Quarterlv Journal pf Studies pf-, 26:561-579,1965.
Chandler,B.C., and Parsons,O.A. Altered Hemispheric Functioning Under Alcohol. Jou rM Pf Pf Alcohol, 38(3):381-391, 1977.
Cherry,N., Johnston,J.D., Venables,H. and Waldron,H.A. The Effects of Toluene and Alcohol on Psychomotor Performance. mono-, 26(11):1081- 1087, 1983.
Chiles,W.D., and Jennings,A.E. Effects of Alcohol on Complex Performance. Human Factors, 12(6):605-612, 1970.
. . Clayton,A.B. Effects of A I c m I on Onvlna Skills, In: Psychoparmacology of
Alcohol, Ed. by Sandler,M, Raven Press, New York, 1980,73-78.
Collins,W.E. Performance Effects of Alcohol Intoxication and Hangover at Ground level and at Simulated Altitude. A v i a t i u , s_~ace,
v ~ r o n m e m Medicine, 51 (4):327-335, 1 980.
Conger,J.J. Perception, learning, and Emotion: The Role of Alcohol, Annals of the American &admy of P o U a l m d social science
. . , 31 5:31-39, 1958.
Critchlow,B. Blaming the Booze: The attribution of responsibility for Drunken Behavior. P e r s m t y and Social P s v c h o l o ~ , 9:451-473, 1983.
Davis,R. The Combination of Information from Different Sources, pUarterIy y, 16~332-339, 1964.
Dengerink,H.A., Mead,J.D., Bertilson, H.S. Individual Differences in Response to Alcohol: Vasoconstriction and Vasodilation, Journal of Studies on Alcohol, 39:12-18, 1978.
Dixon,D., Just,M.A. A Chronometric Analysis of Strategy Preparation in Choice Reactions, m o p & w i t i o n , 1 4(6):488-500, 1 986.
Dodge,R., Benedict,F.G. Psychological Effects of Alcohol, Publ. Carneg. Instn. No. 232, 191 5.
Donders,F.C. On the Speed of Mental Processes, b t a Psvcholog&a, 30:412- 431, 1969.
Drew,G.C., Colquhoun, W.P., and Long,H.A. Effect of Small Doses of Alcohol on a Skill Resembling Driving. Bnt~sh Medical J o u r d
. . , 10:993-998, 1958. . .
Eggleton,M.G. The Effect of Alcohol on the Central Nervous System. British Journd pf P s v c h o b , 32:52-61, 1941.
Eidelberg,E. Acute Effects of Ethanol and Opiates on the Nervous System. In: . Ed. Gibbins,R.J., Smart,R.J. Vol. 2,
John Wiley & Sons,lnc., 1975.

Eke-0kor0,S.T. The effects of force, fatigue, alcohol, aspirin and caffeine on the Hoffman reflex. Unpublished Master's Dissertation ,Simon Fraser University,l979.
Ekman,G., Frankenhaeuser,M., Goldberg,L., Bjerver,K., Jarpe,G., and Myrsten,A-L. Effects of Alcohol Intake on Subjective and Objective Variables over a Five-Hour Period. P s v w h a r m a a , 4:28-38, 1963.
Ekman,G., Franken haeuser,M., Goldberg,L., Hagdahl,R., M rsten,A.L.
Time. p s v ~ o l o g ~ a , 6:399-409, 1964. d Subjective and Objective Effects of Alcohol as Functions of Osage and
Ells,J.G. Analysis of Temporal and Attentional Aspects of Movement Control, Journal of E-l Psvcholo~99:10-21, 1 973.
Eysenck,H.J. Pynamics of Anxietv and HvstetQ. New YokPraeger, 1957.
Eysenck,H.J. Jhe W i w Basis of Personal&, Springfield,ll: Thomas, 1967.
Fitts,P.M., Seeger,C.M. S-R Compatibil patial Characteristics of stimulus and Response Codes, Journal of enmental Psvcholopy, 46:199-210, 1953.
Frankenhaeuser,M., Myrsten,A-L., and Jarpe,G. Effects of a Moderate Dose of Alcohol on Intellectual Functions. p s v m o l o g i a , 3:344-351, 1962.
Gardiner,G., Franks,l.M., Goodman,D. A Microcomputer-Based Tracking Task for Examination of the Spatial and Temporal Organization of Perceptual Motor Skills. Behavior Research M o d s . In-. and C o w , 19: 361-364, 1987.
Glatt,M.M. Alcohol: In the Life and Health of a Nation. In. Medical Council of Alcoholism: Notes on Alcohol and Alcoholism. Ed. Caruana,S. B.Edsal1 & Co. LTD., London, 1972.
Glencross,D.J. Response Complexity and the Latency of Different Movement Patterns, J o u r a of Motor Reha-, 5:95-104, 1973.
Goldberg,L. Behavioral and Physiological Effects of Alcohol on Man. psvchosomati~ Medicine, XXV111(4):570-594, 1 966.
Goldberg,L. Quantitative Studies on Alcohol Tolerance in Man. Ac ta Phv- -avian, 5:Supplement XVI, 1-1 28, 1943.
Goldberg,L., Rydberg,U. Inhibition of Ethanol Metabolism in Vivo by Administration of Pyrazole. ~ochemica l Pharmaolqgy, 18:1749-1762, 1969.
Goldberg,L., Stortebecker,T.P. Criteria of Alcohol Intoxication in Animals in Relation to Blood Alcohol. pcta Phvsioloaica S-avian, 3:71-81, 1941.
122

In: Pha- of M. Oxford University Press, New York,
Kels0,J.A.S. Are Movements Prepared in Parts? Not under Compatible (naturalized) conditions, Journal of Experimental Psvcholoqv: General. 109:475-495, 1980.
Goodwin,D.W., Powell,B.., Bremer, D., Hoine,H., Stern,J. Alcohol and Recall: State Dependent Effects in Man, science, l63:;1358-1360, 1969.
Greenberg,L.A. The Pharmacology of Alcohol and its Relationship to Drinking and Driving. Quarterlv J o u r d Pf Studies pf Alcohol, 4:252-266, 1968.
Greenwald,A.G. Sensory Feedback Mechanisms in Performance Control: with Special Reference to the Ideo-motor mechanism, PsvcholqOjcal Review, 77:73-99, 1 972.
Gruner,O. Alcohol und aufmerksamkeit.1 hr bedeutung im motorisietten vekehr. rterlv Journal of S u e s of Alcohol, 1 7:684-685, 1 953.
Gustafson,R. Alcohol and Vigilance Performance: Effect of Small Doses of Alcohol on Simple Visual Reaction Time. p e r c w hnotor u, 621951 -955, 1986.
Gustafson,R. Alcohol and Vigilance Performance: Effects of Small Doses of Alcohol on Simple Auditory Reaction Time. P e r c e ~ w Mot01 u, 63199-1 02, 1986.
Gustafson,R. Effect of Moderate Doses of Alcohol on Simple Auditory Reaction Time in a Vigilance Setting. P e r c e ~ u Motor m, 62:683-690, 1986.
Hamilton,P., Copeman,A. The Effects of Alcohol and Noise on Components of a Tracking and Monitoring Task. British Journal pf PsvchoIogy, 61 (2):149- 156, 1970.
Harrison,A., Bishop,A. Tracing Response Parameter Preparation Strategies Using Transition Times, Human, 4139-53, 1985.
Havard,J.D.J. The Drinking Driver and the Law: Legal Countermeasures in the Prevention of Alcohol-Related Road Traffic Accidents. In: Research Advances in Alcohol and Dru Problemq. Ed. by Gibbins,R.J., Israel,\/., Ka1ant.H.. Popham,R.E., ~ch$dt,W., and Smart,R.J. Vol 2, John Wiley & Sons, Inc., 1975.
Hendrikx,A.J.P. Compatibility of Precuing and of S-R Mapping in Choice Reactions, P s v c h o l o ~ , 62:59-88, 1986.
Henry,F.M. The Evolution of the Memory Drum Theory of Neuromotor Reactions. In: G.A. Brooks (Ed.), ers~ectives on the Academic D~sc~p l~ne o
. . . Phvsical Education. Chagpaign, IL: Human Kinetics Publishers, pp. 301f 322, 1981.

Hick,W.E. On the Rate of Gain of Information, Quarterlv Journal of Ewerimental SVC~O~O- 4:11-26, 1 952.
Himmelweit,H. Speed and Accuracy of Work as Related to Temperament, of Psvchology, 36:132-144, 1 946.
Himwich,H.E., Callison,D.A. The Effects of Alcohol on Evoked Potentials of Various Parts of the Central Nervous System of the cat. In. The Bio Alcoholism Vol 2. Physiology and Behavior, Plenum Press, pp 1972.
Hockey,G.R.J., Colquhoun, W.P. Diurnal Variations in Human Performance: . . A Review. In Colquhoun, W.P. (Ed.), Rhythm and of Sleeg. L o n d o x l i s h University Press: pp 1-23,
s of Human E f f l c ~ e ~ . Diurnd
1972.
Hug,C.C. Characteristics and Theories Related to Acute and Chronic Tolerance Development. In : Chemical and Biological Aspects of Drug Dependence, ed. Mule, S.J., CRC Press, 1 971 .
Huntle ,M.S. Effects of Alcohol and Fixation Task Difficulty on Choice Reaction {ime to Extrafoveal Stimulation. Qvarterlv Journal 9f 9f /Woho(, 34:89-103, 1 973.
Huntley,M.S.,Jr. Effects of Alcohol, Uncertainty and Novelty upon Response Selection. P s v c h ~ o l o g i a (Berl.), 39:259-266, 1974.
Huntley,M.S.,Jr. Influences of Alcohol and S-R Uncertainty upon Spatial Localization Time. p s v ~ h a r ~ o l o g i a (Berl.), 27:131-140, 1972.
Hyman,R. Stimulus Information as a Determiner of Reaction Time. Journal of I P s v c ~ o ~ o ~ ~ , 451423-432, 1 953.
Idestrom,C.M., and Cadenius,B. Time Relations of the Effects of Alcohol Compared to Placebo. Dose-Response Curves for Psychomotor and Perceptual Test Performances and Blood and Urine Levels of Alcohol. PsvchoDharmacoloala (Berl.), 13:189-2OO, 1968.
Jacobsen,E. The Metabolism of Ethyl Alcohol. pharmacoloalcal Review, 4:107- 135, 1952.
- Jellinek,E.M., and McFarland,R.A. Analysis of Ps chological Experiments on the Effects of Alcohol. m r t e r l v Journalnf & u d i ~ & ~ l c o h o L , 1:272-371, 1940.
Jennin s,J.R., Wood,C.C., Lawrence,B.E. Effects of Graded Doses of Alcohol on ipeed-~ccuracy Tradeoff in Choice Reaction Time. percept
svcho~hvsic~, 19(1):85-91, 1976. ion &
Jones,B.M. Circadian Variation in the Effects of Alcohol on Cognitive Performance. m r t e r l v Journal nf studies gf Alcohol, 35:1212-1219, 1974.

Jones,B.M. Cognitive Performance during Acute Alcohol Intoxication: The Effects of Prior Task Experience on Performance. Psvchonomic Science, 26(6):327-329, 1 972.
Jones,B.M., and Vega,A. Cognitive Performance Measured on the Ascending and Descending Limb of the Blood Alcohol Curve. psvch- (Berl.), 23:99-114, 1972.
J0nes.B.M.. and vega,A. Fast and Slow Drinkers. Blood Alcohol Variables and Cognitive Performance. Quarterly Journal pf pf Blr;ohol, 34:797- 806,1973.
Jones,B.M., Jones,M.K. Alcohol and Memory Impairments in Male and Female Social drinkers. In: Alcohol and Human Memory, Ed. Birnbaum,l.M., Parker,E.S., Hillsdale, NJ: Lawrence Erlbaum Associates, 1977.
Jubis,R.M. Effects of Alcohol and Nicotine on Free Recall of Relevant Cues. P e r c w Motor Skills, 62:363-369, 1986.
Kahneman,D., Ben-lshai,R., Lotan,M. Relation of a test of Attention to Road Accidents, Journal of &pl ied Psvchology, 58:113-115, 1973.
Kalant,H. Absorption, Diffusion, Distribution, and Elimination of Ethanol: Effects on Biological Membranes. In: Jhe Rioloav of Alco . Ed. Kissin,B., and Begleiter,H. Vol. 1, Plenum&
Kalant,H. Cellular Effects of Alcohols. In: plcohol & Alcoholisrq. Ed. Popham,R.E. Published for the Addiction Research Foundation by the University of Toronto, 1970.
Kalant,H., Khanna,J.M. Environmental-Neurochemical Interactions in Ethanol Tolerance, In: Psvchwharmacaioav of Alcohol, ed. Sandler, M., N.Y, 1980.
Kalin,R., McClelland,D.C., Kahn,M. Effects of Male Social Drinking On Fantasy, P S V C ~ , 1 :441-452, 1 965.
Kantowitz,B.H., Sanders,M.S. Partial Advance Information and Stimulus Dimensionality, Journal, 92:4lZ-4l8,l972.
Keele,S. W. Behavioral Analysis of Motor Control. In V.B. Brooks (Ed), Handbook pf Phvs~ologv: Motor Control (Vol. 3). Bethesda, Md.: American Physiological Society, 1980.
Keele,S.W. Movement Control in Skilled Motor Performance, psvcholoalcal pulletin, 70:387-423, 1 968.
Kerr,B. Is Reaction Time Different for Long and Short Response Duration in Simple and Choice Conditions? Journal of Motor Behavior, 11 :269-274, 1979.
Kerr,B.T. Decisions About Movement Direction and Extent, J J m Movement S t u r n , 3:199-213, 1976.

Klapp,S.T. Response Programming as Assessed by Reaction Time, Does Not Establish Commands for Particular Muscles, Journal of M Q ~ P ~ R-, 9:301-312, 1977.
Klapp,S.T., Etwin,C.I. Relation Between Program uration of the Response Being Programmed, ournal o Human P e w t i o n and Perfor&, 2:59
P-
Klapp,S.T., Wyatt,E.P. Motor Programming Within a Sequence of Responses, o u r d of MQfor Rehavia, 8:19-26, 1976.
Klapp,S.T., Wyatt,E.P., Ling0,W.M. Response Programming in Simple and Choice Reactions, Journal of Motor Behavior, 6:263-271, 1974.
Klein,R.H., Jex,H.R. Effects of Alcohol on a Critical Tracking Task. Jaurnalpf Studies pf Alcohol, 36(1) :11-20, 1 975.
Lamb,J., Kaufman,H. Information Transmission with Unequally Likely Alternatives, PercePfuaLarrd Motor S k i , 21 :255-259, 1965.
Lambercier,M.R.,Martin Du Pan,R. Les effects psychiques de I'intoxication alcoolique aigue, Schweiz Mewal Wscb., 76:395-398, 1946.
Larish,D.D, Frekany,G.A. Planning and Preparing Expected and Unexpected Movements: Reexamining the Relationship of Arm, Direction, and Extent of Movement, Journal of Motor Rehavia, 17:168-189, 1985.
Larish,D.D. Influence of Stimulus-Response Translations on Res onse
of Movement, &$a P s v c h o l o ~ , 61 :53-70, 1 986. E Programming: Examining the Relationship of Arm, Direction, and xtent
Larish,D.D., Stelmach,G.E. Preprogramming, programming, and reprogramming of aimed hand movements as a Function of Age, llournal pf Motor Rehavioy, 14:322-340, 1982.
Leake,C.D., Silverman,M. The Chemistry of Alcoholic Beverages. In: Bioloav of Alcoholisrrl, Vol 1 , Biochemistry. Ed. Kissan,B., and Begleiter,H. Plenum Press New York, 1971.
Lelbach,W.K. Organic Pathology Related to Volume and Pattern of Alcohol Use. In: ch Advances ~n Alcohol and nrua P r o b u . Ed. Gibbins,R.J., I s r a w K a l a n t ,Ha, Popham,R.E., Schmidt,W., and Smar4R.J. vol 1, John Wiley & Sons, Inc., 1 974.
Leonard,J.A. Partial Advance lnformation in a Choice Reaction Time Task, eneral Psvchology, 49:89-96, 1 958.
Lepine,D., Glencross,D., Requin,J. Some Experimental Evidence For and Against A Parametric Conception of Movement Programming, JPumalPf
enm mental Psvcholoav: Human Perceotion and Performan~, in press.
Lepine,D., Glencross,D., Requin,J. Some Experimental Evidence for and Against a Parametric Conception of Movement Programming, &UtdAf

en- Psvaology: Human Percemon and Performance. 1987 or 1986.
Lepine,D., Requin,J. Specification of Spatial Dimensions in Movement Programming, Neuroscience A b s t r w , 9:297-317, 1983.
Levine,J.M., Kramer,G.G., Levine,E.N. Effects of Alcohol on Human Performance: An Integration of Research Findings Based on an Abilities Classification. &urnd pf psvchology, 60:285-293, 1 975.
Lewis,E.G., Dustman,R.E., Beck,E.C. The Effect of Alcohol on Sensory Phenomena and Cognitive and Motor Tasks. h a r t e r l v Journal& Studies pf AICO ha, 30:618-633, 1969.
Lewis,E.G., Dustman,R.E., Beck,E.C. The Effects of Alcohol on Visual and Somato-Sensory Evoked Responses. E l e c t r o e n c e ~ h a l o ~ Clinical -, 28:202-205, 1970.
Linnoila,M., Erwin,C.W., Cleveland,W.P., Logue,P.E., Gentry,W.D. Effects of Alcohol on Psychomotor Performance of Men and Women. u p f Studies pn a, 39(5):745-758, 1 978.
Linnoila,M., Erwin,C.W., Ramm,D., Cleveland,W.P. Effects of Age and Alcohol on Psychomotor Performance of Men, Journal of S t u m on Alcqhpl, 41 (5):488-494, 1 980.
Linnoila,M., Mattila,M.J. Drug Interaction on Psychomotor Skills Related . . to Driving: Diazepam and Alcohol, Fu ro~ean Journal of C l l n U P h a r w , 5:186-194, 1973.
Marlatt,G.A., Rohsenow,D.J. Cognitive Processes in Alcohol Use: Expectancy and the Balanced Placebo Design. In: Mello, N (Ed.) Advances in
ce Abuse: Behav~oral and B~olo cal Research. A Resear& m V o l 1, Greenwich, Conn.: JAl Presrlnc., pp 159-199, 1980.
Maylor,E.A., Rabbitt,P.M.A. Effects of Alcohol and Practice on Choice Reaction Time. Perce~tion and Psv-, 42:465-475,1987.
Maylor,E.A., Rabbitt,P.M.A., Kingstone,A. Effects . . of Alcohol on Word Categorization and Recognition Memory, Bntlsh Journal of Psv-, 78~233-239, 1 987.
Maylor,E.A., Rabbitt,P.M.A., Sahgal,A., Wrig ht,C. Effects of Alcohol on Speed and Accuracy in Choice Reaction Time and Visual Search, A& p s v c h o l o ~ , 651 47-1 63, 1987.
McCracken,H.D. Programming Direction, Extent, and Duration in Aimed Hand Movements. Paper presented at NASPA conference, 1986.
Megaw,E.D. Direction and Extent Uncertainty in Step-input Tracking, h r n a l 01 Motor Behavior, 4:171-186, 1972.

Mi hal,W.L., Barrett,G.V. Individual Differences in Perceptual lnformation Processing and their Relation to Automobile Accident Involvement,
6 1 (2) 1229-233, 1 976. M i l l e r , J % r ~ ~ e ~ , " , ~ % ! ~ ~ ~ b s Sta e Models of Human lnformation
Processing: In Search of .Partial 8utput. b u r n a l of wer imenta l rcept~on & Perforrnan(;8, 8:273-296, 1982.
Miller,M.E., Adesso,V.J., Fleming,J.P., Gino,A., Lauerman, R. The Effects of Alcohol on the Storage and Retrieval Processes of Heavy Social Drinkers. Journal of EQ-l Psvcholoqv: H u m earning and Memory, 4:246-255, 1978.
Mirsky,A.I., Piker,K., Rosenbaum,M., Lederer,H. "Adaptation" of the Central Nervous System to Varying Concentrations of Alcohol in the Blood. Quarterlv Journd a f studies a f Alcohol, 2:35-45, 1941.
Mitchel1,M.C. Alcohol-Induced Impairment of Central Nervous System Function: Behavioral Skills Involved in Driving, Journal of Studies on Alcohol, 10:109-116, 1985.
Morin,R.E., Forrin,B. Mixing of Two Types of S-R Associations in a Choice Reaction Time Task, Journal, 64(2):137-141, 1962.
Moskowitz,H. Laboratory Studies of The Effects of Alcohol on Some Variables Related to Driving. pf Safeh, m, 5(3):185-199, 1973.
Moskowitz,H., Burns,M. Effect of Alcohol on the Psychological Refractory Period. W e r I y J o u r a pf studies M Alcohol, 22:782-790, 1971.
Moskowitz,H., DePry,D. Differential Effect of Alcohol on Auditory Vigilance and Divided-Attention Tasks. m e r l y Jou rm af m m nf Alcoho\, 29:54- 63, 1968.
Mowbray,G.H., Rhoades,M.V. On the Reduction of Choice Reactions Times with Practice, Quarterlv Journal of Experimental Psv-, 1 1 :16-23, 1959.
Nash,H. Sp
cal Fffecb.
Norman,D.A. Models of n M e m u , New York: Academic Press, 1970.
Osborne,D.J., Rogers,Y. Interactions . . of Alcohol and Caffeine on Human . . Reaction Time. pviat~on. Space. and Fnvironmental Medicma, June,1983.
Parsons.0.A. cognitive Functioning in Sober Social Drinkers: A Review and Critique, 47(2):lOl-ll4, 1986.
Pearson,R.G., Nea1,G.L. Operator Performance as a Function of Drug, Hypoxia, Individual, and Task Factors. p e r o w e Medicine . . , 41 ;154-158, 1970.

Peeke,S.C., Callaway,E., Jones,R.T., Stone,G.C., Doyle,J. Combined Effects of Alcohol and Sleep Deprivation in Normal Young Adults. WC~O-, 67~279-287, 1 980.
Pogrebinskii,S.A. Effects of Chronic Alcohol Intoxication on Temporal Parameters of the Process of "Motor Command" Organization and on lnterhemisperic Functional Relations in Humans, Sov~et Neurology and Psvchiatry, 65-69,Fall,1983.
Posner,M.I. Chronometric E e i o n s of Mind, Hillsdale, NJ:Erlbaum, 1978.
Prag,J.J.The Chemical and Clinical Diagnosis of "Driving Under the Influence of Alcohol" and the use of Chemical Tests in Traffic Law Enforcement,
Journal of Clln~cal Science . . , 4:289-325, 1953.
Price,D.L., Radwan,M.A.E., Tergou,D.E. Gender, Alcohol, Pacing and Incentive Effects on an Electronic Assembly Task. Eraonomics, 29(3):393-406, 1986.
Reeve,T.G., Proctor,R.W. On the Advance Preparation of Discrete Finger Responses, Journal of Ex~erimerWl Psvcholoqv: Human Perception & Performance, 10:541-553, 1984.
Requin,J., Lecas,J.C., Bonnet,M. Some Experimental Evidence for a Three Step Model of Motor Preparation. In S.Kornblum & J. Requin (Eds.),
atorv States and Processes. Hillsdale: Lawrence Erlbaum, 259- 284, 1984.
Ritchie,J.M. The Aliphatic Alcohols. In: Goodman,L.S. and Gilman,A (Eds), Iha Pharmacoloaical Basis of T h e r w c s (6th ed.). New York: Macmillan, 376-390, 1970.
Rosenbaum,D.A. Human Movement Initiation: Specification of Arm, Direction, and Extent, Journal of E m t a l Psvchology:General, 109:444-474, 1980.
Rosenbaum,D.A. The Movement Precuing Technique: Assumptions, Applications, and Extensions. In: Jvlemory and Control of Action,
In Psvcho lo~12. Edited by Magill, R.A. Amsterdam: North- Holland, pp. 231 -274, 1983.
Rosen baum,D.A., Kornblum,S. A Priming Method for Investigating the Selection of Motor Responses, Ada Psvcholom, 51 :223-243, 1982.
Ross,D.F., Pih1,R.O. Alcohol, Self-Focus and Complex Reaction-Time Performance, Journal of w e s on Alcohol, 49(2):115-125, 1988.
Rundell,O.H., and Williams,H.L. Alcohol and Speed-Accuracy Tradeoff. Human Bctors, 21 (4) :433-443, 1 979.
Salamy,A., and Williams,H.L. The Effects of Alcohol on Sensory Evoked and Spontaneous Cerebral Potentials in Man. ~ec t roencepha lograp~ a Clinical JUeurophvsioloay, 35:3-11, 1973.

Schellekens,J.M.H., Huizing,F., Kalverboer,A.F. The Influence of Movement Amplitude on Precue Processing, m a n Movement Scienm, 5:249- 262, 1986.
Schmidt,R.A., Zelaznik,H.N., Frank,J.S. Sources of Inaccuracy in Rapid Movement. In G.E.Stelmach (Ed.), @formation Processing in Motor
rol and m n i n g . New York: Academic Press, 1978.
Shaffer,L.H. Some ~f fects of Partial Advance Information on Choice Reaction with a Fixed or Variable S-R Mapping,Journal of E x p e r i m e m Psvcholoav, 72:541-545, 1 966.
Shagass,C. Sedation Threshold: A Neurophysiological Tool for Estimating . . Tension In Psychiatric Patients, moencephalogmp- Neurop-, 6:221-233, 1954.
Shagass,C. Sedation Threshold: A Neurophysiological . . Tool for Psychosomatic Research, P s v c h o s o m a t i ~ , 18:4lO-419, 1956.
Sher,K.J. Subjective Effects of Alcohol: The Influence of Setting and Individual Differences in Alcohol Expectancies, Journal of Studies on Alcohol, 46(2): 137-1 46, 1985.
Shillito,M.L., King,L.E., Cameron,C. Effects of Alcohol on Choice Reaction Time. Quarterlv pf Studies pf A~co~o[ , 35:1023-1034, 1974.
Shinar,D. psvchology on the Road: The Human Factor in Traffic Safety. New York:Wiley, 1978.
Sidell,F.R., Pless,J.E. Ethyl Alcohol: Blood Levels and Performance Decrements after Oral Administration to Man. ~vchopharrnacoloala (Berl.), 19:246- 261, 1971.
Simon,J. R. Reaction Towards the Source of Stimulation, Journal of ental Psvcholog)~81:175-176, 1969.
Smith,E.E. Choice Reaction Time: An Analysis of the Major Theoretical Positions. Psvchological R m , 69:77-110, 1968.
Southwick,L., Steele,C., Marlatt,G.A., Lindell,M. Alcohol Related Expectancies: Defined by phase of Intoxication and Drinking Experience. Journal of C o n s u l t i ~ and C l l ~ l Psvc- . . , 49:713-721, 1981.
Stelmach,G.E., Diggles, V. A. Control Theories in Motor Behavior. Acts vchologica, 50183-1 05, 1 982.
Stelmach,G.E., Goggin,N.L., Garcia-Colera,A. Movement Specification Time With Age, Experimental A w e a r c h , 13(1):39-46, 1987.
Stelmach,G.E., Worringham,C.J., Strand,E.A. Movement Preparation in Parkinson's Disease, m, 1 09:1179-1194, 1 986.
Sternberg,S. High Speed Scanning in Human Memory, Science, 153:652-664, 1966.

Sternberg,S. The Discovery of Processing Stages: Extension of Danders' Method, in Koster,W.G. (Ed.), Attention and Performanca II, North Holland, Amsterdam, 1969.
Sternberg,S. Two Operations in Character Recognition: Some Evidence from Reaction Time Measurements, Perce~tion 81 P s v c h m , 245-53, 1967.
Storm,T., Caird,W.K. The Effects of Alcohol on Serial Verbal Learning in Chronic Alcoholics, m n o m i c Science, 9:43-44, 1967.
Sudevan,P., Taylor,D.A. The Cuing and Priming of Cognitive Operations, Jouraal of Experimental Psvcho loay: Human P e r c e W n and Performance, 13(1):89-103, 1987.
Sunshine,l., Hodnett,N. Methods for the Determination of Ethanol and Acetaldehyde. In: The Biology of Alcoholism, Vol 1, Biochemistry. Ed. Kissan,B., and Begleiter,H. Plenum Press New York, 1971.
Talland,G.A. Effects of Alcohol on Performance in Continuous Attention Tasks. chonomic M e d i a , 28:596-604, 1966.
Tarter,R.E., Jones,B.M., Simpson,C.D., Vega,A. Effects of Task Co Practice on Performance during Acute Alcohol Intoxication a Motor .us, 33:307-318, 1971.
Teichner, W.H., Krebs,M.J. Laws of Visual Choice Reaction Time, Psv- m, 81 (1 ) :75-98, 1 974.
Tharp,V.K.Jr., Rundell,O.H.Jr., Lester,B.K., Williams,H.L. Alcohol and Information Processing. Psvchopharmacolo& (Berl.), 40:33-52, 1974.
Tyler,L.E. The Psv-v of Human Differences, New York: Appleton-Century- Crofts,l965.
Venables,P. Car-Driving Consistency and Measures of Personality, The Journal ed Psv-, 40(1):21-23, 1956.
Verhaegen,P., VanKeer,E., Rens,R. The Influence of small doses of Alcohol on the Rate of Decision Making. In: Israelstam, S. and LamberLS eds.
Icohol. Dm and Traffic Safety. Proc. 6 Int. Conf. Alcohol Drugs and qraffic ~afe t? Toronto. 8-13 Sept 1974. Toronto; Addiction Research Foundation; i 975.
Vogel,M. Low Blood Alcohol Concentrations and Psychological Adjustment as Factors in Psychomotor Performance: An Exploratory Study. ~~y J o u r m Pf Studies QQ Alcom, 19:573-589, 1958.
Vuchinich,R.E., Sobel1,M.B. Empirical Separation of Physiologic and Expected Effects of Alcohol on Complex Perceptual Motor Performance. -OIOU, 60:81-81, 1978.

Wallgren,H., and Barry,H. W n s of Alcohol. Vols. I and II. American: Elsevier Publishing Company, Inc., New York, 1970.
Ward,T.B., Lewis,S.N. The Influence of Alcohol and Loud Music on Analytic and Hol~stic Processing, Percaption and Psycho-, 41 (2):179-186, 1987.
Weingartner,H., Murphy, D.L. State-dependent Storage and Retrieval of Experience while Intoxicated. In: Birnbaum, I.M. and Parker,E.S.(Eds.) Alcohol m e m o r y , Hillsdale, N.J.: Lawrence Erlbaum Assocs., Inc., 1 977.
Welford,A.T. Skilled Performance P e r c a and Motor Skills, Glenview, IL: Scott, Foresman, 1976.
Widmark,E.M.P. p i e Theoretischen Grundlaaen und die ~ r a k t i s c h e schen Al ko holbestimmung.
Wilkinson,R.T., Colquhoun ,W.P. Interaction of Alcohol with Incentive and with Sleep Deprivation, Journal of Experimental Psvc hology, 76:623-629, 1968.
Williams,R.M., Goldman,M.S., Williams,D.L. Expectancy and Pharmacological Effects of Alcohol on Human Cognitive and Motor Performance: The Compensation for Alcohol Effect, Journal of Abnormal Psvchology, gO(3) :267-270, 1 981 .
Wood,C.A., Reeve,T.G. Effects of Response Probability on Advanced Programming of Movements, P e r c w and Motor Skills, 58575-582, 1984.
Young,J.R. Blood Alcohol Concentration and Reaction Time. Quarterly Journal pt Studies pf Alcohol, 31 1823-831, 1970.
Zelaznik, H.N., Shapiro, D.C., Carter, M.C. The Specification of Digit and Duration During Motor Programming A New Method of Precuing. J- gf Motor Rehavioy, 14:57-68, 1982.
Zelaznik,H. Precuing Response Factors in Choice Reaction Time: A Word of Caution, m n a l of Motor B e r n , 10:77-79, 1978.
Zelaznik,H.N., Hahn,R. Reaction Time Methods in the Studying of Motor Programming: the recuing of Hand, Digit, and Duration, Journal of Motor Behavior, l7:19O-& 8, 1985.
Zelaznik,H.N., .Larish,D.D. Precuing Methods in the Study of Motor - Programming, B~er imental Rrain Reswrch Series 15, Generation and Modulation of Action Patterns, EdHeuer,H., Fromm,C. Springer- Verlag,Berlin Heidelberg, 1986.
Zirkle,G.A., King,P.D., McAAtee., VanDyke,R. Effects of Chlorpromazine and Alcohol on Coordination and Judgement, JAMA 171 :1496-1499, 1959.