the effectiveness of the rail network across great britain · the effectiveness of the rail network...
TRANSCRIPT

The Effectiveness of the Rail Network Across Great Britain A Comparative Analysis
WHITE PAPER November 2013 Prepared by In Association with
Credo Business Consulting LLP 12 Arthur Street London
EC4R 9AB
The Campaign for Better Transport 16 Waterside 44-48 Wharf Road London N1 7UX

Rail in the Regions
Contents
Table of Contents Foreword
1 Introduction 1
2 The Benchmarking Process 4
3 Analysis of the Key Measures in the Benchmarking Study 6
4 Overall Results 11
5 Assessment 12
6 Conclusions 16
Appendix A: Benchmarking Approach and Sources of Data 18

Rail in the Regions
Foreword
FOREWORD
Our railways are vital to the country. In every area, hundreds of thousands of people rely on the trains for work and leisure and rail travel has been growing fast over the last two decades. Rail freight has also been increasing hand over fist. Both trends are set to continue, with job creation and manufacturing playing to rail's strengths.
The national picture, however, disguises enormous variations. From the crammed commuter services of the south east to the ageing rolling stock still running on some regional routes, the strengths and needs of the railway differ greatly from place to place. This is partly a result of geography, economy, and history - some regions suffered hugely from rail closures in the aftermath of the Beeching Report 50 years ago.
But as this important research highlights, the variation also reflects the different quality, extent and expectations there are of the rail network across the country. For example, enhancing the railways to provide a real choice for people who currently rely on the car will take different forms in different places.
Earlier this year we published a report called "Going Local", which set out the case for devolution of control over local rail services to local authorities and devolved Governments. This was based on the experience with Merseyrail and London Overground where this already happens. Since local authorities took control of performance, passenger satisfaction has improved significantly.
As this report makes clear, other parts of the country are now looking for a stronger voice in their local rail services. Proposals for devolved railways in the North of England and in the West Midlands have been developed, the Welsh Government is looking for more control over its railways and other areas are putting forward rail strategies.
Benchmarking rail services is important in showing the strengths, weaknesses and challenges that each area faces in its rail networks. But while the key decisions are taken in Whitehall, it will be difficult to address the challenges that this report highlights. We will use this report to work with authorities in each area of the country, helping them build on the strength of their railways and addresses the weaknesses this report identifies and seek more say over the key decisions affecting their services.
Stephen Joseph Chief Executive Campaign for Better Transport
Rail in the Regions
1
1 INTRODUCTION 1.1 The Regional Rail Challenge In the face of the current austerity agenda, and the inevitable impact it will have on the availability of public funding, the national and local governments and Local Enterprise Partnerships across Great Britain face two compelling, but potentially contradictory, challenges:
• First, investment in enabling infrastructure is essential to drive absolute growth and ensure regional competitiveness;
• Second, the ongoing period of austerity and the associated budget pressures limit the scope for the public sector to provide this investment.
The contradictory nature of these two challenges creates a significant risk that particular regions or nations within Great Britain may slip into a vicious circle, where funding pressures lead to a degradation of service, which then leads to stagnation and less funding. This could undo much of the growth, progress and investment which the rail industry has enjoyed over the last decade. Regions of Great Britain that aspire to retain their competitiveness and drive future economic growth cannot allow this to happen and the emerging propositions for Rail North and West Midlands Rail are evidence of the growing desire by regions to shape and manage their rail networks to prevent this. The only way to avoid this vicious circle is to deliver more for less, and identify ways to ensure that the rail networks in regions deliver the maximum benefit for passengers, businesses and other stakeholders, whilst ensuring value for money and making the best use of the available funds. The best way to achieve this will be by empowering local decision makers to make informed decisions about local requirements within an enabling network-wide structure, to ensure appropriate integration, focus and prioritisation of funding. Benchmarking and sharing of best practice have key roles to play facilitating this. To support this debate, Credo, in association with the Campaign for Better Transport, has carried out a benchmarking study to provide a comparative analysis of all facets of rail services across the different regions and nations in the UK1. This is intended to provide an initial snapshot of the strengths of the rail network in each part of Great Britain, and highlight the key focus for improvements in each region. Our hope is that this benchmarking exercise will be used by funders of rail services whether it is at DfT, national government level, the range of local government bodies and new Local Transport Boards; bodies such as the Office of Rail Regulation and Passenger Focus; as well as service deliverers whether it be a train operator, franchise bidder or Network Rail; and perhaps more crucially passengers and tax payers to look at how the rail network in their region is performing against comparable regions. We hope it will lead to questions being asked about the quality of the service offered, what can be improved, or where the funding and investment case need to be made more effectively.
1.2 The Different Measures of Effectiveness There is no single measure of the effectiveness of a rail system. A vibrant network will have high passenger usage, show strong growth and have a high market share of all trips made in the region. However, a successful network must also ensure it delivers high levels of customer satisfaction, has the appropriate capacity to meet that demand, has robust service infrastructure and operates an appropriate, modern and accessible fleet. Moreover, the service must offer good value for money, and the leaders of the network must have a clear vision for the future of the network, with the appropriate governance structures and strategic plans to support future growth. Credo’s approach to assessing rail services across Great Britain reflects this, considering services across a broad range of different criteria. Overall, we have developed twelve different metrics which provide an overall assessment of rail in each region and aggregated them into three key measures of:
• Rail Usage and Network Growth
1 Our analysis is presented across the nine former Government Office Regions in England, as well as Scotland and Wales. For simplicity, these geographies are referred to as regions hereafter.

Rail in the Regions
2
• Service Quality and Customer Satisfaction • Network Accessibility and Development Strategy
We have then combined these key metrics to provide an overall assessment across each of these regions. The structure of the index is shown. Details of the process and the index structure are set out in Chapter 2.
1.3 The Comparative Performance of the Regions We have built up our assessment of rail services across the three different categories outlined above, and the overall rankings are shown in Figure 1 below. Figure 1: Comparative assessment of rail across Great Britain
This shows that – as might be expected – London has the best overall rail service in Great Britain. High rail usage and recent investment in service upgrade and rolling stock play a key role in this, although the low relative scores for customer satisfaction, perceived value for money and network crowding provide clear indicators of the future challenges facing rail services to the capital. Outside London, our analysis highlights the relative strengths of the network in both the North West and the West Midlands. In both these areas, high levels of investment in services and infrastructure combined with strong local governance has produced strong growth and growing levels of customer satisfaction. By contrast, the services in the East of England, Wales and the North East face the greatest – if significantly different – challenges. In the East of England, usage is relatively high but the quality of services (as expressed through our measures) are lower than elsewhere in the country and this is also reflected in poor passenger satisfaction. In the North East, quality and satisfaction is higher, but the level of use and network access lags behind the rest of the country. Wales faces a combination of all of these challenges.
1.4 The Comparative Funding Requirements in the Regions Having identified the relative quality of the rail services in each of the regions, we have then compared this with the level of public funding received by each region. This has helped us identify those regions where:
• The rail network receives high levels of funding and this translates to a high quality service; for these regions, the challenge is to maintain the quality of service with a lower level of public support.
• The regions where the funding is high but is not translated to high levels of quality; these regions are need specific strategies to drive improvement to the network to make better use of the funding they are receiving
Overall Benchmarking Scores
KeyGrowth & UsageService QualityAccess
0%
10%
20%
30%
40%
50%
60%
70%
80%
London North West WestMidlands
Scotland South East Yorks andHumber
South West EastMidlands
North East Wales East ofEngland
59%
50% 50%
44% 44%
35%33%
31%28% 26%28%
Rail in the Regions
3
• The parts of the country that receive less funding and quality are below average. It is these regions which may be able to make the strongest case for a greater share of public support.
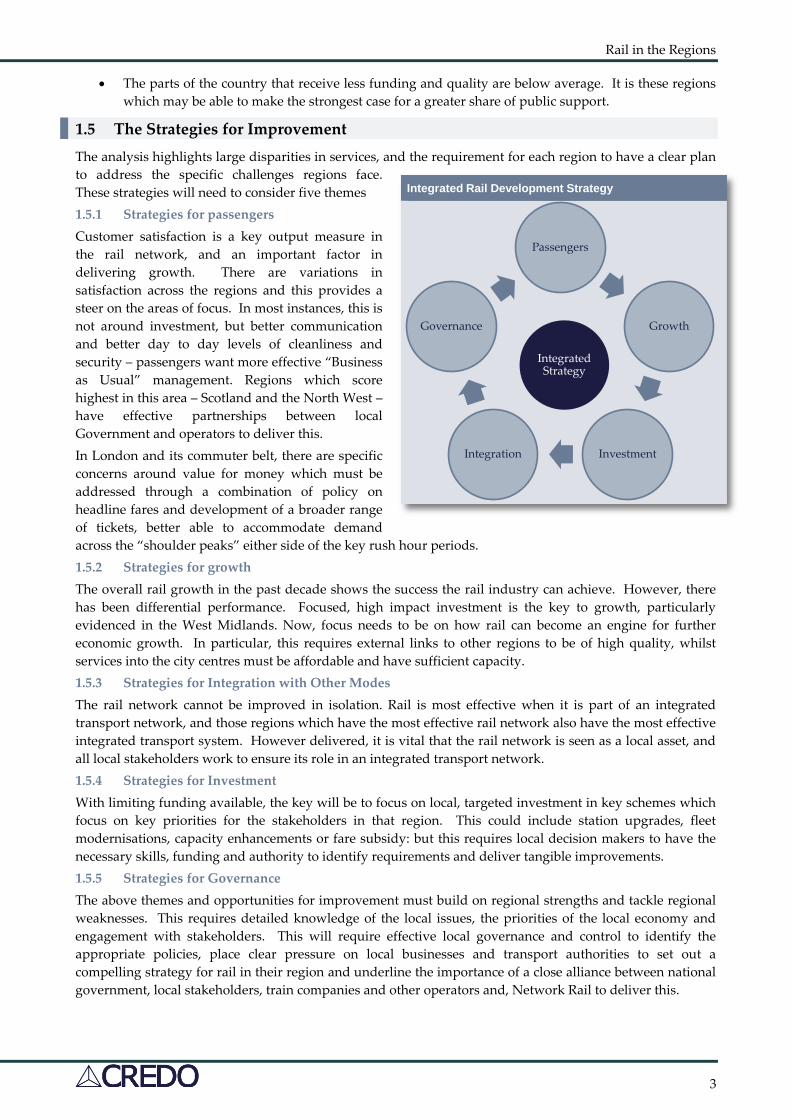
1.5 The Strategies for Improvement The analysis highlights large disparities in services, and the requirement for each region to have a clear plan to address the specific challenges regions face. These strategies will need to consider five themes 1.5.1 Strategies for passengers Customer satisfaction is a key output measure in the rail network, and an important factor in delivering growth. There are variations in satisfaction across the regions and this provides a steer on the areas of focus. In most instances, this is not around investment, but better communication and better day to day levels of cleanliness and security – passengers want more effective “Business as Usual” management. Regions which score highest in this area – Scotland and the North West – have effective partnerships between local Government and operators to deliver this. In London and its commuter belt, there are specific concerns around value for money which must be addressed through a combination of policy on headline fares and development of a broader range of tickets, better able to accommodate demand across the “shoulder peaks” either side of the key rush hour periods. 1.5.2 Strategies for growth The overall rail growth in the past decade shows the success the rail industry can achieve. However, there has been differential performance. Focused, high impact investment is the key to growth, particularly evidenced in the West Midlands. Now, focus needs to be on how rail can become an engine for further economic growth. In particular, this requires external links to other regions to be of high quality, whilst services into the city centres must be affordable and have sufficient capacity. 1.5.3 Strategies for Integration with Other Modes The rail network cannot be improved in isolation. Rail is most effective when it is part of an integrated transport network, and those regions which have the most effective rail network also have the most effective integrated transport system. However delivered, it is vital that the rail network is seen as a local asset, and all local stakeholders work to ensure its role in an integrated transport network. 1.5.4 Strategies for Investment With limiting funding available, the key will be to focus on local, targeted investment in key schemes which focus on key priorities for the stakeholders in that region. This could include station upgrades, fleet modernisations, capacity enhancements or fare subsidy: but this requires local decision makers to have the necessary skills, funding and authority to identify requirements and deliver tangible improvements. 1.5.5 Strategies for Governance The above themes and opportunities for improvement must build on regional strengths and tackle regional weaknesses. This requires detailed knowledge of the local issues, the priorities of the local economy and engagement with stakeholders. This will require effective local governance and control to identify the appropriate policies, place clear pressure on local businesses and transport authorities to set out a compelling strategy for rail in their region and underline the importance of a close alliance between national government, local stakeholders, train companies and other operators and, Network Rail to deliver this.
Integrated Rail Development Strategy
Passengers
Growth
InvestmentIntegration
Governance
Integrated Strategy

Rail in the Regions
4
2 THE BENCHMARKING PROCESS 2.1 Data Sources The study of Rail Value for Money, led by Sir Roy McNulty in 2011, highlighted the importance of using a wide range of data sources to carry out benchmarking across the industry and support the drive for efficiency. Since that time, the industry has made great strides to collating and publishing a broad set of data on industry usage, performance and efficiency, with additional data sets collated and published on a regular basis. Credo has taken advantage of these sources to undertake this benchmarking study across the UK. In total, we have used over 15 different data sources published by the Department for Transport, Network Rail and the ORR. We have also undertaken individual analysis on over 50,000 responses to the National Passenger Survey, analysed and categorised over 1,500 railway stations in the UK and complied fleet information on all of the train operating companies in the UK. The full data sets which we have used are listed in Appendix A.
2.2 The Composition of the Rankings Overall, we have derived three main categories by which we have analysed rail usage and service quality across the UK. In determining an overall score for each region, we have applied an equal weighting to these three categories. Within each category, there are between three and five different indicators. The service in each area has been ranked across each of these indicators and an overall score awarded based on the rank. These have been aggregated to provide the three overall category scores, and these then combined to give a total score. The structure of the index and the source of data are shown in Figure 3 below. Figure 3: Ranking Structure
Data based on individual Train Operating Companies has been allocated to the different regions by the relative location of stations where the TOC is the Station Facility Owner, whilst Passenger Focus’s own data has been used to group passenger responses into different geographies. All other data sources are either published at a Government Office / National level or have been aggregated based on the location of stations, cities, Local Enterprise Partnerships and overall population.

Rail in the Regions
5
2.3 Future Extensions Our 2013 review of rail services across Great Britain is the first of what we anticipate will become an annual series. It is, therefore, a snapshot of the current status of rail services and may not fully reflect the progress which has been made in certain regions over the last few years. We hope that, in future reports, we will be able to track this progress, identify the regions where services are improving the fastest, and identify this best practice which will also be of value to other areas. The study only focuses on the heavy rail network. Obviously light rail and bus services also play a key role in the overall public transport solutions in different areas, and we will evaluate the feasibility of extending the focus in future studies to these additional modes, to help inform the debate on how best to deliver a fully integrated transport network.
Rail in the Regions
6
3 ANALYSIS OF THE KEY MEASURES IN THE BENCHMARKING STUDY 3.1 Rail Usage and Network Growth 3.1.1 The key metrics considered Our assessment of rail usage and network growth has been derived from three key metrics:
• The number of journeys by rail to and around the Government Office Region, normalised to reflect the different populations in the Government Office Regions;
• The comparative growth in journeys per head which have been seen across the different Government Office Regions;
• The relative market share which Rail has in each region as a percentage of all trips made in the region (excluding those trips made by Walking and Cycling).
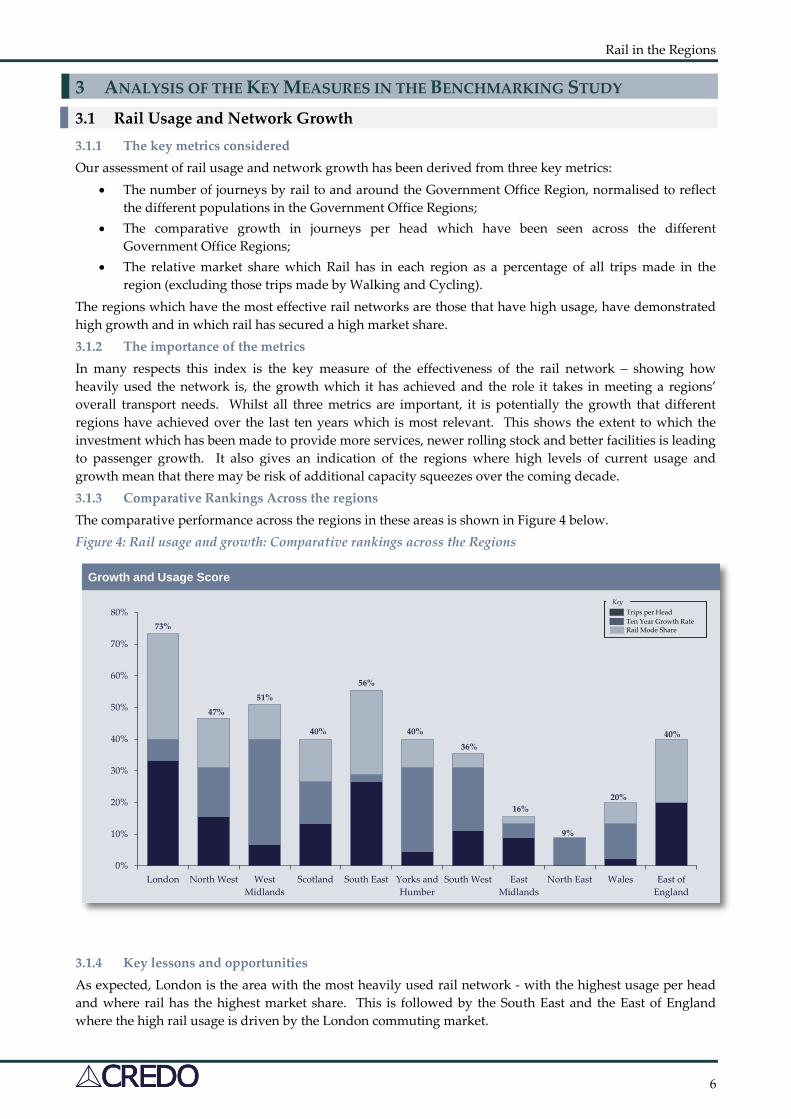
The regions which have the most effective rail networks are those that have high usage, have demonstrated high growth and in which rail has secured a high market share. 3.1.2 The importance of the metrics In many respects this index is the key measure of the effectiveness of the rail network – showing how heavily used the network is, the growth which it has achieved and the role it takes in meeting a regions’ overall transport needs. Whilst all three metrics are important, it is potentially the growth that different regions have achieved over the last ten years which is most relevant. This shows the extent to which the investment which has been made to provide more services, newer rolling stock and better facilities is leading to passenger growth. It also gives an indication of the regions where high levels of current usage and growth mean that there may be risk of additional capacity squeezes over the coming decade. 3.1.3 Comparative Rankings Across the regions The comparative performance across the regions in these areas is shown in Figure 4 below. Figure 4: Rail usage and growth: Comparative rankings across the Regions
3.1.4 Key lessons and opportunities As expected, London is the area with the most heavily used rail network - with the highest usage per head and where rail has the highest market share. This is followed by the South East and the East of England where the high rail usage is driven by the London commuting market.
Growth and Usage Score
0%
10%
20%
30%
40%
50%
60%
70%
80%
London North West WestMidlands
Scotland South East Yorks andHumber
South West EastMidlands
North East Wales East ofEngland
KeyTrips per HeadTen Year Growth RateRail Mode Share73%
51%
47%
56%
40% 40%
36%
16%
40%
9%
20%
Rail in the Regions
7
However, it is striking that these regions, where rail usage is already high, are not those that have been growing fastest. Indeed those three regions are among the four regions with the lowest percentage growth rate over the last decade. Rather, our analysis demonstrates the story of the growth of rail outside of London. Driven by a combination of pull factors (more investment, better services, and newer rolling stock) and push factors (higher costs of motoring, greater congestion etc.) the growth in rail usage outside of London has been marked. In particular, the analysis indicates the rewards that can come with investment. The West Midlands and the North West in particular – areas where there has been significant investment in the past ten years – have been rewarded with strong growth in rail travel, whilst the success of the Trans Pennine Express network, Open Access Operators such as Grand Central, and the introduction of revenue management on East Coast services have played key roles in driving the growth of rail from Yorkshire and Humberside. This faster growth in these regions should be championed, the causes for it fully analysed, and the learnings captured as best practice. However, it is important not to lose perspective of the relative regional differences in the regions. Even if the current differential growth rates were sustained, it would take 15 years for the West Midlands to have the same rail use per head as the South East, and 43 years to achieve the same as London. Our analysis also shows that this growth has not been universal, and that there are a number of regions which risk falling further behind. In particular, in the South West, the North East and Wales, rail has not established itself as a leading mode of travel. Whilst there will be some structural differences which contribute to this – especially around population location and network density, there needs to be a key focus in these regions on how rail can be established as a more integrated part of the overall transport network.
3.2 Rail Service Quality 3.2.1 The key metrics considered If rail is to be seen as both a valuable link for the business community and a real alternative to car travel, then it is essential that services are delivered to a sufficient level of quality to give passengers confidence in using rail. There are a broad range of measures of service quality across the whole journey experience, from passenger information and ticketing in the journey planning stage, through to onward travel options at the final station. For our analysis, we have centred on the five aspects of service quality which we consider to be the most important:
• Station quality – the asset condition of all of the stations across the region; • Rolling Stock Age – the age of the fleet providing rail services across the region. Although not
necessarily the case, newer trains may be expected to provide greater levels of comfort and reliability than the sock they have replaced;
• Crowding – here, we have measured the level of crowding on services into the key city centres in the morning peak;
• Punctuality – as measured through the PPM2 scores which different train companies serving the region are achieving;
• Customer Satisfaction – overall customer satisfaction, as observed in the 2012 National Passenger Satisfaction Survey
The regions which have the most effective rail networks are likely to be those that have modern rolling stock serving well maintained stations, with reliable services which can accommodate demand and thereby deliver a high level of customer satisfaction.
2 PPM is the Public Performance Measure, a measure of the percentage of trains arriving with 5 minutes (local) or 10 minutes (intercity) of their specified arrival time
Rail in the Regions
8
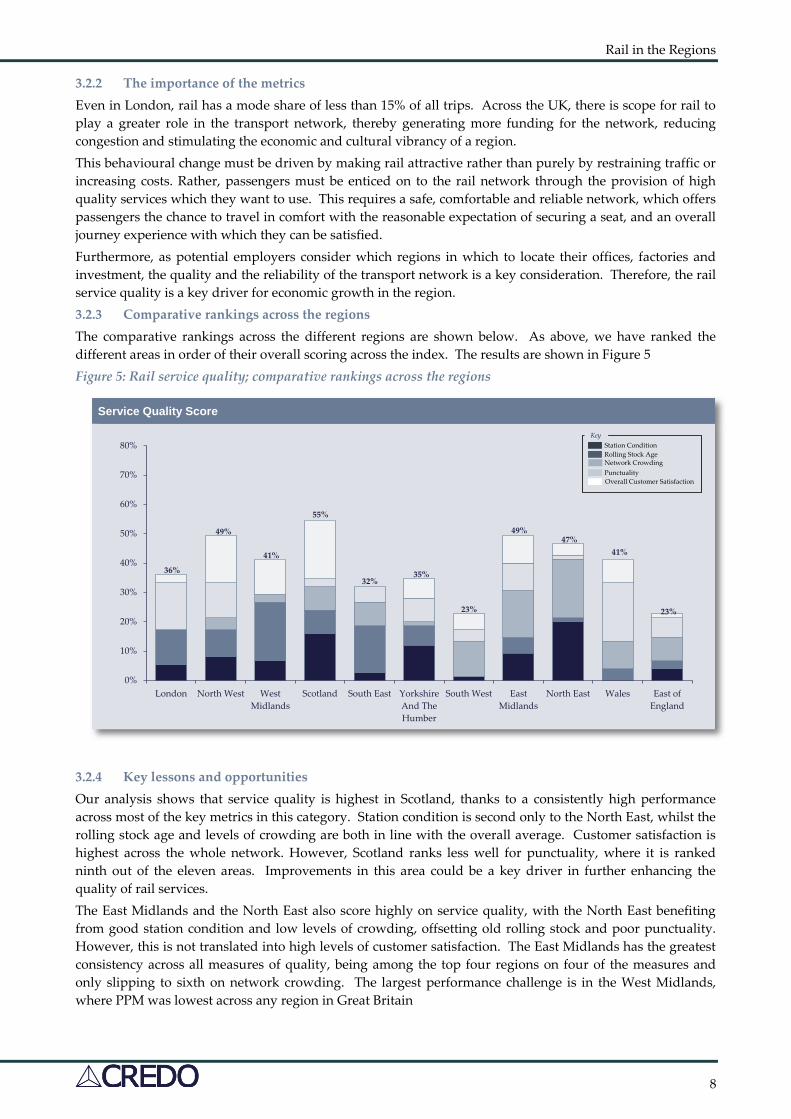
3.2.2 The importance of the metrics Even in London, rail has a mode share of less than 15% of all trips. Across the UK, there is scope for rail to play a greater role in the transport network, thereby generating more funding for the network, reducing congestion and stimulating the economic and cultural vibrancy of a region. This behavioural change must be driven by making rail attractive rather than purely by restraining traffic or increasing costs. Rather, passengers must be enticed on to the rail network through the provision of high quality services which they want to use. This requires a safe, comfortable and reliable network, which offers passengers the chance to travel in comfort with the reasonable expectation of securing a seat, and an overall journey experience with which they can be satisfied. Furthermore, as potential employers consider which regions in which to locate their offices, factories and investment, the quality and the reliability of the transport network is a key consideration. Therefore, the rail service quality is a key driver for economic growth in the region. 3.2.3 Comparative rankings across the regions The comparative rankings across the different regions are shown below. As above, we have ranked the different areas in order of their overall scoring across the index. The results are shown in Figure 5 Figure 5: Rail service quality; comparative rankings across the regions
3.2.4 Key lessons and opportunities Our analysis shows that service quality is highest in Scotland, thanks to a consistently high performance across most of the key metrics in this category. Station condition is second only to the North East, whilst the rolling stock age and levels of crowding are both in line with the overall average. Customer satisfaction is highest across the whole network. However, Scotland ranks less well for punctuality, where it is ranked ninth out of the eleven areas. Improvements in this area could be a key driver in further enhancing the quality of rail services. The East Midlands and the North East also score highly on service quality, with the North East benefiting from good station condition and low levels of crowding, offsetting old rolling stock and poor punctuality. However, this is not translated into high levels of customer satisfaction. The East Midlands has the greatest consistency across all measures of quality, being among the top four regions on four of the measures and only slipping to sixth on network crowding. The largest performance challenge is in the West Midlands, where PPM was lowest across any region in Great Britain
Service Quality Score
0%
10%
20%
30%
40%
50%
60%
70%
80%
London North West WestMidlands
Scotland South East YorkshireAnd TheHumber
South West EastMidlands
North East Wales East ofEngland
KeyStation ConditionRolling Stock AgeNetwork CrowdingPunctualityOverall Customer Satisfaction
36%
49%
41%
32%
55%
35%
23%
49%47%
23%
41%

Rail in the Regions
9
London, the South East and the East of England all score less well in questions of service quality. Whilst most operators in these regions now have a modern fleet and the regions score well for this, other aspects of the service are below the rest of the country. Outside the major hubs, station condition is below average, whilst levels of crowding are higher than anywhere else on the network. These factors (coupled with high fares) lead to levels of customer satisfaction below the national average. Our analysis shows that the South West is the region facing the largest challenges. The large number of stations in need of modernisation and the oldest average fleet age in the country mean it scores very poorly in these categories. Linked in part to this old fleet, punctuality is also low. Whilst crowding into key cities in the region may be less severe than elsewhere, our analysis does not fully reflect the severe overcrowding experienced on local services during the peak (holiday) season. Given the combination of these factors, it is perhaps not surprising that the South West scores fourth lowest for passenger satisfaction. Overall, the most striking feature of this analysis is that all of the regions have different strengths and weaknesses. No single region scores in the top half across all five metrics, and all except the North West and East Midlands score in the bottom quartile for at least one category. This highlights that the regions each have different priorities to focus on, further emphasising the importance of empowering local decision-makers to address local problems.
3.3 Network Accessibility and Development 3.3.1 The key metrics considered Our assessment of plans to develop the network has focused on four key metrics
• The coverage of the rail network, considered through the percentage of the population within walking distance of a rail station;
• Accessibility of the network, as considered by the DfT through its analysis accessibility of the rolling stock to passengers with mobility impairments;
• Passengers’ perception of value for money offered by the rail service, as measured through the NPS, and, by extension, the affordability of the rail network;
• The future plans for transport in the region, as recently measured through the Campaign for Better Transport’s review of Local Enterprise Partnerships in England, our own assessment of transport strategy across the country and an assessment of local governance and devolved decision making.
The regions which have the most effective rail networks are likely to be those that have a good network coverage and can provide access for all, where passengers perceive the current service to offer good value for money and where there is a clear, integrated vision for how the rail network will develop over the next few years as part of an integrated transport network. 3.3.2 The importance of the metrics An effective rail network will ensure everyone has access to centres of employment and can exploit the opportunities afforded by the rail network for leisure and business purposes. The network therefore needs to be accessible – in all senses of the word - having good geographical coverage, providing accessibility for the whole population and being perceived to be affordable. In additional, demand will continue to evolve, and regions must have strategies to deal with this. The Network Accessibility Index captures all of these elements of the rail network. 3.3.3 Comparative Rankings Across the regions The comparative rankings across the different government office regions are shown below:

Rail in the Regions
10
Figure 6: Rail service accessibility; comparative rankings across the regions
3.3.4 Key Lessons and opportunities London scores highest across the Network Accessibility index. In addition to having an extensive rail network which provides good access for the vast majority of the population, the recent upgrade of much of the rolling stock has improved network accessibility. The increased role of Rail for London in London’s rail services (to be increased with the forthcoming devolution of the West Anglia services), coupled with the clear policy and development focus of TfL also provide a clear strategy for services in the capital. However, the region is not without its challenges. It ranks in the bottom three for value for money and, with continued above inflation fares increases, faces serious challenges to ensure the network remains affordable. The West Midlands, North West and South West also score well across this category. In the West Midlands, high levels of accessibility and good perception of value for money, supported by clear plans for the development of the network, all contribute to high scores which are partly offset by a lower score for network access. In the North West, high levels of station quality and a good perception of value for money are key strengths, although the future development and investment plans of the Local Transport Boards are assessed by CBT as being less well developed than elsewhere in England. In the South West, these plans are more developed, and this helps contribute to a strong overall score in spite of poor accessibility across the network at present. The North East scores highest for perception of value for money, but less well in other categories with network accessibility a major challenge. The current route network and population densities mean that there is little that the region can do to improve walking access to the rail network. However, this underlines the importance of integrated public transport services and effective station parking strategies in optimising access to the rail network. Wales and the East of England stand out as the key regions which would benefit most from further focus and development in this area. Wales ranks third for passengers’ perception of value for money and scores well in this area as a result. However, it is in the bottom quartile for the other metrics in this category, and does not appear to have a clear and deliverable plan to improve services in the region. The East of England, by contrast, has recently set out its vision for rail in the region, but has a number of other issues to address. In many parts of the region the network is difficult to access and much of the current fleet is inaccessible, while a combination of crowded services, old rolling stock and fares mean that passengers from this region have the lowest opinion of value for money across Great Britain.
Network Accessibility Score
0%
10%
20%
30%
40%
50%
60%
70%
80%
London North West WestMidlands
Scotland South East YorkshireAnd TheHumber
South West EastMidlands
North East Wales East ofEngland
KeyNetwork AccessValue for MoneyDisabled Access
68%
53%57%
37%
43%
32%
42%
28% 28%
17%22%
Investment Plans
Rail in the Regions
11
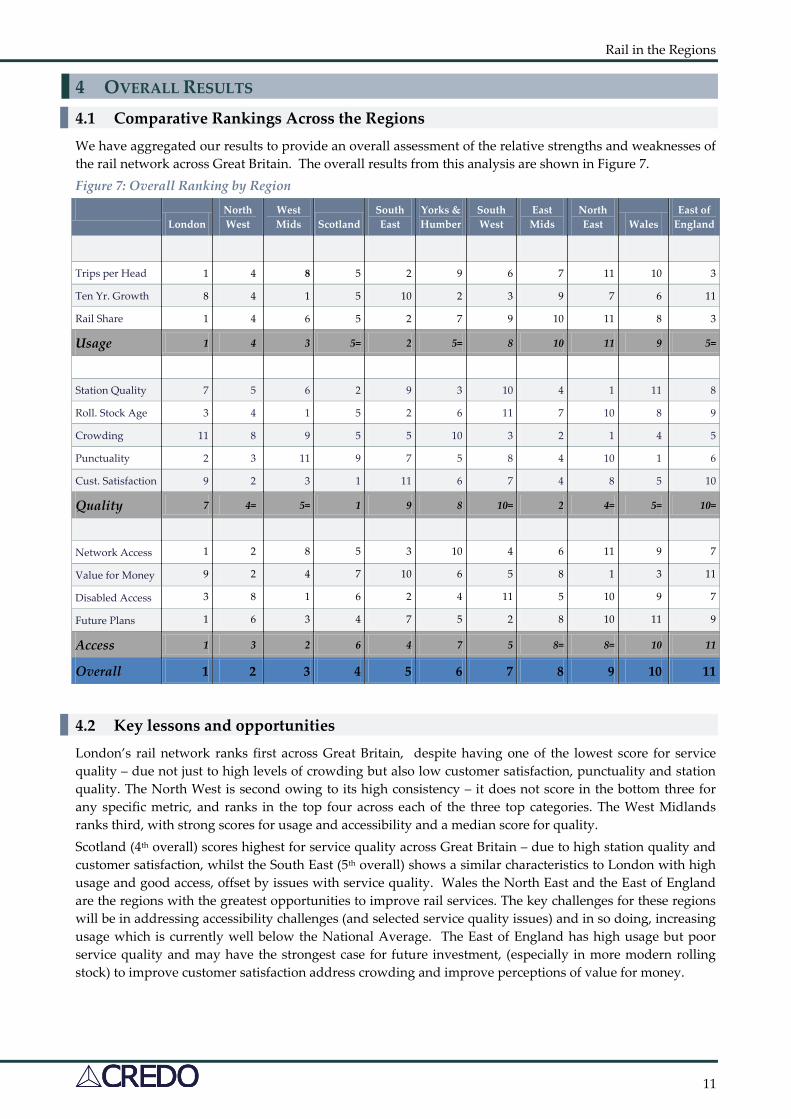
4 OVERALL RESULTS 4.1 Comparative Rankings Across the Regions We have aggregated our results to provide an overall assessment of the relative strengths and weaknesses of the rail network across Great Britain. The overall results from this analysis are shown in Figure 7. Figure 7: Overall Ranking by Region
London
North West
West Mids Scotland
South East
Yorks & Humber
South West
East Mids
North East Wales
East of England
Trips per Head 1 4 8 5 2 9 6 7 11 10 3
Ten Yr. Growth 8 4 1 5 10 2 3 9 7 6 11
Rail Share 1 4 6 5 2 7 9 10 11 8 3
Usage 1 4 3 5= 2 5= 8 10 11 9 5=
Station Quality 7 5 6 2 9 3 10 4 1 11 8
Roll. Stock Age 3 4 1 5 2 6 11 7 10 8 9
Crowding 11 8 9 5 5 10 3 2 1 4 5
Punctuality 2 3 11 9 7 5 8 4 10 1 6
Cust. Satisfaction 9 2 3 1 11 6 7 4 8 5 10
Quality 7 4= 5= 1 9 8 10= 2 4= 5= 10=
Network Access 1 2 8 5 3 10 4 6 11 9 7
Value for Money 9 2 4 7 10 6 5 8 1 3 11
Disabled Access 3 8 1 6 2 4 11 5 10 9 7
Future Plans 1 6 3 4 7 5 2 8 10 11 9
Access 1 3 2 6 4 7 5 8= 8= 10 11
Overall 1 2 3 4 5 6 7 8 9 10 11
4.2 Key lessons and opportunities London’s rail network ranks first across Great Britain, despite having one of the lowest score for service quality – due not just to high levels of crowding but also low customer satisfaction, punctuality and station quality. The North West is second owing to its high consistency – it does not score in the bottom three for any specific metric, and ranks in the top four across each of the three top categories. The West Midlands ranks third, with strong scores for usage and accessibility and a median score for quality. Scotland (4th overall) scores highest for service quality across Great Britain – due to high station quality and customer satisfaction, whilst the South East (5th overall) shows a similar characteristics to London with high usage and good access, offset by issues with service quality. Wales the North East and the East of England are the regions with the greatest opportunities to improve rail services. The key challenges for these regions will be in addressing accessibility challenges (and selected service quality issues) and in so doing, increasing usage which is currently well below the National Average. The East of England has high usage but poor service quality and may have the strongest case for future investment, (especially in more modern rolling stock) to improve customer satisfaction address crowding and improve perceptions of value for money.

Rail in the Regions
12
5 ASSESSMENT 5.1 Differential Funding in the Regions In addition to assessing the quality of rail services across each region, we have also analysed the levels of funding and central Government support received in each region. This includes subsidies to Train Operating Companies and an allocation of the Network Rail grant to provide a comprehensive picture of public support across the regions. It also includes direct contributions from franchise cosignatories such as PTEs, but does not necessarily reflect other local authority spending. We have ranked the subsidy per passenger km across each region. As with the other metrics, each region has been ranked, such that the region which receives the least subsidy is ranked first and that which receives the highest levels of support ranked lowest. The results are shown in Figure 8. Figure 8: Relative Funding of Rail Services in Each Government Office Region.
5.2 Categorising Performance against Funding Having established the relative performance of the rail networks across these 11 regions, and the public funding contribution to rail in each of these regions, we are then able to map the two indices against each other to establish an overall view of service delivery, as shown in Figure 9.
Government Funding of the Rail Network
0
1
2
3
4
5
6
7
8
9
10
11
East ofEngland
London South East North East South West EastMidlands
WestMidlands
North West Yorks &Humber
Scotland Wales
Low
High

Rail in the Regions
13
Figure 9: Assessment of Regions given levels of public support
5.3 Analysis This categorisation allows us to segment the regions into four clear categories, as shown in Figure 10
Figure 10: Categorisation Framework
This analysis highlights those areas which may have the strongest case for additional public support of their
Rail in the Regions
14
rail network. The East of England, in particular, receives less funding than other regions and has a service which ranks lowest in our overall index. To a lesser extent, the North East, East Midlands and South West are in a similar position. The North West, West Midlands and Scotland are at the other extreme - these regions receive high level levels of funding and this is used to deliver high quality rail services. The challenge for these regions will be to maintain the funding for their networks in the face of budgetary pressures, or if this cannot be achieved, ensure any reductions in budget are delivered with the minimum possible loss in service quality. Wales, and to a lesser extent Yorkshire and Humberside, are the regions facing the greatest challenges. The service quality in these regions is at or below average, despite financial support which is above average. It is these regions which may have the most to gain from identifying best practice elsewhere in Great Britain, and ensuring that this is deployed within those areas. The East of England, which has both the lowest level overall scores and the lowest level of public funding, is the region that can make the strongest case for public funding, if it can demonstrate it has the right plans and structures in place to use that funding to deliver service improvements. London and the South East deliver highly effective rail services, in spite of receiving less funding than most regions. Given the high crowding in these regions and the low customer satisfaction – especially with value for money – the key challenge in these areas is ensuring the sustainability of the rail network, and ensuring that the financial burden placed on passengers is reasonable.
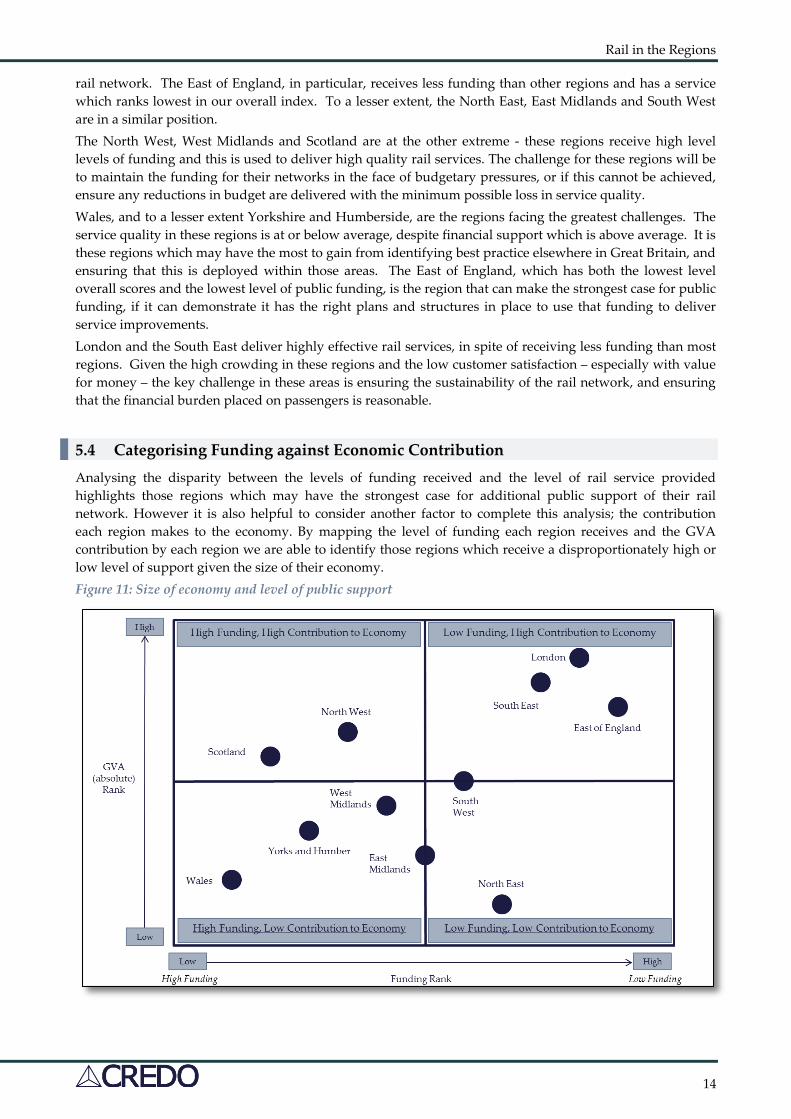
5.4 Categorising Funding against Economic Contribution Analysing the disparity between the levels of funding received and the level of rail service provided highlights those regions which may have the strongest case for additional public support of their rail network. However it is also helpful to consider another factor to complete this analysis; the contribution each region makes to the economy. By mapping the level of funding each region receives and the GVA contribution by each region we are able to identify those regions which receive a disproportionately high or low level of support given the size of their economy. Figure 11: Size of economy and level of public support
Rail in the Regions
15
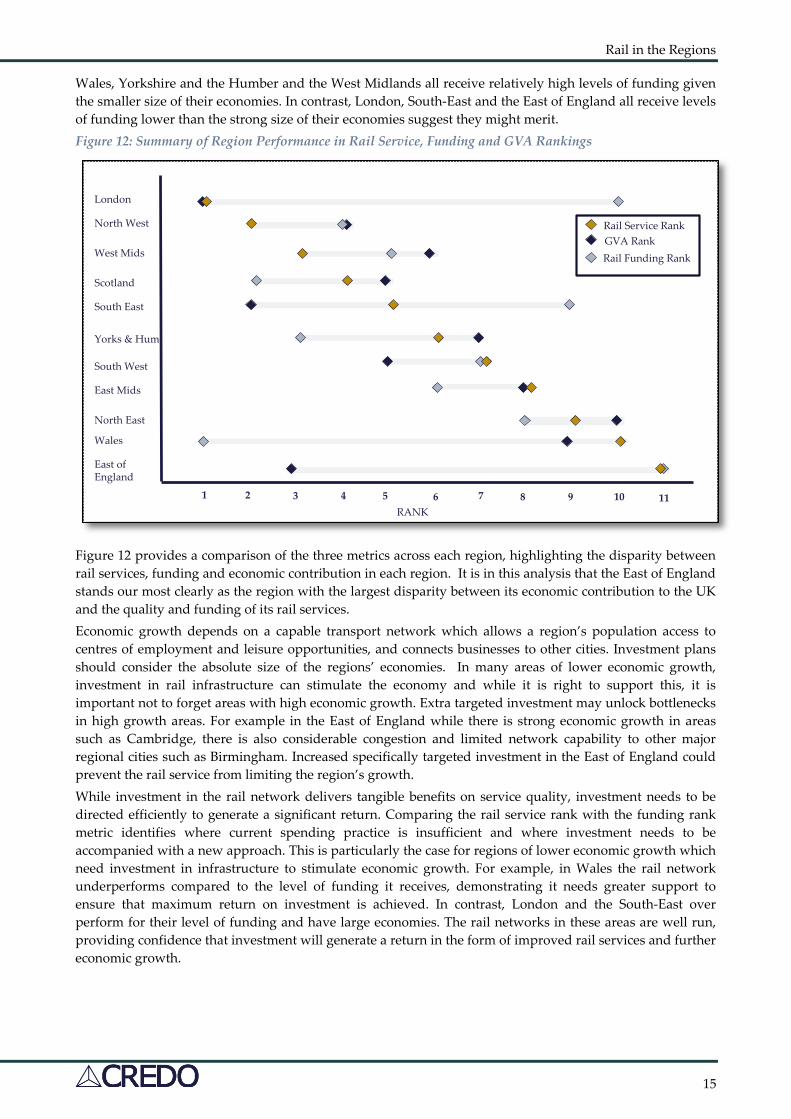
Wales, Yorkshire and the Humber and the West Midlands all receive relatively high levels of funding given the smaller size of their economies. In contrast, London, South-East and the East of England all receive levels of funding lower than the strong size of their economies suggest they might merit. Figure 12: Summary of Region Performance in Rail Service, Funding and GVA Rankings
Figure 12 provides a comparison of the three metrics across each region, highlighting the disparity between rail services, funding and economic contribution in each region. It is in this analysis that the East of England stands our most clearly as the region with the largest disparity between its economic contribution to the UK and the quality and funding of its rail services. Economic growth depends on a capable transport network which allows a region’s population access to centres of employment and leisure opportunities, and connects businesses to other cities. Investment plans should consider the absolute size of the regions’ economies. In many areas of lower economic growth, investment in rail infrastructure can stimulate the economy and while it is right to support this, it is important not to forget areas with high economic growth. Extra targeted investment may unlock bottlenecks in high growth areas. For example in the East of England while there is strong economic growth in areas such as Cambridge, there is also considerable congestion and limited network capability to other major regional cities such as Birmingham. Increased specifically targeted investment in the East of England could prevent the rail service from limiting the region’s growth. While investment in the rail network delivers tangible benefits on service quality, investment needs to be directed efficiently to generate a significant return. Comparing the rail service rank with the funding rank metric identifies where current spending practice is insufficient and where investment needs to be accompanied with a new approach. This is particularly the case for regions of lower economic growth which need investment in infrastructure to stimulate economic growth. For example, in Wales the rail network underperforms compared to the level of funding it receives, demonstrating it needs greater support to ensure that maximum return on investment is achieved. In contrast, London and the South-East over perform for their level of funding and have large economies. The rail networks in these areas are well run, providing confidence that investment will generate a return in the form of improved rail services and further economic growth.
London
North West
West Mids
Scotland
South East
Yorks & Hum.
South West
East Mids
North East
Wales
East of England
1 2 3 4 5 6 7 8 9 10 11RANK
Rail Service Rank
Rail Funding RankGVA Rank
Rail in the Regions
16
6 CONCLUSIONS There is no silver bullet to address the dual challenges of delivering improvements of the rail network in Great Britain whilst reducing the required level of public support. However, what our analysis demonstrates is that each region faces its own unique set of challenges, and these necessitate local planning and delivery of integrated solutions. This will come through four key themes: 6.1.1 Targeted Improvement Plans The CBT report “Going Local,” published in May 2013, highlighted the lessons for rail policy from London Overground and Merseyrail. A key conclusion was that priorities for how this rail network looks and feels should vary, depending on local circumstances. Our analysis firmly supports this conclusion – by highlighting the different strengths and weaknesses of each region, we identify the key areas for future improvement. As each region has different challenges, they need local improvement plans to address them. This must be reinforced through a clear analysis and measurement structure. TOCs (working with Passenger Focus) must demonstrate improvements in satisfaction, Network Rail in timely delivery and Local Transport Boards in the role the rail service plays in the wider community. All bodies must achieve this whilst demonstrating increases in efficiency. We trust that this index provides a useful baseline for each region, and may become an important metric to measure performance in future years. 6.1.2 Appropriate Levels of Investment The high scores received by London, West Midlands and the North West of England show that investing in the rail network delivers tangible benefits on service quality and usage. Current levels of investment must be retained as far as possible during a period of austerity and funding pressure and need to consider not only the current status of the rail network, but also the economic growth of the region and the efficiency of current spend. Investment cannot be taken for granted, and there must be a clear link between future investment and future improvements. For example, in Wales the electrification of the Valley Lines and the associated introduction of new or better rolling stock should lead rail usage, service quality and the overall score of rail services in Wales improving. It is therefore essential that the Welsh Assembly (and other local stakeholders) is empowered and able to use all the levers available to them, in particular in drawing up the specification for the next Wales and Borders Franchise, to capitalise on this investment. 6.1.3 Multi Stakeholder Planning and Delivery This effective local management requires the partners – the train operators and main local stakeholders (whether Transport for London, a Combined Authority, a Local Transport Body (PTE) or a Community Rail Partnership) to engage properly in a meaningful dialogue about what the rail network should, or could, look like. Policy, social and business requirements must be clearly understood, and an integrated solution developed to meet these requirements, in which the relevant parties can bring their resources and expertise to bear for the benefit of the community and the passenger. This recommendation is consistent with the Brown Report and its core recommendations around flexible franchise agreements helped by strong partnership arrangements between the client and the franchise operator and clearly stated franchise incentives designed to meet the client (funder’s) objectives. 6.1.4 Devolved Responsibility and Government Targets, investment and planning are only as strong as the bodies in place to manage the delivery of the plans. The creation of Local Enterprise Partnerships and in turn Local Transport Bodies have now devolved responsibility for managing the Central Government Funding Allocation and distributing it to spending priorities in their area. Similarly, funding through the Local Growth Fund, gives opportunities for improvements to local rail services, and this report is intended to help guide these. There has also been a move within the UK rail industry to move away from centralised control by Central Government and a similar move to decentralisation within Network Rail, and Community Rail Partnership’s which have extended control and influence to “line of route level.”

Rail in the Regions
17
However, the greatest opportunity to change arises from the re-franchising timetable. There is increasing interest and in some cases specific propositions such as Rail North and West Midlands Rail for more local control of local rail services. Other opportunities may emerge, particularly in London with TfL extending their reach, but so too for rail services around Bristol, and greater devolution of Welsh services, and perhaps we will see a move to micro-franchising for areas such as Cornwall or Cumbria. We believe that this trend must continue, and lead to the devolution of budgets, decision making and accountability to a more local level. 6.1.5 Alignment of funding Our analysis demonstrates an imbalance between the quality of the rail network and the levels of funding recevied in a number of regions. Comparison of this imbalance against current economic output highlights that some of the most important contributors to the UK economy (such as the East of England) have poor quality rail services and receive a disproportionately low share of public funding. This prompts a debate about how funding is allocated and where investment should be focused to maximise the contribution of the rail network to the UK’s economic recovery. We hope that this benchmarking exercise will help Local Transport Bodies, Local Enterprise Partnerships and franchise operators to understand their current performance, and provide an annual framework by which all parties can measure their effectiveness in improving their rail services.
Rail in the Regions
18
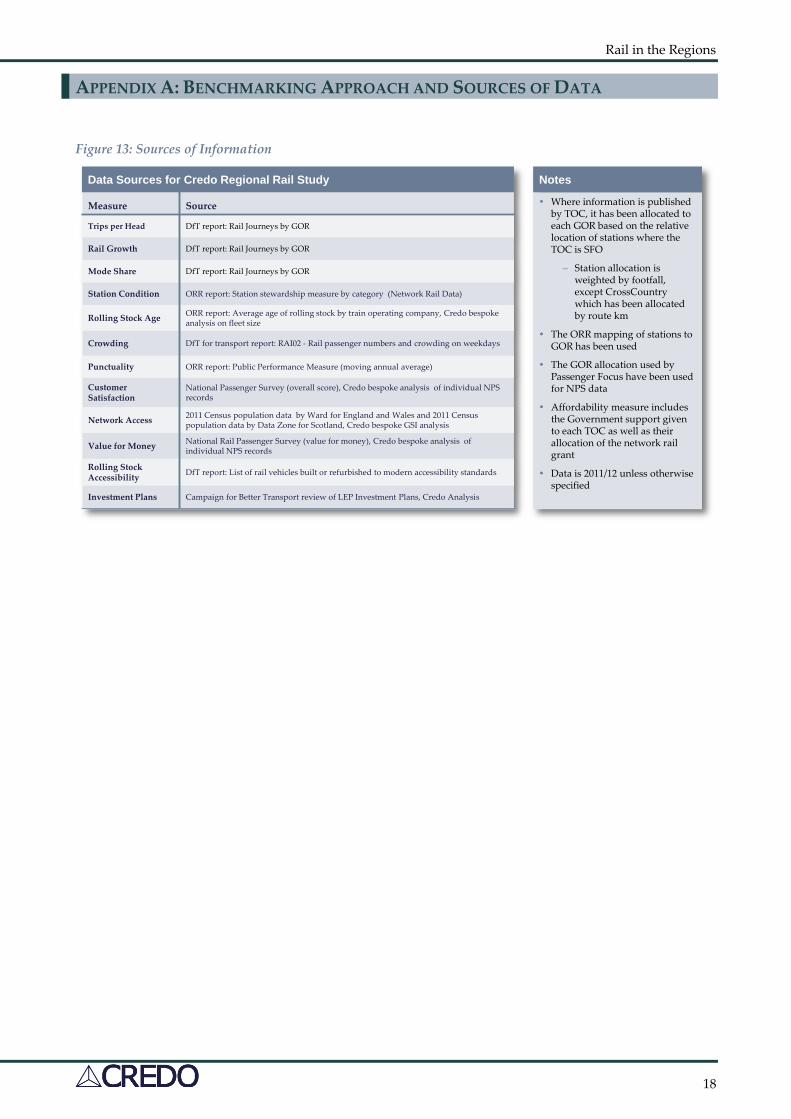
APPENDIX A: BENCHMARKING APPROACH AND SOURCES OF DATA
Figure 13: Sources of Information
Data Sources for Credo Regional Rail Study
Where information is published by TOC, it has been allocated to each GOR based on the relative location of stations where the TOC is SFO
– Station allocation is weighted by footfall, except CrossCountrywhich has been allocated by route km
The ORR mapping of stations to GOR has been used
The GOR allocation used by Passenger Focus have been used for NPS data
Affordability measure includes the Government support given to each TOC as well as their allocation of the network rail grant
Data is 2011/12 unless otherwise specified
Measure Source
Trips per Head DfT report: Rail Journeys by GOR
Rail Growth DfT report: Rail Journeys by GOR
Mode Share DfT report: Rail Journeys by GOR
Station Condition ORR report: Station stewardship measure by category (Network Rail Data)
Rolling Stock Age ORR report: Average age of rolling stock by train operating company, Credo bespokeanalysis on fleet size
Crowding DfT for transport report: RAI02 - Rail passenger numbers and crowding on weekdays
Punctuality ORR report: Public Performance Measure (moving annual average)
Customer Satisfaction
National Passenger Survey (overall score), Credo bespoke analysis of individual NPS records
Network Access 2011 Census population data by Ward for England and Wales and 2011 Census population data by Data Zone for Scotland, Credo bespoke GSI analysis
Value for Money National Rail Passenger Survey (value for money), Credo bespoke analysis of individual NPS records
Rolling Stock Accessibility DfT report: List of rail vehicles built or refurbished to modern accessibility standards
Investment Plans Campaign for Better Transport review of LEP Investment Plans, Credo Analysis
Notes