the effectiveness of neighborhood watch · the primary aim of this review is to assess the...
TRANSCRIPT

Campbell Systematic Reviews 2008:18 First published: 10 December, 2008 Last updated: 10 December, 2008
The Effectiveness of Neighborhood Watch Trevor Bennett, Katy Holloway, David Farrington

Colophon
Title The effectiveness of neighborhood watch
Institution The Campbell Collaboration
Authors Bennett, Trevor Holloway, Katy Farrington, David
DOI 10.4073/csr.2008.18
No. of pages 48
Last updated 10 December, 2008
Citation Bennett T, Holloway K, Farrington D. The effectiveness of neighborhood watch. Campbell Systematic Reviews 2008:18 DOI: 10.4073/csr.2008.18
Copyright © Bennett et al. This is an open-access article distributed under the terms of the Creative Commons Attribution License, which permits unrestricted use, distribution, and reproduction in any medium, provided the original author and source are credited.
Keywords
Contributions None stated.
Support/Funding The Campbell Collaboration University of Glamorgan, United Kingdom
Potential Conflicts of Interest
There is no conflict of interest. However, one of the studies included in the review was conducted by Trevor Bennett.
Corresponding author
Trevor Bennett Centre for Criminology University of Glamorgan Pontypridd, CF37 1DL United Kingdom Telephone: + 44 1443 482 236 E-mail: [email protected]

Campbell Systematic Reviews
Editors-in-Chief Mark W. Lipsey, Vanderbilt University, USA
Arild Bjørndal, Norwegian Knowledge Centre for the Health Services & University of Oslo, Norway
Editors
Crime and Justice David B. Wilson, George Mason University, USA
Education Chad Nye, University of Central Florida, USA Ralf Schlosser, Northeastern University, USA
Social Welfare Julia Littell, Bryn Mawr College, USA Geraldine Macdonald, Queen’s University, UK & Cochrane Developmental, Psychosocial and Learning Problems Group
Managing Editor Karianne Thune Hammerstrøm, The Campbell Collaboration
Editorial Board
Crime and Justice David Weisburd, Hebrew University, Israel & George Mason University, USA Peter Grabosky, Australian National University, Australia
Education Carole Torgerson, University of York, UK
Social Welfare Aron Shlonsky, University of Toronto, Canada
Methods Therese Pigott, Loyola University, USA Peter Tugwell, University of Ottawa, Canada
The Campbell Collaboration (C2) was founded on the principle that systematic reviews on the effects of interventions will inform and help improve policy and services. C2 offers editorial and methodological support to review authors throughout the process of producing a systematic review. A number of C2's editors, librarians, methodologists and external peer-reviewers contribute.
The Campbell Collaboration P.O. Box 7004 St. Olavs plass 0130 Oslo, Norway www.campbellcollaboration.org

1
THE EFFECTIVENESS OF NEIGHBORHOOD WATCH
CAMPBELL REVIEW
Reviewers
Professor Trevor BennettDirectorCentre for CriminologyUniversity of GlamorganPontypridd, CF37 1DLUnited Kingdom
Telephone: International + 44 (1443 482236)Fax: International + 44 (1443 484507)Email: [email protected]
Dr Katy HollowayResearch FellowCentre for CriminologyUniversity of GlamorganPontypridd, CF37 1DLUnited Kingdom
Telephone: International + 44 (1443 483419)Fax: International + 44 (1443 484507)Email: [email protected]
Professor David FarringtonProfessor of Psychological CriminologyInstitute of CriminologyUniversity of CambridgeSidgwick AvenueCB3 9DTUnited Kingdom
Telephone: International + 44 (1223 335360)Fax: International + 44 (1223 335356)Email: [email protected]

2
ABSTRACT
BackgroundNeighborhood watch (also known as block watch, apartment watch, home watch and community watch) grew out of a movement in the US during the late 1960s that promoted greater involvement of citizens in the prevention of crime. Since then, interest in neighborhood watch has grown considerably and recent estimates suggest that over a quarter of the UK population and over forty per cent of the US population live in areas covered by neighborhood watch schemes.
ObjectivesThe primary aim of this review is to assess the effectiveness of neighborhood watch in reducing crime.
Criteria for inclusion of studiesNeighborhood watch sometimes comprises a stand-alone scheme and sometimes includes additional program elements. The most common combination of program elements is the ‘big three’ (neighborhood watch, property marking and security surveys). Studies were selected for inclusion in the review if they were based on a watch scheme either alone or in combination with any of the other ‘big three’ elements. The main quality control was that the studies should be based on random allocation or a pre-post test design with a comparison area.
Search StrategyStudies were identified by searching 11 electronic databases. In addition, studies were sought using on-line library catalogues, literature reviews, lists of references, and published bibliographies. Leading researchers in the field were also contacted when there was a particular need to do so.
Data collection and analysisThe narrative review was based on 19 studies (covering 43 evaluations) and the meta-analysis was based on 12 studies (covering 18 evaluations). The data used included police-recorded crimes and self-reported victimizations.
Main resultsThe main finding of the narrative review was that the majority of the schemes evaluated indicated that neighborhood watch was effective in reducing crime.
The main finding of the meta-analysis was that the weighted mean odds ratio for all studies combined was 1.19 using the fixed effects method and 1.36 using the random effects method. The results of both methods show that neighborhood watch was associated with a reduction in crime of between 16 per cent and 26 per cent.
Reviewers’ conclusionsThis review concludes that neighborhood watch is associated with a reduction in crime.
This review should be cited as:Bennett Trevor, Holloway Katy, and Farrington David. “The Effectiveness of Neighborhood Watch”. In: The Campbell Collaboration Reviews of Intervention and Policy Evaluations (C2-RIPE).
3
BACKGROUND FOR THE REVIEW
Introduction
Neighborhood watch (also known as block watch, apartment watch, home watch and community watch) grew out of a movement in the US that promoted greater involvement of citizens in the prevention of crime (Titus, 1984). One of the first recorded neighborhood watch programs in the US was the Seattle Community Crime Prevention Project launched in 1973 (Cirel et al., 1977). One of the first recorded neighborhood watch schemes in the UK was the Home Watch program implemented in 1982 in Cheshire (Anderton, 1985).
Since the 1980s, the number of neighborhood watch schemes in the UK has expanded considerably. The report of the 2000 British Crime Survey estimated that over a quarter (27%) of all households (approximately six million households) in England and Wales were members of a neighborhood watch scheme (Sims, 2001). This amounted to over 155,000 active schemes. A similar expansion has occurred in the US. The report of The 2000 National Crime Prevention Survey (National Crime Prevention Council, 2001) estimated that 41 per cent of the American population lived in communities covered by neighborhood watch. The report concluded, ‘This makes Neighborhood Watch the largest single organized crime prevention activity in the nation’ (p.39). Considering such large investments in terms of resources and community involvement, it is reasonable for researchers to ask whether neighborhood watch is effective in reducing crime.
The theory of neighborhood watch
The most frequently recorded mechanism by which neighborhood watch is supposed to reduce crime is by residents looking out for suspicious activities and reporting these to the police. The link between reporting and crime reduction is not usually elaborated in the literature. However, it has been argued that visible surveillance might reduce crime as a result of its effect on the perceptions and decision making of potential offenders. Hence, watching and reporting might deter offenders if they are aware of the propensity of the local residents to report suspicious behavior and if they perceive this as increasing the risks of being caught.
Neighborhood watch might also lead to a reduction in crime through the reduction in opportunities for crime. One method discussed in the literature is through the creation of signs of occupancy. Some of the methods by which members of neighborhood watch schemes might create signs of occupancy were discussed in the report of the Seattle scheme (Cirel et al., 1977). These include removing newspapers and milk from outside neighbors’ homes when they are away, mowing the lawn, and filling up trash cans. The way in which signs of occupancy might reduce crime might be through the effect that this has on the perceptions of potential offenders in terms of their likelihood of getting caught.
Neighborhood watch might also lead to a reduction in crime through the various mechanisms of social control. Informal social control is not one of the mechanisms for reducing crime stated in the publicity material of these schemes. Nevertheless, they might indirectly serve to enhance community cohesion and increase the ability of communities to control crime (Greenberg, Rohe, and Williams, 1985). Informal social control can affect community crime

4
through the generation of acceptable norms of behavior and by direct intervention by residents.
It is also possible that neighborhood watch schemes might reduce crime through enhancing police detection. Neighborhood watch might serve to increase in the flow of useful information from the public to the police. An increase in information concerning crimes in progress and suspicious persons and events might lead to a greater number of arrests and convictions and result (when a custodial sentence is passed) in a reduction in crime through the incapacitation of local offenders (Bennett, 1990).
It is also feasible that neighborhood watch might reduce crime through the other components of the program package. It has been argued that property marking might lead to a reduction in crime as a result of making the disposal of marked property more difficult (Laycock, 1985). This might reduce offending rates if potential offenders viewed marked property as increasing the risk of detection. Home security surveys might lead to a reduction in crime as a result of making it physically more difficult for an offender to enter the property (Bennett and Wright, 1984).
Program elements
Neighborhood watch is often implemented as part of a comprehensive package. The typical package is sometimes referred to as the ‘big three’ and includes neighborhood watch, property-marking and home security surveys (Titus, 1984). Some programs include a third or fourth element such as a recruitment drive for special constables, increased regular foot patrols, citizen patrols, educational programs for young people, auxiliary police units, and victim support services.
Neighborhood watch schemes vary in terms of the size of the area covered. Some of the earlier schemes in the US and the UK were based on areas covering just a few households. More recent schemes sometimes cover many thousand households. One of the smallest schemes included in the review was the ‘cocoon’ neighborhood watch program in Rochdale in England covering just one dwelling and its immediate neighbors (Forrester, Frenz, O’Connell, and Pease, 1990). One of the largest was the Manhattan Beach neighborhood watch scheme in Los Angeles covering a population of over 30,000 residents (Knowles, 1983).
Neighborhood watch schemes can be both public and police initiated. Schemes launched in the UK during the early period of a program tended to be police initiated (e.g. the early neighborhood watch schemes in the Metropolitan Police District). More recently, neighborhood watch schemes have been launched mainly at the request of the public. Some police departments continue initiating their own schemes, even when the program is fully developed. A program implemented in Detroit, for example, maintained a section of police-initiated schemes in order to promote neighborhood watch in areas that were unlikely to generate public-initiated requests (Turner and Barker, 1983).
In the US, block watches are usually run by a block captain who is responsible to a block co-ordinator or block organizer. The block co-ordinator acts as the liaison person to the local police department. Neighborhood watch schemes in the UK often include street co-ordinators (equivalent to block captains) and area co-ordinators (equivalent to the block organizer).

5
There is little information in the literature on the number and type of neighborhood watch meetings. The evidence that does exist suggests that some schemes have public meetings that involve all of the residents participating in the scheme, while others have meetings that involve only the organizers of the scheme (Bennett, 1990).
The funding of neighborhood watch schemes is nearly always a joint venture between the local police department and the scheme members through their fund-raising activities. The relative contribution of the two sources varies considerably. Some schemes in the United States are provided with no more than an information package from the local police. Others are provided with police facilities for the production of newsletters and the use of police premises for meetings (Turner and Barker, 1983). Apart from police funding, the majority of schemes are encouraged to raise some funds from other sources such as voluntary contributions, local businesses, and the proceeds of fêtes, and raffles.
Crimes targeted
There is a consensus in the literature that the main aim of neighborhood watch is crime prevention. There are small variations among the programs in terms of which crimes are targeted. The vast majority of programs identify residential burglary as the sole or most important target crime of neighborhood watch. Some programs list other offences that it is hoped neighborhood watch will reduce. The list of other offences is sometimes specific (e.g. 'street robberies, auto thefts and vandalism') and sometimes general (e.g. 'street crime' and 'property crime').
Previous reviews
There are several reviews of evaluations of neighborhood watch programs. One of the earliest conducted in the US was by Titus (1984) who summarized the results of nearly fortycommunity crime prevention programs. Most of these included elements of neighborhood watch. The majority of studies was conducted by police departments or included data from police departments. Nearly all of the studies found that neighborhood watch areas were associated with lower levels of crime. However, most of the evaluations were described as ‘weak’ on the grounds that they offered no comparison group.
Another review of the literature looked mainly at community watch programs in the UK (Husain, 1990). The study reviewed the results of nine existing evaluations and conducted an original analysis of community watch in six additional locations using police-recorded crime data. The review of existing evaluations concluded that there was little evidence that NW prevented crime.
One of the most recent reviews of the literature on the effectiveness of community watch programs selected only evaluations with the strongest research designs. The authors included only studies that used random assignment or studies that monitored both watch areas and similar comparison areas without community watch. The review found just four evaluations that matched these criteria. The results of these evaluations were largely negative. The authors concluded, ‘The oldest and best-known community policing program, Neighborhood

6
Watch, is ineffective at preventing crime’ (Sherman et al, 1997, p. 353; see also Sherman and Eck, 2002).
Objectives of the review
The primary aim of this review is to assess the effects of neighborhood watch on crime.
The primary objectives of the review are:
1) To operationalize the inputs (e.g. neighborhood watch) and the outcomes (e.g. crime) for the purpose of conducting the review.2) To identify studies that have evaluated the effect of neighborhood watch on crime.3) To identify a list of studies that meet the minimum criteria of scientific rigor.4) To obtain a comparable measure of effect size for the most rigorous studies.5) To arrive at a conclusion about the effectiveness of neighborhood watch.
METHODS
Criteria for inclusion and exclusion of studies in the review
Types of intervention
Neighborhood watch is often implemented alongside other programs. In practice, this is done in two main ways:
a) Neighborhood watch schemes often include elements of other programs within the project. Watch schemes are sometimes described as comprising ‘the big three’ (neighborhood watch, property marking, and security surveys). The additional elements (property marking and security surveys) are viewed as part of neighborhood watch when implemented as part of a package.
b) Neighborhood watch schemes (either single watch schemes or ‘the big three’) are sometimes implemented alongside other related schemes (such as environmental improvements and neighborhood organizing programs) as part of a comprehensive (multi-project) program.
The following types of intervention will be included in the review:
a) stand-alone neighborhood watch schemes (comprising solely a watch component).b) neighborhood watch schemes that include ‘the big three’ (neighborhood watch, property marking and security surveys) as long as there is a watch component.c) neighborhood watch schemes that include two components of ‘the big three’ as long as there is a watch component.

7
In other words, for the purpose of the review we are defining neighborhood watch to mean stand-alone neighborhood watch schemes and neighborhood schemes with additional related elements.
Types of participants
Watch programs can be based on a diversity of populations, including boat owners, farmers, and business employees, and a diversity of locations, including car parks, yacht marinas, and the countryside. The current review is based on schemes involving residents living in neighborhoods.
Types of mediating processes
One of the most important defining elements of neighborhood watch is the mechanism by which the project aims to reduce crime. The main mechanisms of the ‘watch’ part of neighborhood watch schemes are:
a) residents operating as the ‘eyes and ears’ of the police (i.e. surveillance)b) residents reporting suspicious behavior to the police or neighborhood co-ordinatorc) residents interacting and working together to solve problems (which might strengthen
social cohesion, collective efficacy, community activism, and other mechanisms of informal social control.)
The mechanisms described above rule out neighborhood wardens and similar citizen patrols. Citizen patrols are based: (a) on the appointment of residents to a particular role, and (b) on agreement to conduct particular duties such as patrolling the streets. Watch schemes are based solely on residents operating in their capacity as residents.
Types of outcome
The review focuses mainly on the impact of neighborhood watch schemes on crime. The types of crimes covered in the review are those that neighborhood watch might be able to reduce. These include the following:
a) crimes against residentsb) crimes against dwellingsc) other (street) crimes occurring in the watch area
When crime measures are based on police recorded crimes, the main outcome measure is the total number of crimes recorded in the areas studied. When crime measures are based on victimization surveys, the main outcome measure is the prevalence of victimization.
Types of evaluation design
The criteria for selecting rigorous evaluations are based on the Maryland Scientific Methods Scale (SMS) (Sherman and Eck, 2002). This is a five-point scale ranging from level 1 (the weakest design) to level 5 (the strongest design) in terms of overall internal validity. Sherman and Eck (2002) argue that evaluations should be at least level 3 in order to conclude, with a reasonable level of certainty that the program worked. The current review of evaluations also uses this level as the minimum acceptable for inclusion in the review. This level requires that

8
the evaluation must comprise at least a comparison of one or more experimental units and one or more comparable control units over time. Hence, the minimum requirement for inclusion of evaluations in the review of neighborhood watch is that they are based on both before and after surveys and experimental and comparison areas.
Search strategy for identification of studies
Criteria for selecting studiesThe review included published and unpublished literature.It was based on documented evaluations.There was no restriction on country of origin.The evaluations had to be available in English.There was no restriction on source sector (e.g. academic, government, policy, voluntary, etc.).There was no restriction in terms of year (e.g. year of implementation, study, or publication).There was no restriction of the time period covered by the evaluation (e.g. short-term or long-term effects).
Sources used for selecting studies
The following search strategies were used:
1) search on-line databases (especially for reports and articles)2) search on-line library catalogues (especially for books)3) search reviews of the literature on the effectiveness of neighborhood watch in preventing
crime 4) search bibliographies of publications on neighborhood watch5) contact leading researchers
The following datasets were searched:
1) IBSS (International Bibliography of the Social Sciences)2) Web of Science3) Criminal Justice Abstracts4) National Criminal Justice Reference Service Abstracts5) Sociological Abstracts6) Psychological Abstracts (PsycINFO)7) Social Science Abstracts8) Government Publications (Home Office)9) Dissertation Abstracts (ASSIA)10) ProQuest11) C2-SPECTR
Search terms
The following search terms were used in the database searches:
neighborhood watch, neighbourhood watch, street watch, block watch, apartment watch, home watch, community watch, home alert, block association, crime alert, block clubs, crime watch, ‘big three’.

9
Description of methods used in primary research
The main types of research design used for evaluating neighborhood watch schemes have been discussed in previous sections. The most common is some kind of quasi-experimental design. The review includes only the strongest of these designs. In practice, quasi-experimental designs were selected only if they included before and after measures in experimental and comparable control areas.
Criteria for determination of independent findings
Evaluations sometimes produce multiple outcome measures. These can occur when:
(1) there are multiple methods of measuring the same outcome, and (2) when the same outcome is measured at multiple points in time.
When multiple outcome measures are provided (e.g. multiple outcome measures of crime) we listed the results for each measure. However, the analysis is based on only one measure. The measure chosen is based on a system for prioritizing the results (i.e. burglary first, followed by all property crimes and then all crimes). When the same outcome is measured at multiple points in time, we have selected the year before and the year after the implementation of the scheme as the first choice. Failing this, we chose other periods in accordance with the above priority system (i.e. periods nearest to the point of implementation were chosen first).
Details of coding categories
The information extracted included: author, publication date, study date, location, physical context of the intervention, type of intervention, duration of the intervention, duration of the evaluation, sample size, other interventions employed at the time, outcome measures, data source, research design, results, author(s) conclusion.
Statistical procedure and conventions
Meta-analyses were carried out to determine an overall effect size. Odds ratios were calculated for each evaluation and a weighted mean odds ratio was calculated for all studies combined based on the guidelines summarized in Lipsey and Wilson (2001). See meta-analysis section for details of the statistical methods used.
Attrition of publications at various stages
Table 1 presents the results of the literature searches. The first section of the table displays the number of publications identified (i.e. the number of ‘hits’) from the literature searches described above. A total of 1,595 publications were identified from the searches. The second section of the table shows the number of publications that was provisionally selected for inclusion. Overall, 335 publications were selected as potentially relevant evaluations. Criteria

10
for selecting publications at this stage were based on a review of titles and abstracts. Publications that were clearly NOT evaluations of neighborhood watch were excluded. The 335 potentially relevant publications included 110 publications that had been identified previously. Hence, 225 unique publications were selected for potential inclusion in the review. The third section of the table displays the number of selected (non-duplicated) publications that were obtained and not obtained. Of the 225 selected publications, 137 (61%) were obtained. The main reasons for not obtaining publications were that they could not be located following various attempts to obtain them by inter-library loan, through the Internet, or by contacting the authors. The fourth section of the table shows publications eligible for inclusion. Thirty publications were eligible and 107 were ineligible. The main reason for ineligibility (n=60) was that the publication did not include an evaluation of neighborhood watch (see Table A1 for details of all ineligible publications). Eleven of the eligible publications presented results that were included in another eligible publication. In each of these cases, the most detailed publication was selected for inclusion in the review. This resulted in 19 publications that presented findings from 19 unique studies. Some studies included evaluations of more than neighborhood watch program. In total, these 19 studies covered evaluations of 43 separate neighborhood watch schemes. The last section of the table shows the number of studies that were included in the meta-analysis. Of the 19 studies, 12 were suitable for inclusion in the meta-analysis on the grounds that they provided sufficient data to conduct the analyses required. In total, these 12 studies covered evaluations of 18 separate neighborhood watch schemes.

11
Table 1: Attrition of publications
Stage Total
IDENTIFIED PUBLICATIONS 1,595
WHETHER PUBLICATION SELECTED
Selected 335 Non-duplicates 225 Duplicates 110
Not selected 1,260Total 1,595
WHETHER NON-DUPLICATE PUBLICATIONS OBTAINED
Obtained 137Not obtained 88Total 225
WHETHER OBTAINED PUBLICATIONS ELIGIBLE FOR NARRATIVE REVIEW
Eligible publications 30 Studies 19 Evaluations 43
Not eligible publications 107Total 137
WHETHER STUDIES ELIGIBLE FOR META ANALYSIS
Eligible studies 12 Evaluations 18
Not eligible studies 7 Total 19
Notes: Publication = a published document. Study = a research project. Evaluation = an evaluation of a single neighborhood watch scheme. The results of a research project (study) might be reported in more than one publication. A study might present the results of more than one evaluation.
Description of studies meeting the eligibility criteria
The searches described above resulted in 19 studies eligible for inclusion in the review covering 43 evaluations of neighborhood watch schemes. Table 2 provides a description of these studies.
The first column provides details about the author and year of publication. The majority of studies (n=12) were published in the 1980s, when interest in evaluating neighborhood watch was at its height. The second column shows that nine studies reported findings about neighborhood watch schemes operating in the UK and eight reported findings about schemes

12
operating in the US. The two remaining studies reported findings from Canada and Australia. The third column shows that findings from 18 of the 43 separate evaluations were included in the meta-analysis. The fourth column indicates that the majority of evaluations were based on neighborhood watch schemes combined with at least one other element (n=30). Eight of these included the ‘big three’ (i.e. neighborhood watch, property marking and security surveys). The fifth column presents information about the research design. All of the evaluations used a pre-test post-test experimental-control design. The sixth column shows the size of the scheme area (i.e. the number of residents, dwellings, roads or census tracts). The seventh column presents information about the characteristics of the area in which the neighborhood watch scheme was operating (i.e. the experimental area). The last column in the table describes the comparison (or control) area in which neighborhood watch schemes were NOT operating.

13
Table 2: Description of studies meeting the eligibility criteria for inclusion in the review
Author/ publication date of main report used in the review
Country/City/area Used in meta-anal-ysis
Scheme elements
Research design and evaluation period [1]
Size of scheme area
Scheme area Comparison areas
Anderton (1985) UK, Cheshire, Northwich Division
Yes NW,Improved security,Property marking
Pre-Post, Exp-Con, 1 year before and 1 year after
629 schemes covering 14,300 dwellings
A police division of the Cheshire Constabulary with the largest number of watch schemes (629 schemes covering 14,300 dwellings).
The county as a whole.
Bennett (1990) UK, London, Wimbledon *
Yes NW, Property Marking, Security Surveys
Pre-Post, Exp-Con, 12 months before and after
13 roads A residential area of mainly owner-occupied homes
Matched comparison some distance from the experimental area
UK, London, Acton
Yes NW Pre-Post, Exp-Con, 12 months before and after
9 roads A residential area of mainly owner-occupied homes
Matched comparison some distance from the experimental area
Bennett and Lavrakas (1989)
USA, Baltimore NW, Other related activities
Pre-Post, Exp-Con, 1 year before and 1 year after
not stated Inner-city communities with relatively low socio-economic levels usually racially mixed with high crime problems
A ‘ring’ around the target area two census tracts wide
USA, Boston ditto ditto ditto ditto dittoUSA, Bronx ditto ditto ditto ditto dittoUSA, Brooklyn ditto ditto ditto ditto dittoUSA, Cleveland ditto ditto ditto ditto dittoUSA, Miami ditto ditto ditto ditto dittoUSA, Minneapolis ditto ditto ditto ditto dittoUSA, Newark ditto ditto ditto ditto dittoUSA, Philadelphia ditto ditto ditto ditto dittoUSA, Washington ditto ditto ditto ditto ditto
Cirel et al. (1977) USA, Washington, Seattle
Yes NW,Property marking,Security surveys
Pre-Post, Exp-Con, 1 year before and 1 year after
not stated Five census tracts within the city. Two federal tracts adjacent to the selected scheme census tracts.
Forrester, Chatterton and Pease (1988)
UK, Rochdale, Kirkholt
Yes CNW,Improved security,Victims support
Pre-Post, Exp-Con, 1 year before and 1 year after
2,280 dwellings A residential area of public housing two miles outside the town centre covering just over 2,000 households.
The remainder of the subdivision

14
Henig (1984) USA, Washington DC, The First Police District
Yes NW Pre-Post, Exp-Con, 1 year before and 3 years after
not stated An area of the city with a population over 50 per cent black and under one-third owner-occupied and highest crime rate of the seven police divisions.
The police division as a whole.
Hulin (1979) USA, California, Fontana
NW,Target hardening,Property marking
Pre-Post, Exp-Con, 1 year before and 1 year after
not stated A small, high crime area of mainly apartments in a semi-rural location.
Four demographically similar control area with similar pre-test crime rates.
Husain (1990) UK, Birmingham, Handsworth Wood
NW Pre-Post, Exp-Con, 2 years before and after
7,000 hh High-status residential area. Matched comparison adjacent to the experimental area
UK, Brighton, Saltdean
NW Pre-Post, Exp-Con, 2 years before and after
1,500 hh A large high-status residential area on the Sussex coast
Matched area some distance from the experimental area
UK, Burnley, Hargher Clough
NW Pre-Post, Exp-Con, 2 years before and after
1,000 hh Densely populated small town comprising mainly manual workers
The non-scheme part of the town
UK, Manchester, Trafford, Stretford
NW Pre-Post, Exp-Con, 2 years before and after
11,000 hh A large racially mixed area comprising a variety of dwelling types
Non-matched area near, but not adjacent to, the experimental area
UK, Preston, Grange Estate and Moor Nook
NW Pre-Post, Exp-Con, 2 years before and after
1,600 hh Two large local authority housing areas Non-scheme dwellings close to the experimental area
UK, Sutton Coldfield
NW Pre-Post, Exp-Con, 2 years before and after
3,600 hh Several fairly affluent areas on the periphery of a large conurbation
Two police beats remote from the experimental areas, but in the same police sub-division
Jenkins and Latimer (1986)
UK, Merseyside, York Avenue
Yes NW Pre-Post, Exp-Con, 1 year before and 1 year after
57 dwellings An area of 57 privately owned but poor quality houses.
The sub-division as a whole.
UK, Merseyside, Burford Crescent
Yes NW Pre-Post, Exp-Con, 1 year before and 1 year after
67 dwellings An area of 67 privately owned older houses
The sub-division as a whole.
UK, Merseyside, Villiers Crescent
Yes NW Pre-Post, Exp-Con, 1 year before and 1 year after
43 dwellings An area of 43 privately owned affluent suburban houses
The sub-division as a whole.
UK, Merseyside, Red Acre
Yes NW Pre-Post, Exp-Con, 1 year before and 1 year after
97 dwellings An area of 97 dwellings owned by the local council with poor amenities and high unemployment
The sub-division as a whole.
Knowles, Lesser and McKewen (1983)
USA, Los Angeles, Manhattan Beach
NW, Property Marking, Security improvement
Pre-Post, Exp-Con, 1 year before and 1 year after
31,000 residents
A middle-class beach community of approximately 31,000 residents covering an area of six square miles.
Eight neighborhood jurisdictions
Latessa and Travis (1987)
USA, Cincinnati, College Hill
BW,Target hardening
Pre-Post, Exp-Con, 1 year before and 2 years after
17,327 population
A community of over 17,000 population within the city comprising one-third black and one quarter aged under 18.
The city as a whole.

15
Lewis, Grant and Rosenbaum (1988)
USA, Chicago, Northwest
BW,Community organizing, Community action
Pre-Post, Exp-Con, 1 year before and 1 year after
7 census tracts The area covered 7 census tracts with a mean percent white of 91%.
Matched comparison areas of three equivalent census tracts.
USA, Chicago, Northeast
BW,Community organizingCB patrol
Pre-Post, Exp-Con, 1 year before and 1 year after
2 census tracts The area covered 2 census tracts with a mean percent white of 60%
Matched comparison areas of three equivalent census tracts.
USA, Chicago, Back of the Yards
BW,Community organizing
Pre-Post, Exp-Con, 1 year before and 1 year after
1 census tract The area covered 1 census tracts with a mean percent white of 61%.
Matched comparison areas of three equivalent census tracts.
USA, Chicago, Auburn-Gresham
BW,Community organizing
Pre-Post, Exp-Con, 1 year before and 1 year after
2 census tracts The area covered 2 census tracts with a mean percent white of 0%.
Matched comparison areas of three equivalent census tracts.
USA, Chicago, Edgewater
BW,Community development,WhistleStop
Pre-Post, Exp-Con, 1 year before and 1 year after
3 census tracts The area covered 3 census tracts with a mean percent white of 62%.
Matched comparison areas of three equivalent census tracts.
Lowman (1983) Canada, Vancouver Yes NW,Property marking
Pre-Post, Exp-Con, 2 years before and after
not stated A residential district in Vancouver (West End South).
One of the areas close to the project area which had no substantial border contact with the scheme location.
Matthews and Trickey (1994a)
UK, Leicester, New Parks
Yes NW, School Watch, Target hardening, Newsletters, Summer play scheme
Pre-Post, Exp-Con, 2 years before and 17 months after
4,100 dwellings A large residential area on the outskirts of a City comprising mainly semi-detached housing. The area was dominantly white with unemployment rates of twice the national average.
Seven surrounding estates.
Matthews and Trickey (1994b)
UK, Leicester, Eyres Monsell
Yes NW, School Watch, Target hardening, Newsletters, Summer play scheme
Pre-Post, Exp-Con, 1 year before and 1 year after
3,500 dwellings A residential area of mainly white population with almost half unemployed on the outskirts of the city comprising 3,500 dwellings over an area of 0.7 square miles.
Four surrounding estates.
Mukherjee and Wilson (1988)
Australia, Victoria NW Pre-Post, Exp-Con, 2 years before and after
617 watch schemes-600-900 hh per scheme
A state comprising 23 police districts. Sixteen of these police districts had watch programs at the time of the evaluation in June 1986. The proportion of the population covered in these districts by watch schemes varied (6% to 44%).
Non-NW areas within Victoria

16
Research and Forecasts Inc. (1983)
USA, Michigan, Crary-St. Mary’s
Yes NWMeetings,Security surveys
Pre-Post, Exp-Con, 1 year before and 2 years after
12,880 population
A 155-block mainly residential area with a population of about 12,880. The area was about 65% white. Most of the homes were houses with some apartments and some commercial buildings.
An area with similar demographic and crime characteristics four miles away from the experimental area.
Tilley and Webb (1994) UK, Birmingham, Primrose estate
Yes NW, Target hardening,
Pre-Post, Exp-Con, 1 year before and 2 years after
885 dwellings A predominantly white residential neighborhood on the edge of a city with three-quarters of household on state benefits and one-third single-parent families
The remainder of the sub-division
UK, Rochdale, Belfield
Yes HW,Target hardening,Property marking
Pre-Post, Exp-Con, 1 year before and 2 years after
668 dwellings A public housing area two miles from the city centre with a large Asian community and high unemployment rate.
The city as a whole
UK, Rochdale, Back O’ Th’ Moss
Yes HW,Target hardening,Property marking
Pre-Post, Exp-Con, 1 year before and 2 years after
About 700 dwellings
A public housing area with some affordable private homes on the outskirts of the city with a mainly white population and high unemployment rate.
The city as a whole
Veater (1984) UK, Bristol, Kingsdown
Yes NW,Security surveys,Property marking
Pre-Post, Exp-Con, 1 year before and 1 year after
5,000 population
A residential area of mainly older properties some of which were run down and some renovated including both private and public housing.
A control area of similar residential composition in an adjacent neighborhood

17
RESULTS
Two methods can be used to summarize the results of the selected studies. The first is a narrative review, which presents details of the studies and the results obtained. The findings are presented in the form of the relative percentage change in crime in the experimental and control areas. The review also includes the author(s) conclusion and other textual comments found in the research publication. The second method is a meta-analysis, which involves recalculating the published findings to produce a common effect size across studies. The main advantage of a narrative review is that it is possible to include more studies in the review. The main disadvantage is that it is difficult to obtain an overall finding for all studies combined. The main advantage of a meta-analysis is that a single weighted mean effect size can be calculated for groups of studies or all studies combined. The main disadvantage is that it can only be used when there is sufficient information provided in the original report to conduct the analysis. In the following section we present the findings of both methods.
Narrative review
The results of the narrative review are presented in Table 3 below. This is followed by short paragraphs describing the methods and findings of each study in turn.
In order to determine the overall effectiveness of neighborhood watch for the narrative review, it was necessary to determine whether or not the program was effective in reducing crime. In the current review, effectiveness was determined by calculating the relative percentage change of the experimental and comparison area over time. Studies were excluded from the analysis if they did not provide the data that would enable the percentage change to be calculated (e.g. if the results were presented in graphical form only). In total, 24 of the 43 evaluations presented the necessary data. If the experimental area outperformed the comparison area (i.e. crime decreased by more or increased by less), the program was deemed to have a positive effect on crime. If the comparison area outperformed the experimental area, the program was deemed to have a negative effect.
In those cases where there was more than one eligible finding presented within an evaluation, one finding was selected using the system of prioritization outlined above (i.e. findings relating to residential burglary were selected as first priority, followed by findings for property crime and findings for all crimes).
The results of the narrative review show that 19 of the 24 evaluations included in the analysis found that neighborhood watch was associated with a reduction in crime based on relative percentage change (as described above). Conversely, five evaluations found that neighborhood watch was associated with an increase in crime. Technically, it is possible that neighborhood watch could have caused the increase in crime. This could be because watch programs attract offenders as they might suggest that there is something worth stealing in the area. However, it is also possible that watch programs increase recorded crime as a result of increases in reporting rates among residents. Overall, the majority of studies included in the narrative review show that neighborhood watch is associated with a reduction in crime.

18
Table 3: Outcome effectiveness of neighborhood watch
Author/ publication date of main report used in the review
Country/City/area Data source
Outcome measure Experimental area (pre to post) crime changes
Comparison area (pre to post) crime changes
Result % crime difference
Relative % change Outcome (based on relative % change)
Anderton (1985) UK, Cheshire, Northwich Division
PD Burglary 7436-6720 41149-42332 Exp -10%Con +3%
-13% Positive
Bennett (1990) UK, London, Wimbledon *
SR Burglary 5.1%-4.0% 2.9%-2.1% Exp -21.6%Con -27.6%
+6% Negative
UK, London, Acton SR Burglary 5.9%-8.1% 2.9%-2.1% Exp +37.3%Con -27.6%
+65% Negative
Bennett and Lavrakas (1989) USA, Baltimore SR Victimization no data no data Diff. change = neg. Non-numerical result -USA, Boston ditto ditto ditto ditto Diff. change = none Non-numerical result -USA, Bronx ditto ditto ditto ditto Diff. change = none Non-numerical result -USA, Brooklyn ditto ditto ditto ditto Diff. change = none Non-numerical result -USA, Cleveland ditto ditto ditto ditto Diff. change = pos. Non-numerical result -USA, Miami ditto ditto ditto ditto Diff. change = none Non-numerical result -USA, Minneapolis ditto ditto ditto ditto Diff. change = none Non-numerical result -USA, Newark ditto ditto ditto ditto Diff. change = neg. Non-numerical result -USA, Philadelphia ditto ditto ditto ditto Diff. change = none Non-numerical result -USA, Washington ditto ditto ditto ditto Diff. change = none Non-numerical result -
Cirel et al. (1977) USA, Washington, Seattle
SR Burglary 6.2%-2.4% 10.4%-10.0% Exp -61.3%Con -4.0%
-57% Positive
Forrester, Chatterton and Pease (1988)
UK, Rochdale, Kirkholt PD Burglary 512-317 2843-2880 Exp -38%Con +1%
-39% Positive
Henig (1984) USA, Washington DC, The First Police District
PD Burglary 4-0 2745-1778 Exp -100%Con -35%
-65% Positive
Hulin (1979) USA, California, Fontana
PD Burglary no data no data Exp -25.7%Con +10%
-36% Positive
Husain (1990) UK, Birmingham, Handsworth Wood
PD Burglary graphical data only graphical data only
No change in expected and observed crime totals before and after the scheme launch
Non-numerical result -
UK, Brighton, Saltdean PD Burglary graphical data only graphical data only
Burglary rates were below expected levels for the first year of the scheme and then raised above expected values
Non-numerical result -
UK, Burnley, Hargher Clough
PD Burglary graphical data only graphical data only
There was no clear pattern in the differences between
Non-numerical result -

19
the scheme and comparison areas over time
UK, Manchester, Trafford, Stretford
PD Burglary graphical data only graphical data only
In the first year of the scheme the number of burglaries were higher than expected and in the second year they were lower
Non-numerical result -
UK, Preston, Grange Estate and Moor Nook
PD Burglary graphical data only graphical data only
In the first year of the scheme burglary rates were as expected and in the second year lower than expected
Non-numerical result -
UK, Sutton Coldfield PD Burglary graphical data only graphical data only
Burglary levels were higher than expected during the first 18 months of the scheme and lower than expected in the next 6 months
Non-numerical result -
Jenkins and Latimer (1986) UK, Merseyside, York Avenue
PD Burglary 8-6 378-384 Exp -25%Con +2%
-27% Positive
UK, Merseyside, Burford Crescent
PD Burglary 1-12 393-472 Exp +1100%Con +20%
+1,080% Negative
UK, Merseyside, Villiers Crescent
PD Burglary 4-1 880-628 Exp -75%Con -29%
-46% Positive
UK, Merseyside, Red Acre
PD Burglary 17-5 1006-754 Exp -71%Con -25%
-46% Positive
Knowles, Lesser and McKewen (1983)
USA, Los Angeles, Manhattan Beach
PD Burglary no data no data Exp -27.7%Con +12.9%
-41% Positive
Latessa and Travis (1987) USA, Cincinnati, College Hill
PD Burglary no data no data Exp -11%Con -2%
-9% Positive
Lewis, Grant and Rosenbaum (1988)
USA, Chicago, Northwest
SR Victimization mean 0.92-0.73 mean 0.86-0.77 Exp -21%Con -11%
-10% Positive
USA, Chicago, Northeast
SR Victimization mean 1.0-1.23 mean 1.23-0.9 Exp +23%Con -27%
+50% Negative
USA, Chicago, Back of the Yards
SR Victimization mean 1.3-1.43 mean 1.32-1.14 Exp +10%Con -18%
+28% Negative
USA, Chicago, Auburn-Gresham
SR Victimization no sig. change not stated Exp no sig. change Non-numerical result -
USA, Chicago, Edgewater
SR Victimization no sig. change not stated Exp no sig. change Non-numerical result -
Lowman (1983) Canada, Vancouver PD Burglary 145-97 14-14 Exp -33%Con 0%
-33% Positive

20
Matthews and Trickey (1994a)
UK, Leicester, New Parks
PD Burglary 226-181 174-145 Exp -20%Con -17%
-3% Positive
Matthews and Trickey (1994b)
UK, Leicester, Eyres Monsell
PD Burglary 231-286 183-266 Exp +24%Con +12%
-21% Positive
Mukherjee and Wilson (1988)
Australia, Victoria PD Burglary graphical data only graphical data only
Police divisions identified as having high levels of NW showed greater reductions in residential burglary than those identified as having lowlevels or no NW.
Non-numerical result -
Research and Forecasts Inc. (1983)
USA, Michigan, Crary-St. Mary’s
PD Burglary 253-131 206-197 Exp -48%Con -4%
-44% Positive
Tilley and Webb (1994) UK, Birmingham, Primrose estate
PD Burglary 37-22 104-93 Exp -41%Con -11%
-30% Positive
UK, Rochdale, Belfield PD Burglary 40-40 1205-1352 Exp 0%Con +12%
-12% Positive
UK, Rochdale, Back O’ Th’ Moss
PD Burglary 40-35 1205-1352 Exp -13%Con +12%
-25% Positive
Veater (1984) UK, Bristol, Kingsdown PD All crimes 652-486 467-610 Exp -25%Con +31%
-56% Positive
Notes: SR=Self report. PD=Police data. Positive = a reduction in crime. Negative = an increase in crime.

21
Short summaries of the 19 studies (covering 43 evaluations) included in the narrative review are presented below.
Anderton (1985)Anderton (1985) conducted an evaluation of a ‘Home Watch’ scheme in Northwich in Cheshire. This was one of the first evaluations of neighbourhood watch in the UK. The study was based on a comparison of police-recorded crimes measured 18 months before and 30 months after the launch of the scheme. The crime rates for Northwich were compared with the crime rates for Cheshire as a whole. The results showed that the number of burglaries in Northwich decreased by 10 per cent, compared with an increase of three per cent across the county as a whole. Anderton (1985) concluded that, ‘It appears from the experience in Cheshire so far that Home Watch is one of the most effective, efficient and successful crimeprevention initiatives ever undertaken’ (p.53).
Bennett (1990)Bennett (1990) evaluated the effectiveness of neighbourhood watch schemes in two areas of London (Wimbledon and Acton). The evaluations were based on crime and public attitude surveys in the two areas before the schemes were implemented and again one year after their implementation. Similar surveys were conducted in matched comparison areas some distance from the experimental areas. In Wimbledon, crime decreased by a greater amount in the control area than in the experimental area (28 per cent compared with 22 per cent). In Acton, crime increased by 37 per cent in the experimental area and decreased by 28 per cent in the control area. The author concluded that the findings were ‘not encouraging’ (p.110). Overall, the results suggested that residents in the neighbourhood watch areas experienced either no better or worse rates of victimization than in the comparison.
Bennett and Lavrakas (1989)Bennett and Lavrakas (1989) investigated the effectiveness of neighbourhood watch schemes in 10 US cities (Baltimore, Boston, Bronx, Brooklyn, Cleveland, Miami, Minneapolis, Newark, Philadelphia and Washington). The research was based on a pretest - posttest design with a non-equivalent control groups. The comparison areas were selected by drawing a ‘ring’ around the experimental area approximately two census tracts wide. Monthly crime statistics revealed no differences between the experimental and control areas in seven of the ten evaluations and a negative differential change (where crime decreased less in the experimental area than in the comparison area) in two of the cities. Only one area showed a positive differential change (where the experimental area experienced a larger decrease in crime than the control). The authors concluded that the programs ‘did not seem to achieve the ‘ultimate’ goal of crime reduction’ (p.361).
Cirel et al. (1977)Cirel et al. (1977) conducted one of the first evaluations of the effectiveness of neighbourhood watch in the United States. The evaluation, based in Seattle, Washington, included a telephone and door-to-door surveys of residents one year before the launch of the scheme and one year after. Two census tracts adjacent to the neighbourhood watch area was used as a comparison. The results showed that the rate of burglary decreased by a substantially greater amount in the experimental areas than in the control areas (61 per cent compared with 4 per cent). The authors concluded that participating in community crime prevention, ‘significantly reduces the risk of residential burglary victimization’ (p.79).

22
Forrester, Chatterton and Pease (1988)Forrester, Chatterton and Pease (1988) evaluated a burglary prevention project in Kirkholt, an area of public housing near Rochdale (a town 10 miles north of Manchester) in the UK. A package of measures was introduced as part of the project, including ‘cocoon’ neighbourhood watch. The evaluation was based on the analysis of pre- and post-test police-recorded crime rates in the experimental area (Kirkholt) which were compared with crime rates in the remainder of the police sub-division. The results showed that domestic burglaries decreased by 38 per cent in the experimental area compared with one per cent in the remainder of the sub-division. The authors concluded that there had been a, ‘large absolute and proportionate reduction in domestic burglary during the initiative’ (p.19).
Henig (1984)Henig (1984) conducted an evaluation of neighbourhood watch in a police district in Washington, DC. The impact of block watch on crime was assessed by examining the levels of police-recorded crime in the sample of participating blocks in the year before and after the scheme had been launched. This was compared with crime rates for the police district as a whole and for the city as a whole. The results showed that over the evaluation period the level of burglary decreased by 100 per cent (from 4 to 0 burglaries) in the sample area and by 35 per cent (from 2745 to 1778 burglaries) in the police district as a whole. The author concluded that neighbourhood watch was associated with a reduction in burglary among participating blocks.
Hulin (1979)Hulin (1979) evaluated the effectiveness of a neighbourhood watch scheme in a high crime area of Fontana, California. Using police-recorded crime data for the year before and the year after the scheme, the author compared changes in residential burglary rates in Fontana with changes in burglary in four demographically similar control areas with similar pre-test crime rates. The results showed a decrease in residential burglary of more than 25 per cent in the experimental area compared with increases ranging from 10 to 25 per cent in each of the control areas. Hulin (1979) concluded that the results were ‘positive’ and indicated that neighbourhood watch was ‘an effective crime prevention instrument’ (p.30).
Husain (1990) Husain (1990) evaluated the effectiveness of neighborhood watch schemes in six UK cities (Birmingham, Brighton, Burnley, Manchester, Preston and Sutton Coldfield). In each evaluation, police-recorded crime data were used to compare crime rates before and after implementation of neighborhood watch in the experimental areas. These changes were then compared with changes in crimes rates in six control areas. The findings were presented mainly in graphical form showing relative percentage change in crime in the program areas. In three of the six areas, the implementation of neighborhood watch was accompanied by an improvement in crime. In the other three areas, there were no improvements. The author concluded ‘...in three of the six areas the introduction of NW has been accompanied by some improvement in the crime situation (p.66)’, while, ‘...the results from three other areas are less convincing (p.67).
Jenkins and Latimer (1986)Jenkins and Latimer (1986) conducted evaluations of neighbourhood watch schemes in four areas of Merseyside in the UK. Each of the four evaluations examined the number of crimes recorded by the police in the year before and the year after the scheme had been implemented. In three of the four areas, the experimental area experienced larger decreases in

23
the number of burglaries than in the sub-division as a whole. In the fourth area (Burford Avenue), burglary increased by more than 1,000 per cent (from 1 to 12). The authors concluded that there is, ‘an indication that Homewatch is having an effect, certainly initially, in reducing the instances of burglary within an area and to a lesser extent the total crime’ (p.12). However, they warned that results of the Burford Avenue scheme ‘should not be ignored and indicate that Homewatch is not a panacea for reducing crime’ (p.12).
Knowles, Lesser and McKewen (1983)Knowles, Lesser and McKewen (1983) evaluated the effectiveness of a neighbourhood watch programme in a residential suburb on the western boundary of Los Angeles County in the USA. The evaluation examined changes in the rate of police-recorded residential burglaries in the 12 months before and the 12 months after the programme had been implemented. These were compared with burglary rates in comparison areas (comprising eight neighbouring jurisdictions). The results showed a decrease in burglary of 28 per cent in the experimental area, compared with an increase of 13 per cent in the comparison area. The authors explained that the atmosphere of co-operation fostered by the programme, ‘provided for the achievement of a common goal – crime control’ (p 38).
Latessa and Travis (1987)Latessa and Travis (1987) conducted an evaluation of a block watch programme implemented in the College Hill area of Cincinnati in the USA. College Hill is described by the authors as the fifth largest community in the city with a population of over 17,000 residents. Using police-recorded crime data, burglary rates in College Hill in the year before and after the scheme were compared with burglary rates in the city of Cincinnati as a whole. The figures show that burglary in the experimental area decreased by 11 per cent, while burglary in Cincinnati as whole decreased by two per cent. The authors concluded that College Hill experienced a decrease in the amount of recorded crime during the course of the programme.
Lewis, Grant and Rosenbaum (1988)In another US study, Lewis, Grant and Rosenbaum (1988) evaluated the effectiveness of five block watch schemes in Chicago, Illinois. Crime and public attitude surveys were conducted in the experimental and matched control areas before the launch of the schemes and again one year after the launch. Only one of the five experimental areas experienced a reduction in victimizations. Two of the experimental areas, however, showed a statistically significant increase in victimizations per respondent. The authors concluded in their original report that the results, ‘force us to seriously address the possibility of both theory failure and program failure in this field’ (Rosenbaum, Lewis and Grant 1985, p.170).
Lowman (1983)Lowman (1983) investigated the effectiveness of neighbourhood watch in a residential district of Vancouver, Canada. The evaluation was based on a comparison of crime rates in an experimental area (the neighbourhood watch pilot project area) and three control areas in which neighbourhood watch had not been implemented. The results showed that the number of burglaries decreased by 33 per cent in the experimental area with no change in the comparison areas. The author concluded that the reduction in the experimental area ‘may be indicative of a deterrent effect of the program’ (p.295).
Matthews and Trickey (1994)Matthews and Trickey (1994) conducted an evaluation of a neighbourhood watch scheme in the New Parks area of Leicester in the UK. Police-recorded crime data were used to

24
determine changes in crime rates in the experimental area in the 12 months before and after the launch of the scheme. Comparable data were obtained for seven nearby control areas. The results showed that the number of burglaries decreased in the experimental area and increased in the control area. However, in the following year the rate of burglary increased. The authors explained that this reduction in burglary was ‘welcome’ but somewhat ‘short-lived’ (p 67).
Matthews and Trickey (1994)In a second evaluation of neighbourhood watch in Leicester, Matthews and Trickey (1994) evaluated the effectiveness of a neighbourhood watch scheme on the Eyres Monsell housing estate. Police data were used to examine changes in the number of burglaries in the year before the launch of the scheme and in the year following implementation. Data were also collected for four other housing estates in the area close to the Eyres Monsell estate. Over the study period, the number of burglaries on the Eyres Monsell estate increased by 24 per cent. The number of burglaries on the Saffron Lane estate (the estate with the most similar pre-test burglary rate) also increased over the study period, but the increase was approximately half that of the experimental area (12 per cent). The authors concluded that the outcome of the project as a whole was positive, although ‘not particularly remarkable’ (p.50). However, the rapid increase in the number of burglaries in 1994 was ‘a cause of considerable concern’ (p.50).
Mukherjee and Wilson (1988)Mukherjee and Wilson (1988) evaluated the effectiveness of neighborhood watch in Australia focusing on the state of Victoria. Using police data, the authors compared changes in crime rates in areas with high levels of neighborhood watch with areas that had medium, low levels, or no neighborhood watch. The findings were presented in terms of whether neighborhood watch had a ‘good’, ‘average’ or ‘poor’ effect on reducing crime over the two-year period evaluation period. The results showed that police divisions with high levels of neighborhood watch showed greater reductions in residential burglary than those with low levels or no neighborhood watch. The authors concluded that their findings ‘lend very reasonable support to the objective of neighborhood watch in suppressing residential burglary’ (p.5).
Research and Forecasts Incorporated (1983)In a US study, Research and Forecasts Incorporated (1983) conducted an evaluation of neighbourhood watch in a residential area of Detroit, Michigan. The study used police data to compare changes in crime rates in 155-block experimental area (Crary-St Mary’s) with changes in a matched control area four miles away. In both neighbourhoods, crime rates for the 12 month period before and after implementation of neighbourhood watch were examined. The results showed that burglary rates decreased by a substantially greater amount in the experimental area than in the control area (48 per cent compared with 4 per cent). The authors explained that reported crime statistics showed, ‘a substantial reduction in Crary-St Mary’s that is not matched by the statistics for the control neighbourhood’ (p.34).
Tilley and Webb (1994)Tilley and Webb (1994) present findings from 11 evaluations of individual burglary reduction schemes implemented as part of the Safer Cities Program in the UK. Three of the 11 evaluations (in Birmingham-Primrose estate, Rochdale-Belfield estate and Rochdale-Back O’Th’Moss estate) met the eligibility criteria for inclusion in this review. Each evaluation employed a pretest-posttest research design and compared crime rates in the experimental area with crime rates in either the remainder of the sub-division or in the city as a whole. In all three evaluations, the experimental area outperformed the control area. In the two

25
Rochdale evaluations, the control area experienced an increase in crime, while the experimental area experienced a decrease or remained stable. In Birmingham, both the experimental and control areas experienced a decrease in crime, but the decrease was greater in the experimental area (41 per cent compared with 11 per cent). The authors described the schemes as a, ‘great success’ in terms of ‘reducing crime and as an example of crime prevention work’ (p.4).
Veater (1984)In an early UK study, Veater (1984) evaluated a neighbourhood watch scheme in Kingsdown, Bristol. The evaluation was based on pre-test and post-test victim and public attitude surveys conducted in the scheme area. A comparison was also made of crime rates in an adjacent area to the neighbourhood watch scheme using police-recorded crimes. The findings showed that crime decreased by 25 per cent in the experimental area, but increased by 31 per cent in the comparison area. The author noted that the increase might be a result of crime displacement. He concluded that, ‘the neighbourhood watch concept has potential if adequate resources are made available ...’ (p.5).
Meta-analysis
In order to carry out a meta-analysis of the effects of neighborhood watch, a comparable effect size measure is needed for each evaluation, together with its variance (see Lipsey andWilson, 2001). All evaluations included in the review employed the same research design (pre-test and post-test measures for experimental and control groups). The majority (n=15) of evaluations used police-recorded data to provide an outcome measure of crime. The remainder (n=3) used self-report victimization surveys. The two types of data require different methods to obtain an odds ratio (OR). These methods are described below.
The outcome measure in each study was the number of crimes (i.e. burglaries, property crimes, or all crimes, in that order) recorded by the police (police-recorded crime data) or the number of people victimized (survey data). There were no evaluations included in the review that provided sufficient information (i.e. standard deviations) to allow ORs to be calculated from mean offending rates. Hence, the meta-analysis is based on ORs derived solely from frequencies or proportions.
Police-recorded crime data
The best measure of effect size for findings based on crimes and victimization is the OR. In practice, the differences in the levels of crime in experimental and control areas recorded in police crime data are not strictly speaking ORs as they are based on events rather than proportions of people experiencing the event. However, for simplicity and clarity the term has been used throughout to describe differences found in both police data and survey data.

26
The OR is calculated as shown in the following table.
Before intervention After interventionExperimental a bControl c d
where a, b, c, d are numbers of crimesOR = a*d/b*c
The null, or no effect, value of the OR is 1.0. To the extent that the OR exceeds 1.0, it might be concluded that the intervention (i.e. neighborhood watch) was possibly beneficial. To the extent that the OR falls below 1.0, it might be concluded that the intervention was possibly harmful. It is technically possible that some schemes might serve to increase the number of recorded crimes (e.g. it has sometimes been argued that increased surveillance will lead to an increase in the number of crimes reported to the police).
The variance of the OR is calculated from its natural logarithm (LOR).
VAR (LOR) = 1/a + 1/b + 1/c +1/d
In order to produce a summary effect size in a meta-analysis, each effect size (here, LOR) is weighted by the inverse of its variance (1/V). This estimate of the variance is based on the assumption that total numbers of crimes (a, b, c, d) have a Poisson distribution. If the number of crimes has a Poisson distribution, its variance should be the same as its mean. However, the large number of changing extraneous factors may cause over-dispersion; that is, where the variance of the number of crimes VAR may exceed the number of crimes N. The analysis was therefore adjusted to deal with the problem of possible ‘over-dispersion’ (i.e. greater than expected variance). Hence, the standard formula for V(LOR) was multiplied by an over-dispersion factor D, where
D = VAR/N.
Farrington, Gill, Waples, and Argomaniz (2007) estimated VAR from monthly numbers of crimes and found the following equation:
D = .0008*N + 1.2
D increased linearly with N and was correlated (.77) with N. The median number of crimes in their study was 760, suggesting that the median value of D was about 2. However,Farrington et al. (2007) argued that this is an overestimate because the monthly variance is inflated by seasonal variations, which do not apply to N and VAR. Nevertheless, in order to obtain a conservative estimate, V(LOR), calculated from the usual formula above, was doubled in all cases involving police-recorded crime data. This adjustment corrects for over-dispersion within studies, not for heterogeneity between studies. In order to test the effects of assuming different over-dispersion factors, the value of V(LOR) was also trebled (rather than doubled) and the results were recalculated. The results showed that there was no change in OR for the fixed effects method and only a very small change in OR for the random effects method. There was also either no change or a very small change in the confidence intervals across the methods.

27
Survey data
For studies based on self-report surveys of residents before and after the intervention, the OR was calculated from the log of OR (LOR) using the formula below:
LOR = Ln (a2*d2/b2*c2) - Ln (a1*d1/b1*c1)
where a2, b2, c2, d2 are ‘after’ numbers and a1, b1, c1, d1 are ‘before’ numbers.
Before intervention After interventionCrime No crime Crime No crime
Experimental a1 b1 a2 b2Control c1 d1 c2 d2
The variance of LOR is calculated using the following formula:
VAR (LOR) = 1/a1 + 1/b1 + 1/c1 + 1/d1 + 1/a2 + 1/b2 + 1/c2 + 1/d2
This method is based on comparing before and after ORs. This was considered preferable to comparing after ORs only as this would not control for pre-existing differences between the experimental and control areas.
Individual effect sizes
Table 4 summarizes the 18 evaluations included in the meta-analysis. The table shows that 15 evaluations had an OR greater than one and three had an OR less than one. Hence, in the majority of evaluations, neighborhood watch was associated with a reduction in crime. Four of the 15 evaluations with an OR of greater than one were statistically significant (Research and Forecasts Inc. 1983, Anderton 1985, Veater 1984 and Forrester et al. 1988). This can be seen graphically in the forest plot shown in Figure 1. The graph shows a clear pattern of small positive effects.
Mean effect sizes
An important aim of a meta-analysis is to calculate a weighted mean effect size (here, the OR).
There are two ways of calculating the weighted mean effect size. In the case of the fixed effects (FE) method, each effect size is weighted by the inverse of its variance (1/VAR), so that studies based on larger samples are given greater weight than those based on smaller samples. The FE method is based on the assumption that the effect sizes are homogeneous in the sense that they are all drawn from a random distribution of effect sizes about some mean. However, the effect sizes might violate this assumption and be significantly heterogeneous. One method of addressing the problem of heterogeneity is to use the ‘random effects’ model. The random effects (RE) method minimizes heterogeneity by adding a constant to the variance of each effect size (for the formula, see Lipsey and Wilson, 2001, p.119).
28
Fixed effects model
Table 4 shows that the weighted mean OR for the 18 evaluations combined was 1.19 using the FE model. This finding was statistically significant (z=7.25, p<.0001). An OR of 1.19 can be interpreted to mean that crime increased by 19 per cent in the control area compared with the experimental area or decreased by 16 per cent (1/OR) in the experimental area compared with the control area.
Random effects model
The 18 studies were significantly heterogeneous according to the Q statistic (Q=35.72, 17 d.f., p<.0001). Therefore, the RE model was used. The weighted mean OR for the 18 evaluations combined was 1.36 using the RE model. An odds ratio of 1.36 means that crimeincreased by 36% in the control area compared with the experimental area or decreased by 26% in the experimental area compared with the control area.
We should emphasize that our estimate of the variance of ORs, while the best available at present, are not exact figures and may be slightly inaccurate. Therefore, there may be some inaccuracy in the weightings used in our meta-analyses. The main consequence of this is that the confidence intervals around the weighted mean effect sizes may be slightly inaccurate.

29
Table 4. Individual and mean effect sizes
Author Date Outcome measure
OR CI z p of z
Cirel et al. (1977) 1977 Burglary 2.38 0.87-6.53 1.69 nsLowman (1983) 1983 Burglary 1.49 0.49-4.53 0.71 nsResearch and Forecasts Inc. (1983) 1983 Burglary 1.85 1.23-2.77 2.96 <0.004Henig (1984) 1984 Burglary 2.59 0.12-57.52 0.60 nsAnderton (1985) 1985 Burglary 1.14 1.08-1.20 5.03 <0.0001Veater (1984) 1985 All crimes 1.75 1.38-2.22 4.61 <0.0001Jenkins and Latimer (1986) [1] 1986 Burglary 1.35 0.30-6.13 0.39 nsJenkins and Latimer (1986) [2] 1986 Burglary 0.10 0.01-1.80 -1.56 nsJenkins and Latimer (1986) [3] 1986 Burglary 2.85 0.13-63.52 0.66 nsJenkins and Latimer (1986) [4] 1986 Burglary 2.55 0.62-10.51 1.29 nsForrester, Chatterton and Pease (1988) 1988 Burglary 1.64 1.32-2.02 4.57 <0.0001Bennett (1990) [1] 1990 Burglary 0.92 0.27-3.11 -0.13 nsBennett (1990) [2] 1990 Burglary 0.51 0.16-1.65 -1.12 nsMatthews and Trickey (1994a) 1994 Burglary 1.04 0.69-1.58 0.19 nsTilley and Webb (1994) [1] 1994 Burglary 1.50 0.65-3.50 0.95 nsTilley and Webb (1994) [2] 1994 Burglary 1.12 0.60-2.11 0.36 nsTilley and Webb (1994) [3] 1994 Burglary 1.28 0.67-2.46 0.75 nsMatthews and Trickey (1994b) 1994 Burglary 1.17 0.82-1.69 0.87 ns
Total n=18
Fixed Effects 1.19 1.13-1.24 7.25 <0.0001Random Effects 1.36 1.15-1.61 3.63 <0.0004
Notes: An odds ratio of 1.19 means that crime increased by 19% in the control area compared with the experimental area or decreased by 16% in the experimental area compared with the control area (1/OR).An odds ratio of 1.36 means that crime increased by 36% in the control area compared with the experimental area or decreased by 26% in the experimental area compared with the control area.

30
Figure 1: The effectiveness of neighborhood watch
Jenkins and Latimer (1986) [3]
Henig (1984)
Jenkins and Latimer (1986) [4]
Cirel et al. (1977)
Research and Forecasts Inc. (1983)Veater (1984)
Forrester et al. (1988)
Tilley and Webb (1994) [1]
Lowman (1983)Jenkins and Latimer (1986) [1]
Tilley and Webb (1994) [3]
Matthews and Trickey (1994b)
Anderton (1985)
Tilley and Webb (1994) [2]
Matthews and Trickey (1994a)
Bennett (1990) [1]
Bennett (1990) [2]Jenkins and Latimer (1986) [2]
Fixed Effects
Random Effects
0
1
2
3
4
56
7
8
9
10
11
12
13
14
15
16
1718
19
20
21
22
23
0.00 0.01 0.10 1.00 10.00 100.00
Odds RatioWeighted mean FEOR=1.19; p=.0001; Q=35.72; p<.005Weighted mean REOR=1.36; p=.0003; Q=13.35; p=ns
Moderator analyses
Overall, the meta-analysis has shown, using both the FE and RE models, that neighborhood watch was associated with a significant reduction in crime. However, it is possible that the results will vary by specific characteristics of the program being implemented or by the research design of the evaluation. The results of the moderator analyses which investigate this are presented in Table 5 below.
Type of comparison area
It is possible that there are differences in results depending on whether studies used non-equivalent or equivalent comparison areas. It could be argued that research based on non-matched areas are more likely to produce a positive result due to regression to the mean in the experimental area (which might have been selected at a time when crime was unusually high and likely to fall) but not in the comparison area (which might have been selected at a low point in its crime cycle and likely to rise). In order to test for this, the studies included in the meta-analysis were split into two groups based on the nature of the comparison area (i.e.

31
whether it was ‘matched’ or ‘not matched’). The meta-analysis was then repeated. The results showed that the difference between these ORs was statistically significant with studies based on matched areas showing larger effect sizes than those based on unmatched areas. This finding is counter to the effect hypothesized above. One reason for this result is that the ‘not matched’ comparison area comprised the broader police area and sometimes included the experimental area. Under these circumstances it is conceivable that any movements in the broader area will be reflected in the experimental area, which would result in no apparent neighborhood watch effect. The differences could also be explained by other factors or unmeasured differences between the groups.
Type of data
It is also possible that the effectiveness of evaluations varies in terms of the type of data collected. It was argued earlier that the method of calculating ORs was slightly different using the police and survey data and that this might result in different findings. The data are also different in that the latter includes non-reported offences. In order to test for this, the 15 evaluations that collected police data were compared with the three evaluations that collected data from self-report surveys. The results showed that the difference between the two ORs was not statistically significant. Hence, the effectiveness of neighborhood watch programs did not vary by the type of data collected. This provides a justification, therefore, for combining police and survey data in the overall analysis.
Type of scheme
It might be expected that NW schemes based on limited versions of the program might be less likely to show an effect than schemes based on more comprehensive versions. In order to test for this, the studies were split into two groups based on program type (i.e. whether it was NW alone or NW with one or more additional elements of the ‘big three’). The results showed that the mean difference between ORs was not significant. Hence, the type of program did not independently affect outcome.
Size of scheme area
It could be argued that larger schemes might be more effective than smaller schemes on the grounds that a greater number of neighbors are looking out for suspicious behavior. It could also be argued that smaller schemes might be more effective than larger schemes as the interaction between neighbors who know each other well might be more concentrated. Overall, there was no statistical difference in the ORs of larger and smaller schemes.
Year of publication
It might be the case that early schemes might be more effective than later schemes on the grounds that the motivation and interest in the program was highest at its inception. It is also possible that the reverse might be the case with motivation and expertise increasing over time. The results show that there was no significant difference in the outcomes of earlier compared with later schemes.

32
Publications status
Another possible variation in results might relate to publication status. It has been hypothesized that publishers are more likely to publish evidence of success than evidence of no effect or failure. This is sometimes referred to as ‘publication bias’. In order to test for this, evaluations were identified as published or unpublished. Research was defined as published if it was reported in a book, journal or official government report, as these were likely to have been externally reviewed before distribution. Evaluations were defined as unpublished if they were police reports or reports from survey research companies, as these were less likely to have been externally reviewed before distribution. The mean OR was then calculated for each group. The results showed that the difference between the mean ORs was statistically significant. In other words, the results support the publication bias thesis by showing that published evaluations tended to provide evidence of a stronger neighborhood watch effect than unpublished evaluations.
Country
Finally, it is possible that schemes operating in different countries have different effects as a result of a variety of factors including the environmental context, the nature of the program implemented or the methods of evaluation. The mean OR for studies conducted in the USA and Canada was 1.87 (n=4) compared with 1.18 for the UK (n=14). The difference between the ORs was statistically significant (p<0.05). In other words, evaluations of neighborhood watch conducted in the US and Canada were significantly more likely to show a reduction in crime than studies conducted in the UK. It is difficult to explain such variations because of the large number of factors that could potentially affect outcomes. The main measurable difference between the comparison countries was that there were proportionately more matched studies in the US and Canada (3 of 4) than in the UK (5 of 14). It was shown earlier that matched studies more frequently showed a favorable outcome than non-matched studies. However, there are many other plausible explanations for the difference.

33
Table 5. Variations in mean effect sizes by features of the methods and the program using the Fixed Effects method
No. of studies
OR CI z p of z Q p of Q Sig. of diff in
OR
Type of comparison Matched 8 1.48 1.26-1.73 4.84 <0.0001 11.96 ns <0.01Not matched 10 1.16 1.11-1.22 6.09 <0.0001 15.74 ns
Type of data Police data 15 1.19 1.13-1.24 7.24 <0.0001 31.72 <0.005 nsSurvey data 3 1.14 0.60-2.18 0.40 ns 3.98 ns
Type of scheme NW only 8 1.30 0.90-1.87 1.41 ns 4.65 ns nsNW plus 10 1.19 1.13-1.24 7.13 <0.0001 30.82 <0.001
Size of scheme area Small 11 1.27 0.93-1.72 1.52 ns 8.63 ns nsLarge 7 1.19 1.13-1.24 7.10 <0.0001 26.9 <0.01
Year 1977-1988 11 1.19 1.14-1.25 7.20 <0.0001 32.77 <.0.001 ns1989-1994 7 1.12 0.90-1.39 1.01 ns 2.64 ns
Published Published 8 1.51 1.26-1.80 4.56 <0.0001 6.35 ns <0.01Not published 10 1.17 1.11-1.22 6.28 <0.0001 21.81 <0.01
Country UK 14 1.18 1.12-1.23 6.86 <0.0001 28.82 <0.01 <0.05USA/Canada 4 1.87 1.31-2.67 3.47 0.0005 0.43 ns
All studies 18 1.19 1.13-1.24 7.25 <0.0001 35.72 <0.01ns=not significant

34
CONCLUSION
The results of previous systematic reviews of neighborhood watch presented in the introduction were divided in terms of the conclusions drawn. Titus (1984) concluded that neighborhood watch was effective, but noted that the research methods used to investigate this were weak. Husain (1990) concluded that there was little evidence that neighborhood watch worked. Sherman and Eck (2002) concluded that neighborhood watch was ineffective in reducing crime.
The main findings of our narrative review were that just over half of the schemes evaluated (19) showed that neighborhood watch was effective in reducing crime, while only six yielded negative effects. The main finding of the meta analysis was that neighborhood watch was associated with a relative reduction in crime of between 16 and 26 per cent. The generally positive findings of the narrative review are consistent with the favorable effect found in the meta analysis. Hence, the dominant finding of our review, using both methods, is that neighborhood watch is effective in reducing crime.
However, the limitations of both the methods used in the original studies and in the narrative review and meta analysis need to be taken into account. A particular problem with the original studies is that the experimental and comparison areas were rarely wholly equivalent and sometimes not equivalent at all. The narrative review is limited in that it is based on simple counts of changes in reported crime that provide only a simplified measure of effectiveness. The main problem with the meta analysis is that it is restricted to a not necessarily representative subset of all studies. Also, the estimates of the variance of ORs might be slightly inaccurate.
One notable problem is that the studies used in the narrative review and the meta analysis were different. In order to examine the effect of this on outcome, we split the studies included in the narrative review into two groups. Studies included in the meta analysis were more likely to show a positive effect (78% positive) than those excluded (28% positive). If all studies in the narrative review had been used in the meta analysis then the result would have been less positive. As the meta analysis provides the stronger overall finding, it would have been more difficult to conclude that neighborhood watch was effective.
It is also not immediately clear from the research evidence why neighborhood watch is associated with a reduction in crime. According to theory (see above) neighborhood watch might be effective in increasing surveillance, reducing opportunities and enhancing informal social control. Unfortunately, very few studies provide information on the mechanisms by which neighborhood watch might reduce crime. It is therefore difficult to determine from current research how neighborhood watch works.
Research implications
There are a number of implications that can be drawn from the review for future research on the effectiveness of neighborhood watch.
First, the review has drawn attention to the common problem of a relatively small number of good-quality studies in terms of research design. Among the 27 studies that were excluded on

35
grounds of methodological quality, 19 had no comparison group and 8 presented only post-test data on crime.
Second, coupled with this, it is unclear why evaluations of neighborhood watch stopped abruptly in the mid 1990s. It is possible that researchers felt that the effectiveness or ineffectiveness of neighborhood watch was already established and that there was no need for further investigation. As a result, the effectiveness of neighborhood watch in more recent times is largely unknown. It would have been helpful if more recent evaluations of neighborhood watch had been conducted in order to determine current effectiveness.
Third, none of the studies was based on random allocation of areas to treatment or control conditions. Instead, all studies were based on some version of a quasi-experimental design. This is almost certainly a result of the difficulties involved in implementing community-based programs in areas where communities have not requested them. It is difficult to conduct a randomized experiment with areas as the unit of assignment. However, quasi-experimental designs are not ideal and some writers have argued that they can over-estimate the positive effects of schemes as a result of selection effects whereby the subjects or schemes most likely to change are included in the experimental group (for a discussion see Wilson, Mitchell, and MacKenzie, in press).
Fourth, a particularly important problem for the current review was that less than half of the eligible studies reported data that were suitable for a meta-analysis. This was either because studies presented the results using an unusual statistical notation or left out the data entirely (e.g. when the results were presented in graphical form only). It would be helpful if published evaluations included, at a minimum, raw data, cell sizes and other relevant information in order to facilitate future meta-analyses.
Finally, very few evaluations disaggregated the findings in a way that would show differential effects for subgroups and provide detailed information on the features of the program. As there might be variations in outcome according to the type of program implemented or the type of area in which it is implemented it is important that this information should be included in a research report.
Implications for policy
Neighborhood watch has often been described as one of the most widespread methods of reducing crime. It is supported by UK and US governments and is popular among the public and the police (Sims, 2001). The current review provides some support for this level of implementation. However, little is known about the factors that influence whether or not it is effective. The results of this review have shown that there is some variation across schemes in terms of the outcomes achieved. Governments and those responsible for crime prevention policy should investigate differences between more effective and less effective schemes in order to guide good practice.

36
PLANS FOR UPDATING THE REVIEW
We will update this review every two years.
ACKNOWLEDGEMENTS
We would like to acknowledge the financial support of the Campbell Collaboration and the University of Glamorgan for supporting the preparation of the protocol and review. In particular, we are indebted to David Wilson for his methodological assistance and comments. Helpful comments were also provided by the anonymous reviewers.
STATEMENT CONCERNING CONFLICT OF INTEREST
There is no conflict of interest. However, one of the studies included in the review was conducted by Trevor Bennett.

35
Studies included in the narrative review
Report number
Study number
Reference
1 1 Anderton, K.J. 1985 The Effectiveness of Home Watch Schemes in Cheshire, Chester: Cheshire Constabulary.
2 2 Bennett, T. 1987. An Evaluation of Two Neighborhood Watch Schemes in London: Final Report to the Home Office Research and Planning Unit. Cambridge: Institute of Criminology.
3 Bennett, T. 1988. An assessment of the design, implementation and effectiveness of neighborhood watch in London. Howard Journal of Criminal Justice, 27, (4), pp. 241-255.
4 Bennett, T. 1990. Evaluating Neighborhood Watch. Cambridge Studies in Criminology LXI. UK: Gower.
5 3 Bennett, S.F. and Lavrakas, P.J. 1989. Community-based crime prevention: an assessment of the Eisenhower Foundation’s Neighborhood Program. Crime and Delinquency, 35, 3, pp.345-364
6 4 Cirel, P., Evans, P., McGillis, D. and Whitcomb, D. 1977. Community Crime Prevention Program, Seattle: An Exemplary Project. Washington D.C.: Government Printing Office.
7 Lindsay, B.D. 1979. The community crime prevention program. In H.J. Schneider (ed.). Victim in International Perspective. Papers and Essays Given at the Third International Symposium on Victimology 1979 in Munster. West Germany: Walter de Gruyter & Co.
8 Lindsay, B. and McGillis D (1986) Citywide community crime prevention: an assessment of the Seattle program. In Rosenbaum (1986) Community Crime Prevention. Does it Work? London: Sage.
9 5 Forrester, D., Chatterton, M. and Pease, K. 1988. The Kirkholt Burglary Prevention Project, Rochdale. Crime Prevention Unit: Paper 13. London:Home Office.
10 Forrester, D., Frenz, S., O’Connell, M., et al. 1990. The Kirkholt Burglary Prevention Project: Phase II. Crime Prevention Unit: Paper 23. London: Home Office.
11 Pease, K. 1991. The Kirkholt Project: preventing burglary on a British public housing estate. Security Journal, 2, (2), pp. 73-77.
12 6 Henig, J.R. 1984. Citizens Against Crime: An Assessment of the Neighborhood Watch Program in Washington, D.C. Occasional Paper, Center for Washington Area Studies. Washington: George Washington University.

36
Report number
Study number
Reference
13 7 Hulin, J.O. 1979. Community based crime prevention project. Crime Prevention Review, California State Department of Justice, 6, (3), pp.26-34.
14 8 Husain, S. 1989. The Impact of Neighborhood Watch on Recorded Crime. Urban Policy Research Unit: University of Southampton.
15 Husain, S. 1990. Neighborhood Watch and Crime: An Assessment of Impact. London: Police Foundation.
16 9 Jenkins, A.D. and Latimer, I. 1986. Evaluation of Merseyside Homewatch Scheme. Management Development and Force Planning Unit: Merseyside Police.
17 10 Knowles, L., Lesser, C. and McKewen, F. 1983. Burglary prevention: a citizen initiated and operated neighborhood watch program. Police Chief, 50, pp.36-38.
18 11 Latessa, E.J. and Travis, L.F. 1986. Evaluation of the College Hill Crime Prevention Program. United States: University of Cincinnati.
19 12 Lewis, D.A., Grant, J.A., and Rosenbaum, D.P. 1988. Social Construction of Reform: Crime Prevention and Community Organizations. New Brunswick: Transaction Books.
20 Rosenbaum, D.P., Lewis, D.A. and Grant, J.A. 1986. Neighborhood-based crime prevention. Assessing the efficacy of community organizing in Chicago. In D.P. Rosenbaum (ed.), Community Crime Prevention: Does It Work? London: Sage.
21 Rosenbaum, D.P. 1987. The theory and research behind neighborhood watch: is it a sound fear and crime reduction strategy? Crime and Delinquency, 33(Jan), (1), pp.103-134.
22 Rosenbaum, D.P., Lewis, D.A., and Grant, J.A. 1985. The Impact of Community Crime Prevention Programs in Chicago: Can Neighborhood Organizations Make a Difference? Final Report: Volume One. Illinois: Center for Urban Affairs and Policy Research, Northwestern University.
23 13 Lowman, J. 1983. Target hardening burglary prevention and the problem of displacement phenomena. In T. Fleming (ed.) Deviant Designations: Crime, Law and Deviance in Canada. Toronto: Butterworths: pp. 277-304.
24 14 Matthews, R. and Trickey, J. 1994. Eyres Monsell Crime Reduction Project. Leicester: University of Leicester, Centre for the Study of Public Order.
25 15 Matthews, R., and Trickey, J. 1994. The New Parks Crime Reduction Project. Leicester: Centre for the Study of Public Order, University of Leicester.
26 16 Mukherjee, S. and Wilson, P. 1988. Neighborhood Watch: issues and policy implications. Trends and Issues No. 8. Australia: Australian Institute

37
Report number
Study number
Reference
of Criminology.
27 17 Research and Forecasts Inc. 1983. The Figgie Report, Part IV: Reducing Crime in America – Successful Community Efforts. Ohio: Figgie International.
28 18 Tilley, N. and Webb, J. 1994. Burglary Reduction: Findings From Safer Cities Scheme, Crime Prevention Unit Paper 51. London: Home Office.
29 Ekblom, P., Law, H. and Sutton, M. 1996. Safer Cities And Domestic Burglary, Home Office Research Study 164. London: Home Office.
30 19 Veater, P. 1984. Evaluation of Kingsdown Neighborhood Watch Project, Bristol. Bristol: Avon and Somerset Constabulary.
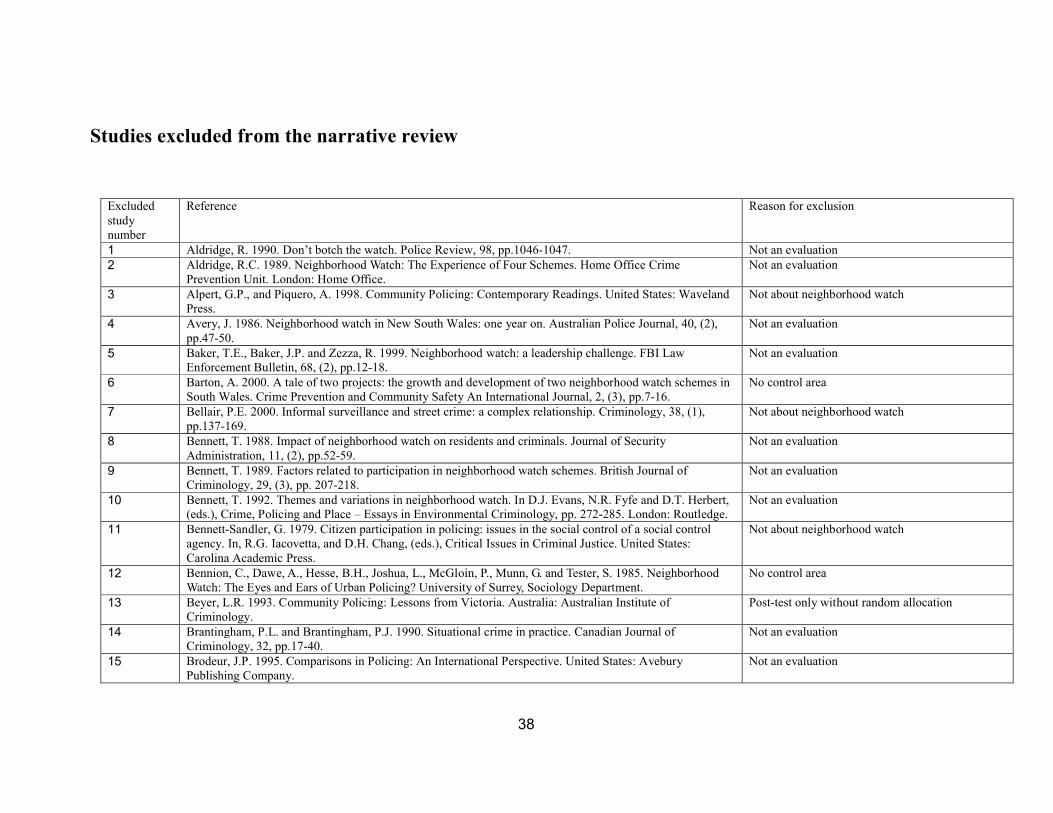
38
Studies excluded from the narrative review
Excluded study number
Reference Reason for exclusion
1 Aldridge, R. 1990. Don’t botch the watch. Police Review, 98, pp.1046-1047. Not an evaluation2 Aldridge, R.C. 1989. Neighborhood Watch: The Experience of Four Schemes. Home Office Crime
Prevention Unit. London: Home Office.Not an evaluation
3 Alpert, G.P., and Piquero, A. 1998. Community Policing: Contemporary Readings. United States: Waveland Press.
Not about neighborhood watch
4 Avery, J. 1986. Neighborhood watch in New South Wales: one year on. Australian Police Journal, 40, (2),pp.47-50.
Not an evaluation
5 Baker, T.E., Baker, J.P. and Zezza, R. 1999. Neighborhood watch: a leadership challenge. FBI Law Enforcement Bulletin, 68, (2), pp.12-18.
Not an evaluation
6 Barton, A. 2000. A tale of two projects: the growth and development of two neighborhood watch schemes in South Wales. Crime Prevention and Community Safety An International Journal, 2, (3), pp.7-16.
No control area
7 Bellair, P.E. 2000. Informal surveillance and street crime: a complex relationship. Criminology, 38, (1), pp.137-169.
Not about neighborhood watch
8 Bennett, T. 1988. Impact of neighborhood watch on residents and criminals. Journal of Security Administration, 11, (2), pp.52-59.
Not an evaluation
9 Bennett, T. 1989. Factors related to participation in neighborhood watch schemes. British Journal of Criminology, 29, (3), pp. 207-218.
Not an evaluation
10 Bennett, T. 1992. Themes and variations in neighborhood watch. In D.J. Evans, N.R. Fyfe and D.T. Herbert, (eds.), Crime, Policing and Place – Essays in Environmental Criminology, pp. 272-285. London: Routledge.
Not an evaluation
11 Bennett-Sandler, G. 1979. Citizen participation in policing: issues in the social control of a social control agency. In, R.G. Iacovetta, and D.H. Chang, (eds.), Critical Issues in Criminal Justice. United States: Carolina Academic Press.
Not about neighborhood watch
12 Bennion, C., Dawe, A., Hesse, B.H., Joshua, L., McGloin, P., Munn, G. and Tester, S. 1985. Neighborhood Watch: The Eyes and Ears of Urban Policing? University of Surrey, Sociology Department.
No control area
13 Beyer, L.R. 1993. Community Policing: Lessons from Victoria. Australia: Australian Institute of Criminology.
Post-test only without random allocation
14 Brantingham, P.L. and Brantingham, P.J. 1990. Situational crime in practice. Canadian Journal of Criminology, 32, pp.17-40.
Not an evaluation
15 Brodeur, J.P. 1995. Comparisons in Policing: An International Perspective. United States: Avebury Publishing Company.
Not an evaluation

39
16 Brown, L. 1992. Neighborhood Watch: A Literature Review. Edinburgh: The Scottish Office Central Research Unit.
Not an evaluation
17 Brown, L.P. and Wycoff, W.A. 1987. Policing Houston – reducing fear and improving service. Crime and Delinquency, 33, (1), pp.71-89.
Not about neighborhood watch
18 Buerger, M.E. 1994. Tale of two targets: limitations of community anticrime actions. Crime and Delinquency, 40, (3), pp.411-436.
Not an evaluation
19 Burden, O.P. 1979. Citizens’ initiative crime prevention. In, R.G. Iacovetta, and D.H. Chang, (eds.), Critical Issues in Criminal Justice. United States: Carolina Academic Press.
Not an evaluation
20 Burgess, L. 1990. A block president’s perspective on citizen participation and research. American Journal of Community Psychology, 18, (1), pp.159-161.
Not an evaluation
21 Carnall, P. 1994. Neighborhood Watch: Fulfilling the Potential. London: Home Office Police Dept. Not an evaluation22 Clad, J. 1986. Neighborhood watch. Far Eastern Economic Review, 131, pp.15-17. Not an evaluation23 Clarke, R. (ed.). 1992. Situational Crime Prevention: Successful Case Studies. New York: Harrow and
Heston. 2nd Ed. 1997. Not an evaluation
24 Connelly, N.M., Harries, K.D., and Herbert, D.T. 1987. Dysfunction in the urban system; an evaluation of neighborhood crime prevention in Tulsa, Oklahoma. Journal of Environmental Systems, 17, (2), pp. 115-130.
Post-test only without random allocation
25 Darian-Smith, E. 1993. Neighborhood watch – who watches whom? Reinterpreting the concept of neighborhood: Australia and United States. Human Organization, 52, pp. 83-88.
Not an evaluation
26 Darwick, N. and Higginbotham, G.E. 1984. International policing – special focus. Police Chief, 51, (6), pp. 31-34.
Not about neighborhood watch
27 de Savornin Lohman, P.M., and Van-Dijk, A.G. 1988. Neighborhood Watch in the Netherlands: The Lessons of Six Projects: A Summary. The Hague: National Crime Prevention Bureau.
No control area
28 Delaney, M. 1983. The Kingsdown beat experiment: the way forward. Avon and Somerset Constabulary. Not an evaluation29 Doleschal, E. 1984. Prevention of Crime and Delinquency. United States: National Council on Crime and
Delinquency.Not about neighborhood watch
30 Donnermeyer, J.F. and Mullen, R.E. 1987. Use of neighbors for crime prevention: evidence from a state-wide rural victim study. Journal of the Community Development Society, 18, (1), pp.15-29.
No control area
31 Donnison, H. and Scola, J. 1986. Neighborhood Watch: Policing the People. London: Libertarian Research and Education Trust.
No control area
32 Duncan, S. 2001. New successes with old problems. Law and Order, 49, (10), pp. 101-104. Not about neighborhood watch33 Evans, D.J. and Herbert, D.T. 1989 Geography of Crime. United Kingdom: Routledge. Not about neighborhood watch34 Fleming, J. (2004) Working Together: Neighborhood Watch, Reassurance Policing and the Potential of
Partnerships. RegNet Australian National University.Not an evaluation
35 Garofalo, J. and Mcleod, M. 1989. The structure and operations of neighborhood watch programs in the United States. Crime and Delinquency, 35(3), pp. 326-344.
Not an evaluation
36 Gillham, J.R. 1992. Preventing Residential Burglary: Toward More Effective Community Programs. New York: Springer-Verlag.
Post-test only without random allocation
37 Gore, L.K. 1986. The Future of Neighborhood Watch Programs: Year 2000. California: Commission on Not an evaluation

40
Peace Officer Standards and Training.38 Grant, S.E. 2002. An Analysis of Community Block Clubs as a Vehicle of Social Capital: Using E-911
statistics (New York). New York: State University of New York at Buffalo.No control area
39 Greenberg, M.A. 1991. Volunteer police: the people’s choice for safer communities: advantages over neighborhood watch and the guardian angels. Police Chief, 58, pp. 42-44.
Not an evaluation
40 Greenberg, S.W., Rohe, W.M. and Williams, J.R. 1985. Informal Citizen Action and Crime Prevention at the Neighborhood level. Washington DC: US Dept of Justice, National Institute of Justice.
Not an evaluation
41 Hale, D.C. and Leonik, R.G. 1982. Planning community-initiated crime prevention. Journal of Police Science and Administration, 10, (1), pp. 76-82.
Not an evaluation
42 Hart, G.T. 1974. Home alert – crime prevention through police-citizen cooperation. Crime Prevention Review, 1, (4), pp.18-24.
Not an evaluation
43 Hiller, A. 1986. Some recent developments in community policing - part 1. Australian Police Journal, 40 (2), pp. 54-62.
Not an evaluation
44 Hirschfield, A. and Bowers, K.J. 1997. The effect of social cohesion on levels of recorded crime in disadvantaged areas. Urban Studies, 34, (8) pp.1275-1295.
No control area
45 Hirst, J. 1988. The power of the watch. New Statesman and Society, 1, pp. 26-27. Not an evaluation46 Honess, T., Maguire, M. and Charman, E. 1993. Vehicle Watch and Car Theft: An Evaluation. Crime
Prevention Unit Series No. 50. London: Home Office Police Department. Not about neighborhood watch
47 Hope, T. 1988. Support for neighborhood watch a British Crime Survey analysis. In T. Hope and M. Shaw (eds.). Communities and Crime Reduction. London: HMSO
Not an evaluation
48 Hourihan, K. 1987. Local community involvement and participation in Neighborhood watch: a case-study in Cork, Ireland. Urban Studies, 24, pp.129-136.
Not an evaluation
49 Howard, M. 1996. Crime watch. New Scientist, 149, p. 47. Not about neighborhood watch50 Husain, S. 1988. Neighborhood Watch in England and Wales: A Locational Analysis. London: Crime
Prevention Unit, Home Office.No control area
51 Husain, S. and Bright, J. (eds.) 1990. Neighborhood Watch and the Police. Swindon: Crime Concern. Not an evaluation52 Husain, S. and Williams, H. 1993. Neighborhood Watch: A Guide For Successful Schemes. Swindon: Crime
Concern.Not an evaluation
53 Jespersen, A. 1987. Projecting cuts in crime. Police Review, 95, pp.2206-2207. Not an evaluation54 Kenney, D.J. 1989. Police and Policing: Contemporary Issues. United States: Praeger. Not an evaluation55 Kessler, D.A. and Duncan, S. 1996. Impact of community policing in four Houston neighborhoods.
Evaluation Review, 20, (6), pp.627-669.No control area
56 Klein, L., Luxenburg, J. and King, M. 1989. Perceived Neighborhood Crime and the Impact of Private Security. Society for the Study of Social Problems (Conference Paper.)
Not an evaluation
57 Lab, S.P. 1988. Crime Prevention: Approaches, Practices and Evaluations. Cincinnati: Anderson Publishing Co.
Not an evaluation
58 Latessa, E.J. and Travis, L.F. 1987. Citizen crime prevention: problems and perspectives in reducing crime. Journal of Security Administration, 10, (1), 38-51.
No control area

41
59 LaVigne, N.G. and Wartell, J. (eds.). 2000. Crime Mapping Case Studies: Successes in the field (Vol. 2). Washington DC: Police Executive Research Forum.
Not about neighborhood watch
60 Laycock, G., and Tilley, N. 1995. Policing and Neighborhood Watch: Strategic Issues. Crime Detection & Prevention Series Paper, No. 60. London: UK Home Office Police Research Group.
Not an evaluation
61 Leblanc, A.G. and Williams, D. 1978. Crime prevention – dollars and sense. Police Chief, 45, (3), pp.24-26. Not an evaluation62 Lee, L.J. 1995. An Evaluation of a Neighborhood Watch Program in Taipei Metropolitan Police Department
in Taiwan, The Republic of China. Dissertation Abstracts International, A: The Humanities and Social Sciences, 56, (2, Aug).
Post-test only without random allocation
63 Lee, L.J., Cheurprakobkit, S. and Deng, F. 1999. Neighborhood watch programs in Taiwan: police attitudes, crime rate and community support. Journal of Police Science and Management, 2, (1), pp. 57-77.
Post-test only without random allocation
64 Leland, L.S., Rushton, W.E. and Watson, J.E. 1984. The effectiveness of promoting neighborhood watch door-to-door. Police Chief, 51, (6), pp. 42-44.
Not an evaluation
65 Lowenberg, R.E. and Bandurraga, R.A. 1982. Neighborhood watch: a community resource. Journal of California Law Enforcement, 16, (3), pp. 159-164.
Not an evaluation
66 Lyddy, F. 1998. Crime-watch confusions. Psychologist, 11, (6), p. 297. Not about neighborhood watch67 McKeown, K. & Brosnan, M. 1998. Police and Community: An Evaluation of Neighborhood Watch and
Community Alert in Ireland. Ireland: Department of Justice, Equality and Law Reform.Post-test only without random allocation
68 McLean, H.E. 1991. Watching out for Honolulu. Law and Order, 39, (6), pp. 58-62. No control area69 McPherson and Thomson 1985. An Examination of the Implementation, Operation and Effectiveness of the
Four Pilot Neighborhood Watch Schemes introduced in the City of Edinburgh on 14th May, 1984. Lothian and Borders Police.
Post-test only without random allocation
70 Meese III, E. 1988. Neighborhood Watch: a crime success story. The Police Chief, 55, p.10. Not an evaluation71 Meredith, C. and Paquette, C. 1992. Crime Prevention in high-rise rental apartments: findings of a
demonstration project. Security Journal, 3, (3), pp. 161-168.No control area
72 Murphy, R.B. and Horton, S. 1975. Focus on burglary – a management approach to prevention of crimes. Police Chief, 62, (11), pp. 30-34.
Not an evaluation
73 Newton, A.M. 1978. Prevention of crime and delinquency. Criminal Justice Abstracts, 10, (2), pp. 245-266. Not an evaluation74 Olson, R.L., Lavrakas, P.J., Rosenbaum, D.P., Kaminski, F. Lowenberg, R.E., Bandurraga, R.A., Knowles,
L., Lesser, C., McKewen, F. and McCampbell, M.S. 1983. Reducing residential burglary. Police Chief, 50, (2), pp.26-41. (Check authors)
Not an evaluation
75 Pate, A.M. 1989. Community-oriented policing in Baltimore. In D.J. Kenney (ed.), Police and Policing: Contemporary Issues. United States: Praeger.
Not about neighborhood watch
76 Payne, D. 1989. Neighborhood Watch: Attitudes of Residents to Schemes in Edinburgh and Glenrothes. Edinburgh: The Scottish Office Central Research Unit.
No control area
77 Pengelly, R. 1996. Vehicle watch schemes: a comparative study. Focus on Police Research and Development, 7, pp.42-43
Not an evaluation
78 Reiner, R. 1995. Community Policing in England and Wales. In, J.P. Brodeur. Comparisons in Policing: An International Perspective. Aldershot: Avebury.
Not an evaluation

42
79 Robinson, M.B. 2000. From research to policy: preventing residential burglary through a systems approach. American Journal of Criminal Justice, 24 (2), pp. 169-179.
Not about neighborhood watch
80 Rosenbaum, D.P. 1988. A critical eye on neighborhood watch: does it reduce crime and fear? In T. Hope and M. Shaw (eds.) Communities and Crime Reduction. London: HMSO.
Not an evaluation
81 Rosenbaum, D.P. 1988. Community crime prevention: a review of what is known. In, D.J. Kenney (ed.), 1988, Police and Policing: Contemporary Issues. United States: Praeger.
Not an evaluation
82 Rudoff, G.S. 1995. Crime watchers use cellular phones: program in Dade county succeeds in reducing crime. Law and Order, 42, (12), pp. 32-33.
No control area
83 Rudoff, G.S. 1996. Cell Phones Reduce Major Urban Crimes. American City and County, 111, (4), pp.19-20. No control area84 Salcido, R.M., Ornelas, V. and Garcia, J.A. 2002. A neighborhood watch program for inner-city school
children. Children and Schools, 24, (3), pp.175-187.Not about neighborhood watch
85 Sansfacon, D. and Welsh, B. 1999. Crime Prevention Digest II: Comparative Analysis of Successful Community Safety. Canada: International Centre for the Prevention of Crime.
Not an evaluation
86 Schneider, H.J. (ed.). Victim in International Perspective. Papers and Essays Given at the Third International Symposium on Victimology 1979 in Munster. West Germany: Walter de Gruyter & Co.
Not an evaluation
87 Security 21 (2004) Neighborhood Watch: A Report on Status of Neighborhood Watch Schemes Not an evaluation88 Sherman, L.W., Farrington, D.P., Welsh, B.C. and MacKenzie, D.L. (eds.) 2002. Evidence Based Crime
Prevention. New York: Routledge. Not an evaluation
89 Silwa, l. 1983. Suburban crime and citizen action. In, D.J. Kenney (ed.), 1989, Police and Policing: Contemporary Issues. United States: Praeger.
Not an evaluation
90 Skogan, W. 1995. Community Policing in the United States. In, J.P. Brodeur (ed.), Comparisons in Policing: An International Perspective. Aldershot: Avebury.
Not about neighborhood watch
91 Skogan, W.G. 1988. Community organizations and crime. In, M. Tonry and N. Morris (eds.), Crime and Justice: A Review of Research, Volume 10. Chicago: University of Chicago Press.
Not about neighborhood watch
92 Skogan, W.G. 1989. Communities, crime and neighborhood organizations. Crime & Delinquency, 35 (3), pp. 437-458.
Not about neighborhood watch
93 Smith, B.W., Novak, K.J. and Hurley, D.C. 1997. Neighborhood crime prevention: the influences of community-based organizations and neighborhood watch. Journal of Crime and Justice, 20, (2), pp. 69-86.
Post-test only without random allocation
94 The Libertarian Research and Education Trust 1985. Neighborhood Watch in One Police Division. Working Paper Number Five.
No control area
95 Tilley, N. 1993. After Kirkholt – Theory, Method and Results of Replication Evaluations. Crime Prevention Unit Series Paper No. 47. London: Home Office.
Not an evaluation
96 Titus, R.M. 1984. Residential burglary and the community response In R. Clarke and T. Hope, (eds.) Coping with Burglary: Research Perspectives on Policing. Boston: Kluwer-Nijhoff, pp. 97-130.
Not an evaluation
97 Tonry, M. and Morris, N. Crime and Justice: A Review of Research, Volume 10. Chicago: University of Chicago Press.
Not an evaluation
98 Topp, N. 1987. Detroit’s proactive approach to law enforcement. FBI Law Enforcement Bulletin, 56, (8), pp. 22-25.
Not an evaluation

43
99 United States National Crime Prevention Council. 1989. Success of community crime prevention. Canadian Journal of Criminology, 31, (4), pp. 487-506.
Not an evaluation
100 Wadman, R.C., and Bailey, S.E. 1993. Community Policing and Crime Prevention in America and England.United States: Office of International Criminal Justice.
Not about neighborhood watch
101 Waller, I. 1979. What reduces residential burglary: action and research in Seattle and Toronto. In H.J. Schneider (ed.). Victim in International Perspective. Papers and Essays Given at the Third International Symposium on Victimology 1979 in Munster. West Germany: Walter de Gruyter & Co.
No control area
102 Washnis, G.J. 1976. Citizen Involvement in Crime Prevention. Lexington: Lexington Books. Not an evaluation103 Whitehead, K. 1989. Wonder scheme or white elephant? Police Review, 97, pp.1822-1824. Not an evaluation104 Williams, H. and Pate, A.M. 1987. Returning to first principles – reducing the fear of crime in Newark.
Crime and Delinquency, 33, (1), pp.53-70.Not about neighborhood watch
105 Yanay, U. 1994. The ‘big brother’ function of block watch. International Journal of Sociology and Social Policy, 14, (9), pp. 44-58.
No control area
106 Yarwood, R. and Edwards, B. 1995. Voluntary action in rural areas: the case of Neighborhood Watch. Journal of Rural Studies, 11, (4), pp.447-459.
No control area
107 Yarwood, R. and Gardner, G. 2000. Fear of crime, cultural threat and the countryside. Area, 32, (4), pp. 403-411.
Not about neighborhood watch

44
REFERENCES
References (Included studies)
Anderton, K.J. 1985 The Effectiveness of Home Watch Schemes in Cheshire, Chester: Cheshire Constabulary.
Bennett, T. 1990. Evaluating Neighborhood Watch. Cambridge Studies in Criminology LXI. UK: Gower.
Bennett, S.F. and Lavrakas, P.J. 1989. Community-based crime prevention: an assessment of the Eisenhower Foundation’s Neighborhood Program. Crime and Delinquency, 35, 3, pp.345-364.
Cirel, P., Evans, P., McGillis, D. and Whitcomb, D. 1977. Community Crime Prevention Program, Seattle: An Exemplary Project. Washington D.C.: Government Printing Office.
Forrester, D., Frenz, S., O’Connell, M., et al. 1990. The Kirkholt Burglary Prevention Project: Phase II. Crime Prevention Unit: Paper 23. London: Home Office.
Henig, J.R. 1984. Citizens Against Crime: An Assessment of the Neighborhood Watch Program in Washington, D.C. Occasional Paper, Center for Washington Area Studies. Washington: George Washington University.
Hulin, J.O. 1979. Community based crime prevention project. Crime Prevention Review, California State Department of Justice, 6, (3), pp.26-34.
Husain, S. 1990. Neighborhood Watch and Crime: An Assessment of Impact. London: Police Foundation.
Jenkins, A.D. and Latimer, I. 1986. Evaluation of Merseyside Homewatch Scheme.Management Development and Force Planning Unit: Merseyside Police.
Knowles, L., Lesser, C. and McKewen, F. 1983. Burglary prevention: a citizen initiated and operated neighborhood watch program. Police Chief, 50, pp.36-38.
Latessa, E.J. and Travis, L.F. 1986. Evaluation of the College Hill Crime Prevention Program. United States: University of Cincinnati.
Lewis, D.A., Grant, J.A., and Rosenbaum, D.P. 1988. Social Construction of Reform: Crime Prevention and Community Organizations. New Brunswick: Transaction Books.
Lowman, J. 1983. Target hardening burglary prevention and the problem of displacement phenomena. In T. Fleming (ed.) Deviant Designations: Crime, Law and Deviance in Canada. Toronto: Butterworths: pp. 277-304.

45
Matthews, R. and Trickey, J. 1994. Eyres Monsell Crime Reduction Project. Leicester: University of Leicester, Centre for the Study of Public Order.
Matthews, R., and Trickey, J. 1994. The New Parks Crime Reduction Project. Leicester: Centre for the Study of Public Order, University of Leicester.
Mukherjee, S. and Wilson, P. 1988. Neighborhood Watch: issues and policy implications. Trends and Issues No. 8. Australia: Australian Institute of Criminology.
Research and Forecasts Inc. 1983. The Figgie Report, Part IV: Reducing Crime in America –Successful Community Efforts. Ohio: Figgie International.
Tilley, N. and Webb, J. 1994. Burglary Reduction: Findings From Safer Cities Scheme, Crime Prevention Unit Paper 51. London: Home Office.
Veater, P. 1984. Evaluation of Kingsdown Neighborhood Watch Project, Bristol. Bristol: Avon and Somerset Constabulary.
References (Additional studies)
Cook, T.D. and Campbell, D.T. (1979) Quasi-Experimentation: Design and Analysis Issues for Field Settings. Chicago: Rand McNally.
Farrington, D.P. (2003) ‘Methodological quality standards for evaluation research’, Annals of the American Academy of Political and Social Science, Vol. 587, pp.49-68.
Farrington, D.P., Gill, M., Waples, S.J. and Argomaniz, J. (2007) ‘Studying the effects of CCTV on crime: meta-analyses of a national evaluation’, Journal of Experimental Criminology, Vol. 3, pp. 21-38.
Jones, H.E. (2005) Measuring effect size in area-based crime prevention research. Unpublished M.Phil. thesis, Statistical Laboratory, Cambridge: University of Cambridge.
Lipsey, M.W. and Wilson, D.B. (2001) Practical Meta-analysis. Thousand Oaks, California: Sage.
National Crime Prevention Council (2001) The 2000 National Crime Prevention Survey. Washington: DC. National Crime Prevention Council
Sherman, L.W. and Eck, J. (2002) Policing for crime prevention. In L.W. Sherman, D.P. Farrington, B.C. Welsh, and D.L. MacKenzie (Eds.) Evidence-based Crime Prevention.London: Routledge (pp. 295-329).
Sherman, L.W., Gottfredson, D.C., MacKenzie, D.L., Eck, J., Reuter, P. and Bushway, S. (1997) Preventing Crime: What Works, What Doesn’t, What’s Promising. Washington, D.C.: US Office of Justice Programs.

46
Sims, L. (2001) Neighborhood Watch: Findings from the 2000 British Crime Survey. Research Findings 150. London: Home Office.
Titus, R., (1984) 'Residential Burglary and the Community Response'. In: Clarke, R.V.G. and Hope, T. (Eds.). Coping with Burglary. Boston: Kluwer-Nijhoff.
Welsh, B.C. and Farrington, D.P. (2002) Crime Prevention Effects of Closed Circuit Television: A Systematic Review. Home Office Research Study 252. London: Home Office.