the effect of wages on australian port costs and their ... · acronyms and abbreviations accc...
TRANSCRIPT
Copyright Castalia Limited. All rights reserved. Castalia is not liable for any loss caused by reliance on this document. Castalia is a part of the worldwide Castalia Advisory Group.
The Effect of Wages on Australian Port Costs and their Competitiveness in an
International Context
Report to Ports Australia
June 2012

Acronyms and Abbreviations
ACCC Australian Competition and Consumer Commission
AUD Australian Dollar
BITRE The Bureau of Infrastructure, Transport and Regional Economics
CSMR Container Stevedore Monitoring Report
PPP Purchasing Power Parity
TEU Twenty-Foot Equivalent Unit
USA United States of America
UK United Kingdom


Table of Contents
Executive Summary i
1 Introduction 1
2 Port Competitiveness 2
3 Methodology 3
4 The Economic Context 4
5 Benchmarking of port employee productivity improvements against productivity improvements in Australia 5
6 Benchmarking of wage costs and Australian port competitiveness against international counterparts 11
7 Conclusion 14
References 15
Appendices
Appendix A Data tables 16
Tables
Table 6.1: Comparison of Australian and New Zealand Port Costs (Nominal AUD) 11
Table 6.2: Comparison of International Stevedoring Salaries (Real 2012 AUD) 12
Table 6.3: Australian Port Productivity in an International Context 13
Table A.1: Historical Aggregate Productivity changes in the Five Major Australian Ports 2000-2011 16
Table A.2: Stevedoring Salaries by Country in Real 2012 AUD 16
Table A.3: Transport-Communication Sector Salaries – International Comparison 17
Figures
Figure 4.1: Cost components as a proportion of total costs 4
Figure 4.2: Cost components per TEU 4
Figure 5.1: Indexed gross productivity indicators from BITRE 6
Figure 5.2: Indexed Productivity indicators from BITRE per employee 7
Figure 5.3: Indexed productivity indicators from BITRE per real dollar of wage cost 8
Figure 5.4: Five major Australian ports throughput 9
Figure 5.5: Five major Australian ports throughput per employee 9
Figure 5.6: Five major Australian ports throughput per real dollar of wage costs 10
Figure 6.1: International Transport-Communication Salaries (Ordered by PPP Salaries) 13
Figure A.1: Port TEU Throughput (thousands), 2006-2007 19
Figure A.2: Number of Commercial Ships (Thousands) Arriving at a Port 2005-2006 20
Figure A.3: Container Handling Rates at Selected Ports, Various Years (in Order of Port TEU Throughput) 21
Figure A.4: TEU Throughput per Berth Metre at Container Ports (in Order of Port TEU Throughput) 22
Figure A.5: Yard utilisation measured as TEU throughput per gross hectare at port terminal (In Order of Port TEU Throughput) 23
Figure A.6: Vessel Turnaround Times for Selected Ports (In Order of Port TEU Throughput) 24

i
Executive Summary
In most Australian enterprises, wage increases cannot diverge from productivity increases for any significant periods of time. If they do, both local and international competitors will capture market share, until wages return to be in line with productivity, or until the enterprise goes out of business.
Our analysis shows that in Australian ports, by contrast, wages in recent years appear to have been increasing ahead of productivity. Various measures of productivity per employee and per dollar of real wages show declines, or at best, no improvement since 2002/03. Our analysis of the port productivity statistics adds further evidence to the view expressed by the ACCC in its monitoring report No 13, issued in November 2011, which noted that “… the benefits of labour market reforms are likely to have been exhausted several years ago”. In fact, the data seems to suggest that the productivity gains which occurred from 1998/99 to 2002/03 have largely dissipated since then.
This productivity evidence provides important economic context for wage negotiations. Further wage increases without commensurate productivity gains would put an additional strain on the competitiveness of the Australian traded sector.
This report also compares stevedoring wages in Australia with those in New Zealand and the US. Both the US and New Zealand are developed economies with similar working conditions and safety standards to Australia. Like Australia, both the US and New Zealand are significant commodity exporters and importers of manufactured goods from Asia. Hence, the effects of port costs in these economies are likely to be similar to the effects in Australia. New Zealand ports, over the medium term, may also provide direct competition to Australian ports, since containers from Asia and the US may be either shipped to New Zealand directly or transhipped through Australian hubs. The ability to grow hubs in Australia will depend on the relative efficiency of ports here and in New Zealand.
We find that Australian stevedoring wages are significantly higher than in both New Zealand and the US. There is no evidence to suggest that this is offset by greater productivity.
1
1 Introduction
In most Australian enterprises, wage increases cannot diverge from productivity increases for any significant periods of time. If they do, both local and international competitors will capture market share, until wages return to be in line with productivity, or until the enterprise goes out of business.
While division of the surplus produced by an enterprise between labour and capital can be a very emotional issue in all sectors of the economy, in reality, the allocation of the total Australian GDP between compensation of employees and the compensation of capital has been relatively stable over the long run. This means that, in general, whatever wage growth has occurred has been achieved through the corresponding increases in productivity rather than by sticking it to the bosses.
Unlike the rest of the economy, wages in the ports sector can diverge from the underlying productivity for longer periods of time. Ports are an essential conduit through which all goods coming in and going out of Australia must pass, so high costs can, for a period of time, be spread among the entire traded sector.
As a result, the ports sector presents greater temptation than any other sector of the economy for enterprise agreements to lock in guaranteed wage increases independent of productivity improvements. However, any divergence of wages from the underlying productivity can only be sustained by collecting more revenue from the users of port services than would have been available in a competitive market. Such decline in competitiveness in the Australian ports sector is not sustainable in the long run. Past experience shows that in the absence of sustained improvements in productivity, ports are forced into periodic cataclysmic adjustments.
Not surprisingly, wage negotiations in Australian ports, as in ports in many other countries, are complex and emotive. While such negotiations are often couched in terms of conflict between capital and labour, they are in practice arguments over how long the essential nature of the ports can be exploited to extract wealth from the traded sectors. In such arguments, employers, with sunk capital at risk, tend to be more alert to the problems caused by the declining competitiveness of the ports sector.
We have been asked by Ports Australia to set out the economic context for assessing Australian maritime wages by comparing wage costs at Australian ports with the productivity changes in the ports, as well as with such costs in key developed economies with which Australia competes. For this study, we focus on two jurisdictions: the US and New Zealand:
Both the US and New Zealand are developed economies with similar working conditions and safety standards to Australia
Both the US and New Zealand are significant commodity exporters and importers of manufactured goods from Asia. Hence, the effects of port costs in these economies are likely to be similar to the effects in Australia
New Zealand ports, over the medium term, may provide direct competition to Australian ports, since containers from Asia and the US may be either shipped to New Zealand directly or transhipped through Australian hubs. The ability to grow hubs in Australia will depend on the relative efficiency of ports here and in New Zealand.

2
The past decade has seen improvements in productivity in Australia as a result of both capital deepening and changes in labour practices1. The ports have seen significant improvements over the same period with throughput increasing by 8.4% per annum since 1998-1999 and stevedoring costs decreasing by 38% in real terms2.
However, the analysis in this report, based on the official port monitoring data used by government agencies, shows that after initial improvements early in the century, labour productivity at Australian ports has been declining for the last 10 years. This indicates that a period of wage restraint in the port sector may be required unless specific measures to promote productivity growth can be negotiated.
2 Port Competitiveness
Port costs are critically important for trade competitiveness, with seaborne trade accounting for around 90 percent of global trade volume3.
A literature review on the economic impact of port infrastructure shows that the wider effects of port efficiency are typically significantly higher than on the performance of the port itself. For instance, a recent study produced by the World Bank4 simulates the impact of efficiency gains5 in the Brazilian port sector on GDP. The study uses three different scenarios to simulate different levels of efficiency gains. Results show that higher port efficiency could increase real GDP by between 0.03 and 0.13 percent. In Australian terms, this would imply a potential increase in GDP of between $30 billion and $100 billion. While it is tempting to argue that Australia’s ports are already more efficient than Brazil, throughput indicators such as TEU per employee, suggest that currently efficiency levels are comparable.
In effect, high port costs can be viewed as an impost on trade that make a country’s exports less competitive and imports more expensive for domestic consumers6.
1 Experimental Estimates of Industry Multifactor Productivity, Australia: Detailed Productivity Estimates, Australian
Bureau of Statistics
2 Container Stevedoring Monitoring report no. 13, ACCC
3 The International Maritime Organisation (IMO), http://www.imo.org/
4 World Bank. Brazil: Evaluating the Macroeconomic and Distributional Impacts of Lowering Transportation Costs. 2008.
5 The study estimates efficiency gains for 13 Brazilian ports based on changes in import and export flows handled in each port. See Annex 9 of the quoted study
6 These domestic consumers include exporters who get hit twice by the port costs; once as a result of the high import costs and then again as their goods leave the country.
3
3 Methodology
Our methodology consists of two components:
Benchmarking of port productivity against productivity trends in Australia, and
Comparing wage costs and port productivity in Australia against international comparators.
Step 1: Benchmarking of port employee productivity improvements against productivity improvements in Australia
Analysing the effect of wages on port costs in Australia requires an understanding of how labour contributes to the overall productivity of a port and whether changes in wages correspond with real improvements in productivity.
Using available data from Australian government monitoring of ports and stevedoring, we can calculate the productivity of Australian ports in absolute terms, in per employee terms and per real dollar of wages.
We examine aggregate data for the five major Australian ports (Brisbane, Sydney, Melbourne, Adelaide and Fremantle) and drill down to the detail of the individual ports. Our analysis includes the indicators monitored by the Bureau of Infrastructure, Transport and Regional Economics (BITRE) in their Waterline statistical report, as well as data drawn from the ACCC’s Container Stevedoring Monitoring Reports (CSMR).
CSMR No. 13 released in October 2011 states that “enterprise wage agreements that seek to limit productivity improvements or re-impose less flexible arrangements could undermine the potential for future productivity gains in Australian stevedoring performance.”
Step 2: Benchmarking of wage costs and Australian port competitiveness against international counterparts
Using available data from corporate reports and supporting literature regarding the cost structures of various port companies, we estimate wage costs as a proportion of total costs for port freight handling for a range of comparable countries to put Australian costs into context.
We also use available data on internationally comparable stevedore and transport worker compensation to see how expensive Australian labour is compared to that of competitor nations. Finally, we compare Australian port productivity to port productivity in other countries, using a range of indicators developed by BITRE. By synthesizing this information, we present a picture of where Australia stands globally in terms of productivity per dollar of wages in an international context.

4
4 The Economic Context
The ACCC monitors prices, costs, and profits of container terminal operators at large Australian ports, including Adelaide, Brisbane, Burnie, Fremantle, Melbourne, and Sydney. The ACCC’s CSMR no. 13 indicated that labour costs made up approximately 55 percent of total container terminal operating cost. The figures below present the cost components both in relation to total costs and in terms of cost per TEU.
Figure 4.1: Cost components as a proportion of total costs
Source: ACCC CSMR no. 13, October 2011
Figure 4.2: Cost components per TEU
Source: ACCC CSMR no. 13, October 2011
Overall, since 2000-01, labour costs have increased slightly both as a proportion of total operating costs and on the per TEU basis. This follows a significant reduction in labour costs per TEU from 1998 to 2004 as a result of waterfront restructuring.

5
5 Benchmarking of port employee productivity improvements against productivity improvements in Australia7
This section presents our analysis of productivity improvements at the five major Australian ports (Adelaide, Brisbane, Fremantle, Melbourne and Sydney) monitored by the ACCC and BITRE. The metrics in the Australian government ports and stevedoring monitoring reports express throughput in absolute, per worker and per real dollar of wage expense terms. We should expect to see productivity in all metrics increase in absolute terms as technological improvements and increased mechanisation make ports more efficient. We would also expect to see an improvement in all metrics in per worker terms (assuming the number of hours worked per worker remains relatively constant) as technological improvements make each worker more productive.
Finally, if the existing wage setting mechanism is operating efficiently, we should expect to see smaller increases in productivity per real dollar of wages, since increases in worker productivity will be partially (but not fully) matched by increases in real wages. In a competitive market, however, output per dollar of wages should still rise to the extent that such increases in productivity come from capital deepening, which requires some of the benefit of greater productivity to be used to compensate the invested capital.
The three main indicators used by BITRE in monitoring stevedoring productivity include the crane rate, vessel working rate and the ship rate. The Waterline 50, Maritime Statistical Report, published in November 2011 by BITRE defines these as:
The crane rate is the number of containers a dockside crane lifts on or off a container
ship in an hour (this is a measure of the productivity of capital – how many containers
a crane moves in an hour).
The vessel working rate is the number of containers the stevedores on board a container
ship move in loading and unloading a ship divided by the amount of labour time (this
is a measure of the productivity of labour – how many containers a person moves in an
hour).
The ship rate is the rate at which a ship is unloaded (this is estimated as the product of
the crane rate and the number of cranes working a vessel – how many containers are
moved on or off a ship in an hour).
The ACCC reported in their CSMR No. 13 that “long term trends in quay-side stevedoring productivity show sustained improvements in labour productivity.” The BITRE data suggests that improvements in productivity have flattened off, or even reversed slightly in recent years.
7 For a data table showing all data used for this section, please refer to Appendix A.
6
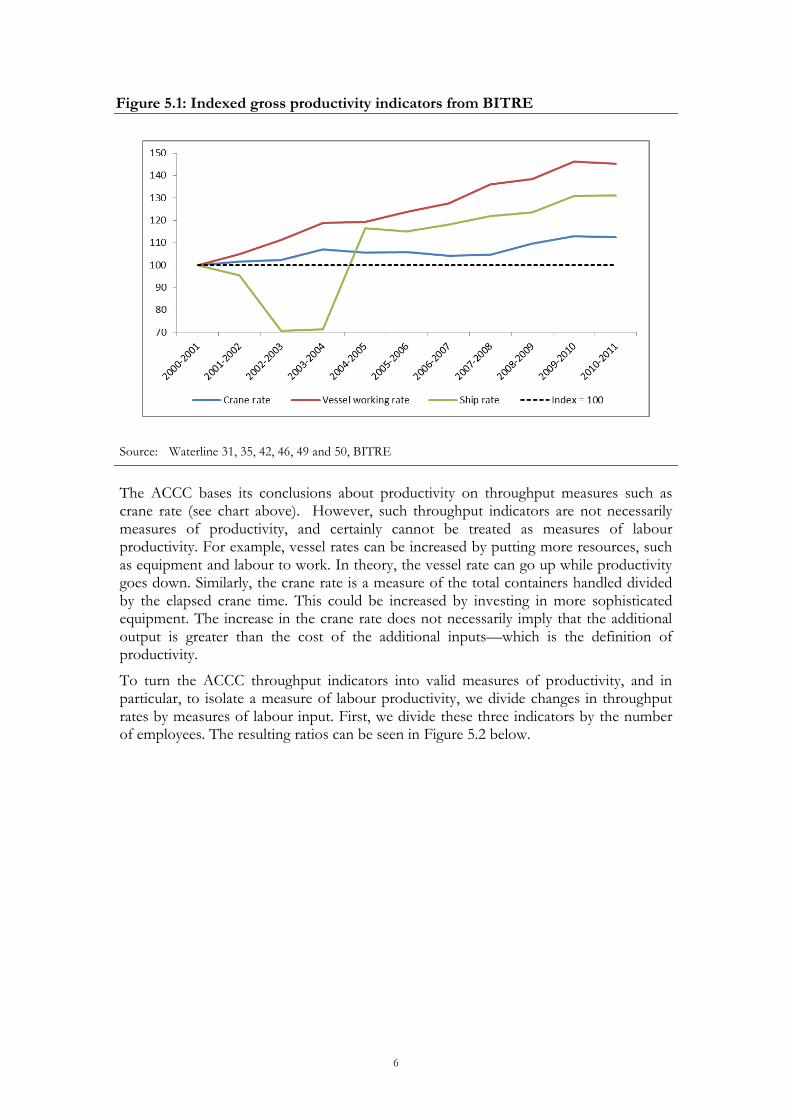
Figure 5.1: Indexed gross productivity indicators from BITRE
Source: Waterline 31, 35, 42, 46, 49 and 50, BITRE
The ACCC bases its conclusions about productivity on throughput measures such as crane rate (see chart above). However, such throughput indicators are not necessarily measures of productivity, and certainly cannot be treated as measures of labour productivity. For example, vessel rates can be increased by putting more resources, such as equipment and labour to work. In theory, the vessel rate can go up while productivity goes down. Similarly, the crane rate is a measure of the total containers handled divided by the elapsed crane time. This could be increased by investing in more sophisticated equipment. The increase in the crane rate does not necessarily imply that the additional output is greater than the cost of the additional inputs—which is the definition of productivity.
To turn the ACCC throughput indicators into valid measures of productivity, and in particular, to isolate a measure of labour productivity, we divide changes in throughput rates by measures of labour input. First, we divide these three indicators by the number of employees. The resulting ratios can be seen in Figure 5.2 below.
7
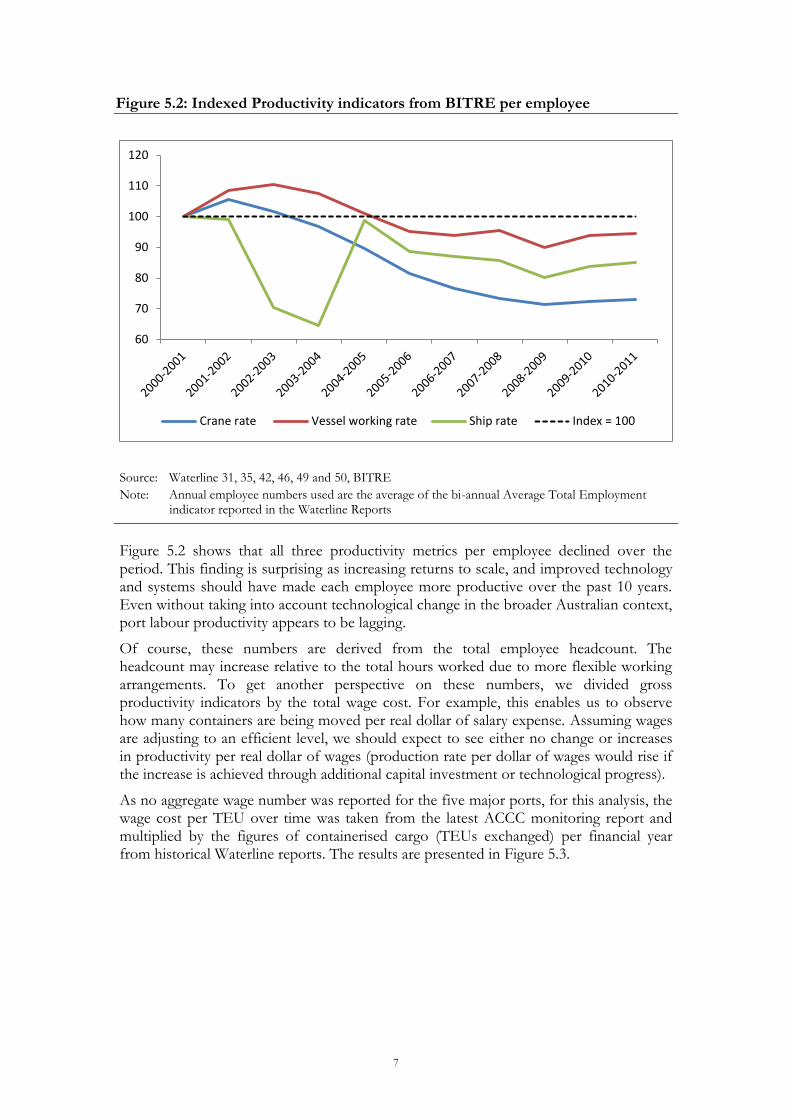
Figure 5.2: Indexed Productivity indicators from BITRE per employee
Source: Waterline 31, 35, 42, 46, 49 and 50, BITRE
Note: Annual employee numbers used are the average of the bi-annual Average Total Employment indicator reported in the Waterline Reports
Figure 5.2 shows that all three productivity metrics per employee declined over the period. This finding is surprising as increasing returns to scale, and improved technology and systems should have made each employee more productive over the past 10 years. Even without taking into account technological change in the broader Australian context, port labour productivity appears to be lagging.
Of course, these numbers are derived from the total employee headcount. The headcount may increase relative to the total hours worked due to more flexible working arrangements. To get another perspective on these numbers, we divided gross productivity indicators by the total wage cost. For example, this enables us to observe how many containers are being moved per real dollar of salary expense. Assuming wages are adjusting to an efficient level, we should expect to see either no change or increases in productivity per real dollar of wages (production rate per dollar of wages would rise if the increase is achieved through additional capital investment or technological progress).
As no aggregate wage number was reported for the five major ports, for this analysis, the wage cost per TEU over time was taken from the latest ACCC monitoring report and multiplied by the figures of containerised cargo (TEUs exchanged) per financial year from historical Waterline reports. The results are presented in Figure 5.3.
60
70
80
90
100
110
120
Crane rate Vessel working rate Ship rate Index = 100

8
Figure 5.3: Indexed productivity indicators from BITRE per real dollar of wage cost
Source: Waterline 31, 35, 42, 46, 49 and 50, BITRE, CSMR no. 13, ACCC
Note: Salary costs are derived from total Labour Costs Component Per Unit ($/TEU) indicator reported in ACCC monitoring report multiplied by Containerised Cargo (TEUs exchanged) in the BITRE reports.
Again, indicators of throughput rates per dollar of real wages have all decreased substantially since FY2000-2001. This indicates that, in aggregate, wage increases have been running ahead of productivity increases. Moving away from the productivity indicators reported in BITRE’s Waterline reports, we further analysed changes in productivity by looking at the changes in total throughput per employee and per dollar of real wages over the period. Figure 5.4 shows the gross throughput figures for the 5 major Australian ports. In Figures 5.5 and 5.6, we express this total throughput in per employee and per dollar of real wages terms. We use source data which measures total cargo throughput and non-containerised general cargo in tonnes, while containerised cargo is measured in TEUs exchanged. The results are presented in the form of normalised indices.
An obvious aberration is that the non-containerised general cargo8 line shoots off the graph in 2010-2011 reaching an index level of 618—not shown for legibility of the graph. This is as a result of a major increase in handling of non-containerised general cargo at Fremantle Port from an average of around 1 million tonnes per year from 2007 to 2009 to just over 20 million tonnes per year in FY 2010-2011. Fremantle Port’s 20 million tonnes of non-containerised general cargo accounts for around 85% of all non-containerised general cargo handled by the five major ports and 77% of the total cargo throughput of Fremantle Port. However, even with this increase, non-containerised general cargo only accounts for 17% out of the five ports total cargo throughput. Furthermore, as we do not have information on the capital investment at the port, we cannot separate out the productivity improvements that are due to labour and those that are due to new capital investment.
8 Non-containerised general cargo excludes bulk cargoes and refers to break bulk commodities including machinery,
iron and steel products, timber, paper and timber products and other general products.
9
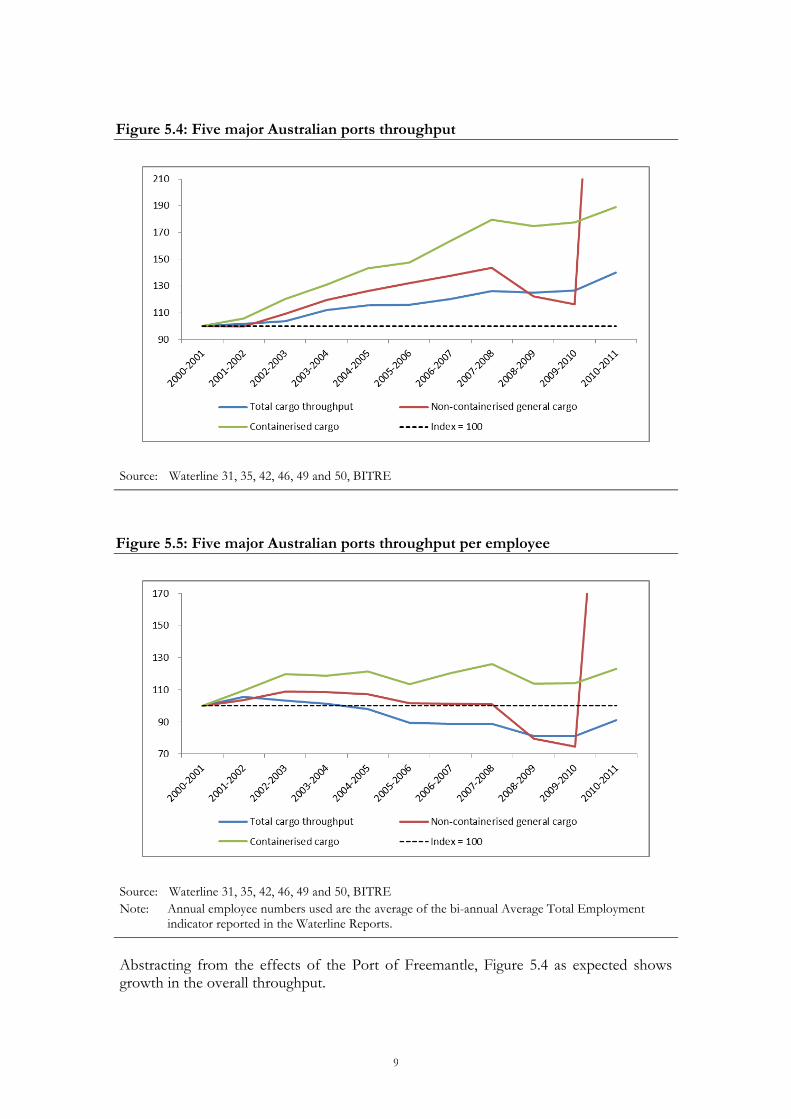
Figure 5.4: Five major Australian ports throughput
Source: Waterline 31, 35, 42, 46, 49 and 50, BITRE
Figure 5.5: Five major Australian ports throughput per employee
Source: Waterline 31, 35, 42, 46, 49 and 50, BITRE
Note: Annual employee numbers used are the average of the bi-annual Average Total Employment indicator reported in the Waterline Reports.
Abstracting from the effects of the Port of Freemantle, Figure 5.4 as expected shows growth in the overall throughput.
10
However, as Figure 5.5 shows, there has been pretty much no increase in container throughput per employee since 2002/03, while the overall throughput per employee has been on a declining trend.
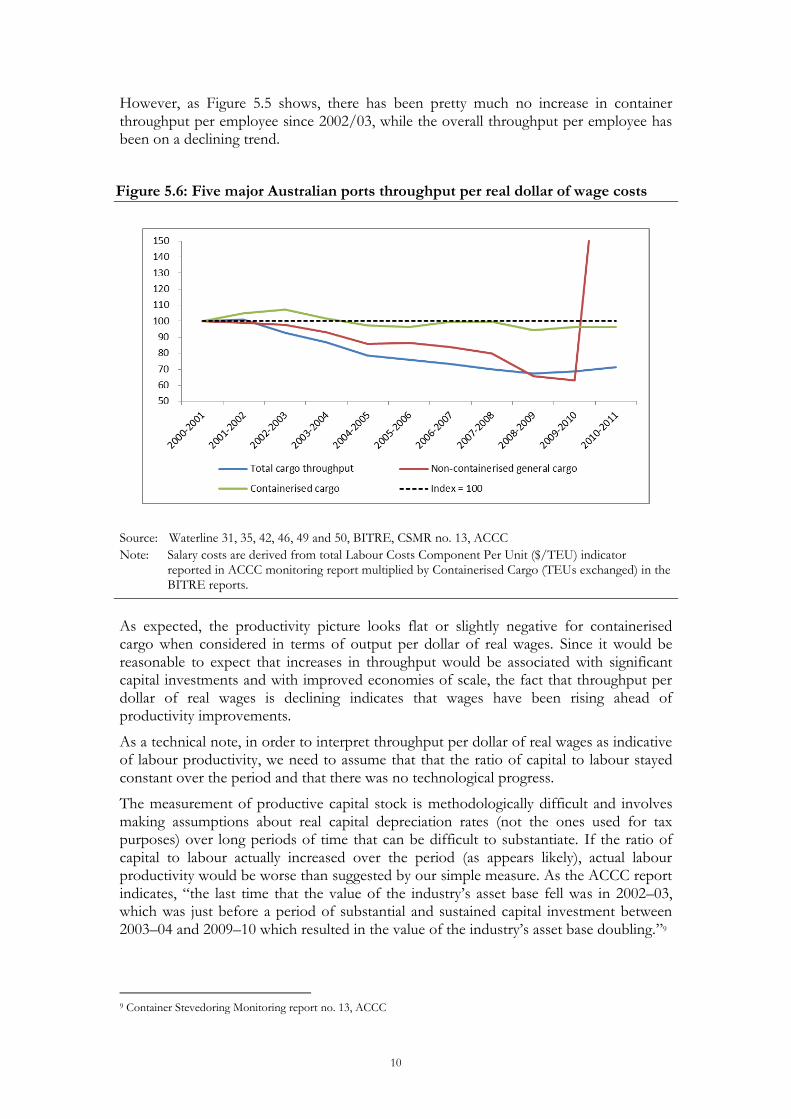
Figure 5.6: Five major Australian ports throughput per real dollar of wage costs
Source: Waterline 31, 35, 42, 46, 49 and 50, BITRE, CSMR no. 13, ACCC
Note: Salary costs are derived from total Labour Costs Component Per Unit ($/TEU) indicator reported in ACCC monitoring report multiplied by Containerised Cargo (TEUs exchanged) in the BITRE reports.
As expected, the productivity picture looks flat or slightly negative for containerised cargo when considered in terms of output per dollar of real wages. Since it would be reasonable to expect that increases in throughput would be associated with significant capital investments and with improved economies of scale, the fact that throughput per dollar of real wages is declining indicates that wages have been rising ahead of productivity improvements.
As a technical note, in order to interpret throughput per dollar of real wages as indicative of labour productivity, we need to assume that that the ratio of capital to labour stayed constant over the period and that there was no technological progress.
The measurement of productive capital stock is methodologically difficult and involves making assumptions about real capital depreciation rates (not the ones used for tax purposes) over long periods of time that can be difficult to substantiate. If the ratio of capital to labour actually increased over the period (as appears likely), actual labour productivity would be worse than suggested by our simple measure. As the ACCC report indicates, “the last time that the value of the industry’s asset base fell was in 2002–03, which was just before a period of substantial and sustained capital investment between 2003–04 and 2009–10 which resulted in the value of the industry’s asset base doubling.”9
9 Container Stevedoring Monitoring report no. 13, ACCC
11
6 Benchmarking of wage costs and Australian port competitiveness against international counterparts
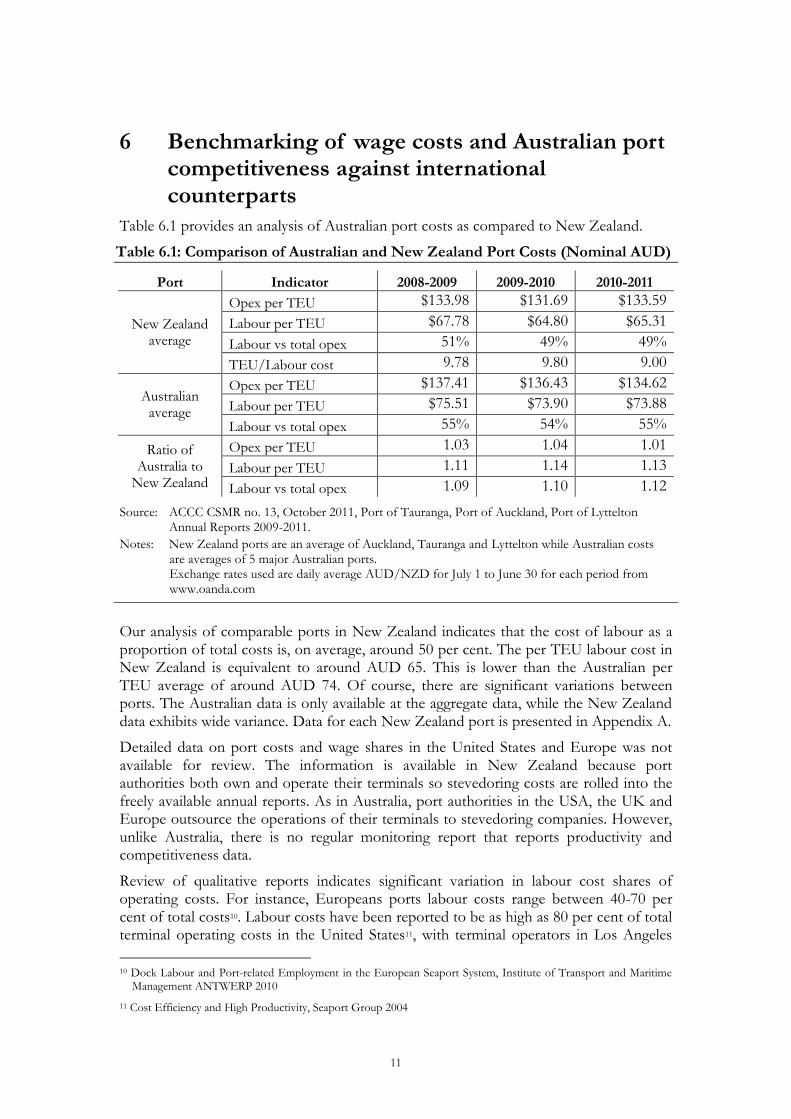
Table 6.1 provides an analysis of Australian port costs as compared to New Zealand.
Table 6.1: Comparison of Australian and New Zealand Port Costs (Nominal AUD)
Port Indicator 2008-2009 2009-2010 2010-2011
New Zealand average
Opex per TEU $133.98 $131.69 $133.59
Labour per TEU $67.78 $64.80 $65.31
Labour vs total opex 51% 49% 49%
TEU/Labour cost 9.78 9.80 9.00
Australian average
Opex per TEU $137.41 $136.43 $134.62
Labour per TEU $75.51 $73.90 $73.88
Labour vs total opex 55% 54% 55%
Ratio of Australia to
New Zealand
Opex per TEU 1.03 1.04 1.01
Labour per TEU 1.11 1.14 1.13
Labour vs total opex 1.09 1.10 1.12
Source: ACCC CSMR no. 13, October 2011, Port of Tauranga, Port of Auckland, Port of Lyttelton Annual Reports 2009-2011.
Notes: New Zealand ports are an average of Auckland, Tauranga and Lyttelton while Australian costs are averages of 5 major Australian ports. Exchange rates used are daily average AUD/NZD for July 1 to June 30 for each period from www.oanda.com
Our analysis of comparable ports in New Zealand indicates that the cost of labour as a proportion of total costs is, on average, around 50 per cent. The per TEU labour cost in New Zealand is equivalent to around AUD 65. This is lower than the Australian per TEU average of around AUD 74. Of course, there are significant variations between ports. The Australian data is only available at the aggregate data, while the New Zealand data exhibits wide variance. Data for each New Zealand port is presented in Appendix A.
Detailed data on port costs and wage shares in the United States and Europe was not available for review. The information is available in New Zealand because port authorities both own and operate their terminals so stevedoring costs are rolled into the freely available annual reports. As in Australia, port authorities in the USA, the UK and Europe outsource the operations of their terminals to stevedoring companies. However, unlike Australia, there is no regular monitoring report that reports productivity and competitiveness data.
Review of qualitative reports indicates significant variation in labour cost shares of operating costs. For instance, Europeans ports labour costs range between 40-70 per cent of total costs10. Labour costs have been reported to be as high as 80 per cent of total terminal operating costs in the United States11, with terminal operators in Los Angeles
10 Dock Labour and Port-related Employment in the European Seaport System, Institute of Transport and Maritime
Management ANTWERP 2010
11 Cost Efficiency and High Productivity, Seaport Group 2004
12
and Long Beach claiming that hourly labour costs have increased by 31 per cent between 2006 and 201112.
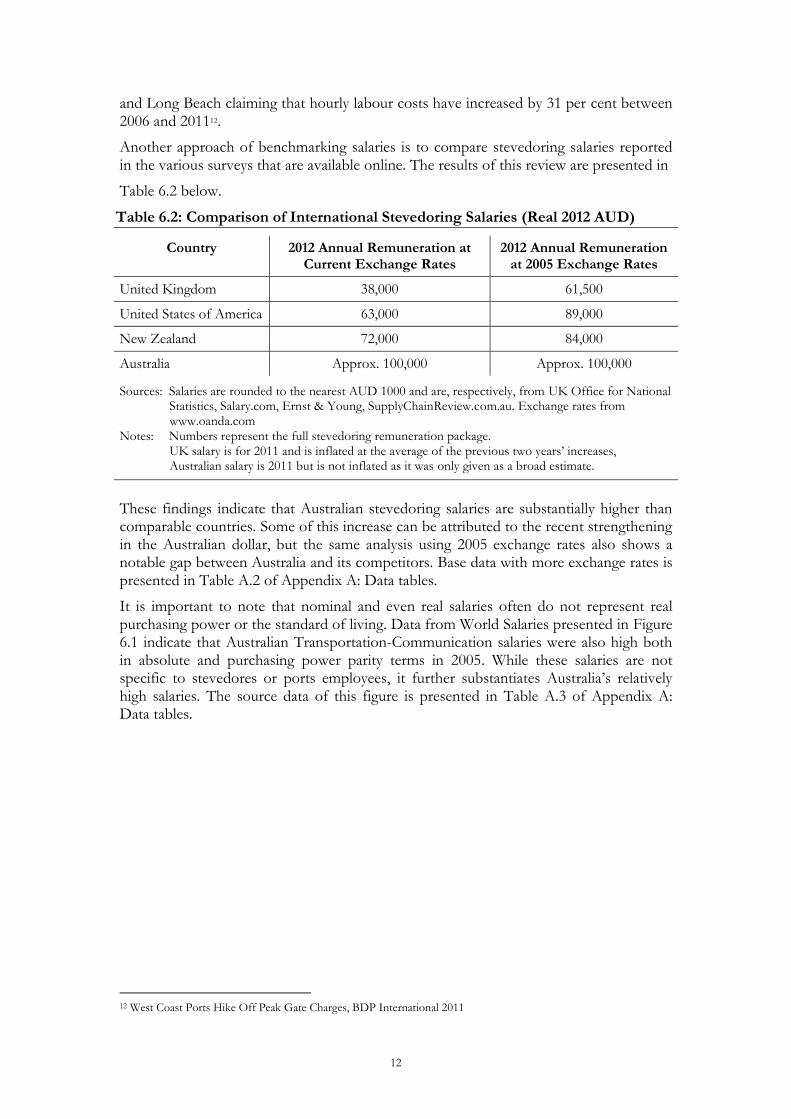
Another approach of benchmarking salaries is to compare stevedoring salaries reported in the various surveys that are available online. The results of this review are presented in
Table 6.2 below.
Table 6.2: Comparison of International Stevedoring Salaries (Real 2012 AUD)
Country 2012 Annual Remuneration at Current Exchange Rates
2012 Annual Remuneration at 2005 Exchange Rates
United Kingdom 38,000 61,500
United States of America 63,000 89,000
New Zealand 72,000 84,000
Australia Approx. 100,000 Approx. 100,000
Sources: Salaries are rounded to the nearest AUD 1000 and are, respectively, from UK Office for National Statistics, Salary.com, Ernst & Young, SupplyChainReview.com.au. Exchange rates from www.oanda.com
Notes: Numbers represent the full stevedoring remuneration package. UK salary is for 2011 and is inflated at the average of the previous two years’ increases, Australian salary is 2011 but is not inflated as it was only given as a broad estimate.
These findings indicate that Australian stevedoring salaries are substantially higher than comparable countries. Some of this increase can be attributed to the recent strengthening in the Australian dollar, but the same analysis using 2005 exchange rates also shows a notable gap between Australia and its competitors. Base data with more exchange rates is presented in Table A.2 of Appendix A: Data tables.
It is important to note that nominal and even real salaries often do not represent real purchasing power or the standard of living. Data from World Salaries presented in Figure 6.1 indicate that Australian Transportation-Communication salaries were also high both in absolute and purchasing power parity terms in 2005. While these salaries are not specific to stevedores or ports employees, it further substantiates Australia’s relatively high salaries. The source data of this figure is presented in Table A.3 of Appendix A: Data tables.
12 West Coast Ports Hike Off Peak Gate Charges, BDP International 2011

13
Figure 6.1: International Transport-Communication Salaries (Ordered by PPP Salaries)
Source: www.worldsalaries.org
High Australian salaries would not be a problem if they were accompanied by proportionally high productivity. However, our analysis of port productivity presented in Table 6.3 indicates that the five major Australian ports are, on average, less productive than a range of comparable ports selected by BITRE for comparison in 2009. This data is presented in further detail in Figure A.1 to Figure A.6 of Appendix A.
Table 6.3: Australian Port Productivity in an International Context
Median
Contextual Indicators Port Productivity Indicators Port
Competitiveness Indicators
Through-put Ships
Visiting
Net Crane Rate
Through-put per Berth Metre
Yard Utilisation
Vessel Turnaround
Time
(# TEU per year)
(# ships per year)
(See Section
3.1)
(TEU per berth
metre)
(TEU through-put
per Ha) (Hours)
Overseas Ports 2,446,000 6,200 30.0 945 26,683 26.0
Five Australian Ports
875,000 2,500 28.1 545 13,040 29.0
Australian performance
-64% -60% -6% -42% -51% 12%
Source: Australian Ports in an International Context, Information Paper 65. BITRE, 2009
In summary, the data analysed in this section suggests that Australian port wages are high when compared internationally, particularly in relation to port productivity.
14
7 Conclusion
The most recent ACCC Stevedoring Monitoring Report states that the unions are seeking “enterprise wage agreements that seek to limit productivity improvements or re-impose less flexible arrangements.”
Our analysis shows that, even though Australian port throughput has increased, Australian port labour productivity has fallen over the past decade. That is, port wages have been increasing faster than productivity improvements, even before accounting for the improvements in technology and increased capital investment over the period studied.
Furthermore, our review of ports in comparable countries indicates that Australian port labour costs are high compared to countries with comparable living standards while efficiency is low in global terms. These factors are imposing unnecessary costs on the tradable sector – a major portion of our economy – but also on Australian consumers generally. This combination of high costs and low productivity is also unlikely to help Australian ports as they seek to position themselves as transhipment hubs for the region.
Our analysis shows that there is strong evidence that Australian port wage trends are at present not compatible with productivity trends. This is not sustainable in the medium term.
15
References
ACCC 2011, Container stevedoring monitoring report no. 13, Australian Competition & Consumer Commission, October 2011
BITRE 2002, Waterline 31, Maritime Statistical Report. BITRE, Canberra ACT.
BITRE 2003, Waterline 35, Maritime Statistical Report. BITRE, Canberra ACT.
BITRE 2007, Waterline 42, Maritime Statistical Report. BITRE, Canberra ACT.
BITRE 2009, Waterline 46, Maritime Statistical Report. BITRE, Canberra ACT.
BITRE 2009a, Australian container ports in an international context, Information Paper 65, BITRE, Canberra ACT.
BITRE 2011, Waterline 49, Maritime Statistical Report. BITRE, Canberra ACT.
BITRE 2011, Waterline 50, Maritime Statistical Report. BITRE, Canberra ACT.
Ernst & Young 2012, Ports of Auckland Fact Sheet, 24 January 2012. Accessed 8 February 2012 at http://www.scribd.com/doc/79155583/Ports-of-Auckland-Fact-Sheet-Ernst-and-Young
Game-Lopata 2011, Waterfront war on the cards, Supply Chain Review, April 2011. Accessed 8 February 2012 at http://www.supplychainreview.com.au/news.aspx? mid=548&ArticleID=73157
Salary.com 2012, United States National Average Remuneration for Stevedores. Accessed 8 February 2012 at http://swz.salary.com/salarywizard/Stevedore-Salary-Details.aspx? hdcbxbonuse=off&isshowpiechart=true&isshowjobchart=false&isshowsalarydetailcharts=false&isshownextsteps=false&isshowcompanyfct=false&isshowaboutyou=false
United Kingdom Office of National Statistics 2010, Annual Survey of Hours and Earnings.
United Kingdom Office of National Statistics 2011, Annual Survey of Hours and Earnings.
www.worldsalaries.org 2005, Average Salary in the Transport Sector. Accessed 9 February 2012 at http://www.worldsalaries.org/transportcommunication.shtml
16
Appendix A Data tables
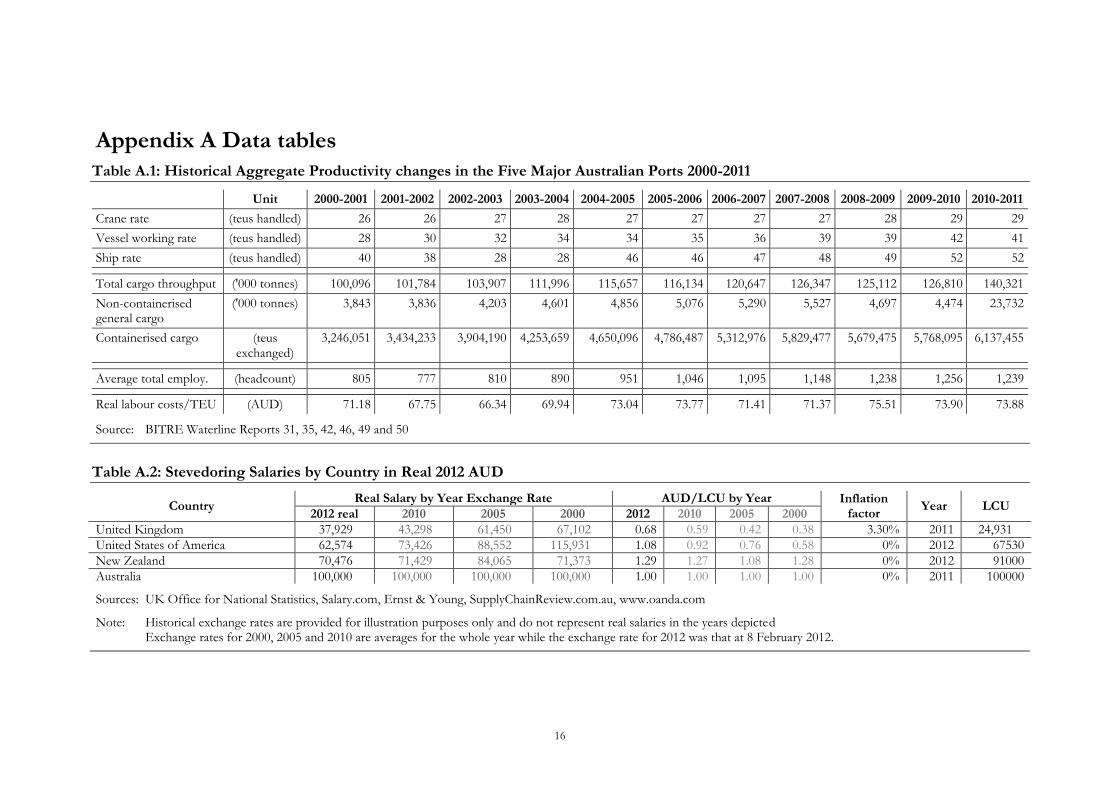
Table A.1: Historical Aggregate Productivity changes in the Five Major Australian Ports 2000-2011
Unit 2000-2001 2001-2002 2002-2003 2003-2004 2004-2005 2005-2006 2006-2007 2007-2008 2008-2009 2009-2010 2010-2011
Crane rate (teus handled) 26 26 27 28 27 27 27 27 28 29 29
Vessel working rate (teus handled) 28 30 32 34 34 35 36 39 39 42 41
Ship rate (teus handled) 40 38 28 28 46 46 47 48 49 52 52
Total cargo throughput ('000 tonnes) 100,096 101,784 103,907 111,996 115,657 116,134 120,647 126,347 125,112 126,810 140,321
Non-containerised general cargo
('000 tonnes) 3,843 3,836 4,203 4,601 4,856 5,076 5,290 5,527 4,697 4,474 23,732
Containerised cargo (teus exchanged)
3,246,051 3,434,233 3,904,190 4,253,659 4,650,096 4,786,487 5,312,976 5,829,477 5,679,475 5,768,095 6,137,455
Average total employ. (headcount) 805 777 810 890 951 1,046 1,095 1,148 1,238 1,256 1,239
Real labour costs/TEU (AUD) 71.18 67.75 66.34 69.94 73.04 73.77 71.41 71.37 75.51 73.90 73.88
Source: BITRE Waterline Reports 31, 35, 42, 46, 49 and 50
Table A.2: Stevedoring Salaries by Country in Real 2012 AUD
Country Real Salary by Year Exchange Rate AUD/LCU by Year Inflation
factor Year LCU
2012 real 2010 2005 2000 2012 2010 2005 2000
United Kingdom 37,929 43,298 61,450 67,102 0.68 0.59 0.42 0.38 3.30% 2011 24,931
United States of America 62,574 73,426 88,552 115,931 1.08 0.92 0.76 0.58 0% 2012 67530
New Zealand 70,476 71,429 84,065 71,373 1.29 1.27 1.08 1.28 0% 2012 91000
Australia 100,000 100,000 100,000 100,000 1.00 1.00 1.00 1.00 0% 2011 100000
Sources: UK Office for National Statistics, Salary.com, Ernst & Young, SupplyChainReview.com.au, www.oanda.com
Note: Historical exchange rates are provided for illustration purposes only and do not represent real salaries in the years depicted Exchange rates for 2000, 2005 and 2010 are averages for the whole year while the exchange rate for 2012 was that at 8 February 2012.

17
Table A.3: Transport-Communication Sector Salaries – International Comparison
Country Net Monthly
Income Constant 2005
US$ [a] [d] Notes, Source
Gross Monthly Sector Income
Compulsory Deductions
Weekly Hours
Taiwan PPP $ 2,724 $1,476 Employees, incl. overtime and bonus, 2005. National Statistics Republic of China, [10]. 53,793 dollars 12% 41.2
UK PPP $ 2,581 $2,615 Full-time employees on adult rates of pay, 2003. Incl. overtime payments. UK Employment Department, [9], [t].
2,064 pounds 27% 42.8
Australia PPP $ 2,524 $2,478 Full-time adult non-managerial employees, 2004. Australian Bureau of Statistics, [9], [t]. 4,081 dollars 20% 38.5
Switzerland PPP $ 2,495 $3,554 Standardised monthly earnings (40 hours x 4 1/3 weeks), 2004. Office fédéral de la statistique Suisse, [9]. 6,299 francs 32% 37.8
Korea PPP $ 2,323 $1,842 Regular employees incl. family allowances and the value of payments in kind, 2005. Establishments with 5 or more regular employees. Korea Ministry of Labour, [9].
2,111,000
wons 11% 47.3
Norway PPP $ 2,252 $3,107 Full-time employees, 2005. Excl. overtime payments. Statistics Norway, [9]. 29,484 kroners 32% 38.7
Spain PPP $ 2,167 $2,065 Incl. overtime payments and irregular gratuities, 2005. Instituto Nacional de Estadística, [9], [k]. 2,047 euros 19% 37.2
France PPP $ 2,153 $1,690 Employees, 2002. Ministère de l'Emploi et de la Formation Professionnelle, [9]. 1,647 euros 0% 40.5
Greece PPP $ 2,089 $1,359 Part-time and full-time employees, 2002. Statistics Greece, [13], [9], [k]. 1,743 euros 24% 45.7
Belgium PPP $ 2,074 $2,018 Full-time employees, 2003. Institut National de Statistique, [9], [t]. 2,435 euros 31%
Canada PPP $ 2,044 $2,043 Employees, 2005. Incl. overtime. Statistics Canada, [9], [t]. 3,484 dollars 29% 35.9
New Zealand PPP $ 1,947 $1,861 Standardized income (180 hours/month), full-time equivalent employees, 2004. Statistics New Zealand, [9], [t].
3,533 dollars 23% 39.4
Netherlands PPP $ 1,899 $2,315 Full-time employees, 2004. Excl. overtime payments. Netherlands Central Bureau voor de Statistiek, [9]. 2,582 euros 30% 38.9
Austria PPP $ 1,874 $1,806 Employees, 2003. Austrian Central Statistical Office (ÖSTAT), [9], [t]. 2,244 euros 33% 37.4
Israel PPP $ 1,864 $1,511 Employees, 2005. Incl. payments subject to income tax. Incl. workers from the Judea, Samaria and Gaza areas. Israel Central Bureau of Statistics, [9], [t].
8,663 new shekels
22% 39.8
Singapore PPP $ 1,814 $1,693 Employees, 2005. Ministry of Manpower, [9], [t]. 3,610 dollars 22% 45.5
Finland PPP $ 1,798 $2,147 Full-time employees, 2004. Excl. seasonal and end-of-year bonuses. Statistics Finland, [9], [k], [t]. 2,429 euros 31% 38.4
Italy PPP $ 1,762 $1,902 Employees, 2005. Istituto Nazionale di Statistica, [9]. 2,182 euros 30% 40.2
Hong Kong median income
PPP $ 1,709 $1,283 Employees, 2005. Hong Kong Census and Statistics Department, [9]. 10,500 dollars 5% 47.6
Portugal PPP $ 1,669 $1,424 Employees, 2005. Instituto Nacional de Estatística, [9]. 1,447 euros 21% 38.6
Sweden average salary
PPP $ 1,431 $1,873 Wage earners in the private sector, 2005. Excl. holidays, sick-leave and overtime payments. Statistiska Centralbyrån, [9].
20,199 kronas 31% 37.5
Philippines PPP $ 1,251 $281 Employees, 2001. Establishments with 20 or more persons employed. National Statistics Office, [9], [t]. 15,097 pesos 14% 47.4
Czech Republic PPP $ 940 $573 Employees, 2004. Czech Statistical Office, [9]. 18,488 korunas 23%
Poland PPP $ 931 $562 Employees, 2005. Incl. the value of payments in kind. Poland Central Statistical Office, [9], [k]. 2,593 zlotys 30% 42.9
Brazil PPP $ 916 $326 Employees, 2002. Ministerio do Trabalho e da Previdência Social, [9]. 924 reals 10% 47.2
Hungary PPP $ 874 $555 Full-time employees in enterprises with 5 or more employees, 2005. Hungarian Central Statistical Office, [9], [k].
169,748
forints 35%
Slovakia PPP $ 852 $462 Employees, 2005. Excl. enterprises with less than 20 employees. Štatistický úrad Slovenskej republiky, [9], [k].
18,340 korunas 22% 32.1

18
Country Net Monthly
Income Constant 2005
US$ [a] [d] Notes, Source
Gross Monthly Sector Income
Compulsory Deductions
Weekly Hours
Latvia PPP $ 772 $343 Employees, 2005. Central Statistical Bureau of Latvia, [9], [t]. 266 lats 28% 42.1
China PPP $ 768 $176 Employees, 2004. State-owned units, urban collective-owned units and other ownership units. National Bureau of Statistics of China, [9].
1,532 yuans 8%
Russia PPP $ 736 $352 Employees, 2005. Federal State Statistics Office, [9]. 11,436 roubles 13%
Thailand PPP $ 722 $230 Employees, 2005. Thailand National Statistical Office, [9], [t], [s]. 9,844 bahts 6% 49.1
Lithuania PPP $ 687 $347 Employees, 2005. All employees converted into Full-time units. Excl. individual unincorporated enterprises. Statistics Lithuania, [9].
1,337 litas 28% 39.1
Mexico PPP $ 654 $418 Employees, 2005. Instituto Nacional de Estadística, Geografía e Informatica (INEGI), [9], [k]. 4,843 pesos 6% 52.9
Romania PPP $ 590 $255 Employees, 2004. Romania National Institute of Statistics, [9]. 1,122 new lei 30% 42.8
Source: www.worldsalaries.org
Notes: [9] International Labour Organization. Compilation of average salary income worldwide. Classified by country, by employment category, and by gender. [10] National Statistics Republic of China (Taiwan). [13] Statistics Greece. [a] Interbank nominal exchange rate, Oanda.com; historical currency converter for over 164 currencies and 3 metals. [d] World Economic Outlook Database, September 2006, International Monetary Fund. [k] OECD Tax Database. Annual database providing comparative information on personal and corporate income tax and consumption tax systems and rates in OECD countries since 2000. Information on social security contributions levied on employees and their employers is also reported. [t] Online calculators yielding net income from gross income: Australia, Austria, Belgium, Canada, Germany, Ireland, Israel, New Zealand, UK, U.S., Singapore.
19
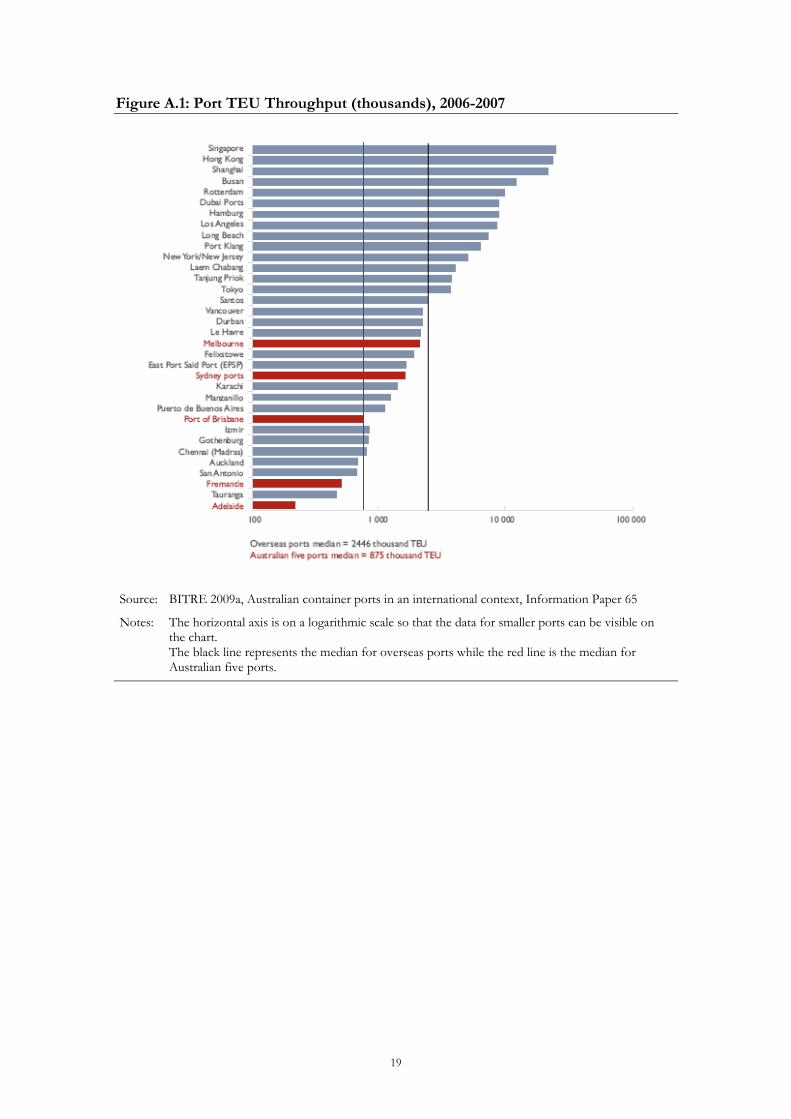
Figure A.1: Port TEU Throughput (thousands), 2006-2007
Source: BITRE 2009a, Australian container ports in an international context, Information Paper 65
Notes: The horizontal axis is on a logarithmic scale so that the data for smaller ports can be visible on the chart. The black line represents the median for overseas ports while the red line is the median for Australian five ports.

20
Figure A.2: Number of Commercial Ships (Thousands) Arriving at a Port 2005-2006
Source: BITRE 2009a, Australian container ports in an international context, Information Paper 65
21
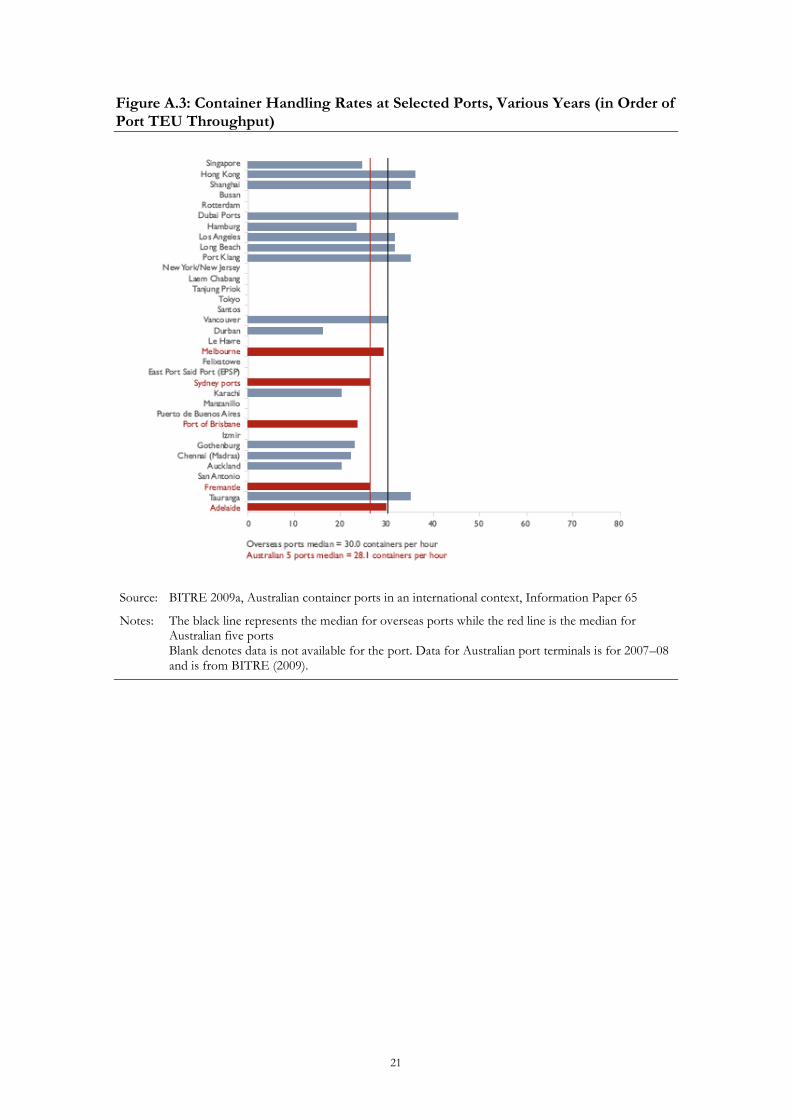
Figure A.3: Container Handling Rates at Selected Ports, Various Years (in Order of Port TEU Throughput)
Source: BITRE 2009a, Australian container ports in an international context, Information Paper 65
Notes: The black line represents the median for overseas ports while the red line is the median for Australian five ports Blank denotes data is not available for the port. Data for Australian port terminals is for 2007–08 and is from BITRE (2009).
22
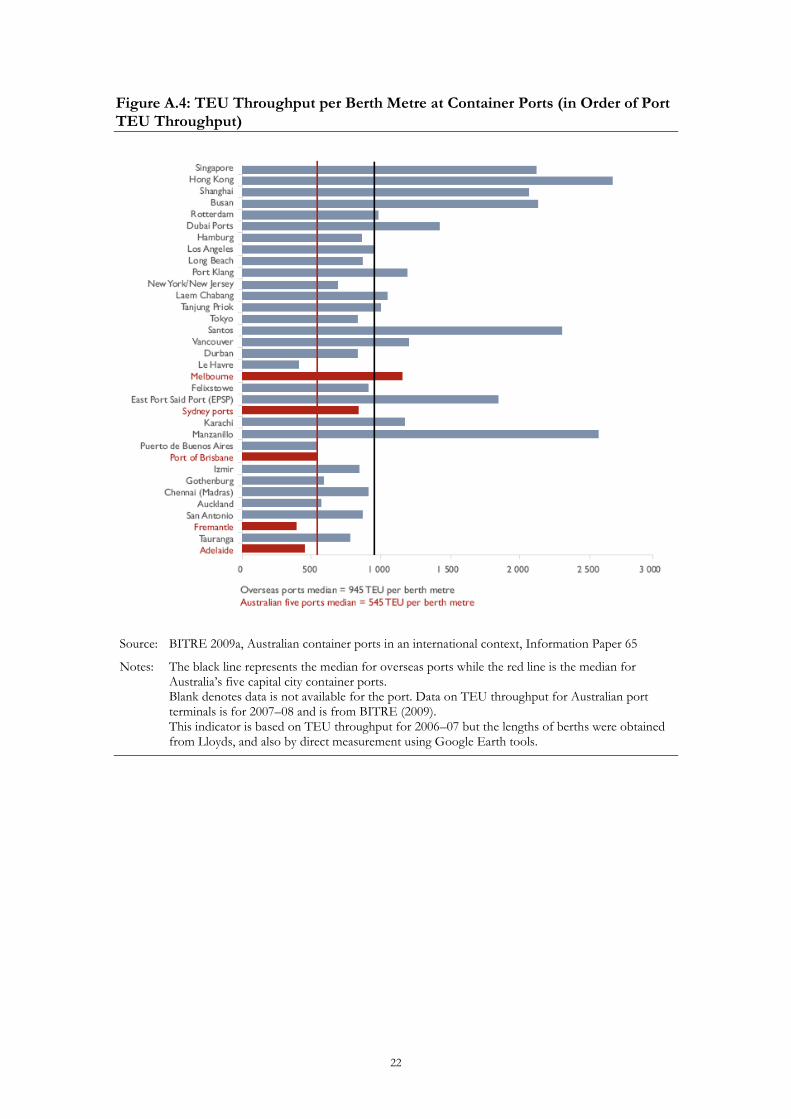
Figure A.4: TEU Throughput per Berth Metre at Container Ports (in Order of Port TEU Throughput)
Source: BITRE 2009a, Australian container ports in an international context, Information Paper 65
Notes: The black line represents the median for overseas ports while the red line is the median for Australia’s five capital city container ports. Blank denotes data is not available for the port. Data on TEU throughput for Australian port terminals is for 2007–08 and is from BITRE (2009). This indicator is based on TEU throughput for 2006–07 but the lengths of berths were obtained from Lloyds, and also by direct measurement using Google Earth tools.

23
Figure A.5: Yard utilisation measured as TEU throughput per gross hectare at port terminal (In Order of Port TEU Throughput)
Source: BITRE 2009a, Australian container ports in an international context, Information Paper 65
Notes: The black line represents the median for overseas ports while the red line is the median for Australia’s five capital city container ports. Blank denotes data is not available for the port. Data on TEU throughput for Australian port terminals is for 2007–08 and is from BITRE (2009). This indicator is based on TEU throughput for 2006–07. The areas of container yards were obtained from Lloyds, and also by direct measurement using Google Earth tools.
24
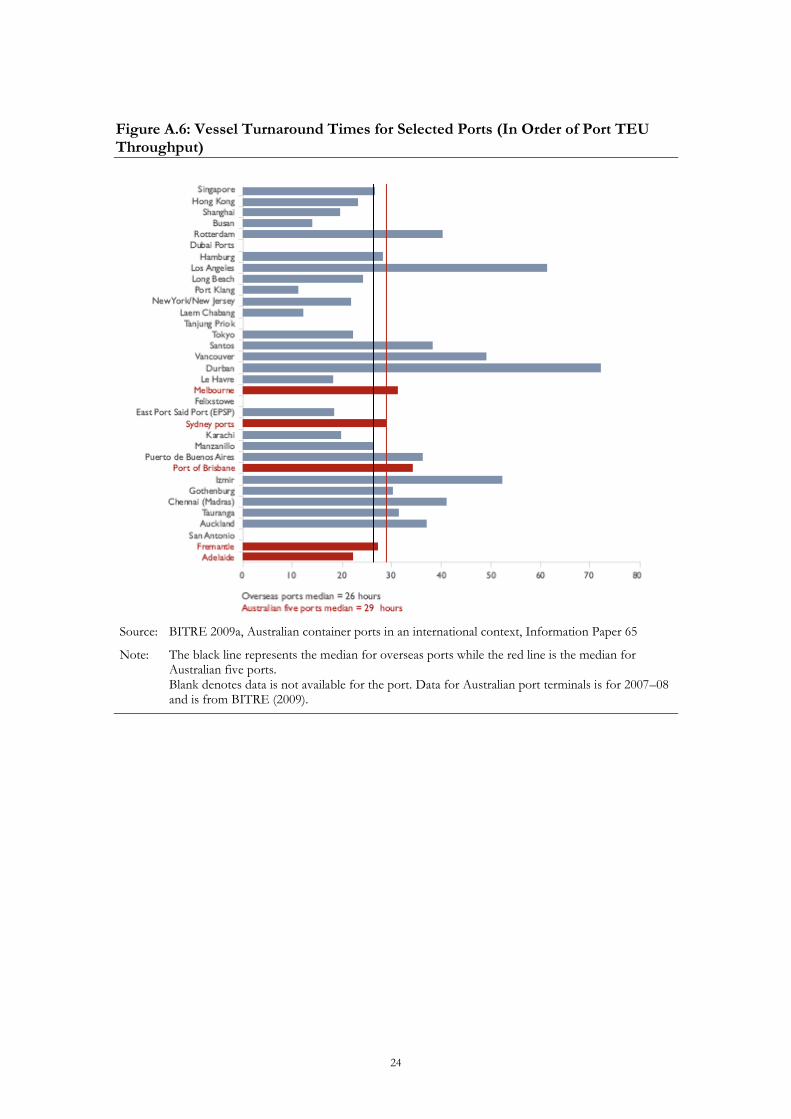
Figure A.6: Vessel Turnaround Times for Selected Ports (In Order of Port TEU Throughput)
Source: BITRE 2009a, Australian container ports in an international context, Information Paper 65
Note: The black line represents the median for overseas ports while the red line is the median for Australian five ports. Blank denotes data is not available for the port. Data for Australian port terminals is for 2007–08 and is from BITRE (2009).

C:\Users\john\Documents\Projects\Australia\Ports benchmarking\Report\Port Wage Cost report 20120604.docx
T: +1 (202) 466-6790 F: +1 (202) 466-6797 1700 K Street NW Suite 410 WASHINGTON DC 20006 United States of America T: +61 (2) 9231 6862 F: +61 (2) 9231 3847 36 – 38 Young Street SYDNEY NSW 2000 Australia T: +64 (4) 913 2800 F: +64 (4) 913 2808 Level 2, 88 The Terrace PO Box 10-225 WELLINGTON 6143 New Zealand T: +33 (1) 45 27 24 55 F: +33 (1) 45 20 17 69 7 Rue Claude Chahu PARIS 75116 France ------------- www.castalia-advisors.com