the effect of visual search strategy and overlays on visual
TRANSCRIPT

Graduate Theses and Dissertations Iowa State University Capstones, Theses andDissertations
2011
The effect of visual search strategy and overlays onvisual inspection of castingsKristopher Patrick WattsIowa State University
Follow this and additional works at: https://lib.dr.iastate.edu/etd
Part of the Industrial Engineering Commons
This Thesis is brought to you for free and open access by the Iowa State University Capstones, Theses and Dissertations at Iowa State University DigitalRepository. It has been accepted for inclusion in Graduate Theses and Dissertations by an authorized administrator of Iowa State University DigitalRepository. For more information, please contact [email protected].
Recommended CitationWatts, Kristopher Patrick, "The effect of visual search strategy and overlays on visual inspection of castings" (2011). Graduate Thesesand Dissertations. 10354.https://lib.dr.iastate.edu/etd/10354

The effect of visual search strategy and overlays on visual inspection of
castings
By
Kristopher P. Watts
A thesis submitted to the graduate faculty
In partial fulfillment of the requirements for the degree of
MASTER OF SCIENCE
Major: Industrial Engineering
Program of Study Committee:
Richard T. Stone, Co-major Professor
Frank Peters, Co-major Professor
Max Morris
Iowa State University
Ames, Iowa
2011
Copyright © Kristopher P. Watts, 2011. All Rights Reserved

ii
TABLE OF CONTENTS
List of Figures .......................................................................................................................... iii
Acknowledgments.................................................................................................................... iv
Abstract ..................................................................................................................................... v
Chapter 1 Introduction .............................................................................................................. 1
1.1 Impetus ............................................................................................................................ 1
1.2. Search Strategy ............................................................................................................... 2
1.3 Training Interventions ..................................................................................................... 3
1.3.1. Feedback .................................................................................................................. 4
1.3.2. Feedforward systems ............................................................................................... 4
1.3.3 Eye Training ............................................................................................................. 5
1.4. Cognitive ability ............................................................................................................. 6
1.5 Hypotheses ...................................................................................................................... 9
Chapter 2 Method ................................................................................................................... 10
2.1 Experimental Group ...................................................................................................... 10
2.2 Participants .................................................................................................................... 11
2.3 Training ......................................................................................................................... 11
2.4 Inspection ...................................................................................................................... 12
2.5 Laboratory Setup ........................................................................................................... 13
2.6 Experimental Design-Independent Variable ................................................................. 14
2.7 Experimental Design-Dependent Variables .................................................................. 14
Chapter 3 Results .................................................................................................................... 18
3.1 Signal Detection Results ............................................................................................... 18
3.1.1 d’ Results ................................................................................................................ 18
3.1.2 False Alarm Rate .................................................................................................... 21
3.1.3 Hit Rate Results ...................................................................................................... 24
3.2 MFFT Results ................................................................................................................ 28
3.3 Eye Tracking Results .................................................................................................... 31
Chapter 4 Discussion .............................................................................................................. 33
Chapter 5 Conclusion .............................................................................................................. 36
Chapter 6 Future Research ...................................................................................................... 37
References ............................................................................................................................... 38

iii
LIST OF FIGURES
Figure 1: Screenshot of MFFT .................................................................................................. 7 Figure 2: Overlay on casting (enhanced for clarity) ............................................................... 10 Figure 3: Laboratory setup used to conduct the experiment ................................................... 13 Figure 4: Eye tracker being worn............................................................................................ 16
Figure 5: Search pattern (solid line) and percentage of part viewed (wide red line) .............. 17 Figure 6: d' by condition ......................................................................................................... 18 Figure 7:d' by part type ........................................................................................................... 20 Figure 8: False alarm rate condition ....................................................................................... 21
Figure 9: False alarm rate by part ........................................................................................... 23
Figure 10: Hit rate by condition .............................................................................................. 25 Figure 11: Hit rate by part ....................................................................................................... 26 Figure 12: d' by cognitive style ............................................................................................... 28
Figure 13: Hit rate by cognitive style ..................................................................................... 29 Figure 14: False alarm rate by cognitive style ........................................................................ 30
Figure 15: Percentage of the time rastering was adopted by condition .................................. 31
Figure 16: Percentage of casting viewed by condition ........................................................... 32

iv
ACKNOWLEDGMENTS
I would like to thank my wife for all the support she has shown me throughout my
schooling. She has been very understanding and accommodating throughout this entire
process. I would also like to thank my parents who have supported me from the very
beginning.
I would like to thank my major professors Dr. Stone and Dr. Peters for their direction
and support through this project. Their support helped me take this idea and turn it into a
complete project. I would also like to thank my other committee member Dr. Morris. Finally,
I would like to thank all those who helped with the various stages of this project including
Alex Clemons and Emmanuel Marrero.

v
ABSTRACT
In the domain of inspecting particularly the casting industry there is currently a great
deal of subjectivity in the visual inspection of castings. This subjectivity results in high rates
of miss and false alarm outcomes among workers inspecting castings. These events lead to
costly rework and end user rejection of product. Due to this, there is much interest in
improving the inspection methods to detect anomalies. This research involves using various
methods including search pattern training, as well as visual overlays, to augment the way
inspectors inspect the casting. This is then compared to a control group. The results show the
experimental groups that received search pattern training were superior to the standard
training/control group. However, the group that utilizes an overlay was not superior to the
control group despite the similar raster training, indicating the overlay methods used is
distracting to the user.

1
CHAPTER 1 INTRODUCTION
1.1 Impetus
There is a need in the casting industry for visual inspectors to inspect the parts for
quality assurance reasons before they are shipped to the customer (whether in-house or to an
outside vendor). This industry has recently expressed its desire to improve its inspectors’
performance during the inspection process.
Currently, in the casting industry, there has been a call for a reform of the way
castings are inspected. It has been shown that in the casting industry as a whole inspectors
are over marking and under marking parts (Daricilar, 2005). That is, the inspectors are
indicating possible areas that are bad when they are good or not identifying the areas that are
bad. However, the need for visual inspectors or their desire to improve their performance is
not a novel idea. There has been much research done in the area of visual inspection. In fact,
Drury (1990) identified a model of the inspection process which he stated as: “(1) a search,
which, if successful, (2) requires some level of decision making.”
In addition to the previous research and noted need, field studies were conducted at
actual facilities; observations were first taken. Various strategies were utilized in order to
determine how well the inspectors were performing. It was found that there was a deficiency
in the performance of the inspectors. The industry inspectors routinely missed anomalies as
well as over marked parts. This was the impetus to perform the laboratory experiment.

2
1.2. Search Strategy
There have been many studies that have looked at the area of visual inspection.
However, they are usually general in nature with very few relating to the casting industry
(Daricilar, 2005). Of the visual inspection papers available, there are many that look at how
to improve the visual inspector’s accuracy and efficiency in the visual inspection task.
Gallwey and Drury (1986) varied the complexity of the search task by increasing or
decreasing the number of fault types presented to the participants (two, four, or six types).
They found that as the number of faults increased, so did the performance of the inspectors.
Also, since decision making is imperative for human visual inspection tasks, McDonald and
Gramopadhy (1998) evaluated the subjects’ decision making performance by studying the
effect of cost and pacing. This is a reward or penalty system based on the correct or incorrect
decision made.
In order to find the anomalies, humans must be able to search for the parts. As such,
the human search process can be broken down into two distinct strategies: random and
systematic search patterns. However, when humans perform this task it is generally a
combination of the two. Previous literature indicates that of the two strategies, the systematic
strategy is the most optimal; additionally this can be improved by training. There are several
methods of training individuals to adopt the more optimal strategy. In order to evaluate the
effects of a search pattern, Nickles et al. (1998) had his subjects follow a cursor along a
zigzag path. This task was performed with two conditions (low and high complexity tasks).
However, the participants were instructed to only use their eyes and not to follow the cursor
with their hand or any other object.

3
Additionally, the inspection rate also plays a large part in the performance of the
inspector. Previous literature has evaluated the effect that the speed of the cursor (which can
relate to how fast a human eye is scanning the object) had on the participants (Koenig et al.,
2002). Its speed was evaluated under varying levels of task complexity; the different
conditions include background density, fault probability, background characters, and fault
mix. The results from these studies show that as the cursor speed increased accuracy
decreased. This is likely due to the speed-accuracy trade-off discussed by Drury (1994).
Additionally, Koening et al. (2002) presented the appropriate speed of the cursor that the
human eye should follow under various conditions.
In addition to evaluating only the systematic search strategy, the direction of the
search method was also evaluated. Tetteh et al. (2008) evaluated the effect that the different
search directions (search orientation) had on the inspection task. He did this while also
looking at complexity and pacing as it pertains to inspection tasks. It was found that out of all
of the search strategies (horizontal, vertical, and diagonal) the horizontal search strategy was
the best.
1.3 Training Interventions
In addition to just utilizing a search strategy, there are many other types of
interventions that can be used to help improve visual inspection. Drury and Gramophadye
(1992) looked at various training interventions as they related to the inspection of aircraft.
They evaluated training methods such as schema, attribute, feedback, feedforward, as well as
visual lobe training. Of the systems tested the ones found to be of most importance are
feedback and feedforward systems. A feedforward system can be broken down into two

4
categories, Performance and Cognitive feedback (Gramopadhye et al., 1997; Gramopadhye et
al., 1997; Ma et al., 2002). Search times, search errors, and decision errors are examples of
performance feedback. Cognitive feedback provides information about the visual search process
(the area being inspected) or the visual search strategy employed during the search. It must be
noted that cognitive feedback is also sometimes known as process feedback for search tasks.
Feedforward systems provide context clues about where the operator should look and what they
should look at. In summary, feedback implies “you looked here” while feedforward implies
“you should look here” (Sadasivan, et al., 2005).
1.3.1. Feedback
As previously mentioned, feedback is giving information on where the participant just
looked in order to help with future observations. There are two different kinds of feedback.
The first of these is performance feedback and the second is cognitive feedback.
Performance feedback looks at the time and percentage of the parts viewed. Cognitive
feedback includes statistical and graphical feedback about their performance (Gramopadhye,
et al., 1997). Also, it has been shown that groups that receive feedback perform better than
those that that did not (Gramopadhye, et al., 1997).
1.3.2. Feedforward systems
When looking at the feedforward systems, things can get slightly more confusing.
They generally deal with the use of an overlay to provide information of where to look at any
given point in time. In order to evaluate feedforward systems for training of visual inspectors
for systematic search behavior, Nickles et al. (2003) assessed three differing types of
feedforward training. In the first system, the participants only received verbal instructions on

5
how to search for a target (they were instructed to use a systematic search strategy). The
second system used a static display (overlay) of the systemic search strategy. In addition,
participants received verbal instructions on how to search using the static overlay. The third
system utilized was a systematic pacing dynamic system, which follows, or traces, the path
they are to take at the speed at which they are to inspect. Additionally, the third group
received verbal instructions on how to search. The results show that all three systems had a
positive impact on performance. Further, there was no statistically significant difference
between the three groups. Nalanagula et al. (2006) also evaluated the difference between
feedforward displays. This study used a static, a dynamic, and a hybrid display to evaluate
printed circuit board (PCB) images. The static view presented a fixed image of the search
pattern they were to visually follow, displayed on top of the part. The dynamic display only
showed the self-pacing cursor and it did not leave a static pattern on the screen. However, the
hybrid display combined the dynamic cursor and the static overlay. The static overlay trails
behind the dynamic cursor as a trace. They found that the dynamic or hybrid displays were
superior; as such, they recommended their use. In particular, they recommended them to be
used by novices.
1.3.3 Eye Training
There has also been much research into the area of training the eye in order to follow
a particular pattern or overlay pattern. Generally these have been used to train children to
read in a specific pattern (Rayner, 1978; Rayner, 1985; Rayner, 1986). This type of training
relies on a rastering technique that has the children start at the top of the page, move left to
right, then continue down to the next line and repeat the process. Edge detection is utilized

6
during this training. In this method are trained not to move to the next line until their eyes
detect the edge of the page.
In addition to studies that only look at children there have also been many studies that
have addressed the search pattern of visual inspection of adults (Findley, 1997; Rayner,
1995; Theeuwes, et al., 1999; Widdel and Kastor ,1981). These studies looked at the use of
training inspectors to use a systematic training method and its ability to affect visual search
performance. This training was conducted in a similar manner to that of the children learning
to read. They found that the participants trained to use the systematic training pattern were
superior to those who did not.
1.4. Cognitive ability
One cannot simply address the issues of the visual inspectors without addressing the
base cognitive style of the visual inspectors. Stated another way, there is more to visual
inspection than training the inspectors. Their innate ability must be taken into account. There
is much previous literature that strongly supports the idea that human performance in
inspection tasks are heavily influenced by the inspector’s cognitive style.
When evaluating performance of visual inspectors it is important to take into account
their individual differences. There has been much done to try to categorize and select visual
inspectors based on their performance (Gallwey, 1982; Schwabish and Drury, 1984; Drury
and Chi, 1995; Gramopadhye, Drury, and Sharit, 1997; Chi and Drury, 1998). Galleway
(1982) used a total of ten tests to help determine if it were possible to predict how well an
inspector could perform an inspection task. The tests he used are card sorting, intelligence
(IQ), Embedded Figures Test (EFT), Eysenck Personality Inventory, Harris Inspection Test,

7
Questionnaire on Mental Imagery (QMI), Short-Term Memory (STM), single fault type
inspection, visual lobe size, and visual acuity. It was found that the EFT was especially good
for predicting performance in geometrical tasks. Similarly it was also found that visual lobe
size and mental imagery were good when trying to predict total inspection performance.
Following up with the Galleway (1982) study, Schwabish and Drury (1984) evaluated
the reflective-impulsive cognitive style and assessed whether it was possible to use it as a
predictor of inspection performance. In order to do this the Matching Familiar Figure Test
(MFFT) was used. The MFFT is a matching test where the participants are to match a
picture at the top to one of the six pictures below it. The MFFT tracks both the time of the
responses as well as the accuracy of the responses. A sample screenshot of the MFFT can be
seen in Figure 1.
Figure 1: Screenshot of MFFT

8
The inspectors from Schwabish and Drury (1989) were then categorized into one of
four categories based on their performance during the test (response time and accuracy). The
four groups they were placed into were Fast Accurates (FA), Impulsives (I), Reflectives (R),
and Slow Innacurates (SI). Fast accurates have responses that are faster than the median and
less errors than the median. Reflectives have responses that are slower than the median but
more accurate than the median. Impulsives have responses that are faster than the median but
are less accurate than the median. Finally, slow innacurates are slower than the median and
less accurate than the median.
The results of the MFFT were then compared to an actual visual inspection task. In
this task the participants were to look for a target in a field of characters. They were to click
on it if they found it then categorize its size they would then be moved to the next screen. If
they did not find it they could move to the next screen by indicating there was no target. It
was that the accurate groups were faster than the inaccurate groups and made less size
judgment errors. However, the inaccurate groups had a higher probability of success of
finding a target than the accurate groups. Finally, when the MFFT was conducted on a large
sample size by Wei (2010) it was found that the overall the fast accurate group was generally
better at finding the errors and was faster than the other groups, particularly the SI group.
However, it was found that the FA group was only statistically different from the SI group.
Additionally, there has been research done using the MFFT in the casting industry
(Stone, 2010). However, no correlation to performance was done in order to verify its valid
for this particular industry. The percentage of the metalcasting industry found in Stone et al.
(2010) can be found in Table 1.

9
Table 1: Percentage of the metalcasting population in each MFFT classification
Fast Accurate
Reflective
(slow inaccurate)
Impulsive
(fast inaccurate) Slow Inaccurate
9 25 28 39
1.5 Hypotheses
From the previous literature it can be seen that both cognitive style and training
interventions are factors that can affect human performance in visual inspection. When
looking at the inspection of castings it would be negligent to only look at one of these areas.
As such, the first hypothesis is that the performance in the MFFT would correlate the
inspection performance of the participants. The expected outcome is that the results would be
similar to that of those seen in Wei (2010).
The second hypothesis of the study is that a group of visual inspectors (inspecting
castings) trained to utilize a systematic search strategy will perform better than the group
with no training.
Further, the third hypothesis is that if a group is trained to use a visual search strategy
and is presented with an overlay will be superior to the other two groups.

10
CHAPTER 2 METHOD
2.1 Experimental Group
There were three conditions to this experiment. In the first condition the participants
were given the parts to inspect with no training beyond what an anomaly was (basic training
group). The second group received the exact same training as the basic training group as well
as how to effectively raster (raster training group). They were encouraged to raster the entire
time. The third group took advantage of a green static overlay projected onto the part with a
projector (raster/overlay training group). This can be seen in Figure 2. In all of the rastering
conditions (both raster training group and raster/overlay training group) the participants were
encouraged to raster throughout the experiment. These visual overlays are feedforward
systems similar to the ones used in Nalanagula et al. (2006) and Nickeles et al. (2003).
Figure 2: Overlay on casting (enhanced for clarity)

11
2.2 Participants
There were 24 participants in this study (12 females and 12 males) the average age
was 22.8 (SD=7.33). The Basic training group had an average age of 25.5 (SD=11.28), the
raster training group had an average age of 22.75 (SD=3.38), and the overlay group had an
average age of 20.125 (SD=1.17). All participants were randomly selected and placed into
one of the three groups. All subjects were required to have 20/20 vision. In addition, they
were not allowed to wear glasses (contacts were acceptable) as glasses interfered with the eye
tracking system.
2.3 Training
Before the participant could begin the actual inspection task, their training would
have to be performed. Regardless of group, a training system with performance feedback
would be provided similar to that of Gramopadhye, et al. (1997). This was to familiarize the
participants with castings and the type of anomalies they would be looking for. Once this was
complete, the basic training group would then begin the inspection process. The raster
training group and the raster/overlay training group would then receive further training on
how to effectively raster.
Raster training for the two groups was almost identical. The raster training was
instructed to first follow solid lines on a sheet of paper as if they were reading (left to right
top to bottom). They were encouraged to continue this process and even increase their speed
through multiple runs. After the solid lines had been completed, the participants were
presented with dashed lines. They were again encouraged to raster and to speed up through
the process. The participants were then asked to raster on an image. This image had points of

12
interest the participants were to point out. Again, they were encouraged to speed up their
pace and to keep rastering. However, they were also instructed to point out the points of
interest while at the same time keep their rastering motion with their eyes. Once this had
been completed, the participants repeated this procedure with an actual casting. The entire
process was monitored to ensure the participants were rastering the entire time. If it was
found they were not rastering they would be instructed to do so by the experimenter.
This entire process was conducted in the exact same manner for the raster/overlay
training group as it was for the raster training group. The only difference was that instead of
using the printed lines for the participants to practice rastering on, a projected overlay was
used. Once this was complete, the raster training group would inspect the castings without an
overlay, and the raster/overlay training group could inspect the castings with the aid of an
overlay.
2.4 Inspection
Once training had been completed, the participants were asked to inspect 90 parts
from five different casting types, ranging from 1kg to 27kg. They would receive the part
from the experimenter on a conveyance system and would have to inspect the part for any
anomaly. Once the anomaly was found, it had to be circled using a piece of chalk. They
would then place the part back onto the conveyance system and begin the cycle again until all
of the parts had been inspected. It must be noted that not all parts had anomalies. If the
participant believed the casting to not have anomaly he was to send it back without any
marks.

13
2.5 Laboratory Setup
The laboratory experiment was set up to as closely resemble a casting visual
inspection process as possible. The experiment was performed on Iowa State University’s
campus. A table was constructed as a platform for inspecting the parts at the same height as
what had been observed in industry. Additionally, a large number of casting types (5) with a
total number of 90 parts used for the actual inspection process to try to capture as much
unique geometry as possible. An image of the facility can be seen in Figure 3.
Figure 3: Laboratory setup used to conduct the experiment

14
2.6 Experimental Design-Independent Variable
The experimental design included two independent factors; in this case it is training
and the use of an inspection aid. The independent variables in this experiment were training
at two differing levels as well as the use of an inspection aid. As mentioned previously, the
three independent variables are the basic training, the raster training, and the raster, overlay
training groups. Gender effects were not considered in this study as pervious research has
indicated that sex is not a determining factor for visual inspection performance (Blatter et al.,
2006).
2.7 Experimental Design-Dependent Variables
The variables being measured in this experiment are the performance measures
related to signal detection (d’, hit rate, and false alarm rate), the cognitive styles of the
operators, as well as the percentage of the casting that could be seen by the inspector.
In order to have a metric of performance associated with the task of inspecting the
castings, signal detection theory was used. For it be acceptable to use this measure, each
anomaly had to be identified in order to determine the total number, and location, of all
anomalies for all of the parts. The criterion was set to ASTM A802 SCRATA plate standard
at the B4 and C1 level. This was done independently by three individuals familiar with the
standard.
For signal detection, it is first necessary to calculate the hits and false alarms to which
the participants responded. In this case, hits are the correct identification of an anomaly of a
defect. Conversely, a false alarm is when a participant designates an area to contain an
anomaly when there is not one present.

15
The most important measure associated with signal detection in this case is d’. This is
essentially how good the participants were at the inspection task. It is the ratio of how many
hits to how many misses the participant had. Sensitivity is calculated as d’= Z(Hit Rate %)-
Z(False Alarm Rate) (Stanislaw et al., 1999). More precisely, d’ is “the ratio of the ordinate
of the SN (signal plus noise) at the criterion to the ordinate of the random variation of the N
(Radom variation plus noise) distribution at the criterion” (Stone, 2008).
In addition to the real world visual inspection task, a MFFT was also conducted in
order to determine the cognitive ability of the inspectors. This was administered in the same
procedure as Drury (1984). Verbal instructions were given and the tests were administered
electronically. A median analysis was conducted on the data. Due to the fact it was a median
analysis; three participants had to be dropped from the study for having a median score. None
of their data could be used due to the fact it could not be correlated.
In order to determine the overall percentage of the part the inspectors were inspecting,
as well as the search pattern they were adopting, an eye tracker system was developed. This
eye tracker was built using off the shelf components that could be easily replaced. The
cameras used were Logitech C905 webcams. One was pointed at the eye while the other was
pointed at the world. The one pointed at the eye had a Kodak Wratten IR #87 filter placed
over the lens to block all visible light but allow IR light to pass through the filter. In addition,
an IR LED was placed near the camera to provide the required light in order to record the
eye. An image of the eye tracker can be seen in Figure 4.

16
Figure 4: Eye tracker being worn
Once the video from the eye and from the world was collected, it was necessary to
determine what could have possibly been seen by the operator. This was accomplished by
correlating the two eye tracking videos using software. The software placed a green dot on
the “world” video to show where the user was looking at any given time. Once this was
complete it was then necessary to go through the video frame by frame to determine what the
total possible area the user could have seen on each part was.
The method of determining this relied on using the Useful Field Of View (UFOV).
The UFOV is the area where humans can see the most detail at in their vision due to the
greater concentrations of rods at that particular location. For the purpose of this study, a
useful field of view of 6 degrees was used. It was also assumed that the operators were to
inspect the parts at an average distance of 56cm from their eyes. This length was assumed
based on an average arm length of human males (Chaffin, et al., 2006). The area the
inspectors could see with the greatest precision was then calculated using the formula

17
. From this, it was possible to determine a useful field of view of
5.8cm. In order to control the viewing distance, the participants were instructed to inspect
the castings at arm length which was assumed to be 56cm. If they began to adopt another
observation strategy they would be reminded to observe the parts at arm length.
Using the calculated UFOV it was possible to place a circle around each point where
the operator was looking. This represented the possible area the inspector could have seen at
any given point in time. This allowed for the total percentage viewed. Also, it was possible to
determine the search path the operators took when examining the parts. Figure 5 shows an
example image of a part after the path has been determined as well as the percentage of the
part that could be viewed had been determined. The solid line is the path adopted while the
transparent overlay is the area that could be viewed.
Figure 5: Search pattern (solid line) and percentage of part viewed (wide red line)
18
CHAPTER 3 RESULTS
3.1 Signal Detection Results
Once the participants had inspected the castings, and the castings had been scored for
the percentage of correct hits, false alarms, and overall sensitivity (d’), it was necessary to
determine if there was any statistical significance for the results at the three independent
variable levels. In order to do these analyses multiple ANOVAs were performed. This was
possible as the data met the burden of normality and homogeneity of variance.
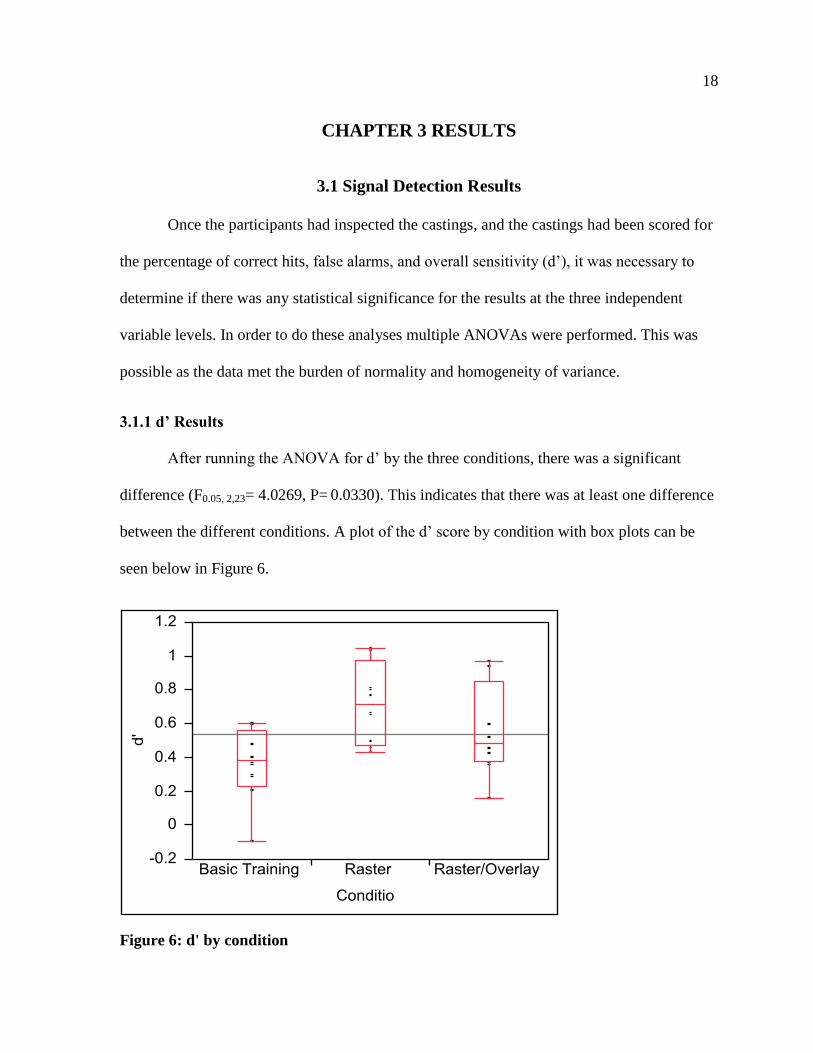
3.1.1 d’ Results
After running the ANOVA for d’ by the three conditions, there was a significant
difference (F0.05, 2,23= 4.0269, P= 0.0330). This indicates that there was at least one difference
between the different conditions. A plot of the d’ score by condition with box plots can be
seen below in Figure 6.
Figure 6: d' by condition

19
The mean d’ score for the basic training group is 0.354, the mean for the raster group
is 0.710 and the mean for the raster/overlay group is 0.550.
In order to determine which condition was significant from one another, Tukey-
Kramer HSD was conducted (Table 2).
Table 2: Tukey-Kramer result of d' by condition
Level Mean
Raster Training A 0.710
Overlay A B 0.550
Basic Training B 0.354
This showed that the raster training group is superior to the basic training group as
there is an “A” to “B” group differentiation. However, there is no difference between the
overlay group and either the raster training group of the basic training group.
3.1.1.1d’ by part type
In addition to looking at the d’ as an aggregate score it was necessary to determine if
any one part had a higher or lower d’ than the rest. This was to help determine if any type of
part was inherently more difficult to inspect than the rest. In order to test this, an ANOVA
was run it was found that the overall d’ for all of the parts showed no significance per part
type (F0.05, 4,115= 1.0120, P= 0.4043). A plot the d’ by part can be seen in Figure 7.

20
Figure 7:d' by part type
After the ANOVA determined there was no significance, it was necessary to see if the
condition influenced the results seen in d’ by part type. That is, whether the variability
introduced by having multiple participants, from each condition, represented in each part
type, influenced the results. In order to do this, a two way ANOVA was run with d’ by part
and condition. This can be seen in table 3.
Table 3: Two way ANOVA of d' by part and condition
Source Nparm DF Sum of Squares F Ratio Prob > F
Condition 2 2 40.859080 1.8247 0.1663
Part 4 4 46.147338 1.0304 0.3951
Part*Condition 8 8 94.614154 1.0563 0.3994

21
This showed that the use of different training conditions did not unduly influence the
results seen in d’ by part type, and confirms that there is no difference between part type with
regards to d’.
3.1.2 False Alarm Rate
An ANOVA was then run for the false alarm rate. Again, the data was normal and
homogeneous. It was found there was a significant difference between the conditions (F0.05,
2,23= 6.3792, P= 0.0068), indicating that there was at least one difference between the
different conditions. A plot of the false alarm rate by condition with box plots can be seen in
Figure 8.
Figure 8: False alarm rate condition
The mean hit rate for the basic training group is 0.408, the mean for the raster group
is 0.264, and the mean for the overlay training group is 0.277.

22
This was again then followed up by a Tukey-Kramer HSD post hoc test. The results
of this can be seen below in Table 4.
Table 4: Tukey-Kramer result of false alarm rate by condition
Level Mean
Basic Training A 0.408
Overlay B 0.277
Raster Training B 0.264
This shows that the basic training group was significantly different from both the
overlay and the raster training group. There were no other significant differences.
3.1.2.1 False alarm rate by part type
Again it was prudent to look at the false alarm rate as not only an aggregate score but
as individual parts to determine if one part had a higher or lower false alarm rate than the
rest. This was to help determine if any type of part was inherently more difficult to inspect
than the rest. In order to test this, an ANOVA was run it was found that the overall false
alarm for all of the parts showed that there was significance per part type (F0.05, 4,115=
12.4187, P<0.001). A plot the d’ by part can be seen in Figure 9.

23
Figure 9: False alarm rate by part
Because significance was found, it was necessary to run a Tukey-Kramer HSD post
hoc test. The results of this can be seen below in Table 5.
Table 5: Tukey Test of False alarm rate by part
Level Mean
1 A 0.45586532
3 A 0.43857991
4 A B 0.36225164
5 B 0.31595362
2 C 0.19260846
The results show that part one and three have significantly higher false alarm rates
than that of parts five and two. Additionally, parts four and five have significantly higher d’
values than that of part two.
24
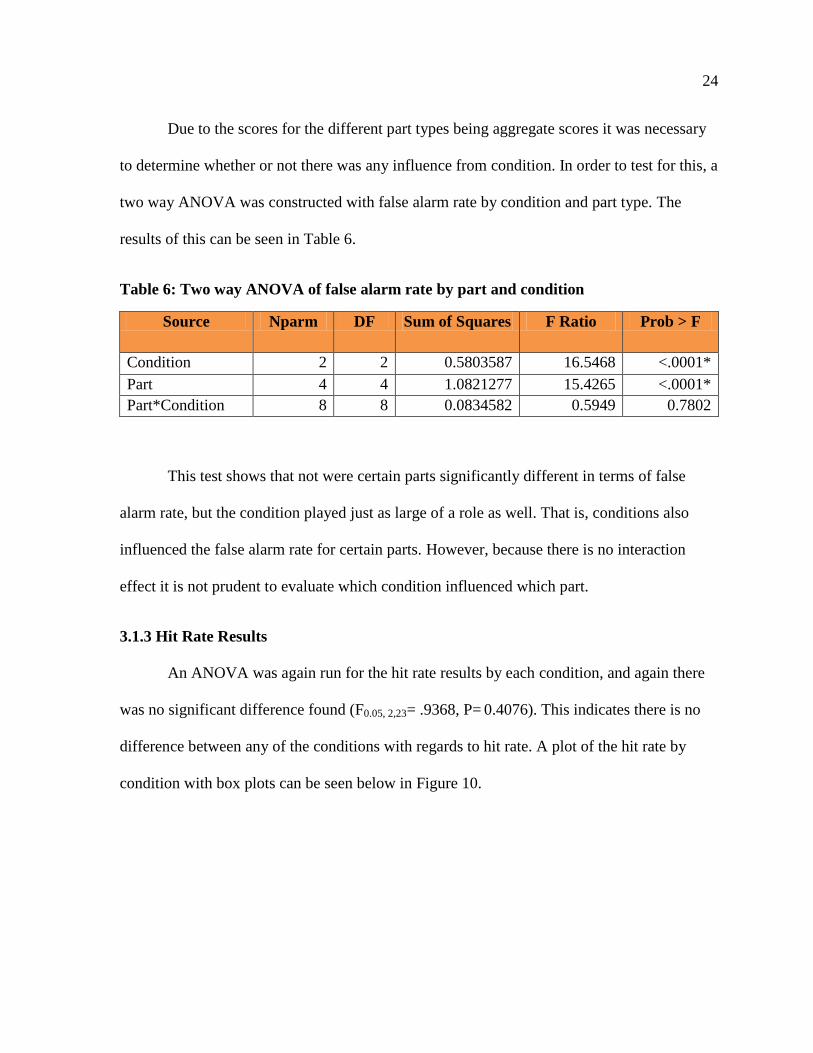
Due to the scores for the different part types being aggregate scores it was necessary
to determine whether or not there was any influence from condition. In order to test for this, a
two way ANOVA was constructed with false alarm rate by condition and part type. The
results of this can be seen in Table 6.
Table 6: Two way ANOVA of false alarm rate by part and condition
Source Nparm DF Sum of Squares F Ratio Prob > F
Condition 2 2 0.5803587 16.5468 <.0001*
Part 4 4 1.0821277 15.4265 <.0001*
Part*Condition 8 8 0.0834582 0.5949 0.7802
This test shows that not were certain parts significantly different in terms of false
alarm rate, but the condition played just as large of a role as well. That is, conditions also
influenced the false alarm rate for certain parts. However, because there is no interaction
effect it is not prudent to evaluate which condition influenced which part.
3.1.3 Hit Rate Results
An ANOVA was again run for the hit rate results by each condition, and again there
was no significant difference found (F0.05, 2,23= .9368, P= 0.4076). This indicates there is no
difference between any of the conditions with regards to hit rate. A plot of the hit rate by
condition with box plots can be seen below in Figure 10.

25
Figure 10: Hit rate by condition
The mean value for the basic training group is 0.546, the mean value for the raster
training group is 0.451, and the mean value for the overlay group is 0.479
3.1.2.1 Hit rate by part type
Again, it was prudent to look at the hit rate as not only an aggregate score but as
individual parts to determine if one part had a higher or lower hit rate than the rest. This was
to help determine if any type of part was inherently more difficult to inspect than the rest. In
order to test this, an ANOVA was run it was found that the overall false alarm for all of the
parts showed that there was significance per part type (F0.05, 4,115= 2.2924, P<0.0637). A plot
the d’ by part can be seen in Figure 11.

26
Figure 11: Hit rate by part
After the ANOVA was conducted it was necessary to determine whether or not condition
was affecting the hit rate by part. In order to do this, a two way ANOVA was conducted
evaluating hit rate by condition and part. The results of this ANOVA can be seen below in
Table 7.
Table 7: Two way ANOVA of false alarm rate by part and condition
Source Nparm DF Sum of Squares F Ratio Prob > F
Condition 2 2 0.13680674 3.8115 0.0252*
Part 4 4 0.16483576 2.2962 0.0640
Part*Condition 8 8 0.04610335 0.3211 0.9564
The results of the two way ANOVA show that the majority of the variation seen in
the results stem from the condition. The differences in the parts do not seem to play a major
role. Additionally, despite that fact condition is significant when neglecting part type, (as

27
seen in the two way ANOVA) due to the random variability associated with comparing the
aggregated data across parts there is no longer any significance associated with the overall hit
rate by condition (Figure 10).

28
3.2 MFFT Results
In addition to analyzing the signal detection data by condition, it was necessary to see
if there was any significant difference in the d’, hit rate, or false alarm rate by cognitive style.
The results for the d’ by cognitive style showed no significance when an ANOVA was
conducted (F0.05, 2,23=0 .1892, P= 0.8290). The graph for d’ by cognitive style can be seen in
Figure 12.
Figure 12: d' by cognitive style
The mean d’ values for FA, I and R groups are 0.609, 0.522, and .515 respectively.
Additionally, it was necessary to see if training influenced the results seen in the
cognitive style one way ANOVA. That is, whether the variability introduced by having
multiple participants, from each condition, represented in each cognitive style, influenced the
results. In order to do this, a two way ANOVA was run with d’ by condition and rating. It
was found that there was significance at the training condition but not the rating condition.

29
This confirms the results seen by running the one way ANOVA by rating. This shows that
the training condition did not unduly influence the results of the one way ANOVA. The
results of the two way ANOVA can be seen in Table 8.
Table 8: Two way ANOVA of training condition by rating
Source Nparm DF Sum of Squares F Ratio Prob > F
Training Condition 2 2 0.50979959 3.7665 0.0419*
Rating 2 2 0.03519121 0.2600 0.7738
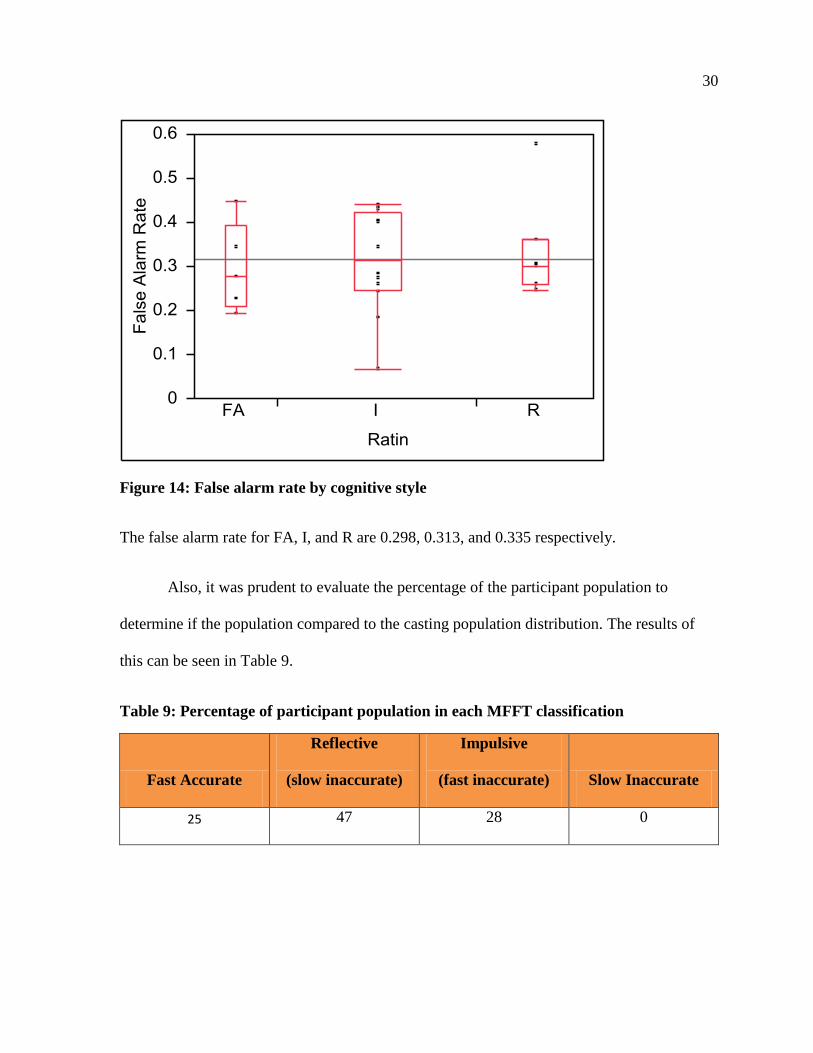
Hit Rate and false alarm rate show a similar trend. Both hit rate and false alarm show
no significance (F0.05, 2,23=0 .2419, P= 0.7873 and F0.05, 2,23=0 .1713, P= 0.8420 respectively).
The plot for hit rate can be seen in Figure 13, and the plot for the false alarm rate can be seen
in Figure 14.
Figure 13: Hit rate by cognitive style
The mean hit rate values for FA, I, and R is 0.524, 0.499, and 0.530 respectively.
30
Figure 14: False alarm rate by cognitive style
The false alarm rate for FA, I, and R are 0.298, 0.313, and 0.335 respectively.
Also, it was prudent to evaluate the percentage of the participant population to
determine if the population compared to the casting population distribution. The results of
this can be seen in Table 9.
Table 9: Percentage of participant population in each MFFT classification
Fast Accurate
Reflective
(slow inaccurate)
Impulsive
(fast inaccurate) Slow Inaccurate
25 47 28 0

31
3.3 Eye Tracking Results
When looking at the final eye tracker data, it can be seen that both raster groups had a
higher overall rate of rastering, or adopting the systematic strategy. This can be seen in
Figure 15. However, due to the fact that the eye tracker can be unreliable only four
participants per condition were acceptable to use in this analysis.
Figure 15: Percentage of the time rastering was adopted by condition
In order to test for significance an ANOVA was conducted. The data was found to be
normal and have homogeneity of variance. After conducting the ANOVA significance was
found (F0.05, 2,9=10.1381, P= 0.005). A Tukey-Kramer HSD post hoc test was conducted in
order to determine which groups were different from one another. This can be seen in Table
10.

32
Table 10: Tukey –Kramer result of search strategy by condition
Level Mean
Raster A 0.482
Raster/Overlay A 0.431
Basic B 0.106
The post hoc test shows that the raster training group and the raster/overlay group
were significantly better than the basic training group.
Additionally, it can be seen that the raster groups descriptively view a higher
percentage of the castings than that of the basic groups (Figure 16).
Figure 16: Percentage of casting viewed by condition

33
CHAPTER 4 DISCUSSION
Previous literature has shown that there is a significant improvement in performance
when the operator adopts a systematic search strategy (Nickles et al., 1998) and can have a
large improvement when trained to inspect in that particular pattern (Findley, 1997; Rayner,
1995; Theeuwes, et al., 1999; Widdel and Kastor, 1981). This is the same effect that was
found in this experiment. The raster training group was superior to the basic training group
with regards to overall signal detection (d’). Because of this, it is possible to confirm the
second hypothesis.
However, despite the fact the overlay group received raster training they were not
superior to the basic training group. Due to previous literature, it would be expected that the
overlay group would have the same level of performance (d’) as the raster training group, if
not increased performance (Nickles et al., 2003; Nalanagula et al., 2006; Wei, 2010). This
forces the rejection of the third hypothesis. The possible reason for this effect is the overlay
lines are proving to be distracting. That is they are very salient and are causing the
inspectors’ eyes to be drawn to those areas. This is a common effect with humans (Parkhurst
et al., 2002; Vincent et al., 2007; Mannan, et al., 1995, Mannan, et al.,1996; Parkhurst and
Niebur, 2003; Reynor, 2009).
The likely reason inspectors in previous literature responded well to a visual overlay,
is that they were presented in a different media. That is, they were inspecting on a computer
screen where the lines were static and would not move. In this experiment, the static overlay
lines would move (relative to the casting) when the inspector would flip over the casting. Or

34
if the inspectors were holding the casting in their hands during the inspection, the lines would
appear to fluctuate and move relative to the casting. This effect could prove to be distracting.
In addition to looking at the aggregate scores it was necessary to look at the scores for
each part. For d’ and hit rate there was no difference between the various parts. However, for
the false alarm there was a difference between the parts. Despite this difference there was no
discernible trend. The smallest part (one) had the highest incidence of false rate but the
second smallest (two) had the lowest. As such, there was no size trend. Additionally round
parts did not seem to have any effect as both parts one and two were round. Parts of square
shapes were in the middle. In addition, due to the condition also being a contributing factor it
is not possible to determine if this effect can be attributed to the condition or training
condition.
While it is still important to look at the components to the overall performance score
(d’), they are still only components. As such, they do not have much weight by themselves
unless a strong trend is detected. However, in this study, both the hit rate and false alarm rate
were not significantly difference between the different conditions. As such, they do not affect
the findings so far.
The results from the eye tracker supports what was observed with the signal detection
scores. The raster training group had the highest percentage of the part viewed and were able
to make the best decision about what an anomaly was, leading to the higher d’ values. The
raster/overlay group had the second highest d’ values; however, the distraction that the lines
provided likely caused their performance to drop. Finally, the basic training group had the
lowest training percentage of the part viewed. This again confirms the d’ values, the

35
participants would view only a certain percentage of the part before making a decision,
which would generally be a bad one. They would tend to satisfice and select an anomaly on
incomplete information.
Additionally, it was found that the two raster groups adopted a more rastering search
pattern as opposed to the basic training group whose search patterns were more random. As
shown in literature a systematic search strategy is beneficial when conducting visual
inspection tasks. The systematic search pattern would have likely equally helped with overall
performance (d’) with both rastering groups if not for the distracting effect of the overlay in
the raster/overlay group.
The MFFT data shows that there is no difference between any of the signal detection
performance measures and the cognitive style. This was expected as there were no slow
innacurates in this study. If there were, there most likely would have been an effect between
the FA and SA group (Wei, 2010). Additionally, there were also no trends in the data. It
appears all cognitive groups perform equally well. Further, because there were no slow
innacurates this study, this was not a true representation of the workforce that would
normally be seen in the casting industry. The participants were generally college students and
have self-selected a different path than the average foundry worker. As such, this paper
cannot definitively say whether or not the MFFT is appropriate for the casting industry.

36
CHAPTER 5 CONCLUSION
This study had three objectives; first was to determine if the performance of the
inspectors would correlate to their performance in the MFFT. The second was to determine if
a systematic search pattern would improve inspection as compared to the control group, and
the third was to determine if the use of an overlay would prove to be superior to either group.
This study failed to find any difference between performance of the inspectors and
their cognitive style. There still may be an effect, but due to the fact this population was not a
true representative sample of the metalcasting industry it was not found. However, this is not
a representative sample of the population as a whole. This group was superior to that of what
would be normally seen (Wei, 2010).
This study was able to determine whether or not the systematic search pattern was
effective. It was found that it was significantly better than using no search pattern at all. This
was found with the raster training group having significantly higher d’ that that of the basic
training group. This should help inform the industry on how to conduct visual searches on
castings.
Finally this study was trying to determine whether or not it was effective to use a
projected overlay to aid in the inspection of the parts. It was found that for the metalcasting
industry this overlay was distracting and was not as helpful as the previous literature had
found.

37
CHAPTER 6 FUTURE RESEARCH
Directions for future research would include the use of a larger more representative
sample for use for the MFFT and the inspection tasks. If the sample was more representative
it would have likely found a significant effect between the FA and the SA groups.
Additionally, it would be interesting to see if an augmented reality visual inspection device
would be effective. This device would be similar to a TSA screener’s device. The inspectors
would not directly view the castings but rather view them on a television screen while an
overlay would be projected on to the castings.
In addition, it would be interesting to determine if there is any part geometry that is
inherently more difficult to inspect than another. The use of more basic geometric shapes
may aid in this process compared to using shapes of complex geometry.

38
REFERENCES
Blatter, K., Graw, P., Munch, M., Knoblauch, V., Wirz-Justice, A., & Cajochen, C. (2006).
Gender and age differences in psychomotor vigilance performance under differential sleep
pressure conditions. Behavioral Brain Research, 168, 312– 317.
Cairns, E. and Cammock, T. (1978). Development of a more reliable version of the matching
familiar figures test. Developmental Psychology, 14(5), 555-560.
Carretero-Dios, H., De los Santos-Roig, M., and Buela-Casal, G. (2008). Influence of the
difficulty of the matching familiar figures test-20 on the assessment of reflection-impulsivity:
An item analysis. Learning and Individual Differences, 18, 505-508.
Carretero-Dios, H., De los Santos-Roig, M., and Buela-Casal, G. (2009). Role of the
matching familiar figures test-20 in the analysis of theoretical validity of the reflection-
impulsivity: A study with personality. International Journal of Psychological Research, 2(1),
6-15.
Chaffin, D. B., Andersson, G., & Martin, B. J. (2006). Occupational Biomechanics (4th ed.).
Hoboken, N.J.: Wiley-Interscience.
Chi, C.-F. and Drury, C. G. (1998). Do people choose an optimal response criterion in an
inspection task? IIE Transactions, 30, 257-266.
Czaja, S. J. and Drury, C. G. (1981). Training programs for inspection. Human Factors,
23(4), 473-484.
Darcilar, G. (2005). Measurement Error of Visual Casting Surface Inspection. Proceedings of
the 2005 Steel Founders’ Society of America – Technical and Operating Conference.
Chicago Il.
Drury, C. G. (1990). Visual search in industrial inspection. In D. Brogan (Ed.), Visual search
(pp. 263-276). London: Taylor & Francis.
Drury, C. G., and Gramopadhye, A. K. (1992). Training for visual inspection: Controlled
studies and field implications. Proceedings of the Seventh Federal Aviation Administration
Meeting on Human Factors Issues in Aircraft Maintenance and Inspection, Washington, DC:
Office of Aviation Medicine, 135-146.
Drury, C. G. (1994). The speed-accuracy trade-off in industry. Ergonomics, 37, 747-763.
Drury, C. G. and Chi, C.-F. (1995). A test of economic models of stopping policy in visual
search. IIE Transactions, 27, 382-393.
Findley, J. M. (1997). Saccade target selection during visual search. Vision Research, 37,
617–631.

39
Gallwey, T. J. (1982). Selection tests for visual inspection on a multiple fault type task.
Ergonomics, 25, 1077-1092.
Gallwey, T. J. and Drury, C. G. (1986). Task complexity in visual inspection. Human
Factors, 28(5), 595-606.
Gramopadhye, A. K., Drury, C. G., and Prabhu, P. V. (1997). Training strategies for visual
inspection. Human Factors and Ergonomics in Manufacturing, 7(3), 171-196.
Gramopadhye, A. K., Drury, C. G., and Sharit, J. (1997). Feedback strategies for visual
search in airframe structural inspection. International Journal of Industrial Ergonomics, 19,
333-344.
Hummel-Schluger, A. O. and Baer, J. S. (1996). A computer-controlled administration of the
matching familiar figures test. Behavior Research Methods, Instruments, and Computers,
28(1), 93-95.
Kagan, J., Rosman, B. L., Day, D., Albert, J., and Phillips, W. (1964). Information
processing in the child: Significance of analytic and reflective attitudes. Psychological
Monographs, 78, 1-37.
Kaufman, J., Gramopadhye, A. K., and Kimbler, D. (2000). Using training to improve
inspection quality. Quality Engineering, 12(4), 503-518.
Koenig, S., Gramopadhye, A. K., and Melloy, B. J. (2002). Use of job aid to promote
systematic search under different levels of task complexity. Human Factors and Ergonomics
in Manufacturing, 12(4), 349-363.
Ma, J., Drury, C. G., and Bisantz, A. M. (2002). Impact of feedback training in CBT in visual
inspection. In Proceedings of the Human Factors and Ergonomics Society 46th
Annual
Meeting, Santa Monica, CA, 2079-2083.
Mannan, S. K., Ruddock, K. H., & Wooding, D. S. (1995). Automatic control of saccadic eye
movements made in visual inspection of briefly presented 2-D images. Spatial Vision, 9,
363– 386.
Mannan, S. K., Ruddock, K. H., & Wooding, D. S. (1996). The relationship between the
locations of spatial features and those of fixation made during the visual examination of
briefly presented images. Spatial Vision, 10, 165–188.
McDonald, T. and Gramopadhye, A. K. (1998). The effect of pacing and explicit costs on
human decision making performance in inspection. In Proceedings of the Human Factors
and Ergonomics Society 42nd Annual Meeting, Santa Monica, CA, 2079-2083.
Nalanagula, D., Greenstein, J. S., Gramopadhye, A. K. (2006). Evaluation of the effect of
feedforward training displays of search strategy on visual search performance. International
Journal of Industrial Ergonomics, 36, 289-300.

40
Nickles, G. M., Sacrez, V., Gramopadhye, A. K. (1998). Can we train humans to be
systematic inspectors? In Proceedings of the Human Factors and Ergonomics Society 42nd
Annual Meeting, Santa Monica, CA, 1165-1169.
Nickles, G. M., Melloy, B. J., and Gramopadhye, A. K. (2003). A comparison of three levels
of training designed to promote systematic search behavior in visual inspection. International
Journal of Industrial Ergonomics, 32, 331-339.
Parkhurst, D., Law, K., & Niebur, E. (2002). Modeling the role of salience in the allocation
of overt visual attention. Vision Research, 42, 107–123.
Parkhurst, D., & Niebur, E. (2003). Scene context selected by active vision. Spatial Vision,
16, 125– 15
Rayner, K. (1978). Eye movements in reading and information processing. Psychological
Bulletin, 85, 618–660.
Rayner, K. (1985). The role of eye movements in learning to read and reading disability.
Remedial and Special Education, 6, 53–60.
Rayner, K. (1986). Eye movements and the perceptual span in beginning and skilled readers.
Journal of Experimental Child Psychology, 41, 211–236.
Rayner, K. (1995). Eye movements and cognitive processes in reading, visual search, and
scene perception. In J. M. Findlay , R. Walker , & R. W. Kentridge (Eds.), Eye movement
research: Mechanisms, processes and applications (pp. 3–22). Amsterdam: North Holland.
Rayner, K. (2009): Eye movements and attention in reading, scene perception, and visual
search, The Quarterly Journal of Experimental Psychology, 62:8, 1457-150.
Sadasivan, S., Greenstein, J. S., Gramopadhye, A. K., and Duchowski, A. T., (2005). Use of
eye movements as feedforward training for a synthetic aircraft inspection task, In
Proceedings of the ACM CHI 2005 Conference, Portland, OR, 141-149.
Salkind, N. J. and Nelson, C. F. (1980). A note on the developmental nature of reflection-
impulsivity. Developmental Psychology, 16, 237-238.
Schwabish, S. D. and Drury, C. G. (1984). The influence of the reflective-impulsive
cognitive style on visual inspection. Human Factors, 26(6), 641-647.
Stainislaw, H., and Todorov, N. (1999). Calulation of signal detection theory measures.
Behavior Research Methods, Insturments & Computers, 31(1), 137-149.
Stone, R. T. (2008). Augmented multisensory interface design: Performance enhancement
capabilities and training potential. PhD dissertation. Amherst, N.Y.: State University of New
York at Buffalo

41
Stone, R., Watts, K., Peters, F., (2010). Visual Inspection: Initial Findings through Cognitive
Ergonomics Proceedings of the 2010 Steel Founders’ Society of America – Technical and
Operating Conference. Chicago Il.
Tetteh, E., Jiang, X., Mountjoy, D., Seong, Y., McBride, M. (2008). Evaluation of a job-
aiding tool in inspection systems. Human Factors and Ergonomics in Manufacturing, 18(1),
30-48.
Theeuwes, J., Kramer, A. F., Hahn, S., Irwin, D. E., & Zelinsky, G. J. (1999). Influence of
attentional capture on oculomotor control. Journal of Experimental Psychology: Human
Perception and Performance, 25(6), 1595-1608.
Vincent, B. T., Troscianko, T., & Gilchrist, I. D. (2007). Investigating a space-variant
weighted salience account of visual selection. Vision Research, 47, 1809–1820.
Wei C.S., (2010). The impact of inspector’s cognitive style on performance in various visual
inspection display tasks. (Master'sthesis)
Widdel, H. and Kaster, J. (1981). Eye movement measurement in the assessment and training
of visual performance, Manned systems design: Methods, equipment, and applications;
Proceedings of the Conference, Freiburg im Breisgau, West Germany; United States; 22-25
September, 251-270.