the effect of urban heat islands and traffic wheel
TRANSCRIPT

Proceedings of The National Conference
On Undergraduate Research (NCUR) 2015
Eastern Washington University, Cheney, WA
April 16-18, 2015
The Effect of Urban Heat Islands and Traffic Wheel Pressure on the
Performance of Asphalt Pavements
Kaiqi Zhang
Department of Civil Engineering, Construction Management & Environmental Engineering
Northern Arizona University
Flagstaff, Arizona, 86011, USA
Faculty Advisor: Dr. Chun Hsing
Abstract
This paper propose two main software to establish a simulation model, and analysis of how solar radiation affects
asphalt pavement performance under the influence of traffic loading. The objectives of the project are to indicate how
solar radiation and traffic loading affect asphalt pavement. The step-by-step objectives are quantifying the effect of
urban heat islands on the performance of asphalt pavements, analyzing stresses of asphalt pavements imposed by
wheel pressure, and studying the properties of asphalt pavements affected by both urban heat islands and wheel
pressure. Daily solar radiation data was collected and calculated by Autodesk Project Vasari. The graph of Autodesk
Project Vasari showed the geometric solar radiation which a specific location received in the whole day. Solidworks
was used to determine how asphalt temperature causes fatigue under traffic loading. After field data collection and
observation, the relationship of asphalt performance and geometric location with traffic loading was approved.
Introduction/Problem Statement: Conventional asphalt pavements are impervious, which can reach peak summertime
surface temperatures of 120–150°F (48–67°C). These surfaces receive heat energy from solar radiations and transfer
heat downward to be stored within the pavement layers (pavement layer, subbase, and subgrade), where the heat stored
is remitted back to the air at night. These effects known as urban heat islands have been seen as part of factors that
have affected the performance of asphalt pavements. Although mechanical responses of traffic loading on pavement
properties have been widely researched, however, relevant work in the effect of urban heat islands on the asphalt’s
behavior have not yet well studied. In combination with wheel pressures, this project is being implemented to study
the relation between the properties of asphalt pavements and the combined wheel pressure/urban heat islands.
Research Objectives/Hypothesis/Key Questions: The objectives of the project are to (1) quantify the effect of urban
heat islands on the performance of asphalt pavements, and (2) analyze stresses of asphalt pavements imposed by wheel
pressure, and (3) study the properties of asphalt pavements affected by both urban heat islands and wheel pressure.
Specifically, the project will discuss (1) the impact of landscaping and vegetation of roadways on the increase of life
cycle of asphalt pavements, and (2) conditions that engineers can take into consideration for roadway design and
landscaping planning
Keywords: Solar Radiation, Wheel Pressure, Simulation
1. Introduction
Asphalt pavement on streets and parking lots occupy about 30% of the land in cities and can be characterized as
miniature heat islands.7 Conventional asphalt pavements are good solar absorbers and poor thermal conductors, which
can reach peak summertime surface temperatures of 120–150°F (48–67°C) 1. As a solid materials experiences an
increase in temperature, the volume of this material will increase, which is also called thermal expansion. Within an
asphalt pavement, each small solid spices are close to each other. Increasing of volume of all small spices would lead
to compaction inside the pavement, which is a major source of thermal stress. As pavement temperature rise,
volatilization of the asphalt binder and oxidation lead to a progressive hardening of the pavement, which result in
421
increased fatigue cracking and reduced durability.5 So that higher surface temperatures make the pavement more prone
to rutting.6 Surfaces receive heat energy from solar radiations and transfer heat downward to be stored within the
pavement layers (pavement layer, basement, and subgrade), where the heat stored is remitted back to the air at night.
These effects known as urban heat islands have been seen as part of factors that have affected the performance of
asphalt pavements.
Solar energy is composed of ultraviolet (UV) rays, visible light, and infrared energy, each reaching the Earth in
different percentages: 5 percent of solar energy is in the UV spectrum, including the type of rays responsible for
sunburn; 43 percent of solar energy is visible light, in colors ranging from violet to red; and the remaining 52 percent
of solar energy is infrared, felt as heat. Energy in all of these wavelengths contributes to urban heat island 1.
Although mechanical responses of traffic loading on pavement properties have been widely researched, relevant
work in the effect of urban heat islands on the asphalt’s behavior have not yet well studied. In combination with wheel
pressures, this project is implemented to study the relation between the properties of asphalt pavements and the
combined wheel pressure/urban heat islands. A series of numerical simulations and analyses were conducted to
quantify the effect of heat island effect on the performance of asphalt pavements. Using computer software is a symbol
of 21st century, so there are two software packages used in this study: Autodesk Project Vasari and Solidworks. In
this research, Autodesk Project Vasari was used to determine the distribution of solar radiation on the pavements of
Flagstaff downtown. In addition, Solidworks is employed to build 3D models of asphalt pavements according to its
real physical properties and perform heat transfer analyses and compute stresses imposed by traffic loading and
temperature changes.
1.1. Problem Statement and Hypothesis
Heat island effect has been well known for its significant impact on the sustainability of buildings and energy
absorption. However, only a handful of studies have been focused on the relationship between road
orientations/geometry and pavement performance. This study is to add the knowledge of how heat island effect
impacts the properties and performance of asphalt pavements.
The hypothesis of the study is the geometric location of roads along with wheel pressure can influence the
performance of asphalt pavements. Numerical analysis associated with field observations and temperature
measurements has been made in this research.
1.2. Literature Review A paper conducted by Ho and Romero 2 proposes three mathematical models using solar radiation theory, transient
heat transfer theory, and the finite element method to compute daily solar radiation, determine a thermal-penetration
depth as a boundary condition, and eventually estimate pavement temperatures. The paper provided some important
information to this research. First, the boundary condition equation from their paper was used into this research to
calculate the bottom temperature of one piece of pavement after knowing the surface temperature and depth of the
pavement. In addition, material properties were also cited from their paper.
Ferguson and Fisher 1 provides information of cool pavement technology and some basic idea of asphalt pavement
especially solar energy part. Cool pavement technologies tend to store less heat and may have lower surface
temperatures compared with conventional products. In the other words, cool pavement is a kind of technology which
try to lower the surface temperature of pavement, and lower the solar energy absorption. The basic idea of solar energy
and asphalt properties contribute to this research.
2. Software for Simulation
Two main software packages were used in this research.
Autodesk Project Vasari is an easy-to-use, expressive design tool for creating building concepts as well as providing
integrated analysis for energy and carbon dioxide estimation 3. This project provided a function called solar radiation
to gather solar radiation data from one specific location on the earth at a specific time. Accumulated solar radiation
could be calculated and showed on a graph automatically.
SOLIDWORKS is widely-used software in mechanical area. This is not only software to build a 3D model; the
simulation in this software is also used in stress & strain analysis and thermal analysis. SOLIDWORKS is a solid

422
modeler, and utilizes a parametric feature-based approach to create models and assemblies, and perform engineering
analyses.
3. Solar Radiation Analysis
3.1.Simulation Model Establishment In this analysis, a Vasari model was built in accordance with existing geometric locations and layouts of buildings
located in Flagstaff, Arizona (Figure 1). Getting a screen shot of the area where the research would happen from
google map, and input the map as the background. Like Autodesk Revit, a mass model could be built according to its
real layout. The height of buildings could be calculated by getting the height-shadow ratio.
Figure 1. Solar Radiation Modeling (Left: graphic model. Right: Flagstaff Downtown Imagery)
3.2.Simulation Result
Vasari graphs show the solar radiation incident on the pavement each two hour.
Figure 2. Sun Path and Solar Radiation Gathering at 8:00, 10:00, 12:00, 14:00, 16:00, 18:00. Sep 1st, 2014.
423
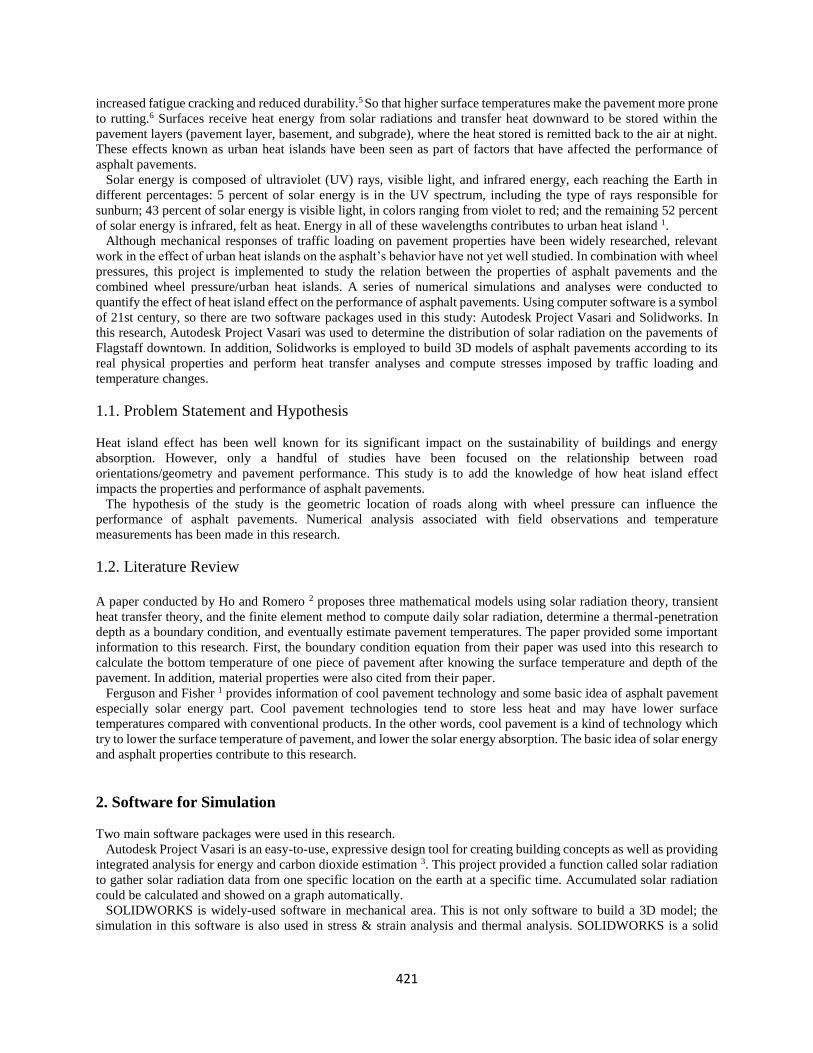
The reason of different solar radiation is shadow of buildings. The pavement, which is covered by shadow
received little solar radiation than the area under sun shine. The legend of different color was shown in the graph,
which measures the solar radiation received in BTU/ft2.
Autodesk Project Vasari has a function of sun path, which is same as Autodesk Revit. By turning on the sun path
and shadow functions, we received graphs including sun path and shadow to determine where the shadows were
located at the specific time. (Figure 2) There is also a simulation function called wind tunnel, which shows the wind
variation of a specific area.
Figure 3. Accumulate Solar Radiation on September 1st, 2014
There is also a graph, which shows accumulated solar radiation which the pavement received in the whole day.
(Figure 3) At the time we took pictures on the same location on the crossing, the thermal cracking showed on the
picture match the solar radiation simulation from Autodesk Project Vasari.
4. Field Data Collection
To further validate the numerical simulation in the lab, a field temperature measurement collected at N. Leroux St. to
Aspen Ave. in Flagstaff, AZ, was performed on 09/01/2014 from 8am to 6pm.
The pavement was divided into twenty parts per three feet, and the temperature of each three feet was collected per
hour using thermal gun. (Figure 4) Based on results, the highest surface temperature was measured at 1pm with
139.6 °F. The data was input in excel and labeled with different colors to determine the variation of temperature of
pavement surface. (Table 1) A 3D graph was built to show how temperature variation with time and location. (Graph
1) There was a directly drop down area, because of a vehicle parked, and the shadow made the surface temperature
lower than the others parts.

424
Graph 1. Temperature Change with Time and Location
Figure 4. Pavement cross section and real location on the pavement.
Different location on the pavement was shown on the AutoCAD drawing.
8:00
14:000
50
100
150
59' 54' 48' 42' 36' 30' 24' 18' 12' 6' 0'
Temperature Change with T ime and Locat ion
0-50 50-100 100-150
Cross sectional view of pavement for surface temperature measurement based on a 3-ft increment
425
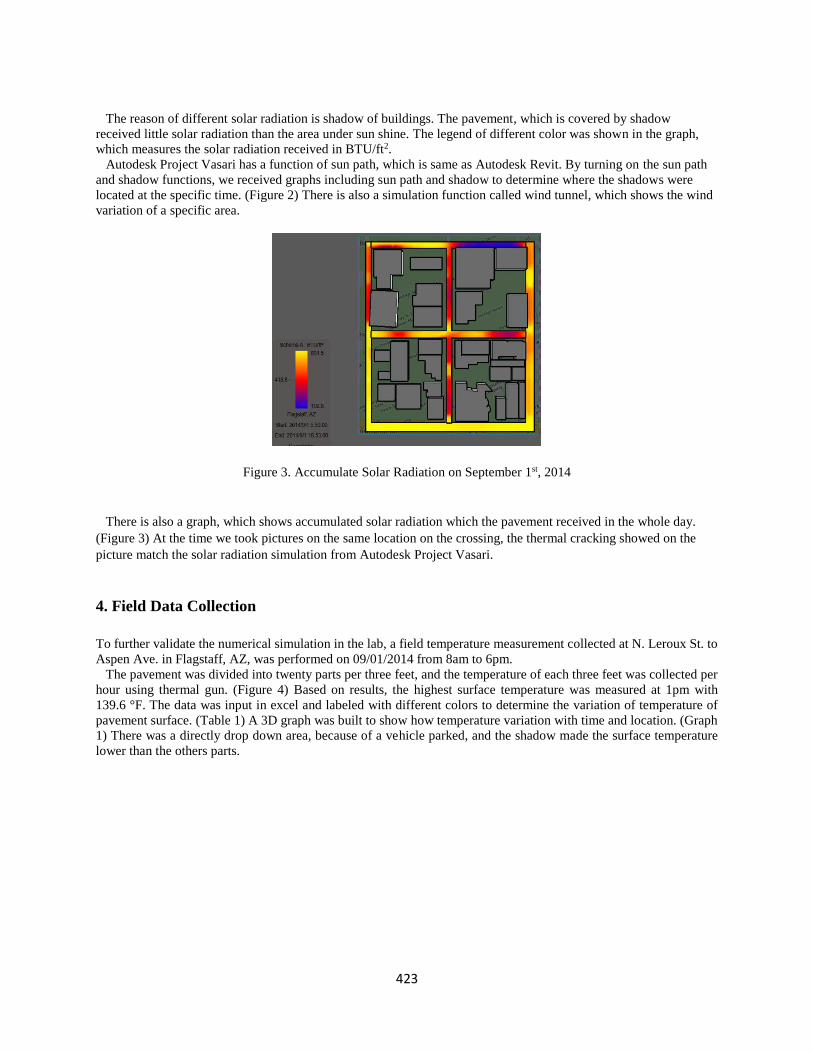
Table 1. Table of Surface Temperature on Pavement Vary with Time and Location
This table showed that the peak temperature was collected at center of the pavement at noon, because there wasn’t
any shadow at the center of pavement at that time. The solar radiation was also accumulated. In the afternoon, the
solar energy was hard to lose because the pavement already stored much energy inside to keep the pavement warm.
5. Solidworks Analysis
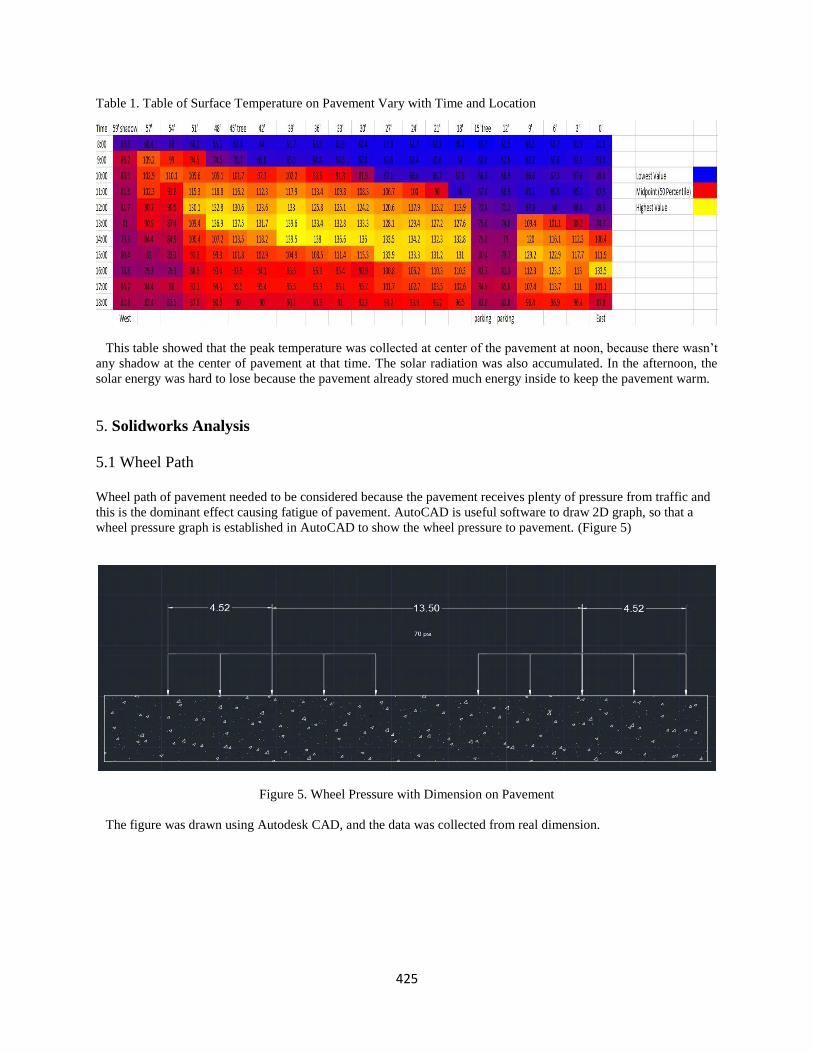
5.1 Wheel Path Wheel path of pavement needed to be considered because the pavement receives plenty of pressure from traffic and
this is the dominant effect causing fatigue of pavement. AutoCAD is useful software to draw 2D graph, so that a
wheel pressure graph is established in AutoCAD to show the wheel pressure to pavement. (Figure 5)
Figure 5. Wheel Pressure with Dimension on Pavement
The figure was drawn using Autodesk CAD, and the data was collected from real dimension.

426
5.2 Study Condition
One pair of data gathered from Field Data Collection was used in Solidworks analysis which made the stress analysis
realistic.
Temperature under Shadow: 80℉
Temperature under Sun: 130℉
Temperature at Bottom of Pavement: 95℉
Gravity: 9.8m/𝑠2
Wheel Pressure: 70psi
The equation we used to calculate the temperature of bottom of pavement is 2:
𝑇𝑃𝑎𝑣 × 0.859 + (0.002 − 0.0007 × 𝑇𝑎𝑖𝑟) × 𝐷 + 0.17 (1)
Tpav = pavement temperature at calculated depth (°C)
Tair = low air temperature (°C)
D = depth (mm)
5.3 Static Analysis When an overlay is placed on an existing pavement, physical tearing of the overlay often takes place as a result of
movement at the joints and cracks in the underlying pavement layer 4. Solidworks was used to show how traffic
loading and solar radiation leads to asphalt cracking.
A model of a single part of pavement was built and conditions which might affect the stress and strain of the material
was added to do some simulations. (Figure 6) The stress differences are shown in the legend, which vary with different
color. Conditions are added including gravity, pavement surface temperature (under shadow and under sun shine),
pavement bottom temperature (according to equation (1)), and wheel pressure. (Figure 7)
Figure 6. Solidworks Pavement Model with Wheel Path and Shadow Line

427
Figure 7. Solidworks Static Simulation (Stress) Result
As shown in Figure 7, the left boundary had a surface temperature of 130℉ and the right boundary of pavement had
a surface temperature as 80℉. Legend showed that red area had larger stress than the others color. The result indicated
that under same wheel pressure, asphalt pavement received larger stress under sunshine than under shadow. This
analysis combined thermal cracking (temperature) and fatigue (traffic loading), which are two major reasons caused
pavement cracking, to explain how these two factors affect asphalt pavement using straight-forward graph.
5.4 Thermal Analysis Heat transfer analysis and thermal stress calculation were performed in the lab to evaluate the temperature distribution
and thermal induced stress within the pavement. (Figure 8)
Figure 8. Thermal Analysis
6. Comparison with Field Observation
After comparing to the pavement performance in the different area of the specific research crossing, a significant
difference was shown. (Figure 9)
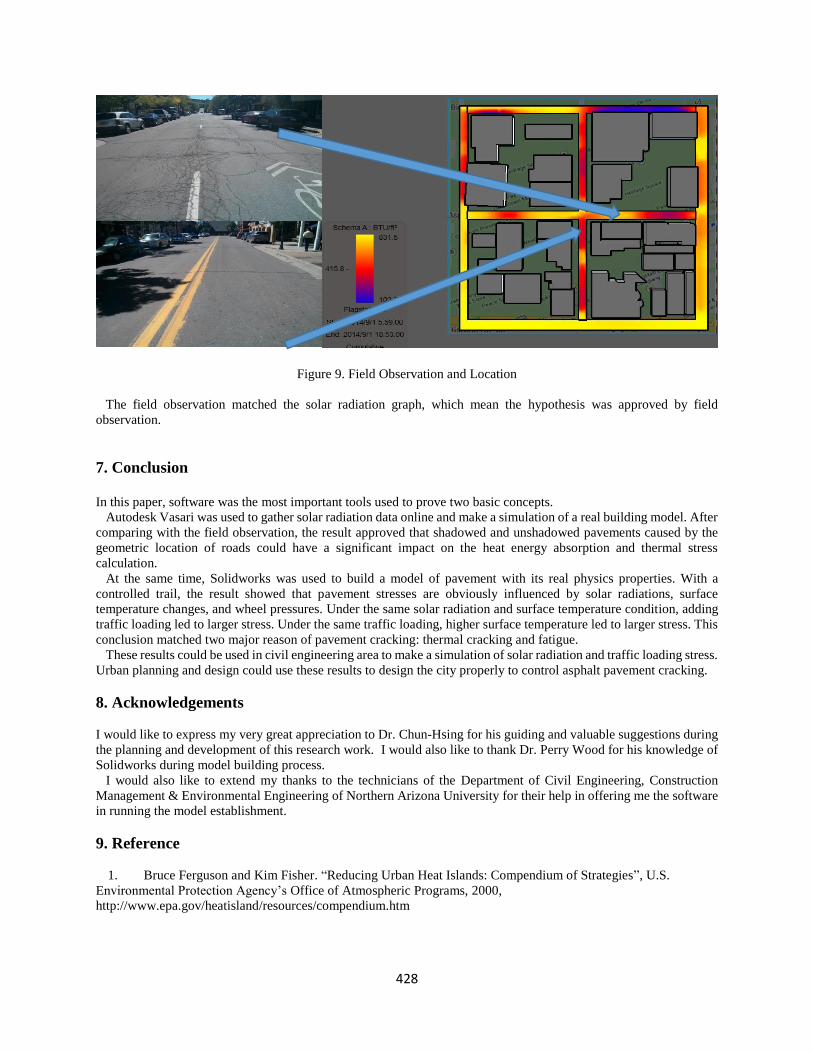
Left top picture was taken on the east part of the crossing, and left bottom picture was taken on the south part of the
crossing. This figure showed that the piece of pavement which received higher solar radiation had more cracking than
the piece of pavement which received lower solar radiation.
428
Figure 9. Field Observation and Location
The field observation matched the solar radiation graph, which mean the hypothesis was approved by field
observation.
7. Conclusion In this paper, software was the most important tools used to prove two basic concepts.
Autodesk Vasari was used to gather solar radiation data online and make a simulation of a real building model. After
comparing with the field observation, the result approved that shadowed and unshadowed pavements caused by the
geometric location of roads could have a significant impact on the heat energy absorption and thermal stress
calculation.
At the same time, Solidworks was used to build a model of pavement with its real physics properties. With a
controlled trail, the result showed that pavement stresses are obviously influenced by solar radiations, surface
temperature changes, and wheel pressures. Under the same solar radiation and surface temperature condition, adding
traffic loading led to larger stress. Under the same traffic loading, higher surface temperature led to larger stress. This
conclusion matched two major reason of pavement cracking: thermal cracking and fatigue.
These results could be used in civil engineering area to make a simulation of solar radiation and traffic loading stress.
Urban planning and design could use these results to design the city properly to control asphalt pavement cracking.
8. Acknowledgements
I would like to express my very great appreciation to Dr. Chun-Hsing for his guiding and valuable suggestions during
the planning and development of this research work. I would also like to thank Dr. Perry Wood for his knowledge of
Solidworks during model building process.
I would also like to extend my thanks to the technicians of the Department of Civil Engineering, Construction
Management & Environmental Engineering of Northern Arizona University for their help in offering me the software
in running the model establishment.
9. Reference
1. Bruce Ferguson and Kim Fisher. “Reducing Urban Heat Islands: Compendium of Strategies”, U.S.
Environmental Protection Agency’s Office of Atmospheric Programs, 2000,
http://www.epa.gov/heatisland/resources/compendium.htm

429
2. Chun-Hsing Ho and Pedro Romero. “Low Design Temperatures of Asphalt Pavements in Dry–Freeze
Regions Predicting by Means of Solar Radiation, Transient Heat Transfer, and Finite Element Method”, Bituminous
materials and mixtures ,Volume 2. 2009.
3. Autodesk Vasari. “Design better buildings” AutodeskVasari.com, http://autodeskvasari.com/
4. E.V. Dave. “Reflective and thermal cracking modeling of asphalt concrete overlays”, Taylor & Francis
Group, London, 2007. http://paulino.ce.gatech.edu/conferences/papers/07dave_reflectiveandthermal.pdf
5. Harvey, J., A Chong, and J. Roesler. “Climate Regions for Mechanistic-Empirical Pavement Design in
Callifornia and Expected on Performance”, Draft Report for California Department of Transportation. University of
California at Berkeley Pavement Research Center, 2000,
http://www.its.berkeley.edu/pavementresearch/Publications.htm
6. Pomerantz, M., H. Akbari and J.T. Harvey. “Durability and Visibility of Cooler Reflective Pavements.
University of California and Lawrence Berkeley National Laboratory. 2000
7. Scott, K.I., J.R. Simpson, and E.G. McPherson, “Effects of tree cover on parking lot microclimate and
vehicle emissions. 1999