the effect of temperature on the electrochemistry in ... effect of temperature on the...
TRANSCRIPT
The effect of temperature on the electrochemistry in Lithium-ion batteries
Feng Lenga,b , student member, IEEE, Cher Ming Tana,b,* ,Senior member, IEEE, Michael Pechtc, Fellow,
IEEE, JiYe Zhanga
a Nanyang Technological University, School of Electrical Electronics Engineering,
Blk S2.1, 50 Nanyang Avenue, Singapore 639798, Singapore b TUM CREATE PTE LTD,
1 Create Way, #10-02 Create Tower, Singapore 138602, Singapore c Center for Advanced Life Cycle Engineering (CACE), University of Maryland,
College Park, MD 20740, USA [email protected], [email protected], [email protected], [email protected]
*Corresponding author
Abstract
Temperature is known to have significant impacts on the performance, safety and cycle lifetime of Lithium-ion battery (LiB). However, the detail effect of temperature on LiB is not known. In this work, we present the temperature effect of each component in LiB using the electrochemistry based model developed recently. The findings allow us to have a better understanding of the effect of temperature and it also reveals phase transformation of the anode when LiB is operating beyond 45 oC.
Keywords: Electrochemistry based electrical model,
electrodes, electrolyte, Warburg element
1. Introduction
LiB is one of the key elements in global green energy initiative due to its high energy and power density, long lifetime, safe operation and reasonable cost [1]. For example, LiB enables the possibility of electric vehicles (EVs), hybrid electric vehicles (HEVs) and plug-in hybrid electric vehicles (PHEVs). Extensive research on LiB can be found recently [2].
However, operating ambient temperature of LiB must be well controlled as its performance, health and safety depends critically on the temperature. High temperature can lead to shortened lifetimes or catastrophic failure of the battery via thermal runaway that result in fire hazard and possible explosion in extremes cases [3].
While one can design a cooling system for the LiB system, a detail understanding of the temperature effect on each component inside LiB will be useful to improve its design and could extend its usability if its allowable operation temperature range can be extended. Unfortunately, such understanding is lacking.
With the recent development of electrochemistry based electrical model [4] where the performance of each components inside LiB can be determined through its discharging curve (i.e. terminal voltage vs time during discharging), we employ this model to examine how the performance of each component will be affected if LiB is operating at different temperature. The findings will help us to
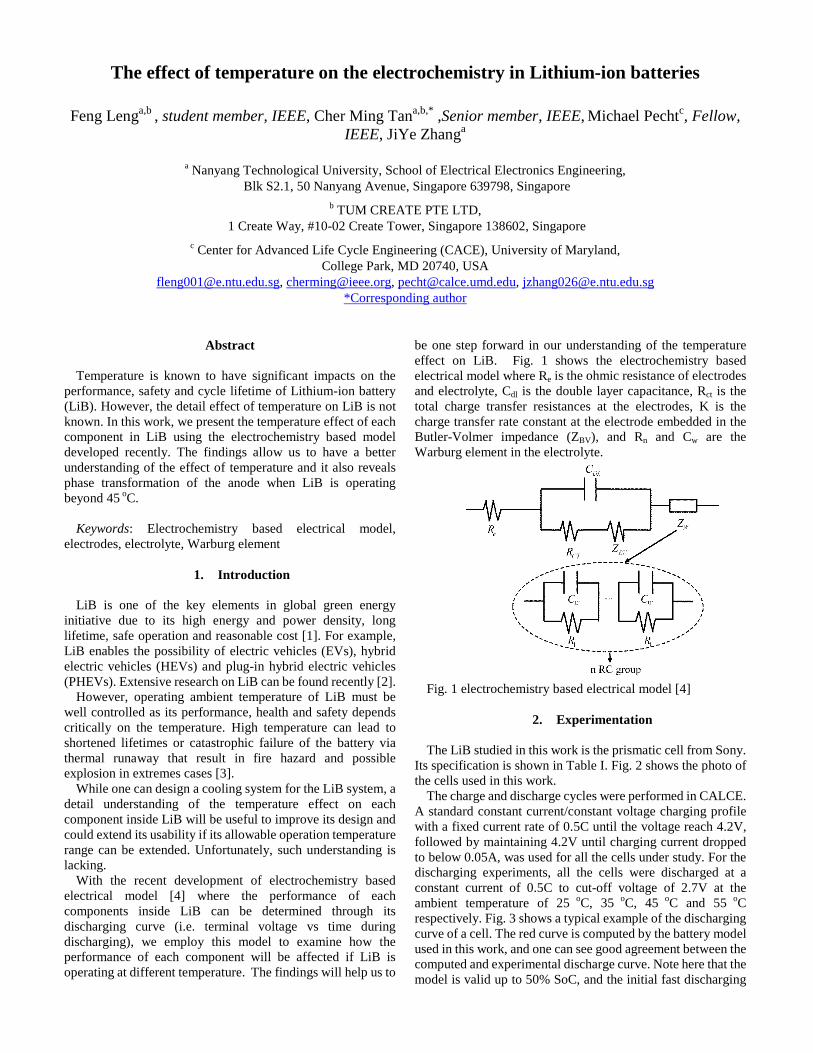
be one step forward in our understanding of the temperature effect on LiB. Fig. 1 shows the electrochemistry based electrical model where Re is the ohmic resistance of electrodes and electrolyte, Cdl is the double layer capacitance, Rct is the total charge transfer resistances at the electrodes, K is the charge transfer rate constant at the electrode embedded in the Butler-Volmer impedance (ZBV), and Rn and Cw are the Warburg element in the electrolyte.
Fig. 1 electrochemistry based electrical model [4]
2. Experimentation
The LiB studied in this work is the prismatic cell from Sony. Its specification is shown in Table I. Fig. 2 shows the photo of the cells used in this work.
The charge and discharge cycles were performed in CALCE. A standard constant current/constant voltage charging profile with a fixed current rate of 0.5C until the voltage reach 4.2V, followed by maintaining 4.2V until charging current dropped to below 0.05A, was used for all the cells under study. For the discharging experiments, all the cells were discharged at a constant current of 0.5C to cut-off voltage of 2.7V at the ambient temperature of 25 oC, 35 oC, 45 oC and 55 oC respectively. Fig. 3 shows a typical example of the discharging curve of a cell. The red curve is computed by the battery model used in this work, and one can see good agreement between the computed and experimental discharge curve. Note here that the model is valid up to 50% SoC, and the initial fast discharging
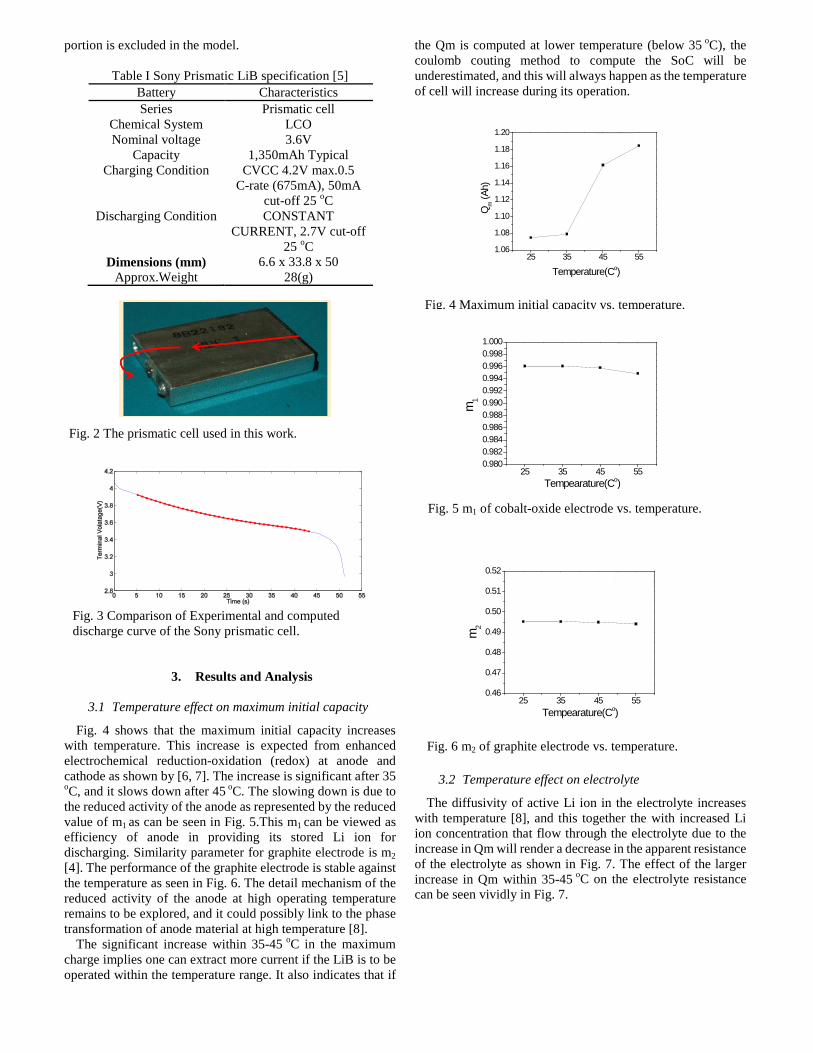
portion is excluded in the model.
Table I Sony Prismatic LiB specification [5] Battery Characteristics Series Prismatic cell
Chemical System LCO Nominal voltage 3.6V
Capacity 1,350mAh Typical Charging Condition CVCC 4.2V max.0.5
C-rate (675mA), 50mA cut-off 25 oC
Discharging Condition CONSTANT CURRENT, 2.7V cut-off
25 oC Dimensions (mm) 6.6 x 33.8 x 50
Approx.Weight 28(g)
3. Results and Analysis
3.1 Temperature effect on maximum initial capacity
Fig. 4 shows that the maximum initial capacity increases with temperature. This increase is expected from enhanced electrochemical reduction-oxidation (redox) at anode and cathode as shown by [6, 7]. The increase is significant after 35
oC, and it slows down after 45 oC. The slowing down is due to the reduced activity of the anode as represented by the reduced value of m1 as can be seen in Fig. 5.This m1 can be viewed as efficiency of anode in providing its stored Li ion for discharging. Similarity parameter for graphite electrode is m2 [4]. The performance of the graphite electrode is stable against the temperature as seen in Fig. 6. The detail mechanism of the reduced activity of the anode at high operating temperature remains to be explored, and it could possibly link to the phase transformation of anode material at high temperature [8].
The significant increase within 35-45 oC in the maximum charge implies one can extract more current if the LiB is to be operated within the temperature range. It also indicates that if
the Qm is computed at lower temperature (below 35 oC), the coulomb couting method to compute the SoC will be underestimated, and this will always happen as the temperature of cell will increase during its operation.
3.2 Temperature effect on electrolyte
The diffusivity of active Li ion in the electrolyte increases with temperature [8], and this together the with increased Li ion concentration that flow through the electrolyte due to the increase in Qm will render a decrease in the apparent resistance of the electrolyte as shown in Fig. 7. The effect of the larger increase in Qm within 35-45 oC on the electrolyte resistance can be seen vividly in Fig. 7.
Fig. 5 m1 of cobalt-oxide electrode vs. temperature.
25 35 45 550.9800.9820.9840.9860.9880.9900.9920.9940.9960.9981.000
m1
Tempearature(Co)
m1
Fig. 6 m2 of graphite electrode vs. temperature.
25 35 45 550.46
0.47
0.48
0.49
0.50
0.51
0.52
m2
Tempearature(Co)
m2
Fig. 4 Maximum initial capacity vs. temperature.
25 35 45 551.06
1.08
1.10
1.12
1.14
1.16
1.18
1.20
Temperature(Co)
Qm (A
h)
Qm
Fig. 2 The prismatic cell used in this work.
Fig. 3 Comparison of Experimental and computed discharge curve of the Sony prismatic cell.

The increase in Warburg element capacitance with temperature can be seen in Fig. 8, and it can be explained by the increasing number of ionic charge stored at the double layer near electrode due to the increase in Qm. One can again see the correlation between the larger increase in Qm within 35-45 oC and larger increase in the capacitance in the same temperature range.
Fig. 9 shows the plot of the Warburg RC time constant, and
one can see that increasing the temperature will increase the RC, and this implies that the response to the change in current deliver from LiB will become slower.
3.3 Temperature effect on electrode/electrolyte interface
Fig. 10 shows the decrease of the electrode cum electrode/electrolyte interface resistance with temperature.
The decrease is not due to the increase in the Qm as the decrease is not significant in the temperature range of 35-45 oC. In fact, this decrease is due to the change in the charge transfer rate constant at the electrode as can be seen in Fig.11 which shows the rate constant K vs. temperature. As increase in Qm should be decrease in this series resistance within the temperature range of 35-45 oC (Fig. 10) does not show a significant trend as in Fig. 4, one can see that the resistance shown in Fig. 9 is mainly contributed by the interface resistance [8, 9].
The increase in K with temperature shown in Fig. 11 is expected as higher temperature will enhance the charge transfer process [8, 9].
Fig. 12 Discharging curve of estimated EMF and terminal voltage
In examining Fig. 7 and 10, we can see that the toal series resistance of LiB is mainly due to the interface resistance. As
Vterminal
Fig. 7 Warburg element resistance vs. temperature.
25 35 45 550.0500.0550.0600.0650.0700.0750.0800.0850.0900.095
Temperature(Co)
R n (O
hm)
Rn
Fig. 8 Warburg element capacitance vs. temperature.
25 35 45 550.0140.0160.0180.0200.0220.0240.0260.0280.0300.032
C w(F)
Temperature(Co)
Cw
Fig. 10 The sum of ohmic resistance of electrode cum
electrolyte and charge transfer resistance.
25 35 45 55
8.8
9.0
9.2
9.4
9.6
9.8
Tempearature(Co)
R e+R ct
(Ohm
)
Re+Rct
Fig. 11 Rate constant vs. temperature.
25 35 45 550.2
0.4
0.6
0.8
1.0
1.2
1.4
Tempearature(Co)
k
(Ohm
)
k
Fig. 9 Warburg RC time constant vs. temperature.
25 35 45 550.00130
0.00135
0.00140
0.00145
0.00150
0.00155
0.00160
0.00165
0.00170
Tempearature(Co)
R n*Cw(
s)
Rn*Cw
η (Overpotential)
estimated EMF
the over-potential of the cell increase with time as shown in Fig. 12, and the total series resistance decreases with temperature, one can expect a significant increase in power dissipation within the LiB as given by V2/R where V is over-potential and R is the series resistance. As R decreases significantly if LiB is discharging beyond 90 oC as shown in [3], one can expect thermal runaway can happen beyond 45oC, and much smaller value of R is expected if LiB is operated beyond 90 oC, one can expected the accumulated heat and the temperature inside the LiB will be much higher, and thus thermal runaway can happen beyond 90 oC as indeed observed [3]. Detail investigation on the mechanism of the decrease in the electrode/electrolyte resistance beyond 55 oC can help us to determine the on-set of thermal runaway, providing a good measure of the state of safety for LiB.
4. Conclusion
Temperature is important factors critically affect the health and safe operation of LiB. In this study, we develop a new approach to online detect and characterize the temperature effect on electrochemistry in LiB nondestructively. The performance of each component inside LiB has been determined at different temperature. It is shown that the phase transition after 45 oC was identified as the main course of changes for each component in the investigated battery cells. Through this approach, we also can study the possible root causes of thermal runaway from the performance of each component. It is possible provide early warning of the battery thermal runaway and hence enhance the safe operation of the cells.
Acknowledgements
The authors would like to acknowledge the financial support from TUM CREATE program is a joint research programme between Technische Universität München (TUM) in Germany and Nanyang Technological University (NTU) in Singapore with funding by the National Research Foundation of Singapore.
The authors also would like to acknowledge the support from Prof. Michael Pecht from CALCE (Center for Advanced Life Cycle Engineering) at University of Maryland in sharing the test data.
References [1] Y. Ye, Y. Shi, N. Cai, J. Lee, and X. He,
"Electro-thermal modeling and experimental validation for lithium ion battery," Journal of Power Sources, vol. 199, pp. 227-238, 2/1/ 2012.
[2] A. N. Jansen, J. A. Clevenger, A. M. Baebler, and J. T. Vaughey, "Variable temperature performance of intermetallic lithium-ion battery anode materials," Journal of Alloys and Compounds, vol. 509, pp. 4457-4461, 3/31/ 2011.
[3] X. Feng, M. Fang, X. He, M. Ouyang, L. Lu, H. Wang, et al., "Thermal runaway features of
large format prismatic lithium ion battery using extended volume accelerating rate calorimetry," Journal of Power Sources, vol. 255, pp. 294-301, 6/1/ 2014.
[4] F. Leng, C. M. Tan, R. Yazami, and M. D. Le, "A practical framework of electrical based online state-of-charge estimation of lithium ion batteries," Journal of Power Sources, vol. 255, pp. 423-430, 6/1/ 2014.
[5] (2012). Sony Prismatic Cell. Available: http://www.calce.umd.edu/batteries/data/
[6] H. J. Bergveld, W. S. Kruijt, and P. H. L. Notten, Battery Management Systems: Design by Modelling: Springer, 2002.
[7] I. Buchmann, Batteries in a Portable World: A Handbook on Rechargeable Batteries for Non-engineers: Cades Electronics Incorporated, 2011.
[8] M. Park, X. Zhang, M. Chung, G. B. Less, and A. M. Sastry, "A review of conduction phenomena in Li-ion batteries," Journal of Power Sources, vol. 195, pp. 7904-7929, 12/15/ 2010.
[9] T. Abe, H. Fukuda, Y. Iriyama, and Z. Ogumi, "Solvated Li-Ion Transfer at Interface Between Graphite and Electrolyte," Journal of The Electrochemical Society, vol. 151, pp. A1120-A1123, August 1, 2004 2004.