the effect of tax system characteristics on cross-border
TRANSCRIPT

University of Arkansas, FayettevilleScholarWorks@UARK
Theses and Dissertations
8-2018
The Effect of Tax System Characteristics on Cross-Border Mergers and AcquisitionsJodi Michelle HenleyUniversity of Arkansas, Fayetteville
Follow this and additional works at: http://scholarworks.uark.edu/etd
Part of the Accounting Commons
This Dissertation is brought to you for free and open access by ScholarWorks@UARK. It has been accepted for inclusion in Theses and Dissertations byan authorized administrator of ScholarWorks@UARK. For more information, please contact [email protected], [email protected].
Recommended CitationHenley, Jodi Michelle, "The Effect of Tax System Characteristics on Cross-Border Mergers and Acquisitions" (2018). Theses andDissertations. 2834.http://scholarworks.uark.edu/etd/2834
The Effect of Tax System Characteristics on Cross-Border Mergers and Acquisitions
A dissertation submitted in partial fulfillment of the requirements for the degree of
Doctor of Philosophy in Business Administration
by
Jodi Henley Stephen F. Austin State University
Bachelor of Business Administration in Accounting, 2010 Stephen F. Austin State University
Master of Professional Accountancy, 2010
August 2018 University of Arkansas
This dissertation is approved for recommendation to the Graduate Council _________________________________ T.J. Atwood, PhD Dissertation Director _________________________________ _________________________________ Cory Cassell, PhD Jonathan Shipman, PhD Committee Member Committee Member

Abstract
Although determinants of cross-border merger and acquisitions (M&As) have been given
substantial attention in the literature, research examining the effect of tax system characteristics
on cross-border M&As is more limited. Cross-border M&As have substantial tax implications
for both the acquiring firm and the target firm. Because firms evaluate investments based on
expected after-tax returns, I expect that managers consider potential tax savings or costs in
making investment decisions across tax jurisdictions. In this study, I use hand-collected country-
year-level tax system characteristics to examine tax determinants of the volume and direction of
cross-border M&As. I find that tax system characteristics such as controlled foreign corporation
provisions, thin capitalization provisions, and the presence of a worldwide versus territorial
regime have a significant effect on cross-border M&A activity.

Acknowledgements
I would like to thank the members of my dissertation committee: TJ Atwood (chair),
Cory Cassell, and Jonathan Shipman, as well as Stuart Dearden, Emily Hunt, Josh Hunt and my
other PhD student colleagues for their advice, guidance, and friendship. I also appreciate the
invaluable encouragement and support of my family, Aubrey and Kim Henley, Rick and Megan
Henley, and Matt Henley.
Table of Contents
1. Introduction……………………………...........................................................................1
2. Background and Development of Expectations…………………………………………6
3. Research Methodology…………………………………………………………………14
4. Data Sources and Sample Construction……………………………………………..….25
5. Primary Results…………………………..……………………………………………..27
6. Supplemental Tests..…………………………………………………………………….34
7. Additional Analysis…………………………………………….……………………….37
8. Conclusion………………………………………………………..…………………..…41
9. References………………………………………………………….….………………...43
10. Appendix 1……………………………..………………………….……….……………45
11. Appendix 2……………………………..………………………….……….……………51

1
“Over the past four years…Valeant has managed to acquire a slew of U.S. companies worth
more than $30 billion. The Subcommittee reviewed key deal documents to understand how tax
advantages affected Valeant’s three largest acquisitions to date, including the 2013 sale of New
York-based eye care firm Bausch & Lomb and the 2015 sale of North Carolina-based drug
maker Salix. We learned that in those two transactions alone, Valeant determined it could shave
more than $3 billion off the target company’s [sic] tax bills by integrating them into the
Canadian-based corporate group. Those tax savings meant that Valeant’s investments in its
American targets would have higher returns and pay for themselves more quickly– two key
drivers, of course, of any acquisition.” - Senator Rob Portman,
Senate Subcommittee on Investigations Chairman
1. Introduction
Increasing globalization results in a growing number of cross-border mergers and
acquisitions (M&As). In 2017, JP Morgan’s 2018 Global M&A Outlook states that over 30% of
total M&A activities were cross-border. Unlike domestic M&As, cross-border M&As are
subject to additional frictions caused by national boundaries, such as differences in currencies,
language, culture, regulations, and macroeconomic factors. Prior research provides evidence that
many factors affect the volume and direction of cross-border M&As, including geographic
distance, economic development, exchange rate and stock market returns (Erel et al. 2012), as
well as accounting quality (Rossi and Volpin 2004). However, M&As, and particularly cross-
border M&As, may have far-reaching tax implications for both the acquirer and the target. In
fact, the decision to engage in a cross-border M&A may be primarily tax-motivated, as it can

2
facilitate tax avoidance strategies such as advantageously shifting income or expatriating to a
tax-preferred jurisdiction.
In the U.S., much of the rhetoric surrounding tax reform suggests that U.S. multinational
corporations may not be competitive in the global marketplace, including the market for foreign
investments, such as M&A targets. In July 2015, the U.S. Senate Subcommittee on
Investigations conducted a hearing entitled “The effect of the U.S. Tax Code on the Market for
Corporate Control and Jobs” in which senators interviewed CEOs and executives from
companies that were affected by corporate inversions or foreign takeovers. While an extensive
literature examines corporate inversions, they are relatively rare. Bloomberg’s Tax Inversion
Tracker lists fifty-eight total corporate inversions between 1982 and 2017, inclusive. Since
2004, the Treasury Department has issued four broad sets of regulations to curb the practice,
albeit with limited success. However, in curbing corporate inversion practices, some have
suggested that U.S. companies are now more vulnerable to foreign takeovers. Consistent with
this, the Senate Subcommittee found that the value of foreign takeovers of U.S. companies in
2014 totaled $275 billion, double the amount for 2013. A recent analysis by E&Y found that
between 2004 and 2014, foreign buyers acquired $179B more of U.S. companies than U.S.
companies acquired in foreign targets. Anecdotally, Salix Pharmaceuticals, a North-Carolina
based company, was in talks to complete an acquisition inversion in order to expatriate to Ireland
in 2014. However, the plans dissolved when the Treasury Department issued its second set of
inversion restrictions in 2014. The halt was lauded as a victory for the Treasury Department.
However, only a few months later, Salix Pharmaceuticals was acquired by Canadian Valeant
Pharmaceuticals. Once a U.S.-based company, Valeant had successfully completed a corporate
3
inversion in 2010 via a reverse-merger with Ontario-based Biovail, prior to the release of the
Treasury Department’s second set of inversion restrictions.
Despite the importance of tax considerations to cross-border M&A decisions, extant
research on tax effects in cross-border M&A decisions is largely limited to broad tax system
characteristics, such as statutory tax rates (Erel et al. 2012), double-taxation of dividends paid by
foreign subsidiaries (Huizinga and Voget 2009), and the U.K.’s and Japan’s switches from
worldwide to territorial regimes (Feld, Ruf, Scheuering, Schreiber and Voget 2013). However,
cross-border M&A activity presents opportunities for firms to engage in sophisticated tax
avoidance, possibly even allowing them to change their tax residence, effectively altering the
entire tax jurisdiction to which the post-M&A firm is subject. Changes to the corporate structure
caused by cross-border M&As can result in changes to the cost of operating the target, as well as
changes to the cost of repatriating income from foreign subsidiaries to the acquirer. For this
reason, firms are likely to consider multiple tax system characteristics, rather than differences in
corporate tax rates alone, in selecting and structuring cross-border M&As. To improve our
understanding of the impact that tax system characteristics have on cross-border M&A
transactions, I examine multiple tax system characteristics, including worldwide and territorial
regimes, Controlled Foreign Corporation (CFC) provisions, transfer pricing, thin capitalization
regulations, double-taxation relief provisions, and favorable tax treatment of income derived
from intellectual property (IP), in addition to differences in statutory tax rates on corporate
income and both statutory and treaty withholding rates on dividends paid from the target to the
acquirer.

4
I exploit variations in tax system characteristics across tax jurisdictions and over time to
examine the impact of these characteristics on cross-border M&As.1 I use the E&Y Worldwide
Corporate Tax Guides and the PwC Worldwide Tax Summaries for corporate taxes to hand-
collect tax system characteristics that I expect will influence after-tax returns to M&A
transactions.2 If rational managers evaluate investment opportunities using expected after-tax
returns, I expect that acquirers will evaluate potential target firms considering all possible tax
costs or synergies that may result from cross-border M&As. As a result, I expect that tax
“synergies” created by differences in tax system characteristics across the acquiring and target
firms’ countries will affect the flow of cross-border M&As between the two countries.
Using a sample of 55,670 cross-border M&As across 50 countries between 2006 and
2015, inclusive, I find evidence to suggest that a naïve tax variable, such as the difference in the
statutory corporate income tax rate, does not fully explain tax effects on M&A decisions. I find
that tax system characteristics strongly influence the direction of cross-border M&A, while
effects on the volume of M&A are more ambiguous. Specifically, I find that, when firms from
two countries with divergent tax treatments merge, the acquirer is more likely to have a higher
statutory tax rate, but less likely to be subject to a worldwide tax regime, CFC provisions, or thin
capitalization rules. In addition, I find evidence that firms structure the direction of M&A to
minimize dividend withholding taxes on the repatriation of profits from the target to the acquirer.
1 SDC M&A database does not contain sufficient information to determine whether the acquired firm will be operated as a subsidiary or as a foreign branch of the acquiring firm, and the tax treatment of the post-M&A firm often differs according to this designation. M&As more commonly result in subsidiary structures rather than branch structures (Huizinga and Voget 2009). Therefore, in defining a country’s tax system characteristics, I consider the treatment of foreign-source income when the taxpayer is a corporation, the legal structure is a foreign subsidiary (not a foreign branch), and the income is from the active conduct of a business. 2 I examine tax system characteristics relevant to the taxation of foreign-sourced income, profit-shifting, and avoidance of double-taxation, as well as withholding taxes payable upon transferring dividends across jurisdictions. I focus on these broad characteristics, rather than specific tax rules governing the determination of taxable income (i.e., depreciation rules or relief from losses), as they are likely to capture large changes to the tax treatment of a firm as a result of cross-border M&A.

5
I also document that the effects of tax system characteristics on cross-border M&As differ when
the acquirer is located in a worldwide tax regime than when the acquirer is located in a territorial
tax regime, consistent with tax system characteristics imposing different costs across tax
regimes. In additional analyses, I examine the use of an intermediary firm in a third country and
the proportion of cross-border M&As in which the acquirer gains control of the target firm (i.e.
more than 50 percent owned). I find evidence to suggest that cross-border M&A is more (less)
likely to involve a third, intermediary country when the acquirer (target) is located in a
worldwide regime and the target (acquirer) is located in a territorial regime. I find strong
evidence that the presence of CFC provisions in the acquirer country deters firms, not only in
acquiring a target, but in obtaining control of a target.
My study contributes to the body of research examining the determinants of cross-border
investment decisions. My study may also be of interest to legislators, as it contributes to our
understanding of the potential effects of the recent U.S. tax reform, commonly known as “The
Tax Cuts and Jobs Act.”3 Cross-border M&A activities both of and by U.S. companies,
including those that result in expatriation of U.S. firms (i.e., corporate inversions), were
frequently cited as evidence that the U.S. worldwide tax regime put U.S. multinational
corporations at a functional disadvantage relative to their foreign counterparts. Supporters of the
tax reform state that the current U.S. tax system hinders U.S. firms’ ability to compete against
similar firms based in lower-tax, territorial jurisdictions and cite U.S. corporate inversions and
foreign acquirers targeting U.S. firms as evidence that the U.S. tax burden makes U.S. companies
more valuable to foreign acquirers than to domestic acquirers. My study contributes to this
debate by empirically demonstrating that tax system characteristics have a significant impact on
3 While commonly referred to as “The Tax Cuts and Jobs Act,” the bill is entitled “To provide for reconciliation pursuant to titles II and V of the concurrent resolution on the budget for fiscal year 2018.”

6
a firm’s likelihood of investing abroad or likelihood of being acquired by a foreign firm. My
results suggest that CFC provisions and thin capitalization rules, both present in the U.S. tax
system before and after the reform, may be stronger drivers of the direction of cross-border
M&A than the presence of a worldwide tax system.
The remainder of this paper is organized as follows: section two provides background
and development of expectations, section three outlines the research methodology, section four
discusses data sources and sample composition, section five presents primary results, section six
presents supplemental tests, section seven presents additional analyses, and section eight
concludes.
2. Background and Development of Expectations
Determinants of Cross-Border M&As
Determinants of cross-border M&As have received meaningful attention in both the
accounting and finance literatures. Di Giovanni (2005) finds that domestic financial conditions,
such as the size of the stock market relative to GDP, increases the number of foreign acquisitions
made by firms within a country. Rossi and Volpin (2004) find that firms are more likely to be
targeted for M&As in countries with stronger investor protections and accounting quality,
though, as a proportion of total M&As, cross-border M&As are less common in these countries.
Within cross-border M&As, the authors find that acquirers are likely to be from countries with
stronger investor protections than those in the target country, suggesting that corporate
governance may be “imported” through the use of cross-border M&As. Erel et al. (2012)
examine several non-tax determinants of cross-border M&As, including country-level
governance, geographic distance, bilateral trade, currency exchange rate returns, and stock

7
market returns. They find that firms acquire more foreign subsidiaries in countries that are
geographically close and culturally similar, as well as in countries that are already trading
partners. They also find that acquirers strategically acquire targets in response to valuation
differences caused by differences in stock market and exchange rate returns, not as a result of
pure financial arbitrage, but because valuation differences make cross-border M&As
incrementally more desirable. Though Erel et al. (2012) focus on non-tax determinants of cross-
border M&As, they also consider the influence of statutory tax rates on cross-border M&As.
They find that firms are more likely to acquire targets in countries with a lower statutory
corporate income tax rate, which provides some evidence that managers strategically consider
tax costs in making cross-border M&A decisions.
In addition to the findings in Erel et al. (2012), other studies examine the effect of
statutory tax rates and broad tax reform on cross-border M&As. Feld et al. (2013) examine
foreign acquisitions by Japanese and British firms around the 2009 tax reforms which resulted in
each country moving from a worldwide to a territorial regime. They find that foreign
acquisitions by Japanese and British firms increased following the reform, which they interpret
as evidence that worldwide tax regimes reduce the competitiveness of firms in the international
market for corporate control. Huizinga and Voget (2009) examine 917 cross-border M&As
between firms in European countries, Japan, and the United States that occurred from 1985
through 2004. For countries in their sample, the double tax burden on foreign profits repatriated
to a parent firm is estimated as a function of the target country’s statutory corporate income tax
rate, the acquirer country’s statutory corporate income tax rate, the withholding tax rate on
dividends repatriated to the parent country, and the target and acquiring firms’ relative

8
profitability.4 The authors find that, as the rate of double tax liability increases, the likelihood
that a firm acquires a target decreases, consistent with firms adopting an organization structure
that minimizes their double tax liability.5 In an additional paper, the authors further examine
double taxation’s impact on merger pricing, and find that the increased tax burden is fully
capitalized into merger premiums, suggesting that the target firm’s shareholders bear the
increased tax burden (Huizinga, Voget, and Wager 2012).
As discussed above, extant research on tax determinants of cross-border M&As has
primarily examined the effect of statutory corporate income tax rates, despite evidence to suggest
that other tax system characteristics are important determinants of expected returns. However,
this narrow focus ignores several meaningful tax characteristics that are also likely to influence
foreign investment decisions, including cross-border M&As. Atwood, Huston, and Wallace
(2015) analytically model expected home country tax payable for multinational corporations
based on home country characteristics (including statutory tax rates, withholding on dividends,
CFC provisions, transfer pricing regulations, and foreign tax credits), and empirically test their
effect on after-tax expected returns. They find that these tax system characteristics influence
4 Specifically, Huizinga and Voget (2009) estimate the rate of double-taxation as a function of the statutory corporate tax rates of both the parent and subsidiary countries, the withholding rate on dividends paid from the subsidiary country to the parent country, and the parent country’s method of providing relief from double-taxation (exemption or foreign tax credit). For example, consider the case of a parent located in a worldwide system with an indirect Foreign Tax Credit with a nonbinding limit (i.e., tj < ti). Let ti (tj) denote the statutory corporate tax rate for the subsidiary (parent) country and wi,j denote the withholding tax rate on dividends paid from the subsidiary country to the parent country. For profits generated in the subsidiary country, the tax rate would equal ti. Following an acquisition by a firm in the parent country, profits generated by the subsidiary and repatriated to the parent would be taxed at ti+(1-ti)wi,j in the subsidiary country. The dividend received by the parent company would be grossed up to its pre-tax value and taxed at tj, less the allowed foreign tax credit in the amount of ti+(1-ti)wi,j, resulting in a final effective tax rate for the repatriate foreign profits of tj. The resulting rate of double taxation would be the difference in the two countries’ statutory corporate tax rates, tj- ti. For cases in which the parent is located in a territorial system, the rate of double-taxation is the rate of withholding on dividends, wi,j. The authors then apply this rate to the proportion of the combined firm’s worldwide pre-tax income that is made up of the income from the subsidiary firm, implicitly assuming that all income of the subsidiary is repatriated to the parent firm. 5 However, to the extent that relative profitability of the acquiring firm and target firm drive organizational structure, the authors’ results could be inappropriately attributed to tax effects using their measure.

9
multinational firms’ after-tax ROA, which suggests that further exploration of the effects of tax
system characteristics on cross-border M&As is warranted. I include statutory corporate income
tax rates as a potential determinant of cross-border M&As but I also examine other major tax
system characteristics that determine the tax treatment of foreign-sourced income, including
dividend withholding tax rates (determined under existing tax treaties, where relevant),
worldwide versus territorial regimes, transfer pricing and thin capitalization regulations, CFC
provisions, foreign tax credits and the presence of an IP box regime, allowed in both the target
and acquiring firms’ countries. I discuss each of these characteristics and their potential
implications for cross-border M&As below.
Differences in Statutory Tax Rates
Consistent with Erel et al. (2012), I consider the effect of the difference in the acquirer
and target countries’ statutory corporate income tax rates on cross-border M&As; however, I
expand this analysis by also looking at other factors contributing to the tax costs of repatriating
income from a foreign target to the acquirer. Using information on the location of terminal
subsidiaries of U.S. multinational firms, along with the use of foreign holding companies,
Dyreng, Lindsey, Markle, and Shackelford (2015) find evidence that U.S. multinationals
consider the costs of repatriating dividends, as measured by dividend withholding tax rates, in
selecting whether to use a foreign holding company, and, if so, where to locate it. I expect that
firms will consider withholding tax rates on dividends made between the acquirer and the target
as a cost of operating the foreign subsidiary. Therefore, I expect that, all else equal, acquirers
will invest in foreign subsidiaries located in countries which have low rates of withholding on
dividends.

10
Worldwide and Territorial Regimes
Tax systems are commonly separated into worldwide (credit) or territorial (exemption) systems.
In a pure worldwide system, the foreign-sourced income of a domestic firm is effectively taxed
at the higher of the domestic tax rate or the foreign tax rate, as foreign-sourced income, including
profits of foreign subsidiaries, are includable in domestic taxable income and foreign taxes paid
are generally allowed to be credited against domestic tax due on the same income. In this way, a
pure worldwide system exhibits capital export neutrality in that resident firms pay the same tax
rate for their domestic and foreign income. On the other hand, a pure territorial system exempts
all foreign-sourced income from domestic taxation. A pure territorial system exhibits capital
import neutrality, as it will result in firms paying the rate of tax in the jurisdiction in which the
income is sourced (Richman 1963; Musgrave 1969). In reality, tax jurisdictions are not pure
worldwide or pure territorial systems, and thus, exhibit neither capital export neutrality nor
import neutrality. Because an acquisition by a firm in a worldwide country subjects the target’s
income to a second level of taxation in the acquirer country, I expect that firms in territorial
regimes more frequently acquire foreign subsidiaries and are net acquirers in cross-border
M&As.
Controlled Foreign Corporation (CFC) Provisions
Another common tax system characteristic that may impact cross-border M&A decisions
are CFC provisions, which are used to prevent erosion of the domestic tax base. While CFC
provisions differ across tax regimes, the defining characteristic of CFC provisions is the
immediate inclusion of foreign-source income of a “controlled” foreign subsidiary’s income in
the parent’s domestic taxable income.6 In a territorial tax system, CFC provisions disallow the
6 CFC provisions, such as the definition of control and the types of income that are includable in domestic taxable income, vary across tax regimes.

11
exclusion of certain foreign-source income; in a worldwide system, CFC provisions disallow the
deferral privilege for that income. CFC provisions present an additional tax cost to acquirers, as
they cause a loss of deferral when the parent country has a worldwide regime and a loss of
exemption when the parent country has a territorial regime. As a result, acquirers in countries
without CFC provisions will generate a higher after-tax rate of return from the acquisition of
control of a foreign subsidiary. Consistent with this theory, Markle and Robinson (2012)
examine the effects of CFC provisions and worldwide versus territorial tax systems on the
demand for tax haven operations. They find that the presence and inclusiveness of CFC
provisions in the parent firm’s country reduce the likelihood that a firm operates a subsidiary in a
tax haven country. In a concurrent working paper, Hagen and Prettl (2017) document that, when
considering cross-border M&A that results in control of the target firm, the probability of being
an acquirer of a low-tax target is lower when the acquirer is subject to CFC provisions. Because
the presence of CFC provisions in the acquirer country likely increase the costs of operating a
foreign subsidiary, I expect that acquirers subject to CFC provisions will be less acquisitive, and
that, given the opportunity to structure M&As such that the resulting firm will not be subject to
CFC provisions, the acquirer is less likely to have CFC provisions than the target firm.
Transfer Pricing and Thin Capitalization Regulations
Transfer pricing and thin capitalization regulations are anti-tax avoidance rules aimed at
limiting profit shifting via transfer price manipulation and intra-company debt, respectively.
Firms may manipulate intra-company transfer prices or intra-company debt to move income
from high-tax to low-tax jurisdictions, reducing the firm’s overall tax burden. However, tax
authorities can limit this behavior with specific rules for the deductibility of intra-company
payments. Transfer pricing regulations require that the price of goods or services provided
12
between related parties must be determined at arms-length. Consistent with firms considering
profit-shifting opportunities in cross-border M&A decisions, Mescall and Klassen (2014) find
that merger premia are reduced as transfer pricing risk from the target firm increases.7 Because
parent firms can produce large tax savings by manipulating intra-company transactions with a
subsidiary (or subsidiaries), the absence of provisions that limit manipulation of intra-company
pricing or debt in either the parent or target firms’ country (the country with the highest tax
burden) will likely decrease the cost of operating a foreign subsidiary. Unlike transfer pricing
regulations, which may be difficult for tax authorities to enforce due to the difficulty in defining
arms-length values, thin capitalization rules are generally formulaic and, thus, are easier to
enforce.
Foreign Tax Credit
Next, I examine the allowance of foreign tax credits on non-exempt foreign-source
income. Generally speaking, relief from double-taxation of foreign income is provided through
one of two means: exemption or credit. These methods are roughly considered as equivalents to
territorial and worldwide regimes, respectively. However, tax systems rarely operate as a pure
exemption or credit system. As a result, even territorial tax systems may offer a foreign tax
credit for foreign taxes paid on non-exempt income. For example, the presence of a foreign tax
credit could alleviate double-taxation when dividends paid by a foreign subsidiary are not
eligible for a dividend participation exemption because the acquirer’s ownership in the
subsidiary is below the participation threshold or the subsidiary’s tax rate is below the threshold
7 Mescall and Klassen (2014) estimate the enforcement, severity, and clarity of transfer pricing rules across 33 countries using survey responses from partners and managers in the transfer pricing divisions of two Big Four accounting firms. In their specification, the authors consider only the transfer pricing risk of the target firm. In my setting, I consider the presence of transfer pricing regulations at either the target or acquirer level. As tax authorities are concerned with income being shifted away from their own jurisdiction, using transfer pricing rules at either the acquirer or target levels avoids making assumptions about the direction in which the post-merger firm would prefer to shift profits.

13
for exemption in the acquirer country. Because the foreign tax credit across all regimes applies
only to non-exempt foreign income, the absence of a foreign tax credit should still impose a cost
across both worldwide and territorial regimes. As a result, this variable should be incrementally
informative to the worldwide and territorial distinction discussed above. I expect that the
presence of a foreign tax credit in the parent country reduces the cost of operating a foreign
subsidiary. Therefore, I expect that acquirers in territorial countries that allow a foreign tax
credit will be more acquisitive than acquirers in territorial countries that do not allow foreign tax
credits.
Intellectual Property Box Regimes
Finally, I examine the effect of preferential tax treatment of income derived from
intellectual property, commonly referred to as an IP Box Regime. To incentivize innovation, tax
regulators have instituted rules to reduce the amount of income subject to tax or reduce the tax
rate on income derived from qualifying IP. Although not typically considered a primary
determinant of the tax treatment of foreign-sourced income, the ease with which IP can be
transferred to related parties in low-tax countries to facilitate tax-motivated profit-shifting could
influence cross-border M&A. Predictions on the effects of IP Box regimes are unclear ex-ante.
The presence of an IP Box regime in the home country reduces the tax benefits of shifting
income derived from qualifying IP to a foreign jurisdiction, which may dampen the cross-border
M&A market in favor of domestic M&A. This would result in reductions in the volume of
cross-border M&A. However, foreign acquirers in an IP Box regime may also be advantaged
over other potential bidders in cross-border M&A transactions, particularly if the target has high
levels of IP income that is currently not tax-preferred. I expect that this effect is limited,
however, as many IP Box regimes do not grant tax-advantaged treatment to income derived from

14
acquired IP unless the IP is substantially further developed in the post-acquisition period.
Similarly, for acquirers not located in IP Box regimes, firms in IP Box regimes may make
attractive targets, as the acquirer may shift IP income to the target in order to participate in the
tax-advantaged treatment.
3. Research Methodology
Determinants of the Volume of Cross-Border M&As
I examine the determinants of cross-border M&As using a regression adapted
from Erel et al. (2012). I define two dependent variables, CBMA_Volume and CBMA_Direction,
to separately capture the volume of cross-border M&As that occur between an ordered country
pair and the likelihood of being the acquirer country in cross-border M&A between a specific
country pair, respectively. These variables are composed similarly to the dependent variable in
Erel et al. (2012), which is calculated by taking the number of cross-border acquisitions of firms
in country i (the target country) by firms in country j (the acquirer country) for period t, and
scaling it by the sum of the total number of cross-border M&As between the target country and
the acquiring country and the total number of domestic mergers in the target country. However,
I deviate slightly from that composition in order to separately examine the volume and direction
components. CBMA_Volume is calculated as the number of cross-border acquisitions of firms in
country i (the target country) by firms in country j (the acquirer country) for period t, scaled by
the sum of the total number of domestic mergers in the target country and the acquirer country.8,9
8 For example, for the Canada-U.S. 2009 observation, this measure is calculated as the number of acquisitions of U.S. targets by Canadian acquirers in 2009, scaled by the sum of the number of domestic mergers in the U.S. and the number of domestic mergers in Canada in 2009. 9 The approach in Erel et al. (2012) would call for scaling this measure by only the number of domestic M&A in the target country. I choose to scale, instead, by the sum of the domestic M&A markets in both countries for two reasons. First, I seek to examine the decision of firms to acquire a foreign target rather than a domestic one. Therefore, the number of available domestic targets is relevant. Second, the measure used in Erel et al. (2012) is

15
This measure captures the volume of targets in country i acquired by firms in country j relative to
the size of the domestic M&A markets in both countries. CBMA_Direction is calculated as the
number of cross-border acquisitions of firms in country i (the target country) by firms in country
j (the acquirer country) for period t, scaled by the sum of the total number of cross-border M&As
between the target country and the acquiring country. Therefore, this measure captures the
proportion of total M&A between countries i and j in which country j is the acquirer. As a result,
this variable is bounded at 0 and 1 and is undefined in cases in which there is no M&A between a
country-pair during the year. In this section, I discuss tests used to determine the effect of tax
system characteristics on the volume of cross-border M&As from both the target and the acquirer
perspective; I discuss tests of the direction of cross-border M&As in the following section.
In order to examine determinants of the volume of cross-border M&A, I estimate the
following model using ordinary least squares regression, where all variables are as defined in
Appendix 1:
CBMA_Volume = α + β1Diff_Trate_CorpIncTaxi,j,t + β2Trate_Dividendsi,j,t + β3Aww_Tterri,j,t + β4Aterr_Twwi,j,t + β5Aonly_CFCi,j,t + β6Tonly_CFCi,j,t + β7Aonly_ThinCapitalizationi,j,t + β8Tonly_ThinCapitalizationi,j,t + β9Aonly_TransferPricingi,j,t + β10Tonly_TransferPricingi,j,t + β11Tonly_FTCi,j,t
+ β12Aonly_FTCxi,j,t + β13Tonly_IPBoxi,j,t + β14Aonly_IPBoxi,j,t + ∑βkCONTROLSi,j,t + ∑βkAcqFE + ∑βkYearFE + ε In this model, each observation is an ordered country pair, Xi,j (where country i denotes
the country of the target firm and country j denotes the country of the acquiring firm), such that
Canada-Japan and Japan-Canada would be two separate observations.
In order to examine the effects of tax rates on the volume of cross-border M&As, I first
calculate the difference between the acquiring country’s and the target country’s top statutory tax
highly right-skewed. While skewness in the dependent variable does not violate OLS assumptions, it does limit the usefulness and interpretation of the estimation results. In Appendix 2, I display the results of an OLS estimation of my model using the dependent variable prescribed in Erel et al. (2012).
(1)

16
rates on corporate income (Diff_Trate_CorpIncTax).10 Erel et al. (2012) find that the coefficient
on Diff_Trate_CorpIncTax is positive and significant, indicating that firms are more likely to
acquire targets in tax jurisdictions with lower corporate income tax rates, consistent with
acquirers using cross-border M&A in order to engage in income-shifting tax avoidance. I
expand this analysis by examining the effect of dividend withholding tax rates, as well as other
tax system characteristics likely to impact the tax cost of operating a foreign subsidiary.
Withholding tax on dividend payments between the subsidiary and the parent firm
represent a cost to repatriating the profits of the target. As such, I expect that acquirers are likely
to acquire targets in countries with a lower rate of withholding on dividends. I construct
Trate_Dividends as the rate of dividends withholding on dividends paid from the target country
to the acquirer country. Because dividend withholding rates are often reduced under the terms of
bilateral tax treaties, for country pair year observations with bilateral tax treaties, I replace the
general dividend withholding rate with the rate specified under the applicable treaty. Because
withholding taxes on repatriation of dividends is an additional cost of operating a foreign
subsidiary, I expect that firms engage in more cross-border M&A when the rate of withholding
on dividend repatriation is lower. Therefore, I predict a negative coefficient on Trate_dividends.
I also create twelve variables to examine the effects of tax system characteristics that
affect the tax base of a multinational firm created by a cross-border M&A. In this regression, I
am interested in exploring how differences in the tax regimes of the target and the acquirer firms
may affect the volume of cross-border M&A between the pair. First, I examine the effect of
10 I use the difference in the top statutory tax rates following prior literature (Huizinga and Voget 2009; Erel et al. 2012; Feld et al. 2013; Atwood et al. 2015; Col and Errunza 2015) rather than the effective tax rate. I believe this specification to be most appropriate for several reasons. First, firms should base investment decisions on the rate of tax they will pay on their next dollar of income (the marginal tax rate), which is approximated more closely by the statutory rate than the effective tax rate. Second, the effective tax rate is confounded by the tax system characteristics that I examine separately in the model. Finally, a country-level effective tax rate includes the effects of previous foreign investment decisions, including cross-border M&A decisions.

17
differences in the tax regime of the firms. Specifically, whether the tax regime of the post-M&A
multinational parent firm will be in a worldwide or territorial regime. To do so, I include two
indicator variables. The first one, Aww_Tterr, is an indicator variable set equal to one if the
acquiring firm is located in a country with a worldwide tax system and the target is located in a
country with a territorial tax system, and zero otherwise.11 This variable captures M&As that
result in a firm that was taxed under a territorial regime becoming taxed under a worldwide
regime as a result of the transaction. The second variable, Aterr_Tww, is an indicator variable
set equal to one if the acquiring firm is located in a country with a territorial tax system and the
target is located in a country with a worldwide tax system, and zero otherwise. This variable
captures M&As that result in a firm that was taxed under a worldwide regime becoming taxed
under a territorial regime. A common criticism of the U.S. worldwide tax system is that it makes
U.S. acquirers non-competitive in global markets, one of which is the market for subsidiaries. If
this is true, I expect that firms in worldwide countries are less acquisitive, resulting in lower
levels of cross-border M&A, particularly across targets in territorial regimes. Therefore, I expect
the coefficient on Aww_Tterr to be negative and the coefficient on Aterr_Tww to be positive,
indicating lower (higher) volume of cross-border M&A between worldwide (territorial) acquirers
and territorial (worldwide) targets.
I construct similar indicator variables for the remaining five tax system characteristics.
Aonly_CFC (Tonly_CFC) is an indicator variable set to one if only the acquirer (target) country
11 In my setting, a country is designated as territorial if, for subsidiaries that are at least 25% owned, it allows at least a 95% participation exemption for foreign dividends paid out of active income. For some countries, the dividend participation exemption only applies when the subsidiary is located in specific countries, such as a tax treaty partner, a country within the European Union or European Economic Area, or countries not blacklisted as tax havens. As a result, I allow a country’s designation as worldwide or territorial to differ across country pairs. My results are qualitatively and quantitatively similar when I designate a country as territorial without regard to specific country pairs. In this case, a country is designated as territorial if it allows at least a 95% participation exemption for foreign dividends paid by a subsidiary that is at least 25% owned when the subsidiary is located in a treaty country or a country that is not blacklisted as a tax haven.

18
has CFC provisions, and zero otherwise. Because the presence of CFC provisions in the acquirer
country may make the profits of the foreign subsidiary taxable in the acquirer country, I expect
that acquirers subject to CFC provisions are disadvantaged in cross-border M&A transactions.
Thus, I expect the coefficient on Aonly_CFC to be negative, reflecting a reduction in the volume
of cross-border M&A when the acquirer country is located in a CFC regime and the target is not.
Both thin capitalization rules and transfer pricing regulations limit the extent to which
firms can shift profits to tax-preferred jurisdictions. Because these regulations limit firms’ tax
avoidance strategies through profit-shifting channels, I expect that the presence of these
regulations will reduce the volume of cross-border M&A. However, it is unclear whether the
effect will be from the presence of regulation at the acquirer level or target level, as the direction
in which the post-merger firm will wish to shift income is unclear, and tax regulators are
concerned with income being shifted away from their own jurisdiction. If post-merger firms, on
average, prefer to shift income to the target (which is consistent with acquirer firms, on average,
having a higher corporate income tax rate), I expect the coefficients on Aonly_ThinCapitalization
(Tonly_ThinCapitalization) and Aonly_TransferPricing (Tonly_TransferPricing) to be negative
(positive).
Next, Aonly_FTC (Tonly_FTC) are indicator variables set to one if only the acquirer
(target) country allows for a foreign tax credit to provide relief from double-taxation of foreign
income, and zero otherwise. For non-exempt foreign income, double taxation relief is generally
provided by a tax credit or a tax deduction. Because a foreign tax credit should reduce or
eliminate the double-taxation of non-exempt foreign profits, I expect that firms allowed a foreign
tax credit will engage in higher levels of cross-border M&A, as they will be able to operate

19
foreign subsidiaries at a lower cost. Therefore, I expect the coefficient on Aonly_FTC to be
positive and the coefficient on Tonly_FTC to be negative.
Finally, Aonly_IPBox (Tonly_IPBox) is an indicator variable set equal to one if only the
acquirer (target) country is an IP Box regime. However, it is difficult to make predictions
regarding the effect of IP box regimes on the volume of cross-border M&A. Because intellectual
property is among the assets easiest to transfer to tax-preferred jurisdictions, firms in countries
without preferable tax treatment of intellectual property income may engage in more cross-
border M&A to facilitate shifting intellectual property to another tax jurisdiction, particularly
jurisdictions that do provide tax-preferred treatment of income from IP. This would result in
reductions in the volume of cross-border M&A. In this case, I predict a negative coefficient on
Aonly_IPBox. For acquirers not in IP Box regimes, the acquisition of a target in an IP Box
regime may allow the acquirer to shift qualifying IP income to the target, which suggests a
positive coefficient on Tonly_IPBox. However, if the presence of an IP Box regime in their
country provides an advantage to foreign acquirers, particularly in acquisitions of targets with
high levels of IP income that is currently not tax-preferred, I predict a positive coefficient on
Aonly_IPBox. Because many IP Box regimes do not grant tax-advantaged treatment to income
derived from acquired IP unless the IP is substantially further developed in the post-acquisition
period, this effect may be limited.
I also control for other determinants of cross-border M&As using variables from Erel et
al. (2012). I control for valuation differences by including diff_xrate equal to the difference
between the real annual currency exchange rate return between the two countries’ currencies and
diff_realri the difference in the real annual stock market return of the country indices. I control
for disclosure quality using diff_disclosureindex, the difference between the two countries’

20
ratings on the “extent to which investors are protected through disclosure of… financial
information” from the WorldBank Doing Business survey. I also control for the legal protection
of minority shareholders using the difference between both country’s value for the anti-self-
dealing index from Djankov, La Porta, Lopez-de-Silanes, and Shleifer (2008)
(diff_anti_selfdeal). To control for language (cultural) barriers, I include an indicator variable
equal to one if the two countries have the same primary language (religion), and zero otherwise.
To control for geographic proximity, I include the great circle distance between the capital cities
of the acquirer and target countries, scaled by 1,000 for ease of interpretation, (gcdist).12 I also
control for the volume of business between the two countries using max_trade, the maximum
bilateral imports or exports, where imports (exports) are measured as the total proportion of the
target country’s imports (exports) from (to) the acquirer country. Finally, I control for
macroeconomic effects by including diff_gdp, the difference between the natural log of the
countries’ GDP per capita in 2010 U.S. dollars, and diff_gdpgrowth, the difference in the real
annual growth rate in GDP per capita. Following Erel et al. (2012), I include acquirer country
fixed effects because I am primarily interested in examining the effects of differences in tax
characteristics between the acquirer and target countries on cross-border M&As between a
country-pair.13 I also include year fixed effects to control for trends in cross-border M&A over
time.
12 Great circle distance is the shortest distance between two points on the surface of a sphere, and is calculated as 3963.0*arcos[sin(lat1)*sin(lat2) + cos(lat1)*cos(lon2-lon1)], where lon1 (lon2) and lat1 (lat2) are the longitudes and latitudes of the capital city of the acquirer (target) country, respectively. 13 In untabulated analysis, I replicate my primary findings without the inclusion of acquirer country fixed effects, and the results are qualitatively similar for the effect of tax system characteristics on the direction of cross-border M&A. For the volume of cross-border M&A, I confirm the results in Table 3, but I also find evidence that the volume of cross-border M&A is diminished among worldwide acquirers and territorial targets and in cases in which only the target country allows foreign tax credits, consistent with expectation. I further find that the volume of cross-border M&A is decreased (increased) when only the target country has thin capitalization requirements (only the acquirer country is an IP Box regime). Predictions for these characteristics were less clear, but my results are consistent with firms preferring to shift income to the target through the use of intercompany debt and IP Box
21
Determinants of the Direction of Cross-Border M&As
I next examine the effect of these characteristics on the direction of cross-border M&A,
that is, given the opportunity for a M&A transaction between a firm in country i and a firm in
country j, I examine which country is likely to house the acquiring firm. In these tests, I use the
dependent variable CBMA_Direction, which I construct by taking the number of cross-border
acquisitions of firms in country i (the target country) by firms in country j (the acquirer country)
for period t, and scaling it by the sum of the total number of cross-border M&As between the
target country and the acquiring country. Therefore, this measure captures the proportion of total
M&A between countries i and j in which country j is the acquirer. As a result, this variable is
bounded at zero and one and is undefined in cases in which there is no M&A between a country-
pair during the year. I examine how tax system characteristics influence the structure of cross-
border M&A between firms in countries with divergent tax policies with the following model
using ordinary least squares regression, where all variables are as defined in Appendix 1:
CBMA_Direction = α + β1Diff_Trate_CorpIncTaxi,j,t + β2Diff_Trate_Dividendsi,j,t + β3Aww_Tterri,j,t + β4Aterr_Twwi,j,t + β5Aonly_CFCi,j,t + β6Tonly_CFCi,j,t + β7Aonly_ThinCapitalizationi,j,t + β8Tonly_ThinCapitalizationi,j,t + β9Aonly_TransferPricingi,j,t + β10Tonly_TransferPricingi,j,t + β11Tonly_FTCi,j,t + β12Aonly_FTCxi,j,t + β13Tonly_IPBoxi,j,t + β14Aonly_IPBoxi,j,t + ∑βkCONTROLSi,j,t + ∑βkAcqFE + ∑βkYearFE + ε
Instead of examining the level of dividend withholding tax, as I did in Model (1), in this
test, I replace Trate_Dividends with Diff_Trate_Dividends, which I calculate as the difference
between the rate of withholding that would be paid on dividends repatriated from the target
country to the acquirer country and the rate of withholding on the counterfactual corporate
structure in which the dividends are repatriated from the acquirer country to the target country. I
regimes giving acquirers an advantage in cross-border M&A, specifically when the target country does not allow for preferential treatment of income from IP.
(2)

22
do this because these tests examine the effect of taxes on the decision to structure the M&A, not
whether to engage in M&A. The decision regarding which firm will be the acquirer in a cross-
border M&A transaction should be influenced by the difference between the applicable rates,
rather than the level.
All controls from Model (1) are included in Model (2) with the exception of three non-
directional variables, geographic distance and the two indicator variables equal to one if the
countries have the same primary language or religion, which I remove as non-directional
variables should not explain the direction of cross-border M&A.
First, as above, I examine the effect of differences in the statutory corporate tax rate and
the acquirer and target’s tax regimes. Consistent with the finding in Erel et al. (2012), I predict a
positive coefficient on Diff_Trate_CorpIncTax, indicating that the acquiring firm is, on average,
subject to a higher corporate tax rate than the target. Further, I predict a negative coefficient on
Diff_Trate_Dividends, indicating that firms structure the M&A to minimize the withholding tax
due on repatriations of income from the target to the acquirer.
Next, I examine the effect of tax regime on the direction of cross-border M&A. As
acquirers located in worldwide tax regimes bring the income of the target under the umbrella of a
worldwide regime, subjecting it to taxation at the acquirer level, I expect that, when firms from
countries with different tax regimes engage in cross-border M&A, the acquirer is more likely to
be from a territorial regime, while the target is more likely to be from a worldwide regime. This
is consistent with firms structuring M&A in order to avoid bringing the income of a territorial
firm under the umbrella of a worldwide tax system. Because I expect that firms in territorial
regimes are more likely to acquire, while firms in worldwide regimes are more likely to be
targeted, I predict a negative (positive) coefficient on Aww_Tterr (Aterr_Tww).

23
Because the presence of CFC provisions in the acquirer country may result in additional
taxes due on the income of the target, I expect that when only one country in a cross-border
M&A transaction has CFC provisions, the M&A is likely to be structured in such a way as to
avoid the applicability of the CFC provisions. Therefore, I predict the acquiring firm will be less
likely to be subject to CFC rules, suggesting a negative (positive) coefficient on Aonly_CFC
(Tonly_CFC).
Thin capitalization rules and transfer pricing regulations both limit tax avoidance through
the profit shifting channel. However, because the direction in which the post-merger firm will
wish to shift income is not clear, it is difficult to make predictions regarding the effect of these
provisions on the direction of cross-border M&A. If post-merger firms, on average, prefer to
shift income to the target (which is consistent with acquirer firms, on average, having a higher
corporate income tax rate), I expect the coefficients on Aonly_ThinCapitalization
(Tonly_ThinCapitalization) and Aonly_TransferPricing (Tonly_TransferPricing) to be negative
(positive).
The presence of a foreign tax credit in the acquirer’s jurisdiction can mitigate the effect
of paying taxes on the target’s income in both the target and the acquirer’s jurisdictions.
Therefore, I expect that, when only one country involved in a cross-border M&A allows a
foreign tax credit, the acquiring firm is likely to be allowed the credit. Therefore, I expect a
positive (negative) coefficient on Aonly_FTC (Tonly_FTC).
Finally, I examine the effect of IP Box regimes on the direction of cross-border M&A.
As with the effect of IP Box regimes on the volume of cross-border M&A, predictions regarding
the effect on the direction of cross-border M&A are difficult. It is possible that the presence of
an IP Box regime in their country provides an advantage to foreign acquirers, particularly in

24
acquisitions of targets with high levels of IP income that is currently not tax-preferred, which
would suggest a positive coefficient on Aonly_IPBox. However, because many IP Box regimes
do not extend tax-preferred treatment to acquired intellectual property unless it is substantially
further developed in the post-merger period, it may be that IP Box regimes do not have any
effect on the direction of cross-border M&A.
Determinants by Acquirer Tax Regime
I further expect that the tax system characteristics may have different implications for
cross-border M&As when the acquiring firm is taxed under a worldwide or territorial regime, as
many of these tax system characteristics will generate different tax effects under each regime.
For example, in a worldwide tax system, CFC provisions prevent the deferral of the recognition
of taxable income that otherwise would have been taxed upon repatriation. However, in a
territorial tax system, CFC provisions require the inclusion of income that would not otherwise
be subjected to tax in the acquirer country at all. Similarly, transfer pricing regulations may be
more costly for parent firms located in territorial tax systems. When a firm in a territorial tax
system is able to shift income to a foreign subsidiary in a tax-preferred jurisdiction, the income is
never subject to tax by the parent country. However, in a pure worldwide system, shifting
income does not produce permanent tax avoidance, but tax deferral.14 Consistent with this,
Markle (2016) finds that firms in territorial tax regimes engage in more profit shifting than firms
in worldwide systems.
Because theory suggests that the effect of these characteristics may vary with the
acquiring firm’s tax regime, I also estimate the effect of these characteristics separately for
14 In countries with a worldwide system that allows worldwide averaging (all foreign income and all foreign tax is pooled) for purposes of calculating a foreign tax credit limitation (generally referred to as “cross-crediting”), profit shifting could lead to tax avoidance through manipulation of the foreign tax credit limitation if the limitation was binding.

25
acquiring countries in worldwide regimes and acquiring countries in territorial regimes to
determine if the impact of these tax system characteristics on cross-border M&As differs across
acquirer regime. Specifically, I estimate this regression separately for the acquirer countries in a
worldwide system and those in a territorial system by modifying regression model (1) to
eliminate the variables Aww_Tterr and Aterr_Tww, and replace that with an indicator variable,
T_ww, equal to one if the target country is a worldwide tax regime, and zero otherwise. I use
Seemingly Unrelated Regression and conduct t-tests of differences in coefficients across the two
subsamples.
4. Data Sources and Sample Construction
I construct my sample of M&As using Security Data Corporation’s (SDC) Mergers and
Corporate Transactions database. I collect all M&As announced between January 1, 2006 and
December 31, 2015, inclusive. Following Erel et al. (2012), I exclude leveraged buyouts, spin-
offs, recapitalizations, self-tender offers, exchange offers, repurchases, and privatizations, and I
eliminate deals in which either the target or acquirer is a government agency or in the financial
or utilities industries.15 In my final sample, I consider M&A transactions from 50 countries for
which I have all necessary control variables, which covers 62,614 total cross-border M&A
transactions. Because each observation is an ordered country pair year and I have 50 countries in
my sample, the total number of observations theoretically available is 24,500 (50 × 49 × 10).
15 In untabulated analysis, I re-estimate my analyses on two additional samples. First, I expand the sample to consider M&A not completed. Next, I further restrict my main sample to cross-border M&A in which the target is more than 50% owned following the M&A transaction and the ultimate acquirer is located in the same country as the immediate acquirer following sensitivity tests in Huizinga and Voget (2009) and main analyses in Hagen and Prettl (2017). My results remain quantitatively and qualitatively similar across all three samples.

26
However, due to missing data or an undefined dependent variable, the number of observations
drops to 21,754 for my primary volume analysis and 10,454 for my primary direction analysis.16
My variables of interest are tax rates and tax system characteristics hand-collected from
Ernst & Young Worldwide Corporate Tax Guides (2004-2015) and the PwC Worldwide Tax
Summaries (2010/2011-2015/2016). This allows me to take advantage of changes in tax regimes
across time. From SDC, I collect the announcement date, the fraction of the target firms owned
by the acquirer following the acquisition, and primary industry as indicated by the Standard
Industrial Classification (SIC) code, and country of domicile17, along with the completion date
where applicable, and deal value (in U.S. dollar terms) where available.
Country-level variables are collected from multiple sources. I collect primary language
and primary religion from the FBI World Factbook. I obtain the latitude and longitude of the
capital cities of each country from WorldData (www.worlddata.info). Bilateral trade data is
collected from the United Nations Commodity Trade Statistics Database. Gross domestic
product (GDP) per capita and GDP per capita growth rates are collected from the WorldBank
National Accounts data. I collect the 2010 consumer price index (CPI) from the International
Monetary Fund through WorldBank. I measure the quality of accounting disclosure using the
disclosure index from the WorldBank Doing Business Project. The anti-self-dealing index, a
measure of protections for minority shareholders, is from Djankov et al. (2008). Institutional
quality is collected from the International Country Risk Guide (ICRG) published by the Political
Risk Services group following Bekaert, Harvey, and Luncblad (2005). Investment profile is also
16 A value for CBMA_Direction will be undefined if no cross-border M&As occurred between countries i and j during the year. 17 Per SDC, the country of domicile is the location of the firm’s headquarters and/or operations.

27
collected from the ICRG. I collect nominal bilateral exchanges rates and total value-weighted
return indices from Datastream.
5. Primary Results
Descriptive Statistics
Table 1 displays the 50 countries included in my analysis, along with the pattern of cross-
border and domestic M&As over my entire sample period. Each row contains a target country,
and each column contains an acquirer country, such that the diagonal entries contain the number
of domestic M&As that occurred in a country over my sample period. The off-diagonal entries
represent the number of cross-border M&As that occurred for each ordered country pair. In
terms of the raw number of cross-border M&As, the United States (Kenya) is both the most
(least) common acquirer and the most (least) commonly targeted in cross-border M&As during
my sample period. When the number of cross-border M&As is scaled by the size of the
domestic M&A market, firms in Luxembourg are most likely to be acquirers and targets in cross-
border M&As, while firms in Russia (Japan) are least likely to be acquirers (targets).
INSERT TABLE 1 HERE
In Table 2, I present descriptive statistics for my sample of ordered country pair years.
By construction, the mean difference in corporate income tax rates is near zero, as the use of
ordered country pair observations creates off-setting values. Differences in dividend tax rates,
however, are asymmetrical, as the tax rate paid on dividends from country i to country j may not
equal the tax rate paid on dividends from country j to country i. My descriptive statistics suggest
that in about half of country pairs, both the target and the acquirer operate in either a territorial or
worldwide regime, leaving about a quarter of country pairs in which only the acquirer country is

28
located in a worldwide regime and a quarter of country pairs in which only the target country is
located in a worldwide regime. CFC provisions and thin capitalization rules occur similarly in
my sample. Transfer pricing and the allowance of a foreign tax credit are far more common,
leaving a smaller number of ordered country pair year observations in which one country does
not exhibit the tax system characteristic. IP Box regimes are relatively uncommon, producing a
similar result.
INSERT TABLE 2 HERE
Determinants of the Volume of Cross-Border M&A
The results of the estimation of model (1) are presented in Table 3 Panel A. Across
known determinants of the volume of cross-border M&As, my results are largely consistent with
prior literature. Consistent with Erel et al. (2012), I find that geographic distance, existing trade,
shared language, and cultural similarity (measured using shared primary religion) are important
determinants of the volume of cross-border M&A. Specifically, I find that the volume of cross-
border M&A between a country-pair is higher when the countries share a language, share a
religion, are sizeable trading partners, and are close to each other (GCDist is smaller). I also find
that the volume of cross-border M&A is lower when Diff_GDPgrowth is higher. A higher value
for Diff_GDPgrowth indicates that the target country’s GDP growth is higher than the acquirer
country’s GDP growth. Thus, this result indicates that the volume of cross-border M&A is
higher between acquirer countries with lower GDP growth than their target countries, suggesting
that firms increase cross-border M&A to invest in higher-growth countries. I also find evidence
that the volume of cross-border M&As is higher among country pairs in which the target has
better disclosure quality than the acquirer (Diff_DisclosureIndex is lower); this finding is not
consistent with the results in Erel et al. (2012), though I use a different measure of disclosure in

29
my model. Unlike Erel et al. (2012), however, I do not find that firms increase cross-border
M&A in order to exploit valuation effects caused by currency exchange rate or stock market
returns.
INSERT TABLE 3, PANEL A HERE
Similar to Erel et al. (2012), I find that acquirers more frequently acquire targets in
countries with lower statutory income tax rates. In addition to examining statutory corporate tax
rates, I expand Erel et al. (2012) to examine the effect of dividend withholding rates. My results
suggest that the volume of cross-border M&A increases when the cost of repatriating dividends
from the target the acquirer country is lower.
Of the tax system characteristics that I examine, I find that CFC provisions and transfer
pricing regulations are significant determinants of cross-border M&A. Consistent with
predictions, my results suggest that the presence of CFC provisions in the acquirer country
reduces the volume of cross-border M&As. The significantly negative coefficient on Aonly_TP
suggests that transfer pricing regulations also reduce the returns to cross-border M&A, consistent
with these regulations preventing or curtailing the use of profit-shifting for tax avoidance. This
result is consistent with the post-merger firm, on average, preferring to shift taxable income from
the acquirer to the target. Though the coefficients are directionally consistent with firms in
territorial systems being advantaged in cross-border M&As compared to worldwide tax systems,
the coefficients are insignificant. I also do not find that thin capitalization rules, foreign tax
credits, or IP Box regimes are significant determinants of the volume of M&A.
In Table 3, Panel B, I examine each tax system characteristic independently, and I find my
results are largely consistent across these specifications. Again, I find that the presence of CFC
provisions and transfer pricing regulations in the acquirer country or high rates of dividend

30
withholding reduce the volume of cross-border M&A. However, I find that the coefficient on
Diff_Trate_CorpIncTax, while positive in all specifications, is only significant in two of the six
specifications. Further, I find that, though the effect is subsumed by the effect of other tax
system characteristics, the coefficient on auponly_ipbox is negative and significant, suggesting
that firms located in tax jurisdictions that allow for tax-preferenced treatment of IP income are
less likely to acquire foreign targets. I interpret this as weak evidence that IP box regimes may
successfully reduce firms’ incentives to shift income.
INSERT TABLE 3, PANEL B HERE
Determinants of Volume by Acquirer Tax Regime
Next, I present the results of my estimation of model (1) separately for acquirers based in
worldwide and territorial regimes in Table 4. In the analysis above, I make determinations of
worldwide and territorial regimes at the country pair year level. However, to compare the way
these tax system characteristics impact M&As across tax regimes, I indicate an acquirer country
as worldwide or territorial without consideration for the specific target country in this anlaysis.
A country is indicated as worldwide or territorial based on the general tax treatment for countries
under a bilateral tax treaty. Countries that only allow dividend participation exemptions under
the European Union Parent-Subsidiary Directive of 1990 are not considered to be generally
territorial.18 In this analysis, I continue to find evidence that CFC provisions and transfer pricing
regulations in the acquirer country reduce the volume of cross-border M&A across both
worldwide and territorial regimes. However, I do not find evidence that any of these tax system
characteristics have differential effects on the volume of cross-border M&A based on the
acquirer tax regime.
18 Results are qualitatively and quantitatively similar if I allow the acquirer country’s regime designation to change with each country pair, as it does in the primary analysis.
31
INSERT TABLE 4 HERE
Determinants of the Direction of Cross-Border M&A
Next, I examine the effect of tax system characteristics on the direction of cross-border
M&A. That is, given that an M&A occurs between firms located in two countries, I examine
which country is more likely to be the domicile of the acquiring firm. I present the results of my
estimation of Model (2) in Table 5.
INSERT TABLE 5, PANEL A HERE
In Table 5, Panel A, I again find strong evidence that tax rates influence cross-border
M&A decisions. Consistent with the findings in Erel et al. (2012), I find that the acquirer is
likely to have a higher rate of tax on corporate income than the target firm, indicated by a
positive coefficient on Diff_trate_Corpinctax. Further, I document a significantly negative
coefficient on Diff_Trate_Dividends. This provides evidence that firms select the direction of
the M&A that minimizes the cost of withholding tax on dividends paid between the two
countries. I also find a significantly negative coefficient on Aww_Tterr, indicating that cross-
border M&A between an acquirer in a worldwide regime and a target in a territorial regime is
less common than cross-border M&A between an acquirer in a territorial regime and a target in a
worldwide regime or between a target and acquirer in the same type of tax regime. This
indicates that cross-border M&As are less likely to be structured in such a way that a target in a
territorial system is put under the umbrella of a worldwide regime.
My results indicate that CFC provisions and thin capitalization rules have the largest
influence on the direction of cross-border M&A. I find that cross-border M&As are positively
(negatively) associated with the target (acquirer) alone being subject to CFC provisions. This is
consistent with firms structuring cross-border M&As so as to avoid the adverse tax consequences

32
of the target being classified as a controlled foreign corporation. The size and significance of the
coefficients on CFC provisions suggests that the presence of CFC provisions is a more important
factor in determining the direction of cross-border M&A than whether the acquirer is in a
worldwide or territorial regime. I suggest that this could be due to the deferral privilege
available in many worldwide regimes. This privilege allows firms to defer paying the additional
layer of tax until the profits of the target are repatriated to the acquirer country. This privilege
can be used to avoid the taxes indefinitely, provided that the acquirer continues to invest the
profits of the target in foreign assets.
I also find evidence that cross-border M&As are positively (negatively) associated with
the acquirer (target) being subject to thin capitalization rules when the target (acquirer) is not
subject to these rules. This result is consistent with post-merger firms preferring to shift income
from the acquirer to the target through the use of inter-company debt. However, I also find a
positive and significant coefficient on Aonly_TP.
Finally, I find a positive and significant coefficient on Aonly_FTC, suggesting that M&A
is generally structured such that the acquirer can claim a foreign tax credit on taxes paid to
foreign jurisdictions on income that is also subject to tax in the home country. I do not find
evidence that firms consider the presence of an IP box regime to influence the direction of cross-
border M&A.
In Table 5 Panel B, I allow each tax system characteristic to enter the regression
independently. My results on corporate income tax rates, dividend withholding rates, CFC
provisions and thin capitalization rules are virtually unchanged, but I do not find that tax regime
(worldwide or territorial) significantly explains the direction of M&A in this specification.
Interestingly, I find that the coefficient on Aonly_FTC, which was significantly positive in Panel

33
A, becomes significantly negative in this specification. It is possible that, without controlling for
the acquirer and target countries’ tax regime, the presence of a foreign tax credit is acting as a
proxy for a worldwide tax regime.
INSERT TABLE 5, PANEL B HERE
Determinants of Direction by Acquirer Tax Regime
In Table 6, I separately estimate the regression for the sample of acquirers in worldwide
regimes and acquirers in territorial regimes.
INSERT TABLE 6 HERE
My results are largely consistent across both regimes, suggesting that my findings in
Table 5 are not driven by only one tax regime. However, I do find that the coefficient on
Tonly_FTC to be positive and significant for acquirers in worldwide regimes, but negative and
significant for acquirers in territorial regimes. In a territorial regime, the presence of a foreign
tax credit affects the direction of cross-border M&A in a way that is consistent with predictions.
Specifically, the direction of cross-border M&A favors acquirers that are granted a foreign tax
credit when only one of the countries allows it. The results in a worldwide regime, however, are
surprising. I find a strong positive coefficient on Tonly_FTC that exceeds the positive and
significant coefficient on Aonly_FTC. Note that if the acquirer is in a worldwide regime but only
the target country allows a foreign tax credit, the acquirer taxes worldwide income, but does not
allow a general double-tax relief provision. In these rare occurrences, the countries provide
relief from double-taxation only through the presence of existing tax treaties, which themselves
may grant foreign tax credits. Because I do not consult treaty provisions in defining any tax
system characteristics other than dividend withholding rates, my sample contains a small number

34
of countries in worldwide regimes that do not grant a general foreign tax credit. I note that this
strange result is driven by a small number of countries.
6. Supplemental Tests
Country-Level Analysis
In my main tests, I use a sample of ordered country pair years to examine the effect of
differences in tax system characteristics between the countries of the acquirer and the target firms
in the volume and direction of cross-border M&A between the two countries. To supplement
these findings, I present similar tests on a sample of country-year observations. Because I do not
use country-pair observations, I do not exploit differences in tax system characteristics across the
two countries involved in a cross-border M&A. Rather, I examine whether the presence of these
tax system characteristics has an effect on the volume or direction of the country’s global M&A
investments. In this specification, I separately examine the volume of cross-border M&A from a
target perspective and an acquirer perspective. In examining the target perspective, I determine
the effect of tax system characteristics on the likelihood of being a target in a cross-border M&A
relative to being targeted domestically. Similarly, the acquirer perspective examines the effect of
tax system characteristics on the likelihood of being an acquirer in a cross-border M&A relative
to acquiring domestically. Finally, I examine the effect of tax system characteristics on the
direction of global M&A. That is, considering all cross-border M&A, I examine the likelihood
that a country is a net global acquirer or a net global target.
I specify a new model to examine these country-level tax system characteristics.
Specifically, I estimate the following model using ordinary least squares regression where all
variables are as defined in Appendix A:

35
CL = α + β1Trate_CorpIncTaxx,t-1 + β2WWx,t-1 + β3CFCx,t-1 + β4ThinCapitalizationx,t-1 + β5TransferPricingx,t-1 +β6FTCx,t-1 + β7IPBoxx,t-1 + ∑βkCONTROLSx,t-1 + ∑βkYearFE + ε In this model, each observation is a country year, where x denotes country and t denotes
year. My dependent variables, CL_TVolume (CL_AVolume) and CL_Direction, capture the total
number of firms in country x targeted by foreign firms (the total number of foreign firms
acquired by firms in country x) relative to firms targeted domestically, and the proportion of total
cross-border M&A in which the country is the acquirer, respectively. CL_TVolume
(CL_AVolume) is calculated as the number of cross-border acquisitions of targets in country x by
acquirers in all foreign countries (the total number of acquisitions by firms in country x of targets
in all countries excluding country x) for period t, scaled by the total number of domestic mergers
in country x. This measure captures the volume of targets in country x acquired by foreign firms
relative to those acquired by domestic firms. CL_Direction is the proportion of cross-border
M&A involving country x in which country x is the acquirer, and is calculated as the number of
cross-border acquisitions in which the acquiring firm is in country x for period t, scaled by the
sum of the total number of cross-border M&As in which either the acquiring firm or the targeted
firm is in country x. Therefore, a value greater than .5 indicates that the country is a net acquirer
in cross-border M&A, while a value less than .5 indicates the country is a net target. Because
dividend withholding rates vary greatly depending upon the partner country and cannot be
reliably determined on a country level, I do not include dividend withholding rates in this model.
Trate_CorpIncTax is defined as the top statutory tax rate on corporate income. All other tax
system characteristics are indicator variables equal to one if the characteristic is present in
country x for period t, and zero otherwise.
(3)

36
My sample for these analyses are country-year observations. Because I have a sample of
50 countries over 10 years, I have a possible 500 total observations (50×10). However, I lose 31
observations due to missing data, leaving me with 469 total observations. I present descriptive
statistics for this sample in Table 7.
INSERT TABLE 7 HERE
In my sample, the median top statutory tax rate is 25%, and my sample is almost evenly
divided on CFC provisions, thin capitalization rules, and worldwide tax regime. Transfer pricing
regulations and foreign tax credits are far more common, while only 13.6% of countries have IP
Box regimes.
I present the results of my estimation of Model (3) in Tables 8 and 9. I first examine the
effect of these characteristics on the volume of cross-border M&A in Table 8. In Table 8, Panel
A, I examine the target perspective. In Table 8, Panel B, I examine the acquirer’s perspective.
INSERT TABLE 8, PANEL A HERE
In Table 8, Panel A, I adopt the target perspective and examine the effect of tax system
characteristics on the likelihood of being targeted by a foreign firm. The negative and significant
coefficient on Trate_CorpIncTax indicates that countries with high corporate income tax rates
are less likely to be acquired by a foreign firm relative to the size of their domestic M&A market.
This is consistent with my findings in Table 3, which indicates that, in cross-border M&A, the
acquiring firm is generally subjected to a higher tax rate than the target firm. I find a similar
results for the presence of a foreign tax credit, indicating that firms that allowed a foreign tax
credit are less likely to be acquired in cross-border M&A. The coefficient on IPBox is positive
and significant, indicating that the presence of an IP Box regime makes a firm more likely to be
acquired by a foreign firm. This could indicate that cross-border M&A facilitates shifting IP to

37
jurisdictions with favorable tax treatment of IP income. Notably, the positive coefficient on WW
is narrowly insignificant (significant in a one-tailed test). A positive and significant coefficient
on this variable would indicate that the presence of a worldwide regime increases the volume of
takeovers by foreign firms relative to domestic takeovers, which is consistent with arguments
that the U.S. worldwide tax system may make U.S. firms more valuable in the hands of a foreign
parent.
INSERT TABLE 8, PANEL B
In Table 8, Panel B, I examine the acquirer’s perspective. In this analysis, I find a
negative and significant coefficient on CFC. I interpret this as additional support for my finding
in Table 3, which suggests that the presence of CFC provisions in the acquirer country decrease
the volume of cross-border M&A.
INSERT TABLE 9 HERE
In Table 9, I examine the effect of these tax system characteristics on the direction of
cross-border M&A for a country. That is, considering all cross-border M&A in which a firm in
the country is a participant, in what proportion is the country acquiring a foreign target rather
than being acquired by a foreign firm? I find that statutory tax rate, CFC provisions, and thin
capitalization provisions are determinants of the direction of cross-border M&A, consistent with
the results in Table 5. Specifically, I find that having a high corporate tax rate makes a country
more likely to be a net acquirer, while the presence of CFC provisions and thin capitalization
rules reduce the likelihood that a country will be a net acquirer.
7. Additional Analysis

38
My primary analyses provide insight into the determinants of the volume and direction of
cross-border M&As. However, tax system characteristics are also likely to be considerations in
other decisions regarding the structure of cross-border M&A. For these analyses, I use the same
sample used in Tables 3 through 6, though my sample size is reduced by the number of ordered
country pair year observations that do not have at least one completed cross-border M&A during
the year.19
Obtaining Control in Cross-Border M&A
First, I consider the effect of tax system characteristics on the likelihood of the acquirer
obtaining control (which I define as greater than or equal to 50% ownership) of the target. While
all of the M&A transactions in my sample represent a substantial investment in the target,
obtaining control of the target will trigger the effect of CFC provisions, if applicable, though it
may also make tax avoidance strategies, such as profit shifting, more likely. To examine the
effect of tax system characteristics on the likelihood of obtaining control of a foreign target, I
construct CBMA_Control as the total number of cross-border acquisitions of firms in country i
by firms in country j for period t in which the acquirer owns over 50 percent of the target
following the transaction, and scaling it by total number of cross-border acquisitions of firms in
country i by firms in country j for period t. I present the results in Table 10. As predicted, CFC
provisions are highly important in determining the likelihood of a firm obtaining control of the
target in a cross-border M&A. Consistent with expectations, the proportion of cross-border
M&A that result in a controlled subsidiary is significantly lower (higher) when the acquirer
(target) alone is subject to CFC provisions. The M&A is also more likely to result in a
19 A value for CBMA_intermediary and CBMA_Control will be undefined if no cross-border M&A occurred in which country i was the acquirer and country j was the target during the year.

39
controlled target when the acquirer has a higher corporate tax rate, benefits from the allowance
of a foreign tax credit, and is not subject to thin capitalization rules.
INSERT TABLE 10 HERE
Use of an Intermediary Country in Cross-Border M&A
Next, I consider the use of an immediate acquirer in a country that is neither country i nor
country j, as the total proportion of cross-border M&As in which the acquisition was facilitated
through a direct acquirer located in a third country, I construct CBMA_Intermediary as the total
number of cross-border acquisitions of firms in country i by firms in country j through a direct
acquirer located in a country that is neither country i nor country j for period t, and scaling it by
total number of cross-border acquisitions of firms in country i by firms in country j for period t.
Table 11 presents the results.
INSERT TABLE 11 HERE
I find that, when the target is located in a worldwide regime and the acquirer is located in
a territorial regime, the cross-border M&A is less likely to include an intermediary in a third
country. As bringing a firm from a territorial regime under the umbrella of a worldwide regime
is costly, it is possible that firms in worldwide regimes are more likely to own territorial firms
through another country. In this way, the post-merger multinational firm could use an
intermediary country to facilitate the flow of capital between subsidiaries without repatriating
income from the territorial subsidiary to the worldwide parent firm. In addition, I find that firms
are less likely to use an intermediary country when only the acquirer is subject to thin
capitalization rules.

40
Tax System Characteristics and Merger Premia
In addition to examining the volume, direction, and structure of cross-border M&A, I
next examine the effect of tax system characteristics on the merger premia in cross-border M&A.
In these tests, I eliminate cross-border M&A transactions for which the four-week merger
premium is unavailable in SDC, leaving me with only 1,518 observations.
Premia = α + β1Diff_Trate_CorpIncTaxi,j,t-1 + β2Diff_Trate_Dividendsi,j,t-1 + β3Aww_Tterri,j,t-1 + β4Aterr_Twwi,j,t-1 + β5Aonly_CFCi,j,t-1 + β6Tonly_CFCi,j,t-1 + β7Aonly_ThinCapitalizationi,j,t-1 + β8Tonly_ThinCapitalizationi,j,t-1 + β9Aonly_TransferPricingi,j,t-1 + β10Tonly_TransferPricingi,j,t-1 + β11Tonly_FTCi,j,t-1 + β12Aonly_FTCxi,j,t-1 + β13Tonly_IPBoxi,j,t-1 + β14Aonly_IPBoxi,j,t-1 + ∑βkCONTROLSi,j,t-1 + ∑βkAcqFE + ∑βkYearFE + ε In addition to the control variables used above, I include several additional controls in
this model to address known determinants of merger premia, including an indicator variable for
same industry, an indicator variable for government involvement, and indicator variable for
unsolicited M&A, an indicator variable for the use of a Big 4 auditor, and indicator variable for a
transaction that takes the target private, and indicator for a competing bid on the target, and
controls for size and ownership of the target prior to the M&A. I present descriptive statistics for
this sample in Table 12.
INSERT TABLE 12 HERE
I present my results in Table 13. Of all of the tax system characteristics that I examine,
only tax regime and transfer pricing regulations return a significant coefficient. Specifically, I
find that the acquirer pays a higher merger premium when the cross-border M&A involves a
territorial acquirer and a worldwide target. This is consistent with territorial acquirers being able
to outbid worldwide acquirers in the global M&A market, suggesting that worldwide tax system
may put acquirers at a competitive disadvantage. I also find that merger premia are reduced
when the acquirer is subject to transfer pricing regulations. This is consistent with cross-border
(5)

41
M&A facilitating tax avoidance through a profit-shifting channel. Because transfer pricing
regulations limit firms’ ability to generate tax savings through profit shifting mechanisms,
acquirers subject to transfer pricing regulations may incur a higher cost to operate the subsidiary
than an acquirer not subject to these rules.
8. Conclusion
This paper contributes to the literature on cross-border M&As by examining the effects
of tax system characteristics on the volume, direction, structure, and merger premia of cross-
border M&As. I find that naïve tax variables, such as the difference in top statutory corporate
tax rates, do not fully explain the impact of taxes on cross-border M&As. My evidence suggests
that the volume of cross-border M&A is affected by the difference in corporate income tax rates,
the presence of CFC provisions, and the presence of transfer pricing rules. I further find that the
direction of cross-border M&A is affected by differences in corporate income tax rates and
dividend withholding rates, tax regime, and the presence of CFC provisions and thin
capitalization rules, and the allowance of a foreign tax credit. My results suggest that the
presence of CFC provisions decreases both the volume of cross-border M&A and the likelihood
that a firm is the acquirer in cross-border M&A. Regulations meant to limit tax avoidance
through profit shifting also affects the global M&A market. I find that thin capitalization rules
reduce the likelihood of a country acting as the acquirer in cross border M&A and that the
presence of transfer pricing regulations reduces the incidence of cross-border M&A.
In additional analyses, I examine determinants of the structure and merger premia of
cross-border M&As. Consistent with expectation, I find evidence that CFC provisions result in a
smaller proportion of cross-border M&A that results in control of the target. Interestingly, I find
42
that when the target is located in a worldwide regime and the acquirer is located in a territorial
regime, the cross-border M&A is less likely to include an intermediary in a third country. These
results suggest that firms respond to tax costs of cross-border M&As by limiting the percent of
the target acquired and employing the use of an intermediary in a third country.
However, I do find limited evidence that tax system characteristics influence the merger
premia in cross-border M&A. My results suggest that territorial acquirers may pay a higher
merger premia, consistent with the territorial regime giving these acquirers a competitive
advantage. I find that the presence of transfer pricing regulations in the acquirer country
decrease the merger premia, consistent with transfer pricing regulations limiting tax avoidance
by the post-merger firm through profit shifting.
This study contributes to the ongoing debate regarding U.S. tax reform and the recent
passage of the TJCA2017, as a central focus of both has been the ability of U.S. multinationals to
compete with firms in territorial regimes. My results suggest that criticisms of the U.S.
worldwide tax system hurting U.S. firms in global markets are not baseless. However, the effect
of CFC provisions, which were not affected by TCJA2017, may be more detrimental to U.S.
firms in the cross-border M&A market.

43
9. References
Atwood, T., Huston, G., Wallace, D. (2016). The impact of home country taxation of foreign source income on firm performance: Beyond the worldwide versus territorial dichotomy. Working paper, University of Arkansas, Arizona State University, University of Central Florida. Bekaert, G., Harvey, C. R., Lundblad, C. (2005). Does financial liberalization spur growth? Journal of Financial Economics, 77 (1): 3-55. Belz, T., Robinson, L., Ruf, M., Steffens, C. (2013). Tax Avoidance as a Driver of Mergers and Acquisitions. Working Paper, Mannheim University, Dartmough College, Tuebingen University Bradley, S., Ruf, M., & Robinson, L. (2018). The Impact of Patent Box Regimes on the M&A Market. Working Paper, Drexel University, Univesity of Tuebingen, Dartmouth College. Col, B., Errunza, V. (2015) Havenly Acquisitions. Working Paper, Pace University, McGill University. Crow, D., Fontanella-Khan, J., Murphy, M. (2015, March) Tax Inversion curb turns tables on US. Retrieved from https://www.ft.com/content/e1ba6eb0-ca5c-11e4-b8ff-00144feab7de Di Giovanni, J. (2005). What drives capital flows? The case of cross-border M&A activity and financial deepening. Journal of International Economics, 65 (1): 127-149. Djankov, S., La Porta, R., Lopez-de-Silanes, F., & Shleifer, A. (2008). The law and economics of self-dealing. Journal of Financial Economics, 88 (3): 430-465. Dyreng, S. D., Lindsey, B. P., Markle, K. S., & Shackelford, D. A. (2015). The effect of tax and nontax country characteristics on the global equity supply chains of US multinationals. Journal of Accounting and Economics, 59 (2): 182-202. Erel, I., Liao, R. C., & Weisbach, M. S. (2012). Determinants of cross-border mergers and acquisitions. The Journal of Finance, 67 (3): 1045-1082. E&Y (2015, March). Buying and selling: Cross-border mergers and acquisitions and the US corporate income tax. Retrieved from http://businessroundtable.org/sites/default/files/reports/EY%20BRT%20Cross-border%20MA%20report%202015%2003%2010.pdf Feld, L. P., Ruf, M., Scheuering, U., Schreiber, U., & Voget, J. (2013). Effects of territorial and worldwide corporation tax systems on outbound M&As. ZEW-Centre for European Economic Research Discussion Paper, (13-088). Hoffman, L., McKinnon, J. (September 21, 2015). Curbs don’t stop tax-driven mergers. The Wall Street Journal.

44
Huizinga, H. P., & Voget, J. (2009). International taxation and the direction and volume of Cross-Border M&As. The Journal of Finance, 64 (3): 1217-1249. Huizinga, H., Voget, J., & Wagner, W. (2012). Who bears the burden of international taxation? Evidence from cross-border M&As. Journal of International Economics, 88 (1): 186-197. JP Morgan. (2018, January). 2018 global M&A outlook. Retrieved from https://www.jpmorgan.com/jpmpdf/1320744801603.pdf Klassen, K. J., & Laplante, S. K. (2012). Are US multinational corporations becoming more aggressive income shifters? Journal of Accounting Research, 50 (5): 1245-1285. Markle, K., & Robinson, L. (2012). Tax haven use across international tax regimes. Working Paper, University of Iowa, Dartmouth College. Markle, K. (2016). A comparison of the tax-motivated income shifting of multinationals in territorial and worldwide Countries. Contemporary Accounting Research, 33 (1): 7-43. Mescall, D., & Klassen, K. J. (2014). How does transfer pricing risk affect premia in cross-border mergers and acquisitions? Working Paper, University of Saskatchewan, University of Waterloo. Mider, Zachary. (2017, March) Tracking tax runaways. Retrieved from https://www.bloomberg.com/graphics/tax-inversion-tracker/ Musgrave, P. (1969). United States taxation of foreign investment income: Issues and arguments. Harvard Law School. Richman, P. (1963) Taxation of Foreign Investment Income: An economic analysis. Johns Hopkins Press. Rossi, S., & Volpin, P. F. (2004). Cross-country determinants of mergers and acquisitions. Journal of Financial Economics, 74 (2): 277-304.

45
10. Appendix 1: Variable Descriptions
Variable Variable Definition CBMA_Volume The total number of cross-border deals in year t in which the target is
from country i and the acquirer is from country j, scaled by the sum of the total number of domestic M&As in country j and in country i in year t then multiplied by 100. (Source: Security Data Corporation’s (SDC) Mergers and Corporate Transactions database)
CBMA_Direction The total number of cross-border deals in year t in which the target is from country i and the acquirer is from country j, scaled by the sum of the total number of cross-border M&As between country i and j in year t then multiplied by 100. (Source: Security Data Corporation’s (SDC) Mergers and Corporate Transactions database)
CL_TVolume The total number of cross-border deals in year t in which the target is from country i, scaled by the total number of domestic M&As in country i in year t then multiplied by 100. (Source: Security Data Corporation’s (SDC) Mergers and Corporate Transactions database)
CL_AVolume The total number of cross-border deals in year t in which the acquirer is from country j, scaled by the total number of domestic M&As in country j in year t then multiplied by 100. (Source: Security Data Corporation’s (SDC) Mergers and Corporate Transactions database)
CL_Direction The total number of cross-border deals in year t in which the target is from country i, scaled by the sum of the total number of cross-border M&As in which the target is from country i and the acquirer is from country i in year t then multiplied by 100. (Source: Security Data Corporation’s (SDC) Mergers and Corporate Transactions database)
CBMA_Control The total number of cross-border deals in year t in which the target is from country i, the acquirer is from country j and the acquirer owns over 50% of the target following the M&A transaction, scaled by the total number of cross-border deals in year t in which the target is from country i and the acquirer is from country j in year t then multiplied by 100. (Source: Security Data Corporation’s (SDC) Mergers and Corporate Transactions database)
CBMA_Intermediary The total number of cross-border deals in year t in which the target is from country i, the acquirer is from country j and the immediate acquirer is from neither country i nor j, scaled by the total number of cross-border deals in year t in which the target is from country i and the acquirer is from country j in year t then multiplied by 100. (Source: Security Data Corporation’s (SDC) Mergers and Corporate Transactions database)
CBMA_Erel The total number of cross-border deals in year t in which the target is from country i and the acquirer is from country j, scaled by the sum of the total number of cross-border M&As between country i and j and the

46
total number of domestic M&As in country i in year t then multiplied by 100. (Source: Security Data Corporation’s (SDC) Mergers and Corporate Transactions database)
Trate_CorpIncTax The difference between the top statutory corporate income tax rate in the country. (Source: E&Y Worldwide Corporate Tax Guides and the PwC Worldwide Tax Summaries)
Diff_Trate_CorpIncTax The difference between the top statutory corporate income tax rate in the acquirer (j) and target (i) countries. (Source: E&Y Worldwide Corporate Tax Guides and the PwC Worldwide Tax Summaries)
Trate_Dividends the rate of withholding on dividends paid from the target country (i) to the acquirer country (j) ,where rates may be reduced under existing tax treaties (Source: E&Y Worldwide Corporate Tax Guides and the PwC Worldwide Tax Summaries)
Diff_Trate_Dividends The difference between the rate of withholding on dividends paid from the target country (i) to the acquirer country (j) and the rate of withholding on dividends paid from the target country (i) to the acquirer country (j), where both rates are reduced under existing tax treaties where applicable (Source: E&Y Worldwide Corporate Tax Guides and the PwC Worldwide Tax Summaries)
WW An indicator variable set equal to one if the country has a worldwide tax system, and zero otherwise, where the tax system is considered territorial if it exempts at least 95% of foreign dividends paid out of active income by a subsidiary that is at least 25% owned as determined with respect to the specific acquirer country (Source: E&Y Worldwide Corporate Tax Guides and the PwC Worldwide Tax Summaries)
Aww_Tterr An indicator variable set equal to one if the acquirer (j) country has a worldwide tax system and the target (i) country has a territorial tax system, and zero otherwise, where the tax system is considered territorial if it exempts at least 95% of foreign dividends paid out of active income by a subsidiary that is at least 25% owned as determined with respect to the specific acquirer country (Source: E&Y Worldwide Corporate Tax Guides and the PwC Worldwide Tax Summaries)
Aterr_Tww An indicator variable set equal to one if the acquirer (j) country has a worldwide tax system and the target (i) country has a territorial tax system, and zero otherwise, where the tax system is considered territorial if it exempts at least 95% of foreign dividends paid out of active income by a subsidiary that is at least 25% owned as determined with respect to the specific acquirer country (Source: E&Y Worldwide Corporate Tax Guides and the PwC Worldwide Tax Summaries)

47
CFC An indicator variable set equal to one if the country has Controlled Foreign Corporation provisions, and zero otherwise (Source: E&Y Worldwide Corporate Tax Guides and the PwC Worldwide Tax Summaries)
Aonly_CFC An indicator variable set equal to one if the acquirer (j) country has Controlled Foreign Corporation provisions and the target (i) country does not, and zero otherwise (Source: E&Y Worldwide Corporate Tax Guides and the PwC Worldwide Tax Summaries)
Tonly_CFC An indicator variable set equal to one if the target (i) country has Controlled Foreign Corporation provisions and the acquirer (j)
country does not, and zero otherwise (Source: E&Y Worldwide Corporate Tax Guides and the PwC Worldwide Tax Summaries)
ThinCapitalization An indicator variable set equal to one if the country has thin capitalization rules, and zero otherwise (Source: E&Y Worldwide Corporate Tax Guides and the PwC Worldwide Tax Summaries)
Aonly_Thincapitalization An indicator variable set equal to one if the acquirer (j) country has thin capitalization rules and the target (i) country does not, and zero otherwise (Source: E&Y Worldwide Corporate Tax Guides and the PwC Worldwide Tax Summaries)
Tonly_Thincapitalization An indicator variable set equal to one if the target (i) country has thin capitalization rules and the acquirer (j) country does not, and zero otherwise (Source: E&Y Worldwide Corporate Tax Guides and the PwC Worldwide Tax Summaries)
TransferPricing An indicator variable set equal to one if the country has specific transfer pricing regulations, and zero otherwise (Source: E&Y Worldwide Corporate Tax Guides and the PwC Worldwide Tax Summaries)
Aonly_TransferPricing An indicator variable set equal to one if the acquirer (j) country has specific transfer pricing regulations and the target (i) country does not, and zero otherwise (Source: E&Y Worldwide Corporate Tax Guides and the PwC Worldwide Tax Summaries)
Tonly_TransferPricing An indicator variable set equal to one if the target (i) country has specific transfer pricing regulations and the acquirer (j) country does not, and zero otherwise (Source: E&Y Worldwide Corporate Tax Guides and the PwC Worldwide Tax Summaries)
FTC An indicator variable set equal to one if the country allows a foreign tax credit for foreign taxes paid on non-exempt foreign profits, and zero otherwise (Source: E&Y Worldwide Corporate Tax Guides and the PwC Worldwide Tax Summaries)
Tonly_FTC An indicator variable set equal to one if the acquirer (j) country allows a foreign tax credit for foreign taxes paid on non-exempt

48
foreign profits and the target (i) country does not, and zero otherwise (Source: E&Y Worldwide Corporate Tax Guides and the PwC Worldwide Tax Summaries)
Aonly_FTC An indicator variable set equal to one if the target (i) country allows a foreign tax credit for foreign taxes paid on non-exempt foreign profits and the acquirer (j) country does not, and zero otherwise (Source: E&Y Worldwide Corporate Tax Guides and the PwC Worldwide Tax Summaries)
IPBox An indicator variable set equal to one if the country exempts all or a portion of income derived from qualifying intellectual property or taxes this income at a reduced tax rate, and zero otherwise (Source: E&Y Worldwide Corporate Tax Guides and the PwC Worldwide Tax Summaries)
Aonly_IPBox An indicator variable set equal to one if the acquirer (j) country exempts all or a portion of income derived from qualifying intellectual property or taxes this income at a reduced tax rate and the target (i) country does not, and zero otherwise (Source: E&Y Worldwide Corporate Tax Guides and the PwC Worldwide Tax Summaries)
Tonly_IPBox An indicator variable set equal to one if the target (i) country exempts all or a portion of income derived from qualifying intellectual property or taxes this income at a reduced tax rate and the acquirer (j) country does not, and zero otherwise (Source: E&Y Worldwide Corporate Tax Guides and the PwC Worldwide Tax Summaries)
Xrate The annual real stock market return of value-weighted index (Source: Datastream)
Diff_Xrate The difference between the annual real stock market return of value-weighted indices in the acquirer (j) and target (i) countries. Value-weighted return indices in local currency (Source: Datastream) are deflated by the 2010 consumer price index in each country (Source: Worldbank)
RealRI The annual real bilateral U.S. dollar exchange rate return (Source: Datastream)
Diff_RealRI The difference between the annual real bilateral U.S. dollar exchange rate return of the acquirer (j) and target (i) countries. Nominal exchange rates (Source: Datastream) are deflated by the 2010 consumer price index in each country (Source: Worldbank)
DisclosureIndex The country’s value in the Disclosure Index, in which a 10 indicates the highest level of disclosure and a zero indicates the lowest level of disclosure (Source: WorldBank)

49
Diff_DisclosureIndex The difference between the acquirer (j) and target (i) countries in the Disclosure Index, in which a 10 indicates the highest level of disclosure and a zero indicates the lowest level of disclosure (Source: WorldBank)
Anti_SelfDeal The Anti-Self Dealing Index, in which a 1 indicates good governance and zero indicates a low level of governance (Source: Djankov, La Porta, Lopez-de-Silanes, and Shleifer 2008)
Diff_Anti_SelfDeal The difference between the acquirer (j) and target (i) countries in the Anti-Self Dealing Index, in which a 1 indicates good governance and zero indicates a low level of governance (Source: Djankov, La Porta, Lopez-de-Silanes, and Shleifer 2008)
SameLanguage An indicator variable equal to one if the acquirer (j) and target (i) countries share a primary language, and zero otherwise (Source: FBI World Factbook)
SameReligion An indicator variable equal to one if the acquirer (j) and target (i) countries share a primary religion, and zero otherwise (Source: FBI World Factbook)
GCDist The great circle distance between the capital cities of the acquirer (j) and target (i) countries, calculated using he longitude and latitude of capital cities (Source: www.WorldData.info)
MaxTrade The maximum of bilateral imports and exports between acquirer (j) and target (i) countries, where imports (exports) are measured as the total proportion of the target country’s imports (exports) from (to) the acquirer country (Source: UN Commodity Trade Database)
GDP The natural log of the per capita GDP (Source: WorldBank)
Diff_GDP The difference in the natural log of the per capita GDP (Source: WorldBank)
GDPgrowth Tthe annual growth of the per capita GDP (Source: WorldBank)
Diff_GDPgrowth The difference in the annual growth of the per capita GDP (Source: WorldBank)
Premia The four-week merger premia, calculated as the difference between the initial bid price and the share price four weeks prior to the day of the initial bid, scaled by the price four weeks prior to the day of the initial bid (Source: Security Data Corporation’s (SDC) Mergers and Corporate Transactions database)
SameIndustry An indicator variable equal to one if the acquirer firm and the target firm have the same two-digit SIC number, and zero otherwise (Source: Security Data Corporation’s (SDC) Mergers and Corporate Transactions database)
Gov_Involvement An indicator variable equal to one if there is government involvement in the M&A, and zero otherwise (Source: Security Data Corporation’s (SDC) Mergers and Corporate Transactions database)

50
Unsolicited An indicator variable equal to one if bid was unsolicited, and zero otherwise (Source: Security Data Corporation’s (SDC) Mergers and Corporate Transactions database)
BigN An indicator variable equal to one if the auditor is KPMG, PwC, E&Y or Deloitte, and zero otherwise (Source: Security Data Corporation’s (SDC) Mergers and Corporate Transactions database)
Private An indicator variable equal to one if the acquirer firm is taking the target private through the M&A, and zero otherwise. (Source: Security Data Corporation’s (SDC) Mergers and Corporate Transactions database)
Size The natural log of the deal value in millions (Source: Security Data Corporation’s (SDC) Mergers and Corporate Transactions database)
CompetingBid An indicator variable equal to one if the number of bidders for the target firm exceeds one, and zero otherwise (Source: Security Data Corporation’s (SDC) Mergers and Corporate Transactions database)
ToeHold The percentage of the target owned by the acquirer prior to the deal announcement (Source: Security Data Corporation’s (SDC) Mergers and Corporate Transactions database)

51
11. Appendix 2: Erel et. al (2012) Replication
In my primary analysis, I deviate from the dependent variable used in Erel et al. (2012) in
order to separately examine the effect of tax system characteristics on both the volume and the
direction of cross-border M&A. In this appendix, I use the dependent variable from Erel et al.
(2012) to jointly consider these effects. Descriptive statistics for all variables in this test can be
found in Table 2. Of note is that the dependent variable used in Erel et al. (2012) and in these
regressions is highly right-skewed. Though this skewness is due to the pattern of M&A itself,
and is similar to the skewness of MaxTrade, another measure of cross-border activity, I urge the
reader to interpret the results of OLS regression with this dependent variable with extreme
caution. While skewness in the dependent variable does not violate OLS assumptions, it does
make OLS regression, which models the mean of the distribution, less appropriate.
INSERT APPENDIX 2 TABLE HERE
Similar to Erel et al. (2012), I also find that acquirers more frequently acquire in
countries with lower statutory tax rates. I also find evidence that firms acquire targets in
countries with a lower dividend withholding tax rates, reducing the cost of repatriating the profits
of the foreign subsidiary.
Contrary to expectations, I find that cross-border M&As occur more (less) frequently
between an acquirer (target) subject to CFC provisions and a target (acquirer) that is not than
between two firms with similar treatment of income from controlled foreign subsidiaries.
Although CFC provisions increase the tax cost of operating a foreign subsidiary, this result
suggests that the applicability of CFC provisions does not deter, but rather encourages, cross-
border M&A. This is not consistent with my findings in Tables 3 and 5 above.

52
I find that cross-border M&As occur less (more) frequently between an acquirer (target)
subject to transfer pricing regulations and a target (acquirer) that is not than between two firms
with similar anti-avoidance regimes. This is consistent with transfer pricing regulations
reducing the profitability of cross-border M&A by limiting the post-merger firms’ ability to
avoid taxes through income shifting, provided that post-merger firms, on average, prefer to shift
income away from the acquirer.
Finally, I also find that cross-border M&A is more likely when only the target firm is in
an IP Box regime. This would be consistent with firms acquiring targets in a favorable regime to
facilitate moving IP to a tax-preferred jurisdiction.
Across known non-tax determinants of the volume of cross-border M&As, my results are
largely consistent with prior literature. Consistent with Erel et al. (2012), I find that geographic
distance, existing trade, and cultural similarity are important determinants of cross-border
M&As. I also find evidence that acquirers are likely to acquire in countries with poorer
governance and lower GDP per capita. In my sample, however, I do not find that firms exploit
valuation effects caused by currency exchange rate or stock market returns in cross-border
M&A.

53
Table 1: Number of Mergers by Country Pair
Table 1 presents the number of M&A transactions occurring between 2006 and 2015, inclusive. The columns represent the countries of the acquirers, while the rows represent the countries of the targets. Therefore, the diagonal entries of the matrix represent the domestic mergers that occurred within the country, while the off-diagonal entries are the number of deals between an ordered country pair.
(1) (2) (3) (4) (5) (6) (7) (8) (9) (10) (11) (12) (13) (14) (15) (16) (17) (18) (19) (20) (21) (22) (23) (24) (25) (1) Australia 7686 13 9 13 0 230 0 0 1 11 0 0 16 68 80 1 0 69 22 32 3 19 0 185 0 (2) Austria 7 613 6 2 0 7 0 0 3 5 0 0 7 25 220 0 1 5 0 3 5 29 0 14 0 (3) Belgium 28 13 749 4 0 28 1 0 0 8 0 5 9 230 90 2 0 13 0 25 3 12 0 23 0 (4) Brazil 39 9 16 2217 0 108 29 13 0 11 0 0 8 153 74 0 1 18 0 14 19 68 1 84 0 (5) Bulgaria 0 18 3 0 176 1 0 0 4 0 0 0 3 12 15 17 1 1 0 4 1 6 0 1 0 (6) Canada 139 11 43 17 0 9235 5 6 0 22 0 1 14 146 56 2 2 49 6 25 40 18 0 86 1 (7) Chile 19 2 2 8 0 39 498 7 0 2 0 0 1 8 12 0 0 4 0 1 0 5 0 14 0 (8) Colombia 4 0 2 21 0 71 16 208 0 3 0 0 0 22 4 0 0 4 0 3 0 3 0 7 0 (9) Czech Republic 4 31 9 1 0 7 0 0 420 8 0 0 11 52 80 2 5 12 0 5 10 14 0 14 0 (10) Denmark 8 6 11 1 1 12 2 0 0 1132 0 1 42 47 74 1 0 4 1 9 4 13 0 20 0 (11) Ecuador 4 0 0 0 0 9 0 8 0 0 14 0 0 1 1 0 0 0 0 0 0 0 0 0 0 (12) Egypt 3 0 0 0 0 9 0 0 0 1 0 234 0 9 5 3 0 7 0 0 0 3 0 5 0 (13) Finland 9 4 7 0 0 28 0 2 0 47 0 0 1053 17 50 0 0 11 0 4 2 8 0 15 0 (14) France 32 20 207 5 0 97 3 0 3 33 0 3 17 10009 296 2 2 40 1 25 24 147 0 99 0 (15) Germany 56 269 62 5 2 88 0 0 17 75 0 3 56 356 6492 9 3 72 1 36 36 142 0 154 0 (16) Greece 2 2 8 0 0 5 1 0 0 3 0 0 4 14 15 361 0 2 0 2 2 5 0 3 0 (17) Hungary 2 22 5 0 0 2 0 0 8 3 0 0 4 27 54 0 128 1 0 2 3 4 0 9 0 (18) India 35 11 13 3 0 35 0 0 0 12 0 2 9 113 119 1 1 4087 1 8 3 32 0 184 0 (19) Indonesia 59 0 1 0 0 10 0 0 1 0 0 0 0 10 9 0 0 16 731 1 0 2 0 77 0 (20) Ireland-Rep 11 4 3 1 0 23 0 0 0 3 0 1 1 33 23 0 0 3 0 467 1 7 0 8 0 (21) Israel 4 0 4 1 0 27 0 0 0 0 0 0 0 16 10 0 0 9 0 6 339 5 0 5 0 (22) Italy 14 51 29 5 1 27 0 0 3 15 0 3 16 237 170 5 3 39 1 8 9 2651 0 57 0 (23) Jamaica 0 0 0 0 0 3 0 0 0 0 0 0 0 0 0 0 0 0 0 0 0 0 7 0 0 (24) Japan 19 0 4 3 0 14 0 0 0 2 0 0 5 43 63 2 0 11 1 5 5 14 8 15895 0 (25) Kenya 1 0 0 0 0 0 0 0 0 0 0 0 0 1 0 0 0 0 0 0 0 0 0 0 26 (26) Luxembourg 5 1 27 0 0 6 0 0 1 1 0 0 0 35 24 0 0 2 0 4 0 13 0 8 0 (27) Malaysia 42 0 1 0 0 11 0 1 0 1 0 0 1 13 16 0 0 14 14 2 0 3 0 98 0 (28) Mexico 22 1 4 15 0 241 3 8 0 4 0 0 2 18 22 0 0 9 0 4 3 8 0 18 0 (29) Netherlands 17 28 121 7 0 29 0 1 3 20 0 0 28 154 196 2 3 27 0 37 17 31 1 55 0 (30) New Zealand 316 0 2 0 0 37 0 0 0 4 0 0 1 10 17 0 0 6 1 0 5 3 0 31 0 (31) Norway 3 10 4 3 0 27 0 0 1 102 0 0 52 38 58 5 1 9 1 4 2 5 0 13 0 (32) Pakistan 0 1 0 0 0 1 0 0 0 1 0 0 0 0 2 0 0 0 0 0 0 0 0 2 1 (33) Peru 22 1 4 15 0 114 30 13 0 2 1 0 0 3 3 0 0 2 0 0 2 0 0 7 0 (34) Philippines 27 1 1 0 0 9 0 0 0 2 0 0 0 1 3 0 0 3 1 1 0 0 0 39 0 (35) Poland 13 29 15 0 0 10 0 0 9 17 0 1 19 67 117 5 4 8 0 4 8 24 0 13 0 (36) Portugal 3 1 5 16 0 10 0 0 0 0 0 0 0 36 14 0 2 3 0 2 0 5 0 8 0 (37) Romania 1 28 6 0 2 3 0 0 5 1 0 0 3 29 19 19 12 4 0 3 5 14 0 5 0 (38) Russian Fed 7 25 14 0 2 33 0 0 8 13 0 0 69 70 120 3 2 6 0 7 8 34 0 34 0 (39) Singapore 88 3 2 0 0 14 0 0 0 3 0 0 4 28 30 0 0 56 33 8 1 13 0 125 0 (40) Slovak Rep 0 2 0 0 0 1 0 0 14 2 0 0 3 7 8 0 0 1 0 0 2 0 0 2 0 (41) S Korea 16 1 5 0 0 10 0 0 0 5 0 0 3 25 31 0 0 5 0 2 3 2 0 127 0 (42) Spain 24 6 44 10 0 52 8 2 4 21 0 3 26 317 154 7 0 22 1 19 12 98 0 50 0 (43) Sri Lanka 2 0 0 0 0 3 0 0 0 0 0 0 0 1 0 0 0 10 1 0 0 0 0 7 0 (44) Sweden 22 9 9 1 0 42 0 0 1 202 0 0 232 69 105 0 0 17 0 12 4 18 0 30 0 (45) Switzerland 14 42 12 2 0 25 0 0 0 15 0 2 10 124 318 0 1 18 0 10 13 38 0 41 0 (46) Thailand 14 0 3 1 1 0 0 0 0 0 0 0 1 7 4 0 0 12 3 0 2 2 0 117 0 (47) Turkey 7 24 10 4 1 20 0 0 6 2 0 3 4 63 56 8 1 14 0 5 2 26 0 36 0 (48) U.K. 268 24 71 8 1 341 1 1 3 59 0 3 31 442 344 5 0 174 2 283 35 108 1 189 0 (49) U.S. 586 62 83 75 4 2684 9 14 6 84 2 7 93 652 616 19 5 383 3 327 221 176 2 982 0 (50) Venezuela 0 0 0 0 0 1 1 1 0 1 1 0 0 0 0 0 0 1 0 0 0 0 0 0 0

54
Table 1 (continued): Number of Mergers by Country Pair
(26) (27) (28) (29) (30) (31) (32) (33) (34) (35) (36) (37) (38) (39) (40) (41) (42) (43) (44) (45) (46) (47) (48) (49) (50) (1) Australia 16 95 2 73 161 20 0 0 13 1 2 0 2 234 0 28 19 0 28 84 27 0 477 977 0 (2) Austria 15 0 3 23 0 3 0 0 0 7 2 1 11 0 1 1 1 0 14 74 0 1 42 79 0 (3) Belgium 33 2 1 175 0 5 0 0 0 1 0 0 6 6 0 3 16 0 32 35 0 1 96 176 0 (4) Brazil 21 3 40 40 4 15 0 3 0 0 46 0 9 16 0 7 89 0 25 80 2 0 130 654 2 (5) Bulgaria 10 0 1 7 0 2 0 0 1 4 0 3 9 0 0 0 0 0 9 9 0 0 23 34 0 (6) Canada 19 14 18 74 6 22 1 7 5 6 2 0 21 22 0 32 14 1 43 80 4 1 316 2423 1 (7) Chile 1 0 4 2 0 1 0 22 0 0 1 0 0 0 0 4 25 0 7 4 0 0 17 66 1 (8) Colombia 2 1 24 3 0 1 0 16 1 0 1 0 0 0 0 1 32 0 5 10 0 0 28 93 3 (9) Czech Republic 29 0 2 59 0 1 0 0 1 25 2 1 15 1 12 5 12 0 19 23 0 0 72 79 0 (10) Denmark 7 1 1 54 1 130 0 0 1 6 1 0 5 7 1 2 3 0 231 27 2 0 117 167 0 (11) Ecuador 0 0 4 1 0 0 0 5 0 0 0 0 0 0 0 0 5 0 0 0 0 0 0 11 1 (12) Egypt 0 1 0 4 0 0 0 0 0 0 0 0 1 1 0 0 1 0 2 1 0 0 22 29 0 (13) Finland 5 0 0 35 0 37 0 0 0 1 1 0 13 3 0 1 9 0 246 9 0 0 135 107 0 (14) France 103 1 1 145 4 25 1 0 0 5 12 0 17 15 0 12 132 0 94 192 6 4 457 822 0 (15) Germany 90 17 8 279 9 48 0 0 1 38 13 1 44 25 1 31 72 0 160 470 7 13 577 1187 0 (16) Greece 4 0 0 5 0 1 0 0 0 1 0 0 6 0 0 1 1 0 3 5 0 2 28 18 0 (17) Hungary 0 0 0 18 0 2 0 0 0 10 0 3 2 1 2 0 0 0 5 13 3 2 33 35 0 (18) India 15 55 2 33 0 18 0 0 2 3 3 0 7 129 2 14 17 6 26 58 5 1 215 837 0 (19) Indonesia 3 103 1 12 0 2 0 0 7 0 0 1 1 207 0 37 3 0 1 8 24 3 51 44 0 (20) Ireland-Rep 10 0 3 23 3 3 0 0 1 1 2 0 5 7 1 0 5 0 11 14 2 1 228 248 0 (21) Israel 6 1 0 6 0 0 0 0 0 0 0 0 7 3 0 2 2 0 4 9 0 1 27 239 0 (22) Italy 80 3 1 77 1 3 1 1 0 4 3 4 26 9 0 12 68 0 32 106 5 7 228 400 0 (23) Jamaica 0 0 3 1 0 0 0 0 0 0 0 0 1 0 0 0 1 0 0 0 0 0 1 1 0 (24) Japan 3 10 0 24 2 3 0 0 0 0 0 0 1 102 1 83 3 0 17 29 12 1 65 526 0 (25) Kenya 0 0 0 1 0 0 0 0 0 0 0 0 0 0 0 0 0 0 0 0 0 0 3 3 0 (26) Luxembourg 41 1 3 10 0 1 0 0 0 4 1 0 2 5 0 5 3 0 9 15 0 0 36 48 0 (27) Malaysia 4 3903 1 10 1 0 0 0 5 0 0 0 3 320 0 15 2 2 3 11 10 1 35 64 0 (28) Mexico 3 1 462 15 1 2 0 1 3 0 2 0 0 3 0 4 54 0 7 9 0 0 35 276 1 (29) Netherlands 32 7 2 2221 5 34 0 0 0 4 2 2 22 18 0 8 33 0 74 60 1 6 252 520 1 (30) New Zealand 4 12 0 15 902 1 0 0 2 0 1 0 2 40 0 3 3 0 3 10 3 0 48 146 0 (31) Norway 12 2 2 40 0 1785 0 0 0 8 1 0 3 23 0 8 6 0 327 18 5 1 145 185 0 (32) Pakistan 0 3 0 4 0 0 45 0 1 0 0 0 0 3 0 1 0 0 0 0 0 1 7 8 0 (33) Peru 0 0 12 5 0 1 0 253 0 0 1 0 2 0 0 3 29 0 1 4 0 0 11 45 0 (34) Philippines 0 15 2 7 0 0 0 0 427 1 0 0 1 36 0 8 0 0 0 2 8 0 10 36 0 (35) Poland 37 2 1 50 0 5 0 0 0 1419 4 2 5 2 3 3 14 0 37 23 1 0 124 160 0 (36) Portugal 12 0 0 12 0 0 0 0 0 0 449 0 1 0 0 0 78 0 4 11 2 2 42 38 0 (37) Romania 2 0 0 23 0 1 0 0 0 18 2 134 6 0 3 2 8 0 6 16 0 4 32 47 0 (38) Russian Fed 35 0 1 149 2 17 0 0 0 24 0 0 10381 7 1 13 11 0 45 71 1 13 135 179 1 (39) Singapore 3 225 0 12 2 13 0 0 5 0 0 0 0 1536 0 11 4 1 9 15 24 0 88 166 0 (40) Slovak Rep 2 0 0 1 0 0 0 0 0 6 0 0 1 0 29 3 0 0 3 2 0 0 6 7 0 (41) S Korea 3 9 2 12 0 2 0 0 0 0 0 0 5 40 0 6339 1 0 15 17 1 0 42 202 0 (42) Spain 42 4 43 89 1 26 0 1 2 11 77 0 9 8 0 6 4432 0 55 80 1 2 318 421 0 (43) Sri Lanka 0 16 0 0 0 0 0 0 0 0 0 0 0 3 0 0 0 159 0 0 1 0 13 3 0 (44) Sweden 18 2 0 123 1 351 0 0 0 5 1 0 7 3 0 3 7 0 3578 52 0 2 241 307 0 (45) Switzerland 22 5 0 40 1 10 0 0 2 7 1 0 24 14 0 5 9 0 46 1980 0 2 114 269 0 (46) Thailand 0 63 0 5 1 1 0 0 0 0 0 0 1 91 0 9 0 1 2 6 1039 0 21 43 0 (47) Turkey 9 10 1 38 0 2 1 0 0 9 4 0 15 12 0 5 19 0 22 26 3 759 68 100 0 (48) U.K. 56 49 4 244 22 69 2 2 13 8 10 0 47 87 1 19 75 0 183 180 31 1 12458 2781 1 (49) U.S. 78 29 105 327 48 94 2 6 36 8 6 0 71 122 0 160 150 3 284 422 19 10 1972 57205 2 (50) Venezuela 0 0 0 0 0 0 0 0 0 0 0 0 3 0 0 0 1 0 0 0 0 0 0 2 53

55
55
Table 2: Descriptive Statistics
Table 2 presents the descriptive statistics for the ordered country pair year analyses. All variables are as defined in Appendix A.
Country pair Observation Sample Descriptives Standard
Variable N Mean Deviation p(25) Median p(75) CBMA_Volume 21,754 0.289 0.713 0.000 0.000 0.216 CBMA_Direction 10,454 49.744 39.434 0.000 50.000 100.000 CBMA_Intermediary 7,600 0.774 0.313 0.667 0.925 1.000 CBMA_Control 7,600 0.113 0.244 0.000 0.000 0.100 CBMA_ErelRep 21,754 1.573 4.341 0.000 0.000 0.641 Diff_Trate_CorpIncTax 21,754 0.088 8.676 -6.000 0.000 6.000 Diff_Trate_Dividends 21,754 3.915 15.780 -10.000 5.000 15.000 Aww_Tterr 21,754 0.226 0.418 0.000 0.000 0.000 Aterr_Tww 21,754 0.222 0.415 0.000 0.000 0.000 Aonly_CFC 21,754 0.221 0.415 0.000 0.000 0.000 Tonly_CFC 21,754 0.231 0.421 0.000 0.000 0.000 Aonly_ThinCap 21,754 0.244 0.429 0.000 0.000 0.000 Tonly_ThinCap 21,754 0.244 0.430 0.000 0.000 0.000 Aonly_TP 21,754 0.147 0.354 0.000 0.000 0.000 Tonly_TP 21,754 0.154 0.361 0.000 0.000 0.000 Tonly_FTC 21,754 0.190 0.392 0.000 0.000 0.000 Aonly_FTC 21,754 0.171 0.376 0.000 0.000 0.000 Tonly_IPBox 21,754 0.121 0.326 0.000 0.000 0.000 Aonly_IPBox 21,754 0.117 0.321 0.000 0.000 0.000 Diff_Xrate 21,754 0.000 0.101 -0.059 0.000 0.059 Diff_RealRI 21,754 -0.001 0.252 -0.156 -0.001 0.154 Diff_DisclosureIndex 21,754 -0.094 3.676 -3.000 0.000 2.000 Diff_Anti_SelfDeal 21,754 -0.006 0.327 -0.224 -0.004 0.211 MaxTrade 21,754 0.019 0.034 0.002 0.006 0.019 Diff_GDP 21,754 -0.047 1.683 -1.229 -0.038 1.120 Diff_GDPgrowth 21,754 0.002 3.572 -2.192 0.012 2.203 GCDist 21,754 7.216 5.035 2.298 7.496 10.298 SameReligion 21,754 0.606 0.489 0.000 1.000 1.000 SameLanguage 21,754 0.038 0.191 0.000 0.000 0.000

56
Table 3: Determinants of Volume of Cross-Border M&A
Table 3 presents the results of the Ordinary Least Squares Regression of model (1) using CBMA_Volume as the dependent variable. Fixed effects are suppressed for brevity. All variables are defined in Appendix A. P-values are presented in parentheses in Column (2). *, **, and *** indicate significance at the 0.10, 0.05, and 0.01 levels, respectively (based on two-tailed tests).
Panel A Pred. (1) (2) VARIABLES Sign Coefficient p-value Diff_Trate_CorpIncTax + 0.003** (0.020) Trate_Dividends - -0.003*** (0.001) Aww_Tterr - -0.016 (0.518) Aterr_Tww + 0.000 (1.000) Aonly_CFC - -0.227*** (0.000) Tonly_CFC + 0.002 (0.911) Aonly_ThinCap ? 0.022 (0.340) Tonly_ThinCap ? -0.010 (0.679) Aonly_TP ? -0.149*** (0.000) Tonly_TP ? 0.004 (0.869) Tonly_FTC - -0.027 (0.487) Aonly_FTC + -0.002 (0.946) Tonly_IPBox ? -0.029 (0.223) Aonly_IPBox ? -0.064 (0.120) Diff_Xrate + 0.035 (0.196) Diff_RealRI - -0.008 (0.583) Diff_DisclosureIndex + -0.011** (0.024) Diff_Anti_SelfDeal - 0.055 (0.410) MaxTrade + 8.415*** (0.000) Diff_GDP + -0.010 (0.290) Diff_GDPgrowth - -0.005*** (0.000) GCDist - -0.021*** (0.000) SameReligion + 0.078*** (0.001) SameLanguage + 0.691*** (0.000) Observations 21,754 Adjusted R-Squared 0.342 Year Fixed Effects YES Acquirer Country Fixed Effects YES Robust SE Clustered by Country-Pair YES

57
Table 3: Determinants of Volume of Cross-Border M&A (cont.)
Panel B VARIABLES (1) (2) (3) (4) (5) (6) Diff_Trate_CorpIncTax + 0.002 0.003* 0.002 0.003* 0.002 0.002 (0.236) (0.062) (0.223) (0.062) (0.239) (0.249) Trate_Dividends - -0.003*** -0.003*** -0.003*** -0.003*** -0.003*** -0.003*** (0.006) (0.003) (0.006) (0.004) (0.005) (0.004) Aww_Tterr - -0.016 (0.460) Aterr_Tww + -0.018 (0.528) Aonly_CFC - -0.240*** (0.000) Tonly_CFC + 0.009 (0.681) Aonly_ThinCap ? -0.001 (0.979) Tonly_ThinCap ? 0.007 (0.789) Aonly_TP ? -0.162*** (0.000) Tonly_TP ? 0.006 (0.803) Tonly_FTC - -0.015 (0.710) Aonly_FTC + -0.032 (0.178) Tonly_IPBox ? -0.018
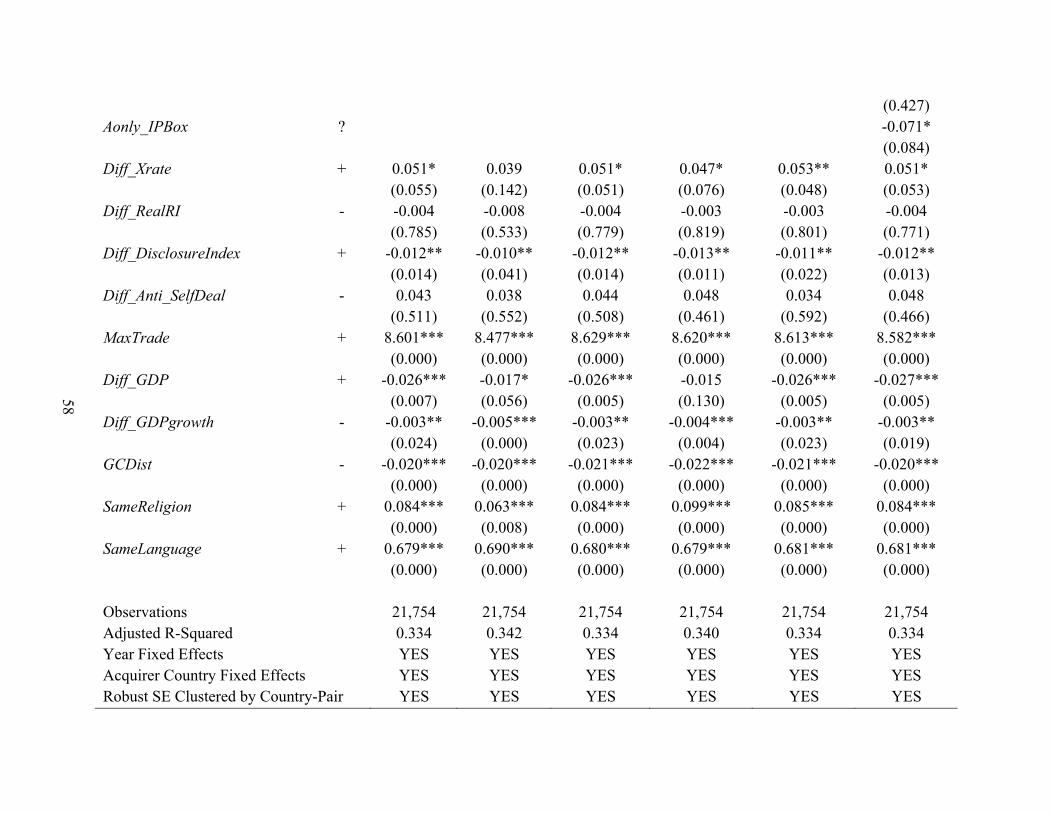
58
(0.427) Aonly_IPBox ? -0.071* (0.084) Diff_Xrate + 0.051* 0.039 0.051* 0.047* 0.053** 0.051*
(0.055) (0.142) (0.051) (0.076) (0.048) (0.053) Diff_RealRI - -0.004 -0.008 -0.004 -0.003 -0.003 -0.004 (0.785) (0.533) (0.779) (0.819) (0.801) (0.771) Diff_DisclosureIndex + -0.012** -0.010** -0.012** -0.013** -0.011** -0.012** (0.014) (0.041) (0.014) (0.011) (0.022) (0.013) Diff_Anti_SelfDeal - 0.043 0.038 0.044 0.048 0.034 0.048 (0.511) (0.552) (0.508) (0.461) (0.592) (0.466) MaxTrade + 8.601*** 8.477*** 8.629*** 8.620*** 8.613*** 8.582*** (0.000) (0.000) (0.000) (0.000) (0.000) (0.000) Diff_GDP + -0.026*** -0.017* -0.026*** -0.015 -0.026*** -0.027*** (0.007) (0.056) (0.005) (0.130) (0.005) (0.005) Diff_GDPgrowth - -0.003** -0.005*** -0.003** -0.004*** -0.003** -0.003** (0.024) (0.000) (0.023) (0.004) (0.023) (0.019) GCDist - -0.020*** -0.020*** -0.021*** -0.022*** -0.021*** -0.020*** (0.000) (0.000) (0.000) (0.000) (0.000) (0.000) SameReligion + 0.084*** 0.063*** 0.084*** 0.099*** 0.085*** 0.084*** (0.000) (0.008) (0.000) (0.000) (0.000) (0.000) SameLanguage + 0.679*** 0.690*** 0.680*** 0.679*** 0.681*** 0.681*** (0.000) (0.000) (0.000) (0.000) (0.000) (0.000) Observations 21,754 21,754 21,754 21,754 21,754 21,754 Adjusted R-Squared 0.334 0.342 0.334 0.340 0.334 0.334 Year Fixed Effects YES YES YES YES YES YES Acquirer Country Fixed Effects YES YES YES YES YES YES Robust SE Clustered by Country-Pair YES YES YES YES YES YES

59
Table 4: Determinants of Volume of Cross-Border M&A by Acquirer Country Tax Regime
Table 4 presents the results of the Ordinary Least Squares Regression of model (1) using Seemingly Unrelated Regression, where each observation is an ordered country pair year. Column (1) includes all observations in which the acquirer country is worldwide, while Column (2) includes all observations in which the acquirer country is territorial. Column (3) presents t-tests of differences across the two specifications. Fixed effects are suppressed for brevity. All variables are defined in Appendix A. P-values are presented in parentheses below each coefficient. *, **, and *** indicate significance at the 0.10, 0.05, and 0.01 levels, respectively (based on two-tailed tests). (1) (2) (3) Worldwide Territorial VARIABLES CBMA_Volumet Difference Diff_Trate_CorpIncTax 0.002** 0.004*** -0.002 (0.049) (0.000) (0.4598) Trate_Dividends -0.002 -0.004** 0.002 (0.178) (0.013) (0.2872) T_WW 0.003 0.011 -0.008 (0.824) (0.490) (0.8318) Aonly_CFC -0.164*** -0.208*** 0.044 (0.000) (0.000) (0.6383) Tonly_CFC -0.014 0.002 -0.016 (0.308) (0.903) (0.6981) Aonly_ThinCap 0.017 0.022 -0.005 (0.277) (0.163) (0.9052) Tonly_ThinCap -0.003 0.014 -0.017 (0.824) (0.439) (0.7187) Aonly_TP -0.137*** -0.170*** 0.033 (0.000) (0.000) (0.4520) Tonly_TP 0.018 -0.010 0.028 (0.387) (0.736) (0.5612) Tonly_FTC -0.041 -0.025 -0.016 (0.200) (0.320) (0.7931) Aonly_FTC -0.004 -0.021 0.017 (0.824) (0.274) (0.7161) Tonly_IPBox -0.022 -0.022 0.000 (0.204) (0.239) (0.9985) Aonly_IPBox -0.075 -0.001 -0.074 (0.183) (0.966) (0.4266)

60
Diff_Xrate 0.077 -0.019 0.096* (0.111) (0.759) (0.0767) Diff_RealRI
-0.000
-0.017
0.017
(1.000) (0.499) (0.5281) Diff_DisclosureIndex -0.006* -0.014*** 0.008 (0.056) (0.000) (0.3532) Diff_Anti_SelfDeal -0.122*** 0.134*** -0.256** (0.001) (0.001) (0.0313) MaxTrade 4.295*** 10.668*** -6.373*** (0.000) (0.000) (0.0001) Diff_GDP 0.018*** -0.018*** -0.036** (0.001) (0.006) (0.0344) Diff_GDPgrowth -0.003 -0.007*** 0.004* (0.134) (0.001) (0.0786) GCDist -0.022*** -0.020*** -0.002 (0.000) (0.000) (0.7217) SameReligion 0.064*** 0.082*** -0.018 (0.000) (0.000) (0.7050) SameLanguage 0.682*** 0.730*** -0.048 (0.000) (0.000) (0.8047) Observations 9,253 12,501 Adjusted R-Squared 0.275 0.387 Year Fixed Effects YES YES Acquirer Country Fixed Effects YES YES

61
Table 5: Determinants of Direction of Cross-Border M&A
Table 5 presents the results of the Ordinary Least Squares Regression of model (1) using CBMA_Direction as the dependent variable. Each observation is an ordered country pair year. Fixed effects are suppressed for brevity. All variables are defined in Appendix A. P-values are presented in parentheses in Column (2). *, **, and *** indicate significance at the 0.10, 0.05, and 0.01 levels, respectively (based on two-tailed tests).
Panel A Pred. (1) (2) VARIABLES Sign Coefficient p-value Diff_Trate_CorpIncTax + 0.740*** (0.000) Diff_Trate_Dividends - -0.246*** (0.000) Aww_Tterr - -2.793* (0.061) Aterr_Tww + 1.282 (0.336) Aonly_CFC - -7.457*** (0.000) Tonly_CFC + 7.748*** (0.000) Aonly_ThinCap ? -7.557*** (0.000) Tonly_ThinCap ? 7.530*** (0.000) Aonly_TP ? 3.094** (0.021) Tonly_TP ? -2.468 (0.274) Tonly_FTC - -2.567 (0.383) Aonly_FTC + 3.086** (0.035) Tonly_IPBox ? 0.208 (0.863) Aonly_IPBox ? 0.000 (1.000) Diff_Xrate ? -5.288* (0.096) Diff_RealRI ? 4.890*** (0.001) Diff_DisclosureIndex ? -1.223*** (0.000) Diff_Anti_SelfDeal ? 17.109*** (0.000) MaxTrade + 18.556 (0.167) Diff_GDP + 12.009*** (0.000) Diff_GDPgrowth - 0.167 (0.184) Observations 10,454 Adjusted R-Squared 0.377 Year Fixed Effects YES Acquirer Country Fixed Effects YES Robust SE Clustered by Country-Pair YES

62
Table 5: Determinants of Direction of Cross-Border M&A (cont.)
Panel B VARIABLES (1) (2) (3) (4) (5) (6) Diff_Trate_CorpIncTax + 0.589*** 0.722*** 0.627*** 0.591*** 0.586*** 0.582*** (0.000) (0.000) (0.000) (0.000) (0.000) (0.000) Diff_Trate_Dividends - -0.266*** -0.289*** -0.232*** -0.265*** -0.266*** -0.260*** (0.000) (0.000) (0.000) (0.000) (0.000) (0.000) Aww_Tterr - -0.196 (0.897) Aterr_Tww + -1.332 (0.316) Aonly_CFC - -7.832*** (0.000) Tonly_CFC + 8.124*** (0.000) Aonly_ThinCap ? -7.217*** (0.000) Tonly_ThinCap ? 7.469*** (0.000) Aonly_TP ? 0.250 (0.856) Tonly_TP ? -2.130 (0.349) Tonly_FTC - 2.887 (0.308) Aonly_FTC + -2.878** (0.024)

63
Tonly_IPBox ? -1.975 (0.121) Aonly_IPBox ? 1.272 (0.447) Diff_Xrate ? -4.302 -5.236* -4.785 -4.066 -4.054 -4.307
(0.172) (0.097) (0.129) (0.195) (0.197) (0.171) Diff_RealRI ? 5.760*** 5.534*** 5.043*** 5.818*** 5.747*** 5.723*** (0.000) (0.000) (0.001) (0.000) (0.000) (0.000) Diff_DisclosureIndex ? -1.470*** -1.133*** -1.544*** -1.457*** -1.373*** -1.507*** (0.000) (0.000) (0.000) (0.000) (0.000) (0.000) Diff_Anti_SelfDeal ? 20.471*** 18.028*** 19.822*** 20.529*** 20.038*** 21.527*** (0.000) (0.000) (0.000) (0.000) (0.000) (0.000) MaxTrade + 19.967 21.220 22.430 21.776 23.122* 21.846 (0.160) (0.117) (0.103) (0.124) (0.099) (0.126) Diff_GDP + 11.311*** 12.194*** 11.307*** 11.182*** 11.082*** 11.036*** (0.000) (0.000) (0.000) (0.000) (0.000) (0.000) Diff_GDPgrowth - 0.438*** 0.264** 0.293** 0.450*** 0.435*** 0.456*** (0.000) (0.035) (0.020) (0.000) (0.001) (0.000) Observations 10,454 10,454 10,454 10,454 10,454 10,454 Adjusted R-Squared 0.360 0.369 0.370 0.360 0.361 0.361 Year Fixed Effects YES YES YES YES YES YES Acquirer Country Fixed Effects YES YES YES YES YES YES Robust SE Clustered by Country-Pair YES YES YES YES YES YES

64
Table 6: Determinants of Direction of Cross-Border M&A by Acquirer Country Tax Regime
Table 6 presents the results of the Ordinary Least Squares Regression of model (1) using Seemingly Unrelated Regression, where each observation is an ordered country pair year. Column (1) includes all observations in which the acquirer country is worldwide, while Column (2) includes all observations in which the acquirer country is territorial. Column (3) presents t-tests of differences across the two specifications. Fixed effects are suppressed for brevity. All variables are defined in Appendix A. P-values are presented in parentheses below each coefficient. *, **, and *** indicate significance at the 0.10, 0.05, and 0.01 levels, respectively (based on two-tailed tests). (1) (2) (3) Worldwide Territorial VARIABLES CBMA_Directionet Difference Diff_Trate_CorpIncTax 0.670*** 0.741*** -0.071 (0.000) (0.000) (0.6559) Diff_Trate_Dividends -0.196*** -0.260*** 0.064 (0.002) (0.000) (0.5423) T_WW 3.156** -0.509 3.665 (0.023) (0.647) (0.1195) Aonly_CFC -8.163*** -7.178*** -0.985 (0.000) (0.000) (0.7326) Tonly_CFC 7.856*** 7.353*** 0.503 (0.000) (0.000) (0.8474) Aonly_ThinCap -7.098*** -7.880*** 0.782 (0.000) (0.000) (0.7727) Tonly_ThinCap 9.474*** 6.174*** 3.3 (0.000) (0.000) (0.1817) Aonly_TP 3.704** 3.098** 0.606 (0.048) (0.013) (0.8336) Tonly_TP -3.187 -4.247 1.06 (0.176) (0.145) (0.8210) Tonly_FTC 16.105*** -3.552* 19.657** (0.004) (0.053) (0.0226) Aonly_FTC 3.827** 2.518** 1.309 (0.017) (0.048) (0.6504) Tonly_IPBox -0.457 0.348 -0.805 (0.781) (0.773) (0.9336) Aonly_IPBox -0.191 0.357 -0.548 (0.973) (0.810) (0.7463)

65
Diff_Xrate -2.763 -6.202 3.439 (0.584) (0.150) (0.5938) Diff_RealRI 2.604 5.994*** -3.39 (0.255) (0.003) (0.2665) Diff_DisclosureIndex -1.552*** -1.010*** -0.542 (0.000) (0.000) (0.3717) Diff_Anti_SelfDeal 15.844*** 16.637*** -0.793 (0.000) (0.000) (0.8976) MaxTrade -20.272 39.435*** -59.707** (0.215) (0.001) (0.0242) Diff_GDP 11.456*** 12.875*** -1.419 (0.000) (0.000) (0.2442) Diff_GDPgrowth 0.339* 0.006 0.333 (0.085) (0.971) (0.1959) Observations 3,967 6,487 Adjusted R-Squared 0.362 0.378 Year Fixed Effects YES YES Acquirer Country Fixed Effects YES YES

66
Table 7: Descriptive Statistics
Table 7 presents the descriptive statistics for the country year analyses. All variables are as defined in Appendix A.
Country year Observation Sample Descriptives Standard
Variable N Mean Deviation p(25) Median p(75) CL_TVolume 469.000 1.366 1.646 0.535 0.830 1.471 CL_AVolume 469.000 1.139 3.221 0.267 0.486 0.875 CL_Direction 469.000 0.392 0.196 0.221 0.403 0.554 Trate_CorpIncTax 469.000 25.089 6.166 20.000 25.000 30.000 WW 469.000 0.469 0.500 0.000 0.000 1.000 CFC 469.000 0.333 0.472 0.000 0.000 1.000 ThinCap 469.000 0.497 0.501 0.000 0.000 1.000 TP 469.000 0.821 0.384 1.000 1.000 1.000 FTC 469.000 0.774 0.419 1.000 1.000 1.000 IPBox 469.000 0.136 0.344 0.000 0.000 0.000 Xrate 469.000 0.003 0.098 -0.061 0.011 0.064 RealRI 469.000 0.092 0.267 -0.041 0.109 0.251 DisclosureIndex 469.000 6.533 2.613 5.000 7.000 8.000 Anti_SelfDeal 469.000 0.467 0.231 0.283 0.429 0.642 GDP 469.000 9.749 1.202 8.964 10.034 10.746 GDPgrowth 469.000 1.714 3.063 0.250 1.700 3.607

67
Table 8: Determinants of Volume of Cross-Border M&A
Table 8 presents the results of the Ordinary Least Squares Regression of model (3) using CL_TVolume as the dependent variable. Each observation is a country year. Fixed effects are suppressed for brevity. All variables are defined in Appendix A. P-values are presented in parentheses in Column (2). *, **, and *** indicate significance at the 0.10, 0.05, and 0.01 levels, respectively (based on two-tailed tests).
Panel A: Target Perspective Pred. (1) (2) VARIABLES Sign Coefficient p-value Trate_CorpIncTax - -0.007** (0.012) WW + 0.076 (0.109) CFC ? -0.014 (0.800) ThinCap ? 0.058 (0.135) TP ? -0.042 (0.366) FTC - -0.114* (0.072) IPBox ? 0.111* (0.086) Xrate ? 0.003 (0.974) RealRI ? 0.038 (0.347) DisclosureIndex ? 0.011 (0.324) Anti_SelfDeal ? -0.225* (0.095) GDP - -0.021 (0.366) GDPgrowth + 0.001 (0.858) Observations 469 Adjusted R-Squared 0.203 Year Fixed Effects YES Country Fixed Effects NO Robust SE Clustered by Country YES
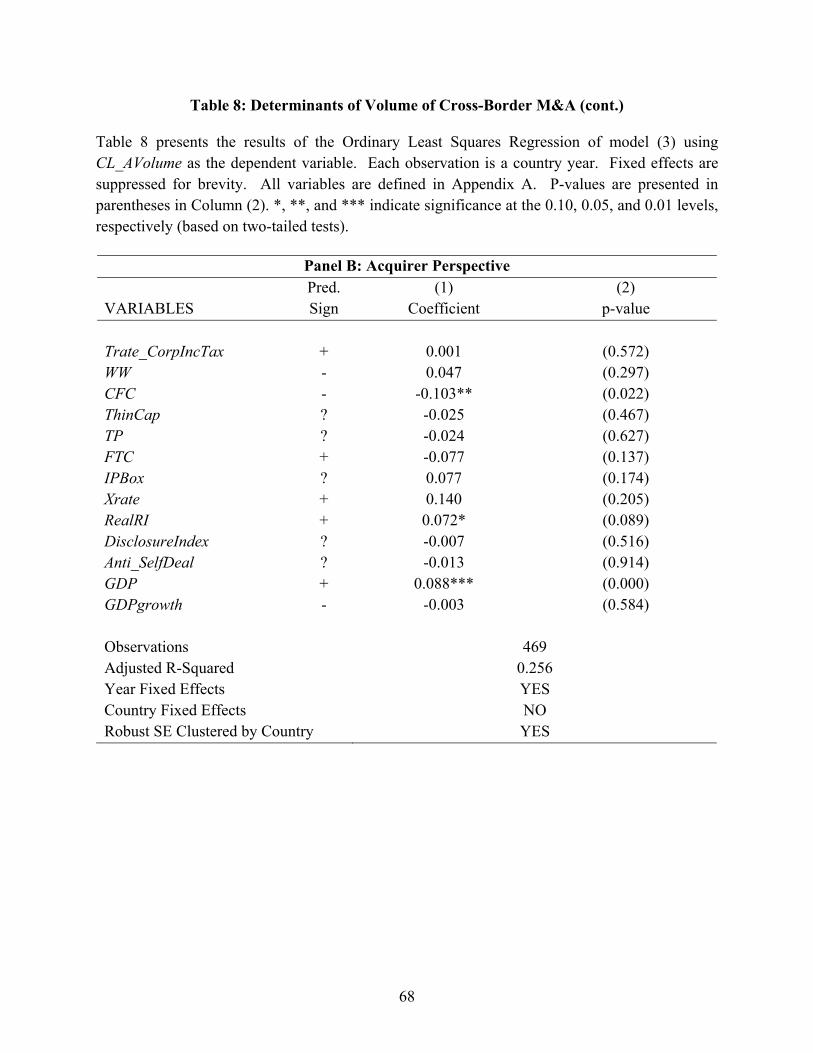
68
Table 8: Determinants of Volume of Cross-Border M&A (cont.)
Table 8 presents the results of the Ordinary Least Squares Regression of model (3) using CL_AVolume as the dependent variable. Each observation is a country year. Fixed effects are suppressed for brevity. All variables are defined in Appendix A. P-values are presented in parentheses in Column (2). *, **, and *** indicate significance at the 0.10, 0.05, and 0.01 levels, respectively (based on two-tailed tests).
Panel B: Acquirer Perspective Pred. (1) (2) VARIABLES Sign Coefficient p-value Trate_CorpIncTax + 0.001 (0.572) WW - 0.047 (0.297) CFC - -0.103** (0.022) ThinCap ? -0.025 (0.467) TP ? -0.024 (0.627) FTC + -0.077 (0.137) IPBox ? 0.077 (0.174) Xrate + 0.140 (0.205) RealRI + 0.072* (0.089) DisclosureIndex ? -0.007 (0.516) Anti_SelfDeal ? -0.013 (0.914) GDP + 0.088*** (0.000) GDPgrowth - -0.003 (0.584) Observations 469 Adjusted R-Squared 0.256 Year Fixed Effects YES Country Fixed Effects NO Robust SE Clustered by Country YES

69
Table 9: Determinants of Direction of Cross-Border M&A
Table 9 presents the results of the Ordinary Least Squares Regression of model (3) using CL_Direction as the dependent variable. Each observation is a country year. Fixed effects are suppressed for brevity. All variables are defined in Appendix A. P-values are presented in parentheses in Column (2). *, **, and *** indicate significance at the 0.10, 0.05, and 0.01 levels, respectively (based on two-tailed tests).
Pred. (1) (2) VARIABLES Sign Coefficient p-value Trate_CorpIncTax + 0.008*** (0.004) WW - -0.004 (0.903) CFC - -0.104*** (0.004) ThinCap ? -0.061** (0.046) TP ? 0.025 (0.469) FTC + 0.016 (0.709) IPBox ? -0.005 (0.896) Xrate + 0.143 (0.268) RealRI + 0.035 (0.301) DisclosureIndex ? -0.012 (0.196) Anti_SelfDeal ? 0.164* (0.095) GDP + 0.119*** (0.000) GDPgrowth - -0.001 (0.620) Observations 469 Adjusted R-Squared 0.528 Year Fixed Effects YES Country Fixed Effects NO Robust SE Clustered by Country YES

70
Table 10: Determinants of Obtaining Control in Cross-Border M&A
Table 10 presents the results of the Ordinary Least Squares Regression of model (2) using CBMA_Control as the dependent variable. Each observation is an ordered country pair year. Fixed effects are suppressed for brevity. All variables are defined in Appendix A. P-values are presented in parentheses in Column (2). *, **, and *** indicate significance at the 0.10, 0.05, and 0.01 levels, respectively (based on two-tailed tests).
(1) (2) VARIABLES Coefficient p-value Diff_Trate_CorpIncTax 0.001** (0.050) Diff_Trate_Dividends -0.000 (0.517) Aww_Tterr -0.001 (0.946) Aterr_Tww -0.015 (0.223) Aonly_CFC -0.042*** (0.001) Tonly_CFC 0.047*** (0.000) Aonly_ThinCap -0.011 (0.358) Tonly_ThinCap 0.029*** (0.010) Aonly_TP -0.018 (0.183) Tonly_TP -0.014 (0.643) Tonly_FTC -0.030 (0.219) Aonly_FTC 0.039*** (0.003) Tonly_IPBox 0.019 (0.134) Aonly_IPBox -0.012 (0.411) Diff_Xrate 0.001 (0.970) Diff_RealRI 0.004 (0.836) Diff_DisclosureIndex 0.000 (0.972) Diff_Anti_SelfDeal -0.011 (0.689) MaxTrade -0.134 (0.252) Diff_GDP -0.019*** (0.000) Diff_GDPgrowth -0.000 (0.819) GCDist -0.002 (0.141) SameReligion 0.029* (0.051) SameLanguage 0.023 (0.190) Observations 7,600 Adjusted R-Squared 0.060 Year Fixed Effects YES Acquirer Country Fixed Effects YES Robust SE Clustered by Country YES

71
Table 11: Determinants of the use of an Intermediary in Cross-Border M&A
Table 11 presents the results of the Ordinary Least Squares Regression of model (2) using CBMA_Intermediary as the dependent variable. Each observation is an ordered country pair year. Fixed effects are suppressed for brevity. All variables are defined in Appendix A. P-values are presented in parentheses in Column (2). *, **, and *** indicate significance at the 0.10, 0.05, and 0.01 levels, respectively (based on two-tailed tests).
(1) (2) VARIABLES Coefficient p-value Diff_Trate_CorpIncTax 0.000 (0.390) Diff_Trate_Dividends 0.000 (0.611) Aww_Tterr 0.017 (0.108) Aterr_Tww -0.020** (0.031) Aonly_CFC -0.003 (0.656) Tonly_CFC -0.015 (0.108) Aonly_ThinCap -0.014* (0.094) Tonly_ThinCap -0.001 (0.880) Aonly_TP 0.013 (0.210) Tonly_TP -0.010 (0.569) Tonly_FTC -0.022 (0.157) Aonly_FTC 0.012 (0.232) Tonly_IPBox -0.003 (0.762) Aonly_IPBox -0.013 (0.266) Diff_Xrate 0.009 (0.772) Diff_RealRI 0.025* (0.094) Diff_DisclosureIndex -0.001 (0.618) Diff_Anti_SelfDeal 0.033 (0.101) MaxTrade -0.487*** (0.000) Diff_GDP 0.017*** (0.000) Diff_GDPgrowth 0.001 (0.231) GCDist 0.003*** (0.001) SameReligion -0.029*** (0.005) SameLanguage -0.039*** (0.000) Observations 7,600 Adjusted R-Squared 0.053 Year Fixed Effects YES Acquirer Country Fixed Effects YES Robust SE Clustered by Country YES
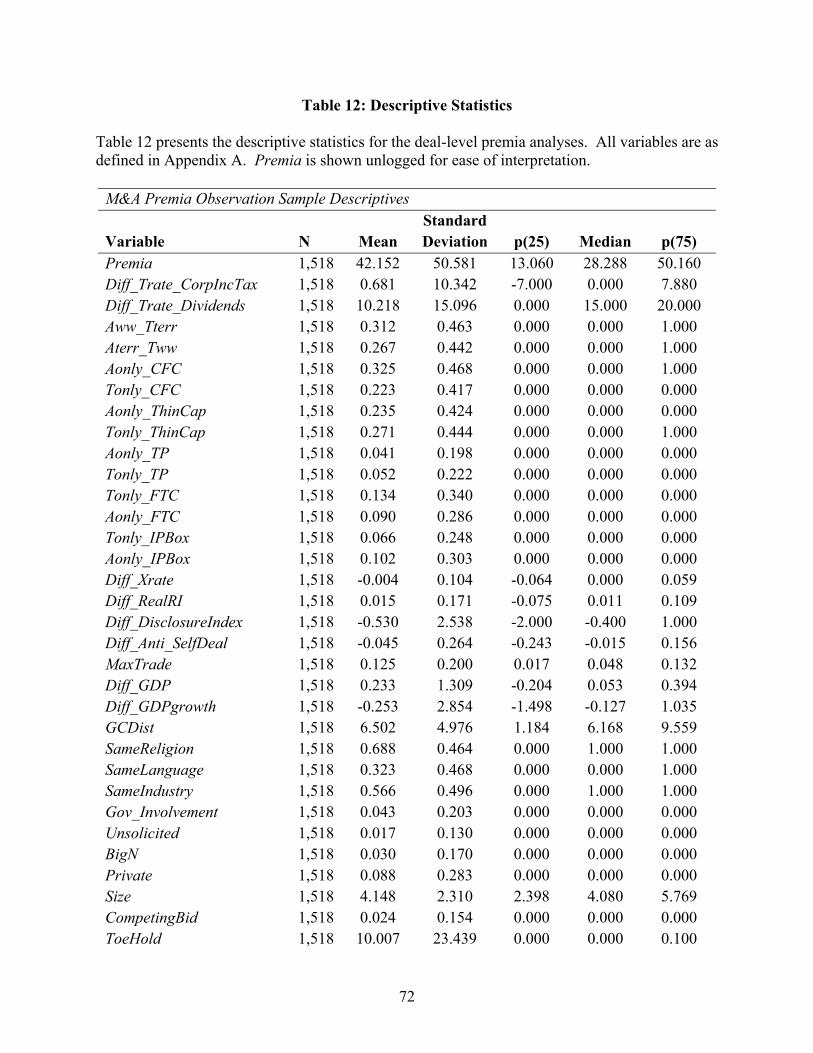
72
Table 12: Descriptive Statistics
Table 12 presents the descriptive statistics for the deal-level premia analyses. All variables are as defined in Appendix A. Premia is shown unlogged for ease of interpretation.
M&A Premia Observation Sample Descriptives Standard
Variable N Mean Deviation p(25) Median p(75) Premia 1,518 42.152 50.581 13.060 28.288 50.160 Diff_Trate_CorpIncTax 1,518 0.681 10.342 -7.000 0.000 7.880 Diff_Trate_Dividends 1,518 10.218 15.096 0.000 15.000 20.000 Aww_Tterr 1,518 0.312 0.463 0.000 0.000 1.000 Aterr_Tww 1,518 0.267 0.442 0.000 0.000 1.000 Aonly_CFC 1,518 0.325 0.468 0.000 0.000 1.000 Tonly_CFC 1,518 0.223 0.417 0.000 0.000 0.000 Aonly_ThinCap 1,518 0.235 0.424 0.000 0.000 0.000 Tonly_ThinCap 1,518 0.271 0.444 0.000 0.000 1.000 Aonly_TP 1,518 0.041 0.198 0.000 0.000 0.000 Tonly_TP 1,518 0.052 0.222 0.000 0.000 0.000 Tonly_FTC 1,518 0.134 0.340 0.000 0.000 0.000 Aonly_FTC 1,518 0.090 0.286 0.000 0.000 0.000 Tonly_IPBox 1,518 0.066 0.248 0.000 0.000 0.000 Aonly_IPBox 1,518 0.102 0.303 0.000 0.000 0.000 Diff_Xrate 1,518 -0.004 0.104 -0.064 0.000 0.059 Diff_RealRI 1,518 0.015 0.171 -0.075 0.011 0.109 Diff_DisclosureIndex 1,518 -0.530 2.538 -2.000 -0.400 1.000 Diff_Anti_SelfDeal 1,518 -0.045 0.264 -0.243 -0.015 0.156 MaxTrade 1,518 0.125 0.200 0.017 0.048 0.132 Diff_GDP 1,518 0.233 1.309 -0.204 0.053 0.394 Diff_GDPgrowth 1,518 -0.253 2.854 -1.498 -0.127 1.035 GCDist 1,518 6.502 4.976 1.184 6.168 9.559 SameReligion 1,518 0.688 0.464 0.000 1.000 1.000 SameLanguage 1,518 0.323 0.468 0.000 0.000 1.000 SameIndustry 1,518 0.566 0.496 0.000 1.000 1.000 Gov_Involvement 1,518 0.043 0.203 0.000 0.000 0.000 Unsolicited 1,518 0.017 0.130 0.000 0.000 0.000 BigN 1,518 0.030 0.170 0.000 0.000 0.000 Private 1,518 0.088 0.283 0.000 0.000 0.000 Size 1,518 4.148 2.310 2.398 4.080 5.769 CompetingBid 1,518 0.024 0.154 0.000 0.000 0.000 ToeHold 1,518 10.007 23.439 0.000 0.000 0.100

73
Table 13: Determinants of Merger Premia Cross-Border M&A
Table 13 presents the results of the Ordinary Least Squares Regression of model (5) using Log_Premia as the dependent variable. Each observation is a M&A transaction. Fixed effects are suppressed for brevity. All variables are defined in Appendix A. P-values are presented in parentheses in Column (2). *, **, and *** indicate significance at the 0.10, 0.05, and 0.01 levels, respectively (based on two-tailed tests).
(1) (2) VARIABLES Coefficient p-value Diff_Trate_CorpIncTax 0.001 (0.861) Diff_Trate_Dividends -0.002 (0.604) Aww_Tterr 0.119 (0.193) Aterr_Tww 0.226** (0.017) Aonly_CFC -0.009 (0.935) Tonly_CFC 0.080 (0.423) Aonly_ThinCap -0.003 (0.980) Tonly_ThinCap 0.071 (0.470) Aonly_TP -0.401** (0.043) Tonly_TP 0.060 (0.686) Tonly_FTC -0.047 (0.665) Aonly_FTC -0.126 (0.434) Tonly_IPBox 0.065 (0.716) Aonly_IPBox -0.004 (0.973) Diff_Xrate 0.195 (0.536) Diff_RealRI 0.233 (0.300) Diff_DisclosureIndex 0.011 (0.644) Diff_Anti_SelfDeal -0.418* (0.089) MaxTrade 0.202** (0.036) Diff_GDP -0.160 (0.111) Diff_GDPgrowth -0.005 (0.595) GCDist 0.231 (0.443) SameReligion -0.047 (0.205) SameLanguage -0.007 (0.682) SameIndustry 0.180*** (0.008) Gov_Involvement -0.275 (0.108) Unsolicited 0.501*** (0.002) BigN -0.040 (0.797) Private -0.171 (0.345) Size 0.179 (0.106)
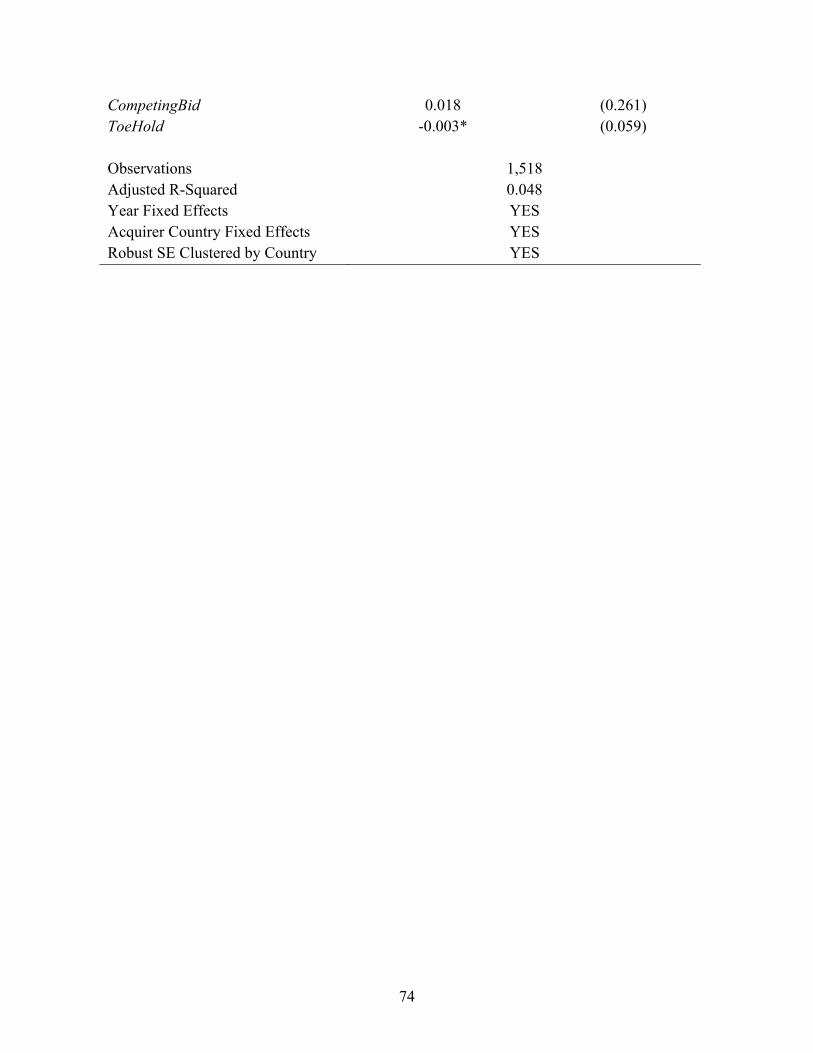
74
CompetingBid 0.018 (0.261) ToeHold -0.003* (0.059) Observations 1,518 Adjusted R-Squared 0.048 Year Fixed Effects YES Acquirer Country Fixed Effects YES Robust SE Clustered by Country YES

75
Appendix 2: Extension of Erel et al. (2012)
This table presents the results of the Ordinary Least Squares Regression of model (2) using CBMA_Erel as the dependent variable. Fixed effects are suppressed for brevity. All variables are defined in Appendix A. P-values are presented in parentheses in Column (2). *, **, and *** indicate significance at the 0.10, 0.05, and 0.01 levels, respectively (based on two-tailed tests).
Panel A Pred. (1) (2) VARIABLES Sign Coefficient p-value Diff_Trate_CorpIncTax + 0.045*** (0.000) Diff_Trate_Dividends - -0.018*** (0.000) Aww_Tterr - -0.067 (0.587) Aterr_Tww + 0.014 (0.927) Aonly_CFC - 0.329* (0.090) Tonly_CFC + -0.479*** (0.000) Aonly_ThinCap ? -0.100 (0.390) Tonly_ThinCap ? 0.009 (0.935) Aonly_TP ? -0.403*** (0.006) Tonly_TP ? 0.183** (0.042) Tonly_FTC - -0.151 (0.402) Aonly_FTC + 0.034 (0.804) Tonly_IPBox ? 0.500*** (0.001) Aonly_IPBox ? -0.387 (0.115) Diff_Xrate + 0.130 (0.527) Diff_RealRI - -0.071 (0.411) Diff_DisclosureIndex + -0.087*** (0.002) Diff_Anti_SelfDeal - 1.074*** (0.000) MaxTrade + 44.443*** (0.000) Diff_GDP + 0.183*** (0.002) Diff_GDPgrowth - -0.022*** (0.004) GCDist + -0.071*** (0.000) SameReligion + 0.679*** (0.000) SameLanguage + 1.571*** (0.000) Observations 21,754 Adjusted R-Squared 0.398 Year Fixed Effects YES Acquirer Country Fixed Effects YES Robust SE Clustered by Country-Pair YES

76
Appendix 2: Extension of Erel et al. (2012) (cont.)
Panel B VARIABLES (1) (2) (3) (4) (5) (6) Diff_Trate_CorpIncTax + 0.044*** 0.040*** 0.044*** 0.047*** 0.045*** 0.047*** (0.000) (0.000) (0.000) (0.000) (0.000) (0.000) Diff_Trate_Dividends - -0.017*** -0.017*** -0.018*** -0.018*** -0.018*** -0.018*** (0.000) (0.000) (0.000) (0.000) (0.000) (0.000) Aww_Tterr - -0.026 (0.821) Aterr_Tww + -0.068 (0.640) Aonly_CFC - 0.267 (0.168) Tonly_CFC + -0.429*** (0.000) Aonly_ThinCap ? -0.007 (0.954) Tonly_ThinCap ? -0.112 (0.304) Aonly_TP ? -0.343** (0.021) Tonly_TP ? 0.161* (0.062) Tonly_FTC - -0.283 (0.110) Aonly_FTC + 0.166 (0.162) Tonly_IPBox ? 0.463*** (0.001)
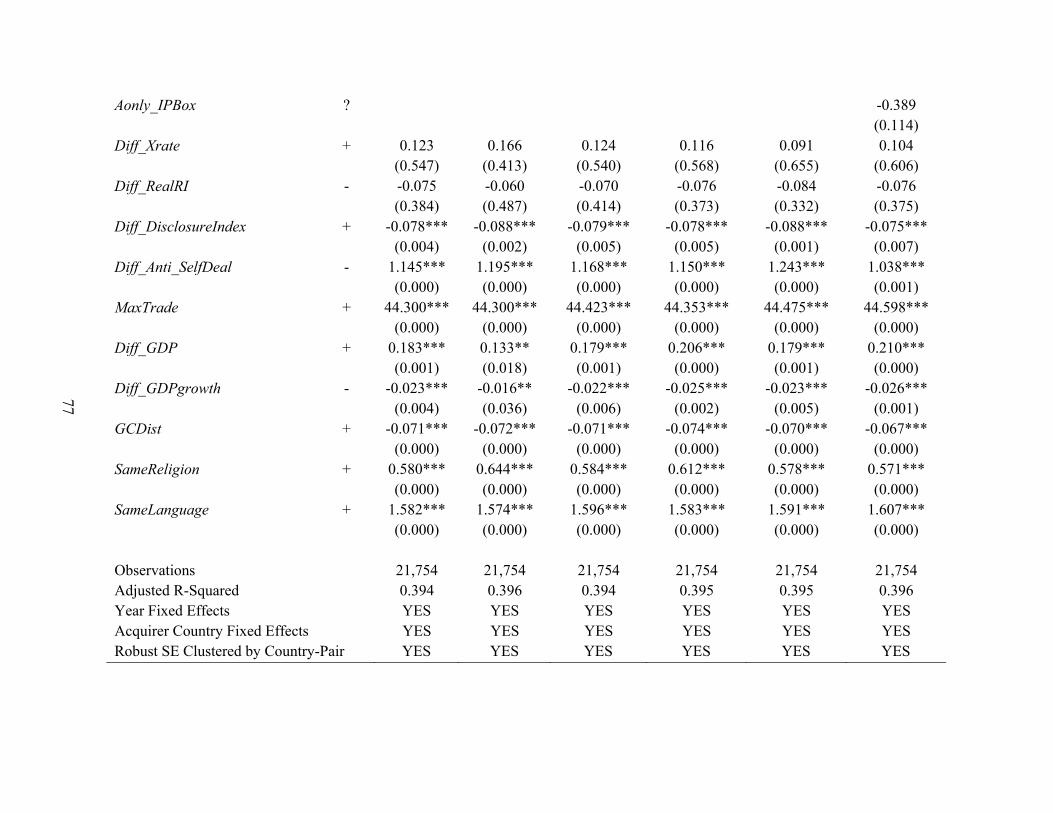
77
Aonly_IPBox ? -0.389 (0.114) Diff_Xrate + 0.123 0.166 0.124 0.116 0.091 0.104
(0.547) (0.413) (0.540) (0.568) (0.655) (0.606) Diff_RealRI - -0.075 -0.060 -0.070 -0.076 -0.084 -0.076 (0.384) (0.487) (0.414) (0.373) (0.332) (0.375) Diff_DisclosureIndex + -0.078*** -0.088*** -0.079*** -0.078*** -0.088*** -0.075*** (0.004) (0.002) (0.005) (0.005) (0.001) (0.007) Diff_Anti_SelfDeal - 1.145*** 1.195*** 1.168*** 1.150*** 1.243*** 1.038*** (0.000) (0.000) (0.000) (0.000) (0.000) (0.001) MaxTrade + 44.300*** 44.300*** 44.423*** 44.353*** 44.475*** 44.598*** (0.000) (0.000) (0.000) (0.000) (0.000) (0.000) Diff_GDP + 0.183*** 0.133** 0.179*** 0.206*** 0.179*** 0.210*** (0.001) (0.018) (0.001) (0.000) (0.001) (0.000) Diff_GDPgrowth - -0.023*** -0.016** -0.022*** -0.025*** -0.023*** -0.026*** (0.004) (0.036) (0.006) (0.002) (0.005) (0.001) GCDist + -0.071*** -0.072*** -0.071*** -0.074*** -0.070*** -0.067*** (0.000) (0.000) (0.000) (0.000) (0.000) (0.000) SameReligion + 0.580*** 0.644*** 0.584*** 0.612*** 0.578*** 0.571*** (0.000) (0.000) (0.000) (0.000) (0.000) (0.000) SameLanguage + 1.582*** 1.574*** 1.596*** 1.583*** 1.591*** 1.607*** (0.000) (0.000) (0.000) (0.000) (0.000) (0.000) Observations 21,754 21,754 21,754 21,754 21,754 21,754 Adjusted R-Squared 0.394 0.396 0.394 0.395 0.395 0.396 Year Fixed Effects YES YES YES YES YES YES Acquirer Country Fixed Effects YES YES YES YES YES YES Robust SE Clustered by Country-Pair YES YES YES YES YES YES