the effect of strategic orientation on green supply chain
TRANSCRIPT

Research Article, ISSN 2304-2613 (Print); ISSN 2305-8730 (Online)
Copyright © CC-BY-NC 2014, Asian Business Consortium | ABR Page 59
The Effect of Strategic Orientation on Green Supply Chain
Practices and Performance: A Case of Manufacturing
Companies in Pakistan
Kawish Nadeem1*, Danish Ahmed Siddiqui2
1Research Scholar, Karachi University Business School, University of Karachi, PAKISTAN 2Associate Professor, Karachi University Business School, University of Karachi, PAKISTAN
*E-mail for correspondence: [email protected]
Received: Dec 08, 2017 Published: Jan 15, 2018
https://doi.org/10.18034/abr.v7i2.12
ABSTRACT
The aim of this study is to find out the direct impact of competence of strategic supply chain orientation, strategic environmental orientation and institutional pressure on Green Supply Chain Management (GSCM) and to overall performance. The data gathered from executives of 66 manufacturing firms of Pakistan. On the one hand, the relationship between strategic orientations of the environment, supply chain, institutional pressure, and adoption of GSCM practices is examined on the other hand GSCM practices, and its relationship with performance measures including Customer Effectiveness, Environmental Differentiation, Economic Performance, Operational Efficiency and Social Performance is examined. The Smart PLS software is used to compute content validity, convergent validity, discriminant validity, and predictive relevance model. The companies in Pakistan are less oriented towards environment and supply chain. However, due to the pressure from institutes, they are persuaded to adopt GSCM practices in their operations, which eventually boost their performance. The outcome of GSCM practices results in saving the environment, creating a better social image, cost reduction and profitability which would enable managers to be able to know strategic orientations (both environmental and SCM) rather than depending on the issues of institutional pressures and monitoring directions of strategies for Green SCM. Key words: Green Supply Chain, strategic orientations, institutional pressure, operational efficiency, customer effectiveness, social and economic performance, environmental differentiation
INTRODUCTION
A supply chain management system for managing environment in the shape of green supply chain management (GSCM) has acquired fame among manufacturers in the anticipations of resolving their environmental issues while getting operational performance benefits (Zhu et al., 2008; Svensson, 2007). Manufacturing of goods by a process which utilizes minimum energy is known as green manufacturing or supply chain management. Organization’s strategic orientations are pre-requisites for green supply chain management, which in the result, enhances organizational performance (Kirchoff et al., 2016). Managers of SC must be aware of the vital role of organization’s strategic orientations, such as environmental orientation and supply chain orientation, to monitor and direct the
strategic dimensions of green supply chain management practices, instead of responding to external pressure.
The basis of our research is dependent on majorly three theories namely Resource based theory (RBT), strategic choice theory (SCT) and Institutional Theory of Pressure (IP). Supply Chain Orientation (SCO) is found as an internal philosophy of supply chain management that gives priority to the relationships between supply chain bases (Min et al., 2007). Environmental Orientation (EO) firms actively make the reconfiguration of manufacturing practices to decrease the effects of the environment of manufacturer’s operations and production of goods (Menon and Menon, 1997). Therefore, the importance of green SCM practices is associated with SCO and an EO which must pertain to a performance result. Further, a range of stakeholder and institutional pressures are
Nadeem and Siddiqui: The Effect of Strategic Orientation on Green Supply Chain Practices and Performance: A Case of Manufacturing Companies in Pakistan (59-70)
Page 60 Asian Business Review ● Volume 7 ●Number 2/2017
essential to the forces which get industries to approach and apply GSCM related processes (Tate etal., 2010).
In recent decade, with the advancement of green supply chain management (GSCM) as the intra and inter-organization management of the up-flow and down-flow of supply chain, consist the potential to reduce the total impact of environment. Strategic green orientation drives innovation and joints inter-firm innovation steps that are taken to confirm outcomes of performance by mean of better design of the product, integration of supply chain and production processes. With the development of several mega-developments like intensifying societal issues regarding environmental corrosion and regulators' eye watch over manufacturing processes, recently, organizations are increasingly forced to act in a manner oriented towards environment (Banerjee, Iyer, & Kashyap, 2003).
Recently, the government of Pakistan’s stricken laws for protecting the environment in perspective of increasing global warming has bound manufacturing firms to follow Green Supply Chain Practices (GCSM). Now, both national and multinational companies are obliged to adopt green practices. Further, the legitimacy social have also compelled organizations to implement green practices.
Strategic choice theory (SCT) is also presented to materialize the phenomenon and irradiate the requirement to consequently adapt and prioritize strategic potential about to relate to supply chain system to address internal and external conditions which are changing (Child, 1997; Child et al., 2003).
Thus, the purpose of the recent research is to address the role of organizational environmental orientation, economic orientation and institutional pressure as the potential for the development and application of valuable green SCM practices leading to firm performance.
THEORETICAL FRAMEWORK AND HYPOTHESIS
DEVELOPMENT
The primary concentration of this research is on green supply chain management is towards the operational domains of supply chain management, such as supply and procurement management (Carter and Dresner, 2001). When considering strategic competences, operational practices are specific to their scope. This study has begun to coordinate green practices all across many internal business entities and different chains of customers and suppliers, highlighting these systems as strategic competences which are more tactical and hard to emulate (Sarkis, 2012).
Resource based theory is the basis of our research. This theory states that when orientations of organizations are towards developing their strategies regarding positive development in their business-related practices, then they adopt Green SCM practices (Sirmon et al., 2007).
Supply Chain Orientation and Green SCM Adoption
Supply chain orientation (SCO) is known as a philosophy of supply chain management that classifies relationships between supply chain tiers. Moreover, SCO lives between operational domains of the organization, forming a firm-wide concentration on links of the supply chain (Min and Mentzer, 2004).
Resource based theory further recommends that the importance of Supply chain orientation as a strategic competence falls in its capability to make firm processes that pursue organizations to classify relationships of the supply chain (Kozlenkova et al., 2014).
H1 The capability of strategic SCO directly and positively influences Green SCM adoption.
Environmental Orientation and Green SCM
An environmental orientation (EO) is the recognition by management of the significance of concerns about environment confronting their business entities (Banerjee et al., 2003, p. 106). Firms orientated towards environment proactively bring the reconfiguration of organizational practices to minimize the environmental effects of organization’s products and operations
(Menon and Menon, 1997).
H2 The capability of strategic EO directly and positively influences Green SCM adoption.
Institutional Pressure and Green SCM
The theory of institutional pressure provides a proper roadmap for knowing green supply chain management with the perspective of external elements which influence the implementation of specific practices of supply chain management. New rules and regulations are made around the globe including developed and developing countries that bound the organization to develop environmental friendly supply chain system. (Lewis and Gertsakis, 2001). Here, we present the below hypothesis with perspective of present literature.
H3 Institutional pressure has a positive impact on the adoption of Green SCM practices.
Green SCM and Performance Measure
The most important aspect of resource based theory of RBT is that different capabilities support to describe differences in competitiveness and performance (Crook et al., 2008).
Green SCM and Operational Efficiency
Operational efficiencies obtained from practices of green SCM covers inventory carrying costs, reduced waste, reduced cycle time, less inventory and total low supply chain costs by lean practices and environmental management in design, production, and logistics (Carter and Rogers, 2008; Golicic and Smith, 2013).
H4(a) The Green SCM strategic capability directly and positively influences the operational efficiency of a firm.

Research Article, ISSN 2304-2613 (Print); ISSN 2305-8730 (Online)
Copyright © CC-BY-NC 2014, Asian Business Consortium | ABR Page 61
Green SCM and Customer Effectiveness
Customer effectiveness enhances by practices of green SCM in the domain of timely product availability that fulfill specific environmental standards, items fulfillment of those orders, and higher levels of customer service (Golicic and Smith, 2013).
H4(b) The Green SCM strategic capability directly and positively influences customer effectiveness of a firm
Green SCM and Social Performance
Social performance of an organization is the collection of theories of social responsibilities, social responsiveness programs, processes, and actual results as these pertain to societal associations of firms. This concept supports the application of practices of the green supply chain which presents social performance as resultant (Younis et al., 2016).
H4(c) The Green SCM strategic capability directly and positively influences social performance.
Green SCM and Economic Performance
Steps taken for supply chain can bring best results with economic perspectives. Mollenkopf and Closs (2005) have represented four different ways that affirms acquiring of financial benefits from reverse logistics. Firstly, the items would developed by following environment and social responsibilities that help making economic values. Secondly, generation of high revenue from sales of recycled, reproduced and reprocessed products and replacement of low selling items with fresh items. Thirdly, the cost efficiency that improves profitability by reducing operating expenses and cost of goods sold and lastly better material management by optimizing inventory returns and assets turnover ratio.
H4(d) The Green SCM strategic capability directly and positively influences economic performance.
Environmental Differentiation
The fifth performance outcome of green SCM is differentiation related to the environment. Environmental differentiation concentrates on developing organization’s importance by recognition of best practices as a kind of competitive differentiation and benchmarking (Fugate et al., 2010).
H4(e) The Green SCM strategic capability directly and positively influences the environmental differentiation of a firm.
RESEARCH METHODOLOGY
The study which we are undertaking is applied research which is wholly pursuing to know the effect of strategic orientation on green supply chain practices and performance in manufacturing companies of Pakistan. This study is supported and grounded on statically gathered and analyzed data.
Population targeted for the gathering of data is the professionals belonging to different industries of manufacturing sectors in Pakistan having a background of production engineers, supply chain management experts, business analysts and other concern people directly involved in planning and execution of production system of their industry along with its alignment to the environmental friendly process.
Sample size in our study is 66 based on “Non-Random Purposive Sampling Technique” due to specific characteristics of the population and due to the objective of the study (Black, K. 2010). Here purposive sample is heterogenous due to a diverse range of people. This sampling technique provides deeper insight into the issue.
Collection of primary data exercised by the self-administered survey conducted through a questionnaire. In this perspective, five points likert scale ranging from strongly disagree (1) to strongly agree (5) has been administered to measure the answers or seek the agreements or disagreements of the participants on a symmetric agree-disagree scale for a range of items incorporated in the questionnaire regarding the variables.
Statistical Techniques
We used Structural Modelling Equation (SEM) in Smart PLS 3 and computed PLS algorithm, bootstrapping and blindfolding run for 66 samples to estimate the structural model with model measurement.
Figure 1: The research Framework
Nadeem and Siddiqui: The Effect of Strategic Orientation on Green Supply Chain Practices and Performance: A Case of Manufacturing Companies in Pakistan (59-70)
Page 62 Asian Business Review ● Volume 7 ●Number 2/2017
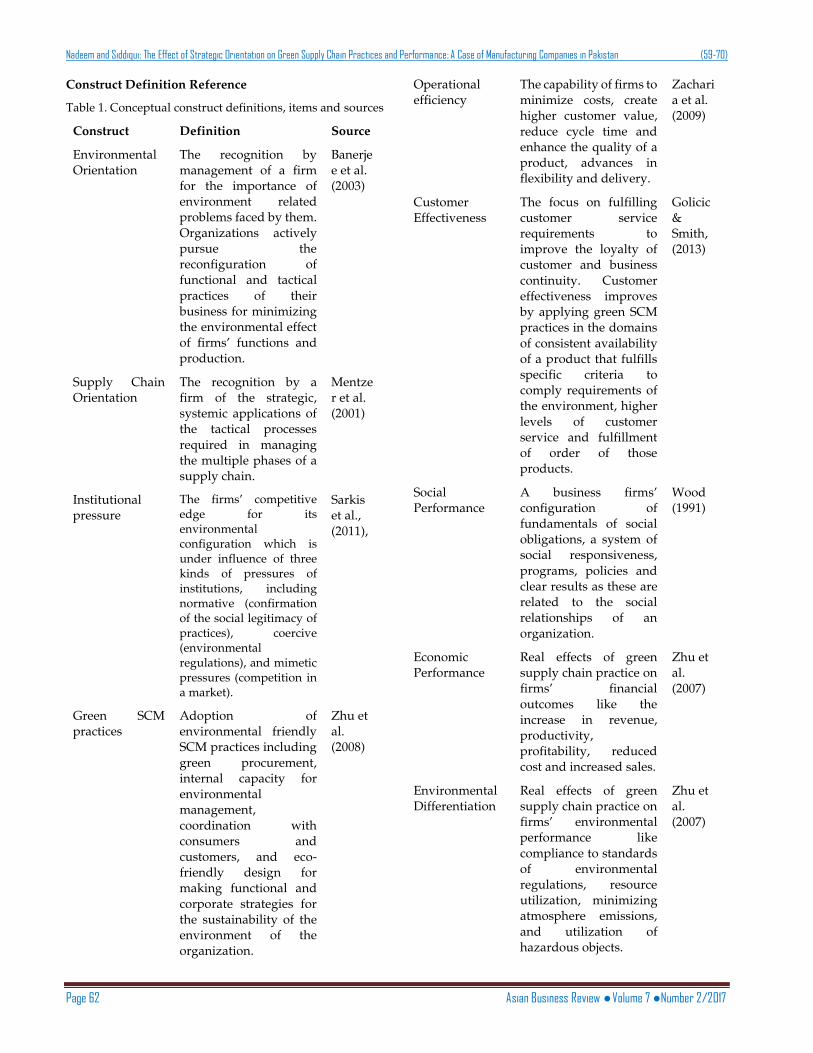
Construct Definition Reference
Table 1. Conceptual construct definitions, items and sources
Construct Definition Source
Environmental Orientation
The recognition by management of a firm for the importance of environment related problems faced by them. Organizations actively pursue the reconfiguration of functional and tactical practices of their business for minimizing the environmental effect of firms’ functions and production.
Banerjee et al. (2003)
Supply Chain Orientation
The recognition by a firm of the strategic, systemic applications of the tactical processes required in managing the multiple phases of a supply chain.
Mentzer et al. (2001)
Institutional pressure
The firms’ competitive edge for its environmental configuration which is under influence of three kinds of pressures of institutions, including normative (confirmation of the social legitimacy of practices), coercive (environmental regulations), and mimetic pressures (competition in a market).
Sarkis et al., (2011),
Green SCM practices
Adoption of environmental friendly SCM practices including green procurement, internal capacity for environmental management, coordination with consumers and customers, and eco-friendly design for making functional and corporate strategies for the sustainability of the environment of the organization.
Zhu et al. (2008)
Operational efficiency
The capability of firms to minimize costs, create higher customer value, reduce cycle time and enhance the quality of a product, advances in flexibility and delivery.
Zacharia et al. (2009)
Customer Effectiveness
The focus on fulfilling customer service requirements to improve the loyalty of customer and business continuity. Customer effectiveness improves by applying green SCM practices in the domains of consistent availability of a product that fulfills specific criteria to comply requirements of the environment, higher levels of customer service and fulfillment of order of those products.
Golicic & Smith, (2013)
Social Performance
A business firms’ configuration of fundamentals of social obligations, a system of social responsiveness, programs, policies and clear results as these are related to the social relationships of an organization.
Wood (1991)
Economic Performance
Real effects of green supply chain practice on firms’ financial outcomes like the increase in revenue, productivity, profitability, reduced cost and increased sales.
Zhu et al. (2007)
Environmental Differentiation
Real effects of green supply chain practice on firms’ environmental performance like compliance to standards of environmental regulations, resource utilization, minimizing atmosphere emissions, and utilization of hazardous objects.
Zhu et al. (2007)
Research Article, ISSN 2304-2613 (Print); ISSN 2305-8730 (Online)
Copyright © CC-BY-NC 2014, Asian Business Consortium | ABR Page 63
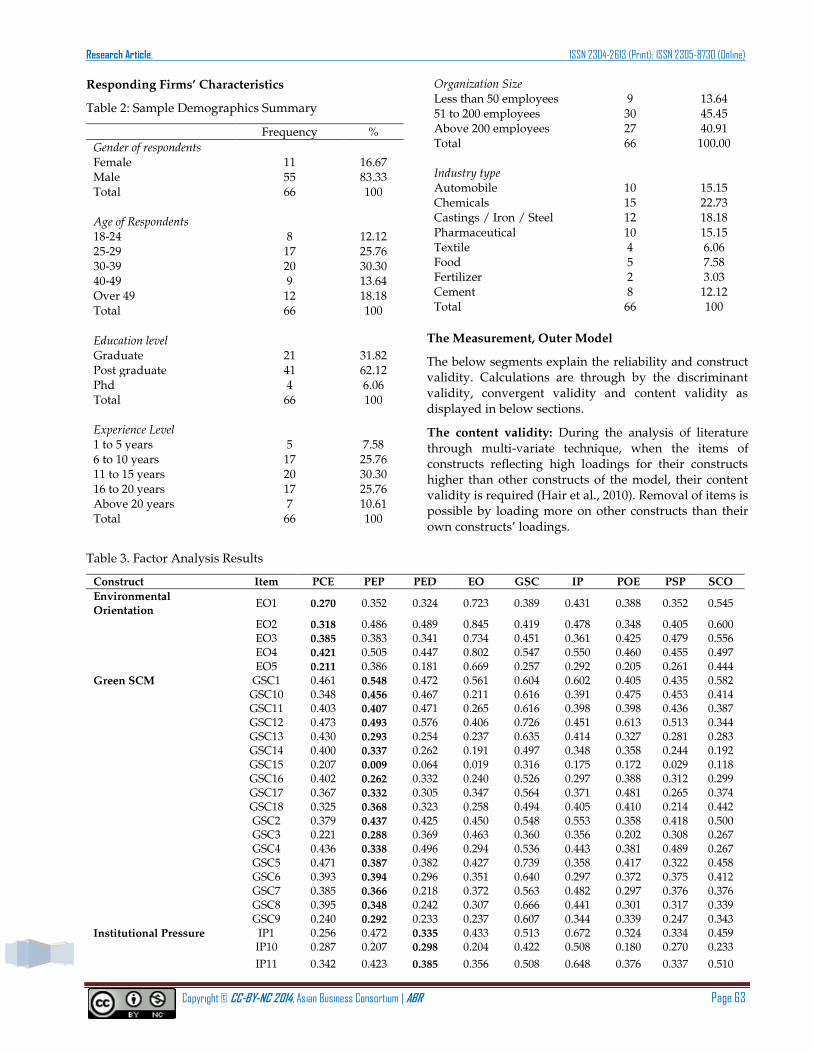
Responding Firms’ Characteristics
Table 2: Sample Demographics Summary
Frequency %
Gender of respondents Female 11 16.67 Male 55 83.33 Total 66 100
Age of Respondents 18-24 8 12.12 25-29 17 25.76 30-39 20 30.30 40-49 9 13.64 Over 49 12 18.18 Total 66 100
Education level Graduate 21 31.82 Post graduate 41 62.12 Phd 4 6.06 Total 66 100
Experience Level 1 to 5 years 5 7.58 6 to 10 years 17 25.76 11 to 15 years 20 30.30 16 to 20 years 17 25.76 Above 20 years 7 10.61 Total 66 100
Organization Size Less than 50 employees 9 13.64 51 to 200 employees 30 45.45 Above 200 employees 27 40.91 Total 66 100.00
Industry type Automobile 10 15.15 Chemicals 15 22.73 Castings / Iron / Steel 12 18.18 Pharmaceutical 10 15.15 Textile 4 6.06 Food 5 7.58 Fertilizer 2 3.03 Cement 8 12.12 Total 66 100
The Measurement, Outer Model
The below segments explain the reliability and construct validity. Calculations are through by the discriminant validity, convergent validity and content validity as displayed in below sections.
The content validity: During the analysis of literature through multi-variate technique, when the items of constructs reflecting high loadings for their constructs higher than other constructs of the model, their content validity is required (Hair et al., 2010). Removal of items is possible by loading more on other constructs than their own constructs’ loadings.
Table 3. Factor Analysis Results
Construct Item PCE PEP PED EO GSC IP POE PSP SCO
Environmental
Orientation EO1 0.270 0.352 0.324 0.723 0.389 0.431 0.388 0.352 0.545
EO2 0.318 0.486 0.489 0.845 0.419 0.478 0.348 0.405 0.600 EO3 0.385 0.383 0.341 0.734 0.451 0.361 0.425 0.479 0.556 EO4 0.421 0.505 0.447 0.802 0.547 0.550 0.460 0.455 0.497 EO5 0.211 0.386 0.181 0.669 0.257 0.292 0.205 0.261 0.444 Green SCM GSC1 0.461 0.548 0.472 0.561 0.604 0.602 0.405 0.435 0.582 GSC10 0.348 0.456 0.467 0.211 0.616 0.391 0.475 0.453 0.414 GSC11 0.403 0.407 0.471 0.265 0.616 0.398 0.398 0.436 0.387 GSC12 0.473 0.493 0.576 0.406 0.726 0.451 0.613 0.513 0.344 GSC13 0.430 0.293 0.254 0.237 0.635 0.414 0.327 0.281 0.283 GSC14 0.400 0.337 0.262 0.191 0.497 0.348 0.358 0.244 0.192 GSC15 0.207 0.009 0.064 0.019 0.316 0.175 0.172 0.029 0.118 GSC16 0.402 0.262 0.332 0.240 0.526 0.297 0.388 0.312 0.299 GSC17 0.367 0.332 0.305 0.347 0.564 0.371 0.481 0.265 0.374 GSC18 0.325 0.368 0.323 0.258 0.494 0.405 0.410 0.214 0.442 GSC2 0.379 0.437 0.425 0.450 0.548 0.553 0.358 0.418 0.500 GSC3 0.221 0.288 0.369 0.463 0.360 0.356 0.202 0.308 0.267 GSC4 0.436 0.338 0.496 0.294 0.536 0.443 0.381 0.489 0.267 GSC5 0.471 0.387 0.382 0.427 0.739 0.358 0.417 0.322 0.458 GSC6 0.393 0.394 0.296 0.351 0.640 0.297 0.372 0.375 0.412 GSC7 0.385 0.366 0.218 0.372 0.563 0.482 0.297 0.376 0.376 GSC8 0.395 0.348 0.242 0.307 0.666 0.441 0.301 0.317 0.339 GSC9 0.240 0.292 0.233 0.237 0.607 0.344 0.339 0.247 0.343 Institutional Pressure IP1 0.256 0.472 0.335 0.433 0.513 0.672 0.324 0.334 0.459 IP10 0.287 0.207 0.298 0.204 0.422 0.508 0.180 0.270 0.233
IP11 0.342 0.423 0.385 0.356 0.508 0.648 0.376 0.337 0.510

Nadeem and Siddiqui: The Effect of Strategic Orientation on Green Supply Chain Practices and Performance: A Case of Manufacturing Companies in Pakistan (59-70)
Page 64 Asian Business Review ● Volume 7 ●Number 2/2017
IP2 0.042 0.302 0.322 0.449 0.426 0.655 0.170 0.320 0.360 IP3 -0.003 0.253 0.126 0.336 0.212 0.569 0.041 0.194 0.398 IP4 -0.077 0.061 0.067 0.178 0.188 0.473 -0.036 0.136 0.290 IP5 0.259 0.453 0.249 0.292 0.429 0.513 0.336 0.284 0.417 IP6 0.211 0.276 0.292 0.452 0.482 0.674 0.326 0.340 0.345 IP7 0.136 0.288 0.188 0.279 0.325 0.532 0.324 0.035 0.486 IP8 0.230 0.239 0.282 0.314 0.356 0.586 0.384 0.132 0.451 IP9 0.324 0.407 0.444 0.321 0.437 0.583 0.245 0.422 0.301 Customer Effectiveness PCE1 0.590 0.201 0.191 0.305 0.296 0.119 0.393 0.386 0.150 PCE2 0.734 0.387 0.376 0.244 0.395 0.223 0.478 0.529 0.192 PCE3 0.713 0.355 0.342 0.437 0.415 0.257 0.502 0.500 0.331 PCE4 0.791 0.452 0.534 0.371 0.558 0.224 0.523 0.616 0.284 PCE5 0.769 0.436 0.414 0.237 0.524 0.258 0.542 0.415 0.301 PCE6 0.717 0.647 0.622 0.332 0.579 0.393 0.500 0.603 0.368 Environmental
Differentiation PED1 0.633 0.670 0.899 0.465 0.612 0.512 0.583 0.635 0.462
PED2 0.455 0.662 0.903 0.517 0.544 0.443 0.431 0.593 0.527 PED3 0.528 0.652 0.888 0.336 0.533 0.374 0.491 0.602 0.396 Economic Performance PEP1 0.457 0.784 0.548 0.372 0.414 0.316 0.368 0.347 0.354 PEP2 0.434 0.837 0.579 0.441 0.462 0.539 0.444 0.495 0.430 PEP3 0.453 0.845 0.583 0.515 0.586 0.534 0.554 0.519 0.536 PEP4 0.570 0.726 0.629 0.415 0.577 0.403 0.433 0.701 0.391 PEP5 0.509 0.810 0.598 0.482 0.495 0.355 0.490 0.638 0.432 PEP6 0.380 0.698 0.515 0.403 0.448 0.441 0.449 0.475 0.483 Operational Efficiency POE1 0.486 0.467 0.456 0.375 0.558 0.413 0.875 0.428 0.432 POE2 0.547 0.445 0.455 0.404 0.531 0.326 0.796 0.360 0.448 POE3 0.471 0.478 0.493 0.347 0.515 0.448 0.640 0.546 0.291 POE4 0.592 0.437 0.433 0.429 0.503 0.351 0.819 0.485 0.375 POE5 0.495 0.390 0.251 0.346 0.376 0.112 0.620 0.340 0.269 Social Performance PSP1 0.517 0.529 0.486 0.441 0.449 0.319 0.506 0.756 0.326 PSP2 0.506 0.579 0.533 0.479 0.489 0.394 0.421 0.801 0.419 PSP3 0.587 0.576 0.582 0.492 0.492 0.298 0.455 0.795 0.339 PSP4 0.664 0.593 0.571 0.358 0.548 0.437 0.521 0.821 0.337 PSP5 0.526 0.424 0.510 0.330 0.431 0.377 0.352 0.772 0.287 Supply Chain
Orientation SCO1 0.105 0.257 0.152 0.413 0.243 0.331 0.224 0.163 0.525
SCO10 0.040 0.100 0.224 0.282 0.218 0.369 0.185 0.181 0.278
SCO2 0.334 0.454 0.454 0.594 0.438 0.415 0.379 0.427 0.714
SCO3 0.319 0.405 0.397 0.606 0.548 0.517 0.363 0.267 0.714 SCO4 0.325 0.364 0.367 0.344 0.379 0.408 0.250 0.215 0.680
SCO5 0.290 0.339 0.288 0.321 0.361 0.380 0.268 0.239 0.697
SCO6 0.238 0.251 0.215 0.316 0.393 0.378 0.389 0.107 0.709
SCO7 0.279 0.403 0.280 0.429 0.449 0.409 0.319 0.264 0.608
SCO8 0.188 0.379 0.392 0.541 0.368 0.389 0.263 0.423 0.626
SCO9 0.207 0.458 0.386 0.462 0.466 0.513 0.354 0.391 0.645
Table 4. Factor Loadings Significant
Construct Item Loadings Standard Error T Value P Value
EO1 0.723 0.061 11.765 0.000 Environmental Orientation EO2 0.845 0.048 17.560 0.000 EO3 0.734 0.075 9.843 0.000 EO4 0.802 0.057 14.044 0.000 EO5 0.669 0.111 6.049 0.000 Green SCM GSC1 0.604 0.095 6.386 0.000 GSC10 0.616 0.081 7.587 0.000 GSC11 0.616 0.090 6.877 0.000 GSC12 0.726 0.059 12.253 0.000 GSC13 0.635 0.110 5.756 0.000 GSC14 0.497 0.131 3.791 0.000 GSC15 0.316 0.126 2.511 0.012 GSC16 0.526 0.118 4.475 0.000
GSC17 0.564 0.096 5.894 0.000
Research Article, ISSN 2304-2613 (Print); ISSN 2305-8730 (Online)
Copyright © CC-BY-NC 2014, Asian Business Consortium | ABR Page 65
GSC18 0.494 0.096 5.128 0.000 GSC2 0.548 0.124 4.403 0.000 GSC3 0.360 0.127 2.831 0.005 GSC4 0.536 0.133 4.030 0.000 GSC5 0.739 0.057 12.878 0.000 GSC6 0.640 0.089 7.189 0.000 GSC7 0.563 0.076 7.417 0.000 GSC8 0.666 0.075 8.854 0.000 GSC9 0.607 0.082 7.356 0.000 Institutional Pressure IP1 0.672 0.072 9.387 0.000
IP10 0.508 0.152 3.340 0.001 IP11 0.648 0.084 7.700 0.000 IP2 0.655 0.092 7.104 0.000 IP3 0.569 0.100 5.667 0.000 IP4 0.473 0.141 3.342 0.001 IP5 0.513 0.106 4.855 0.000 IP6 0.674 0.084 8.003 0.000 IP7 0.532 0.095 5.592 0.000 IP8 0.586 0.083 7.052 0.000 IP9 0.583 0.134 4.336 0.000 Customer Effectiveness PCE1 0.590 0.160 3.699 0.000 PCE2 0.734 0.108 6.777 0.000 PCE3 0.713 0.103 6.926 0.000 PCE4 0.791 0.047 17.011 0.000 PCE5 0.769 0.056 13.738 0.000 PCE6 0.717 0.059 12.093 0.000 Environmental Differentiation PED1 0.899 0.034 26.535 0.000 PED2 0.903 0.036 25.340 0.000
PED3 0.888 0.042 21.256 0.000 Economic Performance PEP1 0.784 0.060 13.157 0.000 PEP2 0.837 0.042 19.961 0.000 PEP3 0.845 0.036 23.784 0.000 PEP4 0.726 0.069 10.569 0.000 PEP5 0.810 0.052 15.633 0.000 PEP6 0.698 0.063 11.073 0.000 POE1 0.875 0.027 32.064 0.000 Operational Efficiency POE2 0.796 0.049 16.112 0.000 POE3 0.640 0.080 7.978 0.000 POE4 0.819 0.051 16.153 0.000 POE5 0.620 0.086 7.176 0.000 PSP1 0.756 0.072 10.486 0.000 Social Performance PSP2 0.801 0.066 12.130 0.000 PSP3 0.795 0.081 9.860 0.000 PSP4 0.821 0.038 21.550 0.000 PSP5 0.772 0.105 7.327 0.000 Supply Chain Orientation SCO1 0.525 0.111 4.733 0.000 SCO10 0.278 0.157 1.772 0.077 SCO2 0.714 0.054 13.249 0.000 SCO3 0.714 0.070 10.143 0.000 SCO4 0.680 0.113 6.011 0.000 SCO5 0.697 0.105 6.623 0.000 SCO6 0.709 0.089 7.953 0.000 SCO7 0.608 0.087 7.010 0.000 SCO8 0.626 0.088 7.115 0.000 SCO9 0.645 0.078 8.225 0.000
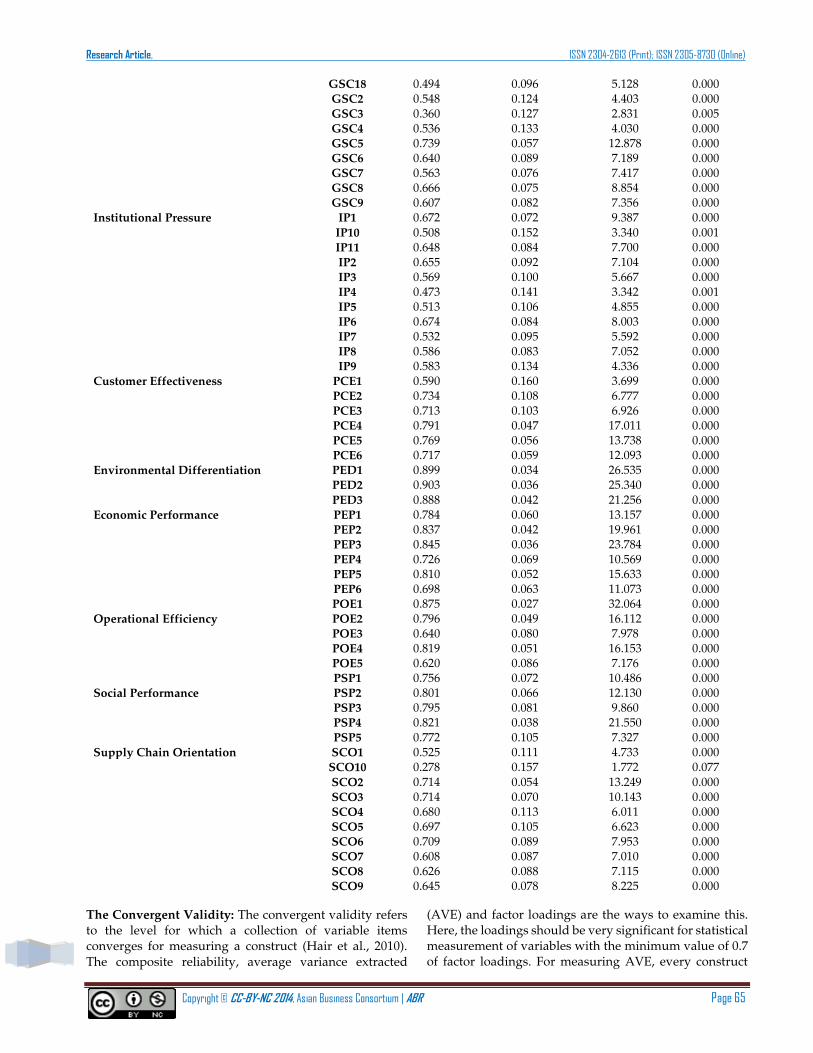
The Convergent Validity: The convergent validity refers to the level for which a collection of variable items converges for measuring a construct (Hair et al., 2010). The composite reliability, average variance extracted
(AVE) and factor loadings are the ways to examine this. Here, the loadings should be very significant for statistical measurement of variables with the minimum value of 0.7 of factor loadings. For measuring AVE, every construct

Nadeem and Siddiqui: The Effect of Strategic Orientation on Green Supply Chain Practices and Performance: A Case of Manufacturing Companies in Pakistan (59-70)
Page 66 Asian Business Review ● Volume 7 ●Number 2/2017
should be of 0.5 value and for composite reliability should be a minimum value of 0.7.
In Table 5 the outcome reflects prescribed values mentioned here, thus affirm the model’s convergent validity (Bagozzi & Yi, 1988).
Table 5: The Convergent Validity Analysis
Construct Items Loadings Cronbach's
Alpha Cra AVEb
EO1 0.723 0.815 0.870 0.574
Environmental Orientation
EO2 0.845
EO3 0.734
EO4 0.802
EO5 0.669
Supply Chain Orientation
SCO1 0.525 0.824 0.865 0.400
SCO10 0.278
SCO2 0.714
SCO3 0.714
SCO4 0.680
SCO5 0.697
SCO6 0.709
SCO7 0.608
SCO8 0.626
SCO9 0.645
Institutional Pressure
IP1 0.672 0.811 0.851 0.345
IP10 0.508
IP11 0.648
IP2 0.655
IP3 0.569
IP4 0.473
IP5 0.513
IP6 0.674
IP7 0.532
IP8 0.586
IP9 0.583
Green SCM GSC1 0.604 0.880 0.898 0.336
GSC10 0.616
GSC11 0.616
GSC12 0.726
GSC13 0.635
GSC14 0.497
GSC15 0.316
GSC16 0.526
GSC17 0.564
GSC18 0.494
GSC2 0.548
GSC3 0.360
GSC4 0.536
GSC5 0.739
GSC6 0.640
GSC7 0.563
GSC8 0.666
GSC9 0.607
Customer Effectiveness
PCE1 0.590 0.819 0.866 0.521
PCE2 0.734
PCE3 0.713
PCE4 0.791
PCE5 0.769
PCE6 0.717
Operational Efficiency
POE1 0.875 0.808 0.868 0.573
POE2 0.796
POE3 0.640
POE4 0.819
POE5 0.620
Social Performance
PSP1 0.756 0.849 0.892 0.623
PSP2 0.801
PSP3 0.795
PSP4 0.821
PSP5 0.772
Economic Performance
PEP1 0.784 0.875 0.906 0.616
PEP2 0.837
PEP3 0.845
PEP4 0.726
PEP5 0.810
PEP6 0.698
Environmental Differentiation
PED1 0.899 0.879 0.925 0.804
PED2 0.903
PED3 0.888
a: CR = sum of factor loading* 2 / (sum of factor loading* 2 + sum of variance of error) b: AVE = sum of factor loading* 2 / (sum of factor loading* 2 + sum of variance of error)
The Discriminant Validity: The items of construct should have variances among these more than the lying on other particulars of the constructs. This criterion for examination of discriminant validity was introduced by Fornell and Larcker (1981). The Table 6 represented below forms a diagonal of figures mentions the square roots of AVE with the constructs’ correlation.
Table 6: Correlations of Discriminant Validity
Construct PCE PEP PED EO GSC IP POE PSP SCO
PCE 0.722 PEP 0.601 0.785 PED 0.605 0.738 0.897 EO 0.441 0.564 0.492 0.757
GSC 0.662 0.644 0.630 0.568 0.579 IP 0.355 0.556 0.498 0.575 0.704 0.587
POE 0.683 0.588 0.563 0.503 0.664 0.452 0.757 PSP 0.713 0.688 0.681 0.532 0.614 0.464 0.574 0.789 SCO 0.389 0.562 0.515 0.697 0.637 0.657 0.487 0.434 0.633
The Structural Model (Inner Model) and Hypotheses
Testing: After examining construct validity and reliability, the next phase is to test hypotheses by using calculation system of Algorithm and Bootstrapping of Smart PLS. Below in Table 7 and Figure 2 the results have been shown.
Research Article, ISSN 2304-2613 (Print); ISSN 2305-8730 (Online)
Copyright © CC-BY-NC 2014, Asian Business Consortium | ABR Page 67
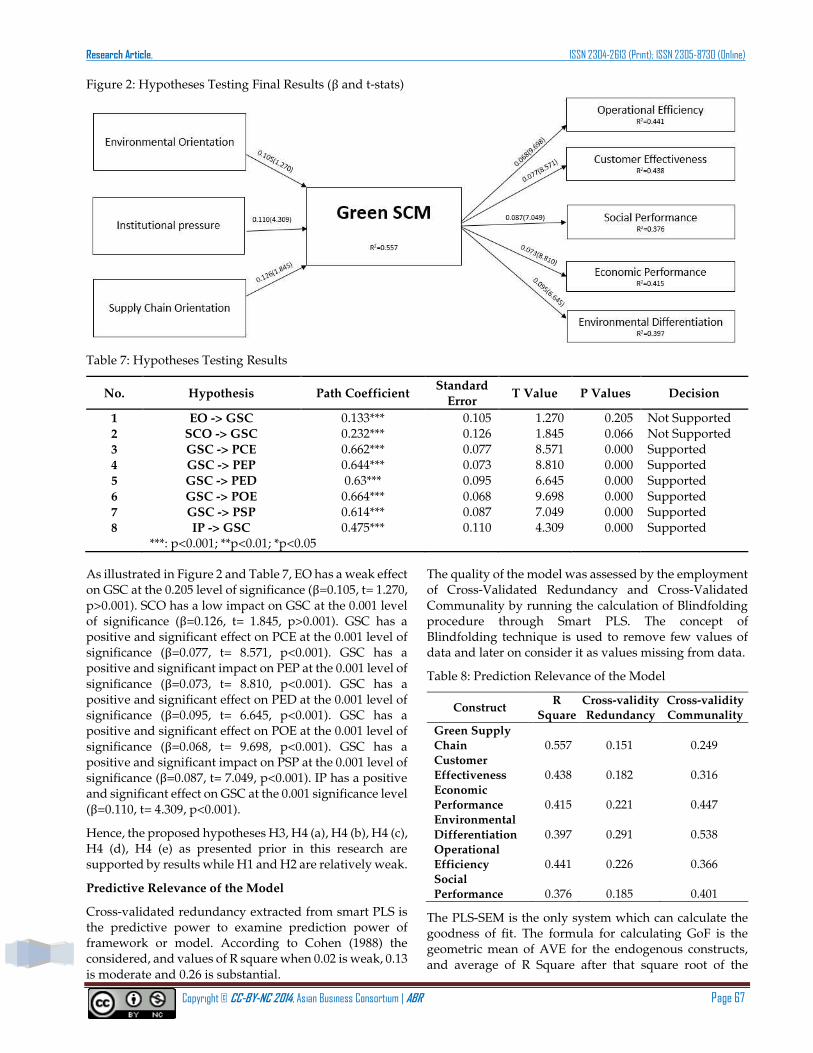
Figure 2: Hypotheses Testing Final Results (β and t-stats)
Table 7: Hypotheses Testing Results
No. Hypothesis Path Coefficient Standard
Error T Value P Values Decision
1 EO -> GSC 0.133*** 0.105 1.270 0.205 Not Supported 2 SCO -> GSC 0.232*** 0.126 1.845 0.066 Not Supported 3 GSC -> PCE 0.662*** 0.077 8.571 0.000 Supported 4 GSC -> PEP 0.644*** 0.073 8.810 0.000 Supported 5 GSC -> PED 0.63*** 0.095 6.645 0.000 Supported
6 GSC -> POE 0.664*** 0.068 9.698 0.000 Supported 7 GSC -> PSP 0.614*** 0.087 7.049 0.000 Supported 8 IP -> GSC 0.475*** 0.110 4.309 0.000 Supported
***: p<0.001; **p<0.01; *p<0.05
As illustrated in Figure 2 and Table 7, EO has a weak effect on GSC at the 0.205 level of significance (β=0.105, t= 1.270, p>0.001). SCO has a low impact on GSC at the 0.001 level of significance (β=0.126, t= 1.845, p>0.001). GSC has a positive and significant effect on PCE at the 0.001 level of significance (β=0.077, t= 8.571, p<0.001). GSC has a positive and significant impact on PEP at the 0.001 level of significance (β=0.073, t= 8.810, p<0.001). GSC has a positive and significant effect on PED at the 0.001 level of significance (β=0.095, t= 6.645, p<0.001). GSC has a positive and significant effect on POE at the 0.001 level of significance (β=0.068, t= 9.698, p<0.001). GSC has a positive and significant impact on PSP at the 0.001 level of significance (β=0.087, t= 7.049, p<0.001). IP has a positive and significant effect on GSC at the 0.001 significance level (β=0.110, t= 4.309, p<0.001).
Hence, the proposed hypotheses H3, H4 (a), H4 (b), H4 (c), H4 (d), H4 (e) as presented prior in this research are supported by results while H1 and H2 are relatively weak.
Predictive Relevance of the Model
Cross-validated redundancy extracted from smart PLS is the predictive power to examine prediction power of framework or model. According to Cohen (1988) the considered, and values of R square when 0.02 is weak, 0.13 is moderate and 0.26 is substantial.
The quality of the model was assessed by the employment of Cross-Validated Redundancy and Cross-Validated Communality by running the calculation of Blindfolding procedure through Smart PLS. The concept of Blindfolding technique is used to remove few values of data and later on consider it as values missing from data.
Table 8: Prediction Relevance of the Model
Construct R
Square
Cross-validity
Redundancy
Cross-validity
Communality
Green Supply
Chain 0.557 0.151 0.249 Customer
Effectiveness 0.438 0.182 0.316 Economic
Performance 0.415 0.221 0.447 Environmental
Differentiation 0.397 0.291 0.538 Operational
Efficiency 0.441 0.226 0.366 Social
Performance 0.376 0.185 0.401
The PLS-SEM is the only system which can calculate the goodness of fit. The formula for calculating GoF is the geometric mean of AVE for the endogenous constructs, and average of R Square after that square root of the

Nadeem and Siddiqui: The Effect of Strategic Orientation on Green Supply Chain Practices and Performance: A Case of Manufacturing Companies in Pakistan (59-70)
Page 68 Asian Business Review ● Volume 7 ●Number 2/2017
product of Average R square and average AVE. The baseline values are 0.36 is considered as high, 0.25 is considered as medium and 0.1 is considered as small. For this study, GoF is 0.483 which is adequate and comes under large that reflects the adequacy of the validity of the model.
DISCUSSION
The purpose of this study is to find answer of the question that why competence of the strategic supply chain orientation, strategic supply chain orientation, and institutional pressure has a direct and positive impact on the adoption of green SCM which in turn enhances overall organizational performance. Our study was aimed to fill the research gap on this topic in Pakistan. The study was gathered to know the impressions and practices in context of Pakistan’s manufacturing firms. Results imply that in the context of Pakistan’s corporate culture, the facts are different regarding management’s strategic orientations rather than what we had perceived. Resource based theory addresses about competencies required to gain competitiveness and Supply Chain theory assessed to address how competencies had been employed to fulfill the requirements of an organizations’ external environment.
For improving supply chain system, the practices are somehow in a traditional pattern and are less oriented towards green SCM practices. There is need to work in this domain that might take some more time for brining improvements and creating stronger organizational orientations in Pakistan.
The institutional theory helps to know that how firms go for environmentally friendly practices, and this highlights that institutional pressure is majorly due to coercive regulations by government, successful practices of competitors and societal pressures from the external stakeholders (customers and markets) of the industry. This research shows guidance about competences that make able organizations the prospect to design and apply effective and important green supply chain management practices.
Luthra et al., (2016) in his research stated that a firm’s policies regarding green SCM practices improve social performance, adequate internal management of an organization and it has significant impact on economic and environmental performance. However, customer effectiveness has negative relationship due to their awareness of Green practices and seek towards lesser price and cheap products. We also get support from the study of Lee et al., (2013) that through the implementation of GSCM, organizations get sustainability and competitive performance and enhances operational efficiency by reduction of cost, minimum resources utilization and improved productivity.
The positive and significant results of our study brief that successful adoption of green SCM practices is due to using of metrics of environmental performance. These metrics helps to know the level of performance within the firm, cross-functional coordination among suppliers, and customers to combat environmental issues together with technical support. Further, performance metrics also enhances performance through applications of total quality management especially with perspective of environment, reverse logistics system, and regularly compliances of ISO 14001 certifications. Firms also reported that post green SCM practices have caused their cycle time to reduce, overall cost is minimized, quality of the product is increased, customer service is improved, projects are completed in less time, and overall operational efficiency is also improved.
Performance under customer effectiveness covers firms’ consistency for stock availability, stock outs management, overcoming abnormal and customized orders, consistency for order fulfillment with real time information of customers and their orders and eventually a good return on sales. In our study, people reported that the positive link of green SCM and environmental differentiation is due to their good reputation and even some of them shared that their environmentally friendly products have caused an increase in their revenue. The economic performance results as a reduction in the cost of energy, waste treatment cost, and ultimately environmental accidents.
This study encompasses all expected scenarios come out as a result of green SCM. However, the strategic orientations need to flourish under different management programs and must be taught to the management of organization which should not be neglected as it creates awareness regarding understanding of importance of safe environment and to create better image in the world forums.
CONCLUSION
In recent decade, environmental and sustainability issues are evolving with the evolution of industrialization. Governmental regulatory bodies, international trade unions and organizations are seeking for the solution. The manufacturing industries are the backbone of Pakistan’s economy and comprise of major part of gross domestic product (GDP) and a big source of employment. In this background, an effort has been made to empirically and statistically analyze the impact of strategic organization orientations (including environmental orientation and supply chain orientation) and institutional pressures on adoption of green supply chain practices (GSCM) and later on impact of GSCM on performance of organization. This research is conducted from executives of 66 manufacturing firms of Pakistan through self-structured questionnaire on 5 points likert scale. The research does not find significant and positive impact of supply chain

Research Article, ISSN 2304-2613 (Print); ISSN 2305-8730 (Online)
Copyright © CC-BY-NC 2014, Asian Business Consortium | ABR Page 69
orientations on GSCM practices. While same kind of relationship is seen for the impact of environmental orientation on adoption of GSCM. The institutional pressure has significant and positive influence on GSCM practices. This result shows that in context of manufacturing concerns of Pakistan, organizations adopt GSCM practices due to the internal and external institutional pressures rather than their own intention and orientation to better their supply chain system and become environmental free. However, this research is the first step for creating awareness towards going ‘Green’ and acknowledging benefits of it. Moreover, all hypotheses regarding impact of GSCM practices on all performance measures including customer effectiveness, environmental differentiation, economic performance, operational efficiency,` and social performance are significant and positive. This illustrates that when industries of every level are determined to adopt GSCM practice, they ultimately start getting advantages of it in terms of eco-design of product, innovation, increase market share, high revenue, and more profitability.
From our study, we come to conclude that the adoption of green SCM practices in Pakistan’s manufacturing firms is still in its initial level due to relatively low knowledge among customers and consumers and the deficiency of powerful framework for regulations to promote sustainability of the environment in networks of supply chains. It recommends that there is evolving consciousness in Pakistan about ecological issues still require the further attention of firms’ management.
PRACTICAL AND MANAGERIAL IMPLICATIONS
When managers will start thinking about the potential value and importance of GSCM they would require endeavors to obtain sophisticated green supply chain system. The outcomes of our research will indeed help practitioners, managers, executives, directors, and others to know their strategic organizational orientation and the willingness to establish or improve their manufacturing system in compliance with GSCM practices. Further, this research will hopefully create interest in practitioners to analyze their performance with the help of performance measures mentioned in our findings.
The outcomes of our research would make practitioners to understand about the phenomena that by going ‘Green’ effectiveness and efficiency of their firm increases, and it is the soul of management concepts in the pursuit of sustainability and gaining a competitive edge in the same market.
LIMITATIONS AND FUTURE SCOPE OF RESEARCH
This research opens the door for future researchers, academicians to catch a more sophisticated panoramic view of same topic research by increasing their sample size. A future researcher would have the opportunity to gather data all across the map with more diversified
demographics. The results obtained from other industries sector and regions can also be compared with the outcomes of this study.
REFERENCES
Bagozzi, R. & Yi, Y. (1988). On the evaluation of structural equation models’, Journal of the Academy of Marketing Science, Vol 16 No.1, pp.74-94.
Banerjee, S. B., Iyer, E. S., &Kashyap, R. K. (2003). Corporate environmentalism: antecedents and influence of industry type, Journal of Marketing, 67(2), 106–122.
Black, K. (2010). Business Statistics: Contemporary Decision Making, 6th edition, John Wiley & Sons.
Carter, C. R. & Dresner, M. (2001), Purchasing's role in environmental management: Cross-functional development of grounded theory, The Journal of Supply Chain Management, 37 (3), 12-27.
Chan, R. Y. K. (2010). Corporate environmentalism pursuit by foreign firms competing in China. Journal of World Business, 45(1), 80–92.
Chan, R. Y., He, H., Chan, H. K., & Wang, W. Y. (2012). Environmental orientation and corporate performance: The mediation mechanism of green supply chain management and the moderating effect of competitive intensity, Industrial Marketing Management, 41(4), 621-630.
Cheng, J.H., Yeh, C.H., & Tu, C.W. (2008). Trust and knowledge sharing in green supply chains, Supply Chain Management: An International Journal, 13(4), 283-295.
Child, J. (1997), Strategic choice in the analysis of action, structure, organizations and environment: Retrospect and prospect, Organization Studies, 18(1), 43-76.
Child, J., Chung, L., & Davies, H. (2003). The performance of cross-border units in China: A test of natural selection, strategic choice and contingency theories, Journal of International Business Studies, 34 (3), 242-254.
Crook, T., Ketchen Jr., D., Combs, J., & Todd, S. (2008). Strategic resources and performance: A meta-analysis, Strategic Management Journal, 29 (11), 1141-1154.
Fornell, C., & Larcker, D. F. (1981). Evaluating structural equation models with unobservable variables and measurement error, Journal of Marketing Research, (18)(1), 39-50.
Fugate, B. S., Mentzer, J.T., & Stank, T.P. (2010). Logistics performance: Efficiency, effectiveness, and differentiation, Journal of Business Logistics, 31(1), 43-62.
Golicic, S. L., & Smith, C.D. (2013). A meta-analysis of environmentally sustainable supply chain management practices and firm performance, Journal of Supply Chain Management, 49 (2), 78-95.
Hair, J. F., Anderson, R. E., Tatham, R. L. & Black, W. C. (2010). Multivariate Data Analysis, Fifth Edition. Prentice Hall. New Jesey.
Kirchoff, J. F., Tate, W. L., & Mollenkopf, D. A. (2016). The impact of strategic organizational orientations on green supply chain management and firm performance. International Journal of Physical Distribution & Logistics Management, 46(3), 269-292.
Nadeem and Siddiqui: The Effect of Strategic Orientation on Green Supply Chain Practices and Performance: A Case of Manufacturing Companies in Pakistan (59-70)
Page 70 Asian Business Review ● Volume 7 ●Number 2/2017
Kozlenkova, I. V., Samaha, S.A., & Palmatier, R.W. (2014). Resource based theory in marketing domain, Journal of the Academy of Marketing Science, 42(1), 2-21.
Lee, M. S., Sung Rha, J., Choi, D., & Noh, Y. (2013). Pressures affecting green supply chain performance. Management Decision, 51(8), 1753-1768.
Lewis, H., & Gertsakis, J. (2001). Designing Environment: A Global Guide to Designing Greener Goods, Greenleaf Publishing, Sheffield.
Luthra, S., Garg, D., & Haleem, A. (2016). The impacts of critical success factors for implementing green supply chain management towards sustainability: an empirical investigation of Indian automobile industry. Journal of Cleaner Production, 121, 142-158.
Menon, A., & Menon, A. (1997). Enviropreneurial marketing strategy: The emergence of corporate environmentalism as market strategy.Journal of Marketing, 61(1), 51–67.
Min, S., & Mentzer, J.T. (2004). Developing and measuring supply chain management concepts, Journal of Business Logistics, 25 (1), 63-100.
Min, S., Mentzer, J.T., & Ladd, R.T. (2007). A market orientation in supply chain management, Journal of the Academy of Marketing Science, 35 (4), 507-522.
Mollenkopf D.A., & Closs D.J. (2005). The hidden value in reverse logistics. Supply Chain Management Review, 9(5), 34–43.
Sarkis, J. (2012). A boundaries and flows perspective of green supply chain management, Supply Chain Management: An International Journal, 17 (2), 202-216
Sarkis, J. (2012). A boundaries and flows perspective of green supply chain management, Supply Chain Management: An International Journal, 17 (2), 202-216
Sarkis, J., & Cordeiro, J.J. (2001). An empirical evaluation of environmental efficiencies and firm performance: pollution prevention versus end-of pipe practice. Eur. J. Oper. Res., 135, 102–113.
Sirmon, D. G., Hitt, M.A., & Ireland, R.D. (2007). Managing firm resources in dynamic environments to create value: Looking inside the black box, Academy of Management Review, 32(1), 273-292.
Svensson, G. (2007). Aspects of sustainability of supply chain management (SSCM): empirical example and conceptual framework, Supply Chain Management: An International Journal, 12 (4), 262-6.
Tate, W. L., Ellram, L.M., & Kirchoff, J.F. (2010). Corporate social responsibility reports, A thematic analysis related to supply chain management, Journal of Supply Chain Management, 46 (1), 19-44.
Wood, D. (1991). Revisited corporate social performance, Academy of Management Review, 16, 691–718.
Younis, H., Sundarakani, B., Sundarakani, B., Vel, P., & Vel, P. (2016). The impact of implementing green supply chain management practices on corporate performance. Competitiveness Review, 26(3), 216-245
Zacharia, Z., Nix, N. and Lusch, R. (2009), “An analysis of supply chain collaborations and their effect on performance outcomes”, Journal of Business Logistics, Vol. 30 No. 2, pp. 101-23.
Zhu, Q., & Sarkis, J. (2007). The moderating effects of institutional pressures on emergent green supply chain practices and performance. International journal of production research, 45(18-19), 4333-4355.
Zhu, Q., Sarkis, J., & Lai, K. (2008). Confirmation of a measurement model for green supply chain management practices implementation, International Journal of Production Economics,3(2), 261-273
Zhu, Q., Sarkis, J., & Lai, K. H. (2012). Examining the influence of green supply chain management practices and their mediations on performance improvements. International journal of production research, 50(5), 1377-1394
--0--
Online Archive: https://abc.us.org/ojs/index.php/abr/issue/archive