the effect of stimulus contrast and interocular...
TRANSCRIPT

Vision Res. Vol. 34, No. 3, pp. 383396, 1994 F’rintcd in Great Britain. All rights reserved
0042-6989/94 56.00 + 0.00 Copyright 0 1994 Pergamon Press Ltd
The Effect of Stimulus Contrast and Interocular Correlation on Disparity Vergence SCOTT B. STEVENSON,* LAWRENCE K. CORMACK,? CLIFTON M. SCHOR*
Received 18 March 1993; in revised form 16 June 1993
In previous reports, we developed a metric for describing the signal strength of a dynamic random-dot stereogram (DRDS) stimulus at binocular (cyclopean) levels of the buman visual system, which tahes both contrast and interocular correlation into account. In this study we tested the generaiity of that metric in relation to the control of horizootal vergence eye movements. Signal strength was assessed by measuring the extent to which a DRDS stimuhts could elicit invohmtary vergence respomes from a subject who was attempting to fixate steadily. Results for both step and shmsoidal disparity modulation paradigms showed that vergence velocity increased when either interocuiar correlation (IOC) or contrast was increased. Furthermore, IOC and contrast were found to contriite to signal strength for vergence in the same proportion as was found psychophysically. In general, the resuits indicate that the signals that drive this passive form of vergence are derived according to the same binocular combination rules as the signals that give rise to the perception of surfaces in DRDS sthnuii.
Human Vergence Disparity Contrast Correlation
INTRODUCTION
The binocular parallax produced by the lateral separ- ation of the eyes provides a source of information that is used for both the perception of depth (stereopsis) and for the alignment of the visual axes (vergence). These two processes emphasize somewhat different aspects of the parallax information, and it is possible that each system has a distinct way of analyzing binocular corre- spondence and disparity that is suited to its own needs. Stereopsis yields a depth value that varies across an image to reveal the three-dimensional structure of a scene, and its solutions are based almost entirely on horizontal disparity (but see Rogers & Bradshaw, 1993). By definition, it involves the conscious perception of depth relations from disparity. Vergence control, on the other hand, effectively reduces the binocular parallax information in a scene to a single coordinate, represent- ing overall vergence demand. This analysis involves horizontal, vertical and cycle disparities and all three types of disparity vergence can occur unconsciously. This study compares the perceptual and motor aspects of binocular vision at the first stage of correspondence analysis: the processing of interocular correlation.
The background for this work comes from two related areas of binocular vision research: cyclopean vision and disparity vergence. Cyclopean vision (Julesz, 197 1) refers to those aspects of visual perception which arise specifi- cally from the analysis of interocular correlation and
*School of Optometry, University of California at Berkeley, Berkeley, CA 94720, U.S.A.
TDepartment of Psychology, University of Texas at Austin, Austin, TX 78712, U.S.A.
disparity in binocularly viewed images. Disparity ver- gence (Stark, Kenyon, Krishnan & Cluffreda, 1980) refers to the disjunctive movements of the eyes which occur specifically in response to retinally disparate targets, as distinct from accommodative or proximal vergence responses (Schor, Alexander, Cormack & Stevenson, 1992). The contribution of the current re- search is to apply the tools of research in cyclopean vision for stimulus control and analysis to studies of disparity vergence, with particular emphasis on the development of a metric for signal strength. The stimuli employed are dynamic random-dot stereograms (DRDS) which contain no familiar object features and no tem- poral pattern correlation, thus isolating the binocular matching and localization processes. The stimulus con- trol variables are disparity, which determines the stimu- lus location (where), and interocular correlation and luminance contrast, which together determine a pattern’s signal strength in the cyclopean domain (how much). The disparity vergence response parameters studied are con- ventional ones of step vergence velocity and smooth tracking gain and phase. Previous work in this area has focused on the where aspects of stimuli. We now contrib- ute data on the effects of how much stimulus there is.
Most studies of horizontal disparity vergence have used luminous lines or spots as stimuli (Riggs & Niehl, 1960; Rashbass & Westheimer, 1961; Richards, 1972; Krishnan, Phillips & Stark, 1973; Regan, Erkelens & Collewijn, 1986a, b; Jones & Stephens, 1989) with dis- parity being the variable whose effects are of interest. Some studies have employed static, random-dot stereo- grams (Erkelens, 1988; Erkelens & Collewijn, 1985b; Fender & Julesz, 1967) and these have also investigated
383

384 SCOTT B. STEVENSON et ai,
the response of vergence to changes in disparity. Recent studies with advanced head and eye tracking systems have emphasized combinations of cues and uncon- strained responses, but these also focused on target location and movement (Steinman, Kowler & Collewijn, 1990). The effect of other stimulus parameters on ver- gence response has received relatively little attention in the literature. In the present study, we have used DRDSs, which have a number of advantages for studies of disparity vergence. DRDS patterns have no recogniz- able features which might induce a proximal vergence response or allow for the (unlikely) possibility of mon- ocularly programmed saccades or pursuits; they have no temporal correlation from frame to frame which might reveal the disparity changes based on monocular motion signals; their construction allows for easy manipulation of interocular correlation (IOC) so that stimulus strength can be controlled without any perceptible alter- ation of either monocular view.
In research into cyclopean vision, a great deal of interest has focused on the problems of image correspon- dence and the resolution of matching ambiguities. The development of the random-dot stereogram (Aschen- brenner, 1954; Julesz, 1960) and subsequent studies of interocular correlation (Julesz, 1971; Julesz & Tyler, 1976; Tyler & Julesz, 1978; Stevenson, Cormack & Schor, 1989, 1991, 1992; Cormack, Stevenson & Schor, 199 1) have provided tools for manipulating the degree of correspondence quantitatively. IOC is a measure of left and right image similarity as a function of disparity. It is manipulated in a random-dot stereogram by forcing a certain proportion of dots to match exactly while the remainder are matched or anti-matched at random. In its original formulation, IOC was quantified in terms of this proportion of forced matches (Tyler & Julesz, 1978). If all dots are forced to match exactly, the IOC is + 1. If all dots are anti-matched, with opposite contrast in the two images, the IOC is - 1. If no dots are forced to match, only random matches occur and the IOC is on average zero. (It fluctuates somewhat around this value due to statistical variation from sample to sample.)
In its more general formulation, image correspon- dence is quantified by a cross-correlation of the lumi- nance (or contrast) profiles of a small patch of the visual field. By computing the cross-correlation over a range of horizontal disparity (along epipolar lines), a cross-corre- lation function can be obtained which characterizes cyclopean signal strength along the depth axis. For a particular x by y image patch and a particular horizontal disparity d,
IOC(d) = (rk(x,y)*It(x+d,y))dydx (1)
where IfR and I’, are right and left image intensity derivative functions, respectively. This formulation takes into account both the degree of similarity of half images and the luminance contrast of each. If the sign of right and Ieft image contrasts are randomly related at the chosen disparity, then IOC wilt be 0.0 on average. If the two images are identical, then the value will depend on
the contrast of each and on the size of the image patch chosen [i.e. the limits of integration in equation (l)]. However, if one normalizes this formulation of IOC by the average autocorrelation of the left and right images, then it produces the same values as the matching formu- lation above, provided that the two images are of equal average contrast.
Figure 1 shows some sample cross-correlation func- tions from random-dot patterns with IOC values ranging from 0.0 to 1.0, with retinal disparity on the horizontal axis and signal strength on the vertical axis, measured at one pixel intervals. The simulated image patch used in computing these functions contained 400 dots, and each dot was 5 min arc wide. Each function is displaced vertically for ease of compa~son. Note that the use of contrast (rather than luminance} in the correlation for- mula produces negative sidelobes around the central peak. Note also that the random matches at non-zero disparity (false target noise) remain constant in ampli- tude as the correlation of the central peak is varied.
It is our view that the cross-correlation function describes the info~ation that the visual system uses to recognize left and right image correspondence and to subsequenty determine the disparity of local image patches. We do not have a specific proposal for ho~j the neural hardware performs this analysis, but we think that the cross-correlation of luminance edges captures the essence of what the cyclopean levels of vision “see”. Our interest in the current study is to examine whether the disparity vergence system also seems to be operating
FIGURE 1, Sample cross-correlation functions showing the effect of stimulus IGC (correlation) on the signal strength of a cy&pean stimulus. Stimulus IOC is de&rmlned by the number of dots which are forced to match in left and right images. Each function is diwced vertically for ease of comparison. The top trrtce_shows a cross- correlation analysis of a patter6 in which at1 dots were for& to match-an IOC of LO. The bottom trace shows an 8~~~ of a pattern in which dots mat&& purely at ran----an IOC of 0.0. Intermediate traces show IOCs of 0.75, 0.5 and 0.25. IA& to the Ieft indicate the correlation of the peak (at zero disparity) of each function. Note that the central signal decreases as IOC decreases, but the surrounding (“false target”) noise is unatited and tivrapjccf.to zero. The effect of lowering contrast (not shown) is to reduce the strength of both the central signal and the surrounding noise, so that the sibal
to noise ratio is constant over a broad range of contrasts.
EFFECT OF CONTRAST AND CORRELATION ON VERGENCE 385
on this information. Experiments I and II examined whether changes in IOC produce changes in the effective- ness a stimulus has for driving involuntary ocular ver- gence responses*
Evidence from psychophysical studies reve& that human observers are highly sensitive to changes in IOC in DRDS stimuli (Jules2 & Tyler, 1976; Tyler & Julesz, 1978; Cormack et al., 1991; Stevenson, Cormack & Schor, 1992), being able to detect a 5% increase of matching dots against a background of random matches (zero I&). This threshold depends on a number of parameters, including stimulus duration, area, contrast and disparity, and most generally on the total number of elements sampled. Many of these factors are accounted for by the h~~esis that the human observer is basing judgments on something very close to the cross-corre- lation integral of the left and right images (or image derivatives). For example, Cormack et al. (1991) found a root-two trade-off between stimulus correlation and luminance contrast. This relation is predicted by a cross-correlation mode1 because the left and right images are multiplied, effectively squaring the contribution of stimulus contrast at the cyclopean levels of the visual system. Experiment III examined whether this same trading relation would hold for vergence responses to stimuli with combinations of contrast and IOC.
METHODS
Stimulus
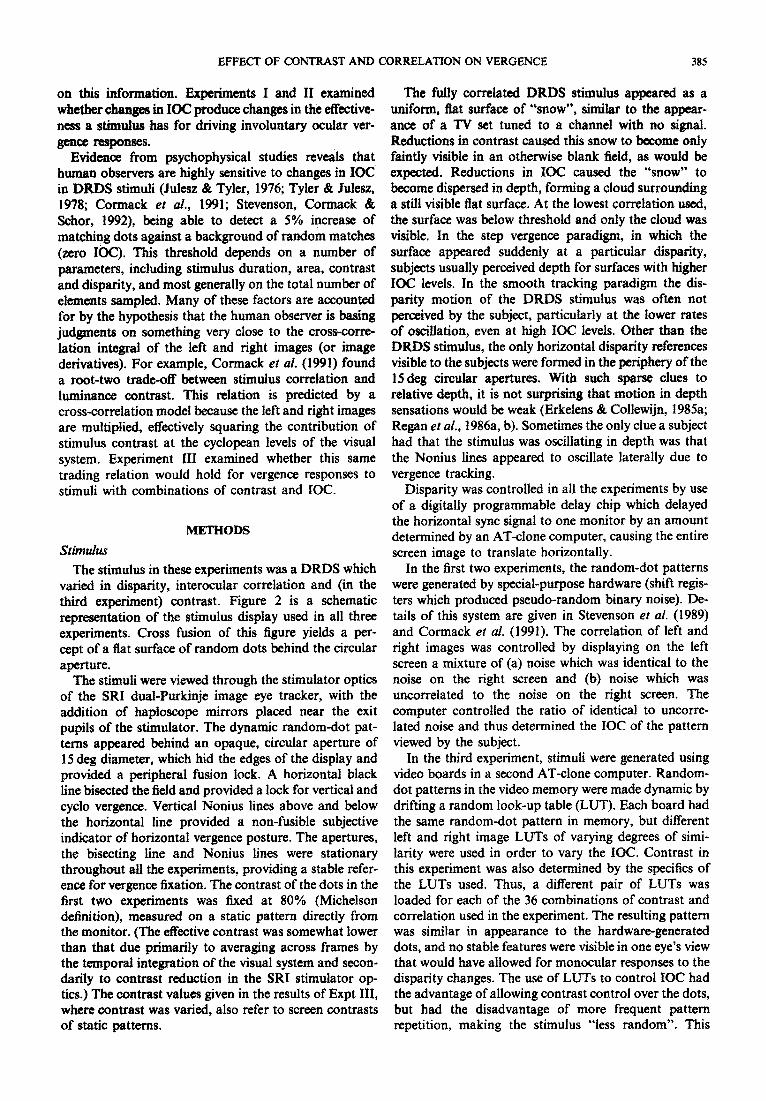
The stimulus in these experiments was a DRDS which varied in disparity, interocular correlation and (in the third experiment) contrast. Figure 2 is a schematic representation of the stimulus display used in all three experiments. Cross fusion of this figure yields a per- cept of a flat surface of random dots behind the circular aperture.
The stimuli were viewed through the stimulator optics of the SRI dual-Purkinje image eye tracker, with the addition of haploscope mirrors placed near the exit pupils of the stimulator. The dynamic random-dot pat- terns appeared behind an opaque, circular aperture of 15 deg diameter, which hid the edges of the display and provided a peripheral fusion lock. A horizontal black line bisected the field and provided a lock for vertical and cycle vergence. Vertical Nonius lines above and below the horizontal line provided a non-fusible subjective indicator of horizontal vergence posture. The apertures, the bisecting line and Nonius lines were stationary throu~out all the ex~~ents, providing a stable refer- ence for vergence fixation. The contrast of the dots in the first two experiments was fixed at 80% (Michelson definition), measured on a static pattern directly from the monitor. (The effective contrast was somewhat lower than that due primarily to averaging across frames by the temporal integration of the visual system and secon- darily to contrast reduction in the SRI stimulator op- tics.) The contrast values given in the results of Expt III, where contrast was varied, also refer to screen contrasts of static patterns.
The fully correlated DRDS stimulus appeared as a uniform, flat surface of “snow”, similar to the appear- ance of a TV set tuned to a channel with no signal. Reductions in contrast caused this snow to become only faintiy visible in an otherwise blank field, as would be expected. Reductions in IOC caused the “snow” to become dispersed in depth, forming a cloud surrounding a still visible flat surface. At the lowest correlation. used, the surface was below threshold and only the cloud was visible. In the step vergence paradigm, in which the surface appeared suddenly at a particular disparity, subjects usually perceived depth for surfaces with higher IOC levels. In the smooth tracking paradigm the dis- parity motion of the DRDS stimulus was often not perceived by the subject, pa~ic~arly at the Iower rates of oscillation, even at high IOC levels. Other than the DRDS stimulus, the only horizontal disparity references visible to the subjects were formed in the periphery of the 15 deg circular apertures. With such sparse clues to relative depth, it is not surprising that motion in depth sensations would be weak (Erkelens & Collewijn, 1985a; Regan et al., 1986a, b). Sometimes the only ciue a subject had that the stimulus was oscillating in depth was that the Nonius lines appeared to oscillate laterally due to vergence tracking.
Disparity was controlled in all the experiments by use of a digitally progra~able delay chip which delayed the horizontal sync signal to one monitor by an amount determined by an AT-clone computer, causing the entire screen image to translate horizontally.
In the first two experiments, the random-dot patterns were generated by special-purpose hardware (shift regis- ters which produced pseudo-random binary noise). De- tails of this system are given in Stevenson et al. (1989) and Cormack er al. (1991). The correlation of left and right images was controlled by displaying on the left screen a mixture of (a) noise which was identical to the noise on the right screen and (b) noise which was uncorrelated to the noise on the right screen. The computer controlled the ratio of identical to uncorre- lated noise and thus determined the IOC of the pattern viewed by the subject.
In the third experiment, stimuli were generated using video boards in a second AT-clone computer. Random- dot patterns in the video memory were made dynamic by drifting a random look-up table (LUT). Each board had the same random-dot pattern in memory, but different left and right image LUTs of varying degrees of simi- larity were used in order to vary the IOC. Contrast in this experiment was also dete~in~ by the specifics of the LUTs used. Thus, a different pair of LUTs was loaded for each of the 36 combinations of contrast and correlation used in the experiment. The resulting pattern was similar in appearance to the hardware-generated dots, and no stable features were visible in one eye’s view that would have allowed for monocular responses to the disparity changes. The use of LUTs to control IOC had the advantage of allowing contrast control over the dots, but had the disadvantage of more frequent pattern repetition, making the stimulus “less random”. This

386 SCOTT B. STEVENSON et al.
FIGURE 2. Representation of the stimulus display used in all the experiments, not to scale. Cross fusion of this figure yields a percept of a flat surface of random dots behind the circular surround. In this case, the dots are 100% correlated. In the experimental setup, a field of dynamic random dots was seen behind a 14deg circular aperture with a black surround. A horizontal line bisected the field to stabilize vertical and cyclovergence. Vertical Nonius lines provided the subject with an
indication of horizontal vergence posture, without providing too strong a lock.
problem was minimized by computing a new pair of LUTs for each repetition of a particular condition.
The subjects were the authors and (in the third experiment) one individual who was naive to the hypoth- esis under study. Two had normal uncorrected acuity and two others had correcting lenses inserted in front of the entrance pupil of the stimulator optics.
Znstructions
Subjects were instructed to main~in fixation on the horizontal line that bisected the field and to maintain Nonius alignment at all times during the recordings. This can be quite difficult when the stimulus is a high contrast, fully correlated pattern as in Fig. 2. Some subjects were more successful than others at resisting the pull of the stimulus, and it is not clear to what extent success may have depended on the strategy used by each. In any case, the responses recorded reflect involun~ry, or at least passive disparity-driven vergence changes. This method was chosen so as to remove the complicating issues of volitional control of vergence, proximal vergence re- sponses, anticipation of stimulus motion and subject bias. The method is similar to that used in studies of OKN suppression (e.g. Wyatt & Pola, 1984, 1987), in which a drifting stimulus is su~~rnpo~ on a steady fixation mark and the attempt to fixate reduces, but does not abolish optokinetic nystagmus. By putting the sur- round stimulus in conflict with the fixation target, the relative effectiveness of the two can be assessed. In this case, the fixation was held constant, so changes in the responses reflect changes in the effectiveness of the dynamic noise stimulus.
Data collection and analysis
Eye movements were tracked by a pair of dual Purkinje image eye trackers (SBI generation 5) and the horizontal component for each eye was sampled by an AT-clone computer at 6OHz, in sync with the video display. The subject’s head was stablized by a fore&d rest and a mouth bite. At the beginning of each- r&d- ing session the eye tracker gains were calibrated by having the subject fixate marks to the right and then to the left of center while the computer recorded the output voltage for each position. (These values varied only slightly from day to day for a given subject.) The galvanometer-driven mirrors in the stimulator optics were adjusted so as to null the subje@s phoria, allowing the subject to maintain Nonius ali@ment with a mini- mum of effort. Each stimulus presentation/%rgence recording was initiated by the subject, and only when the Nonius lines appeared aligned. Records which _ir&h&ed eye blinks or other large excursions (eaused by loss of tracking lock, for example) were rejected a~~~ to an automated criterion programmed into the data eollec- tion routine.
The raw eye vergence records include signals from several potential sources: eye rotation, eye translation, tracking errors and electronic noise. Bye rotation is the source of interest and so the rest reprer#a&t noise. An eye translation (e.g. due to head move) &long the visual axis of I mm produces a signal that is indi+& from a horizontal vergence movmt of &&tit 12 min arc. Every effort is made to stablize the subject’s bead with a bite bar and forehead rest, and a movement -of 1 mm produces a noticeable change in pressure on the subject’s forehead. However, the possibility remains~~&at
EFFECT OF CONTRAST AND CORRELATION ON VERGENCE 387
the head might move in time-locked fashion and thus contribute to the averaged signal amplitude. Tracking errors occur when the fourth-Purkinje detector system locks or attempts to lock onto the wrong image. With proper subject alignment and large pupil size, this is a rare event, but when it occurs it can appear to be a large, slow eye rotation. Subject CMS was dilated with 2.5% phenylephrine HCL to facilitate tracking, the other subjects used normal pupils. Trials in which tracking errors obviously occurred (apparent large slow move- ment of one eye only without subject reporting obvious change in Nonius alignment) were rejected and repeated by the sampling program or by the experimenter. While it is possible that such “false locks” might have con- tributed to some of the vergence records, it seems unlikely that they would be time-locked to the stimulus, and thus they should be averaged out in the final analysis. In this study, typically IO-12 repetitions of a condition were averaged together. Electronic noise refers to signals in the sampled eye records which arise from the eye trackers themselves or the associated electronics and are not associated with eye rotation. The amplitude of this noise was estimated by use of a stationary, artificial eye (Fourward Technologies). When the sampling program was run with this eye in place, the peak to peak noise level in the 12 set eye position record was under 1 min arc, just at the level of our digitizing resolution. For comparison, the r.m.s. vergence noise level for a subject attempting to hold steady fixation for the same time period was 2-3 min arc, with occasional excursions as large as 10 min arc.
EXPERIMENT I: STEP VERGENCE RESPONSES
Our first measurements examined the response of the disparity vergence system to sudden appearances of partially or fully correlated surfaces at various dispar- ities. While it is well established that the velocity of vergence increases with increasing stimulus disparity (Rashbass & Westheimer, 1961; Semmlow, Hung & Ciuffreda, 1986) the role of left and right image simi- larity has been studied only qualitatively (e.g. West- heimer & Mitchell, 1969). These measurements were undertaken to determine whether increasing IOC would also increase initial vergence velocity.
Before each stimulus presentation, the stimulus corre- lation was set to zero. The subject fixated the horizontal line bisecting the field and pressed a button when the Nonius lines appeared aligned. (From separate measure- ments, we estimate that this judgment can be made with sub-arcmin precision.) This initiated the computer to set the disparity and correlation to values chosen from a random order and to begin sampling vergence for 1 sec. Vergence responses were determined by subtracting left and right horizontal eye position measurements and normalizing to the vergence posture measured at the beginning of the record, the point when the subject had initiated each trial. An analysis program first interpolated across the rapid divergent spikes associated with saccades (Collewijn, Erkelens & Steinman, 1988),
then determined the point in time at which the vergence reached half it maximum excursion and finally fit a regression line to a 20 sample (333 msec) segment of the vergence response centered on that point. The slope of this regression line provided an estimate of the velocity of the early part of the vergence response for each trial.
All combinations of five correlation levels (0, 25, 50, 75 and 100%) and six disparities (- 30, - 20, - 10, 10, 20, and 30 min arc) were presented in random order in a single block of trials. A total of six blocks were collected for subject LKC and 12 were collected for subjects CMS and SBS, and the initial velocity values obtained for each condition of disparity and correlation were averaged across blocks. For those cases where the correlation was 0, all six disparity conditions yielded effectively the same stimulus, since correlation provides the only information available to the subject about how the image has been shifted.
Results
A composite of sample vergence traces is shown in Fig. 3. The stimuli in these trials was a 50% correlated surface appearing at 30 min arc uncrossed [Fig. 3(a)] or crossed [Fig. 3(b)] disparity. Individual responses are shown by the thin lines and the average response is shown by the heavy line. In each case, the stimulus appeared at the beginning of the record and was present for the full 1 set duration. Despite the subject’s attempt to maintain a steady vergence posture, his eyes diverged toward the stimulus disparity over the course of about 300 msec. In some cases, vergence returned to the baseline rather quickly, while in others it continued to approach the disparity of the target surface. The initial response is similar in ‘a11 cases, however. The average velocity of divergence was about 0.7 deg/sec, which is quite low compared to active gaze changes but is typical of our results in this involuntary vergence paradigm.
Figure 4 shows the results from three subjects for all combinations of IOC and disparity in the step vergence paradigm. Stimulus IOC is plotted on the horizontal axis against velocity in min arc/set on the vertical axis, with positive values indicating divergence. Each point is the mean of six (subject LKC) or 12 (subjects CMS and SBS) replications. Error bars indicate + 1 SE. Note that even the highest average velocities are < 1 deg/sec. All three subjects show a clear effect of IOC on vergence velocity, though it appears to saturate at the highest IOC levels. The effect of disparity is less obvious in these data, but at the highest IOC levels, the largest disparities generally evoke the largest responses.
Figure 5 shows results from one subject who was instructed to converge on the dynamic noise surface as soon as it appeared. (The fixation mark was slightly different in this case, but all other aspects of the stimuli were the same.) Except for the vertical scale, the axes are the same as in Fig. 4. The velocities in general are much higher than in the involuntary case, and the effect of disparity is more pronounced. The effect of correlation

388 SCOTT B. STEVENSON et al.
is less obvious because the responses saturate at about 50% IOC, but the velocities for 25% IOC are clearly intermediate.
EXPERIMENT fl: SMOOTH TRACKING VERGENCE RE!WW?SES
Our next series of measurements examined the effect of interocuiar correiation on smooth tracking responses to sinusoidal disparity modulation in the DRDS patterns. As before, subjects were instructed to maintain Nonius alignment throughout the recording period, so the vergence changes recorded reflect involuntary responses. Previous experiments with voluntary tracking of high contrast fovea1 targets (Rashbass & Westheimer, 1961; Krishnan et at., 1973; Erkeiens & Coiiewijn, 1985a, b) have shown a consistent low-pass response function for disparity vergence. Of interest here was whether dynamic random-dot stereograms would yield the same result and how changes in IOC would affect the gain and phase of tracking responses.
As in the first experiment, each sampling period was initiated by the subject when the Momus lines were in apparent alignment. The computer then set the stimuius correlation and began the sinusoidal disparity modu- lation, with correlation and frequency values chosen from a random order and amplitude set to IS min arc peak to peak for aii conditions. fThis relatively smaii amplitude was chosen in order to keep the stimulus within a few min arc of the horopter, in the region where correlation sensitivity is roughly constant. The relatively low peak velocity of low amplitude sinusoids also allows vergence following up to higher frequencies than would be possible for larger amplitudes with the same stimu- lus.) Vergence sampling began after the first fuii cycle of stimulation and continued for 12 sec. An analysis pro- gram determined the sine and cosine components of the response at the frequency of stimulation through a single frequency Fourier analysis.
All combinations of four frequencies (0.25, 0.5, 1 and 2 Hz) and five levels of IOC (0, 25, 50, 75 and 100%) were presented in a single block of trials. A total of six blocks were presented for each subject, and a mean gain
1 h I
V l 15~....~....~....~..,,~,*...~ 0 10 20 30 40 50 00
Time (video fmf??es)
FIGWRE 3. Examples of raw vergence traces from subject LKC in the step vergeace paradigm. The &m&us was a 50% correlated surfac+ at 30 min arc far (a) or ueaz (b) disparity. The stimulus appeared at time 0 and persisted for the full f see (60 frame) sarn#ing period. All tracee have been shifted vertically so that the mean of the first six samples is zero. J&h pauel shows six individual trials (thin lines) and their average (heavy line). Note that some of the traces return to zero after an kitirnl response as the subject attempts to maintain Nonius alignment. Responses were characterized by their initial velocities, determined by a linear regression over a 333 msec sample of each trace. The horizontal bar in (a) indicates the dkation of
the fitted region. See text for details of data analysis.

EFFECT OF CONTRAST AND ~R~~~ON ON VERGENCE 389
Correlation FIGURE 4. Vergence vekity as a function of correlation for three subjects and six disparities in the step vergance experiment. Each curve plots the initial velocity of the vergence response to a dynamic random-dot surface with a particular disparity against the correlation of the surface. Each symbol plots the mean of six (LKC) or 12 (SBS and CMS) measurements, and error bars indicated + 1 SE. Note that velocities are expressed in min arc/set, and the highest average velocity
in any condition is just under 1 deg/sec.
and phase was calculated for each condition from a vector (i.e. separate sine and cosine component) average of the six individual responses.
Results
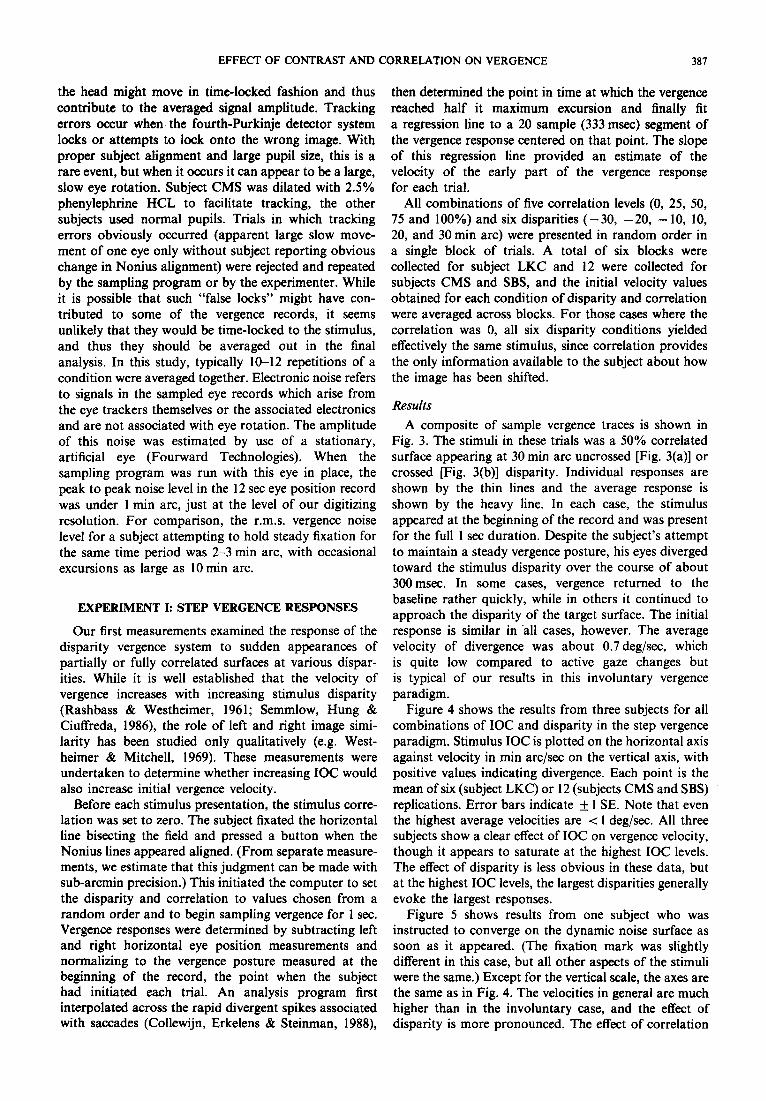
Figure 6 shows three sample recordings of 12 set vergence tracking responses to I Hz disparity modu- lation. The IOC levels were 75, 50 and 0% and the amplitude of disparity modulation was 15 min am peak to peak [Fig. 6 (top panel)]. Despite the effort to maintain steady fixation, this subject’s vergence followed the stimulus with a gain of almost 1 when the IOC was 75%. Gain was lower for the 50% IOC stimulus and tracking is absent in the 0% case, as expected. The saccade-related divergent spikes which are evident VR W/3-4
throughout these traces were not removed from the records before analysis, but it is unlikely that they had an effect on the gain, since they are not time-locked to the stimulus.
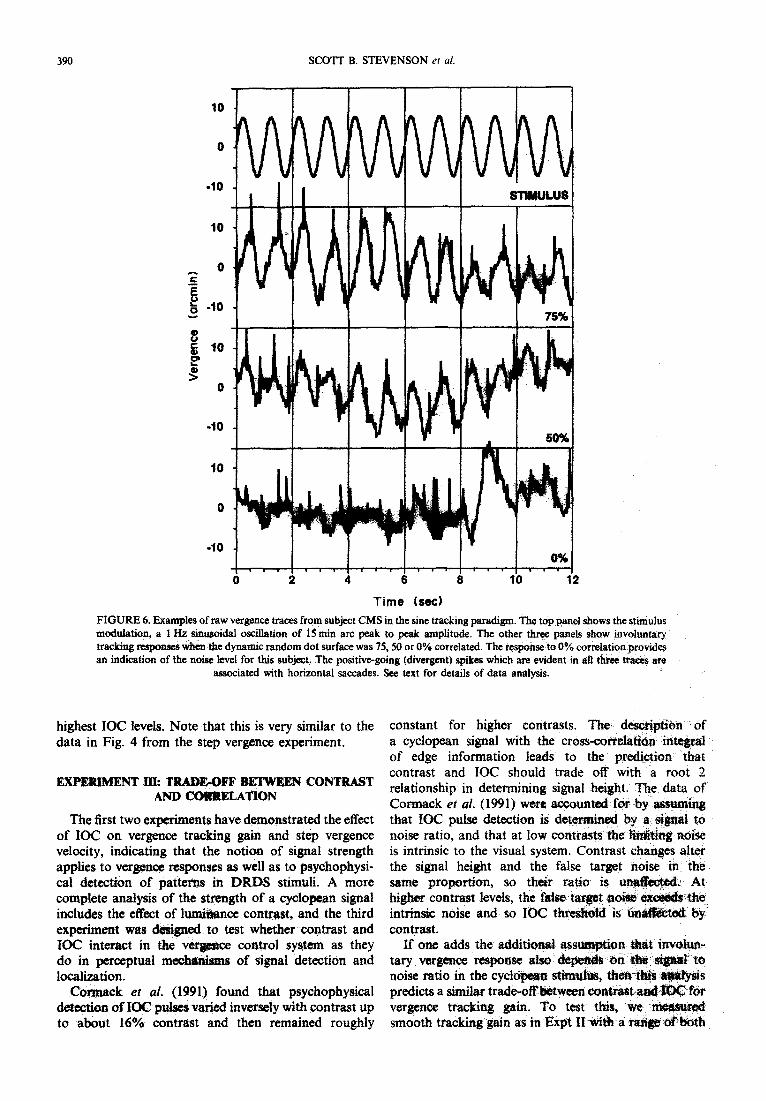
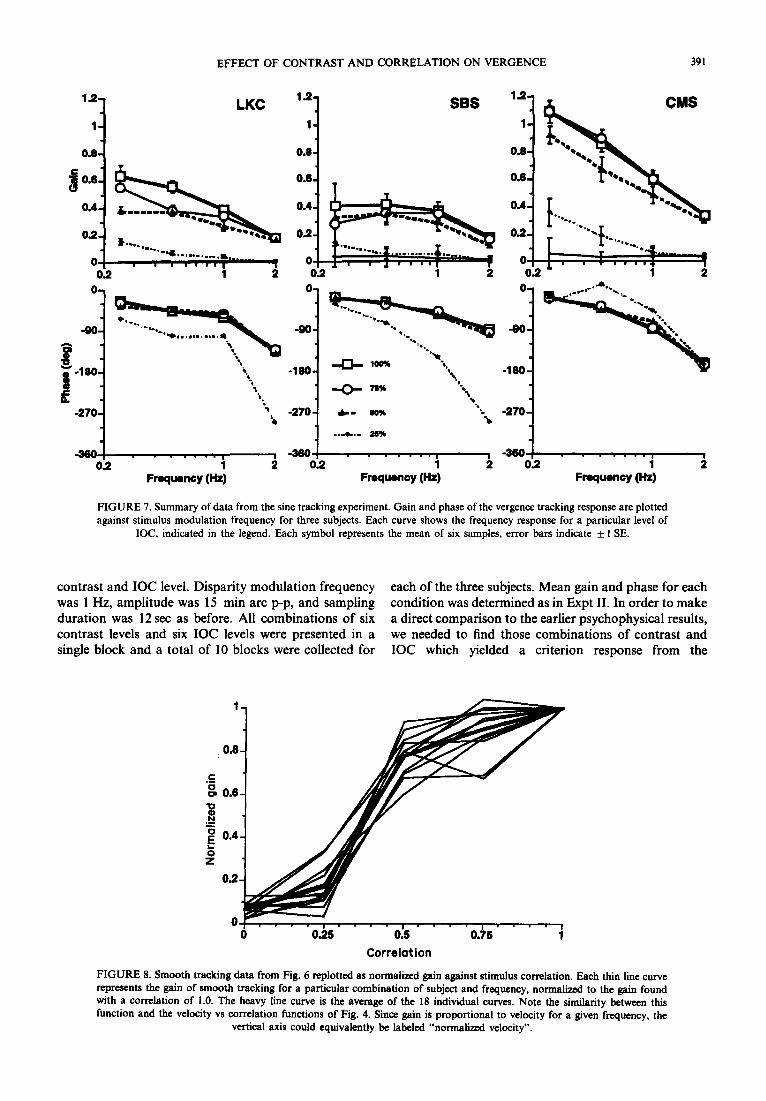
Figure 7 shows gain and phase data from three subjects, with each data point reprinting the average of six recording epochs. Tracking gain and phase are plotted as a function of frequency, with a separate curve for each level of IOC. Phase data for 0 IOC are not shown, since phase is meaningless when the response is at or near 0 gain. The frequency response varies some- what across subject: CMS shows a low-pass response with a gain of about 1 at the lowest frequency. This is similar to the kind of voluntary smooth tracking re- sponses with fovea1 targets that have been reported in the literature. LKC and SBS have considerably lower gains, and SBS shows some indication of bandpass characteristics with a peak at 0.5 Hz. Tracking gain drops as correlation is decreased, and phase is constant except for those cases where gain is near 0 (25% IOC for LKC and SBS). The effect of correlation is more readily seen in Fig. 8, where the gain data are replotted as a function of IOC. Each curve represents a vertical section through one of the gain plots in Fig. 7, and has been normalized to the 100% IOC condition so that the effect of correlation can be compared across subjects and frequencies. Each thin line shows normalized gain from one subject and one frequency and the heavy line shows the mean across all conditions. The trend across all conditions is an increase in tracking gain with an increase in IOC, with an apparent saturation at the
do- . SBS
40 , , . . , . . . ii 25 50 75 loo
Correlation
FIGURE 5. Voluntary step vergence velocity for SBS, for comparison to Fig. 4. Note that the axes are the same as in Fig. 4 (except for the vertical scale) and that the velocities are considerably bigber. Note also
that the effect of disparity is more evident.
390 SCOTT B. STEVENSON er al.
10
0
-10
10
2 0
E g -10
e f 10 B P)
0
-10
10
0
-10
0 2 4 6 8 10
Time fsd
FIGURE 6. Examples of raw vergence traces from subject CMS in the sine tracking paradigm. The top panel Snows the stimulus modutation, a 1 Hz sinusoidal oscillation of 15 min arc peak to peak amplitude. The other three panels show involuntary tracking responses when the dynamic random dot surface was 75,50 or 0% correlated. The response to 0% correlation provides an indication of the noise level for this subject. The positive-going (divergent) spikes which 81~: evident in aft three trams are
associated with horizontal saccades. See text for details of data analysis.
highest IOC levels. Note that this is very similar to the data in Fig. 4 from the step vergence experiment.
EXR m T- BETWEEN CONTRAST AND CORRELATION
The first two experiments have demomtrated the effect of IOC on vergence tracking gain and step vergence velocity, indicating that the notion of signal strength applies to vergence responses as well as to psychophysi- cal detection of patterns in DRDS stimuli. A more complete analysis of the strength of a cyclopean signal includes the effect of lumi~nce contrast, and the third experiment was designed to test whether contrast and TDC interact in the veragGsce control system as they do in perceptual me&s@isms of signal detection and localization.
Cormack et al. (1991) found that psychophysical detection of fDC p&es varied inversely with contrast up to about 16% contrast and then remained roughly
constant for higher contrasts. The description of a cyclopean signal with the cross-corre~atien in of edge information leads to the prediction contrast and IOC should trade off with a root 2 relationship in determining signal height. The data of Cormack et al. (1991) were accounted for -by assuming that IDC pulse detection is ethic by a sig&& to noise ratio, and that at low contrasts the akin noise is intrinsic to the visual system. Contrast changes alter the signal height and the false target noise’ in .- tlie same proportion, so their ratio is higher cOnExW levels, the false target B intrinsic noise and so IDC threshold contrast.
If one adds the a~iti~~~ assumption tary vergence response aiso &3pem#s on noise ratio in the cyclopean s&n&s, then predicts a similar trade-off-~tween-cbgtrrsst -a~-~ for vergenee tracking gain. To test this, we .~~ smooth tracking gain as in Expt II-w#t a ra@e @?%&h
EFFECT OF CONTRAST AND CORRELATION ON VERGENCE
12-
l-
0.8-
= 0.c 3 _ OA-
0.2- !S l me. .-ma
l r
‘-a 0,
““.‘.._,I
0.2 1 2
0.6
0.4
0.2
0 0.2
SBS
7 m 1 2
1
0.8
0.8
0.4
0.2
0 i 02
391
CMS
FIGURE 7. Summary of data from the sine tracking experiment. Gain and phase of the vergence tracking response are plotted against stimulus modulation frequency for three subjects. Each curve shows the frequency response for a particular level of
IOC, indicated in the legend. Each symbol represents the mean of six samples, error bars indicate & 1 SE.
contrast and IOC level. Disparity modulation frequency each of the three subjects. Mean gain and phase for each was 1 Hz, amplitude was 15 min arc p-p, and sampling condition was determined as in Expt II. In order to make duration was 12 set as before. All combinations of six a direct comparison to the earlier psychophysical results, contrast levels and six IOC levels were presented in a we needed to find those combinations of contrast and single block and a total of 10 blocks were collected for IOC which yielded a criterion response from the
0.8
0.2
Ok.,..,....,,..,,,,,., 0 0.25 0.5 0.75 1
Correlation
FIGURE 8. Smooth tracking data from Fig. 6 replotted as normalized gain against stimulus correlation. Each thin line curve represents the gain of smooth tracking for a particular combination of subject and frequency, normalized to the gain found with a correlation of 1.0. The heavy line curve is the average of the 18 individual curves. Note the similarity between this function and the velocity vs correlation functions of Fig. 4. Since gain is proportional to velocity for a given frequency, the
vertical axis could equivalently be labeled “normalized velocity”.
392 SCOTT 3. STEVENSON et al.
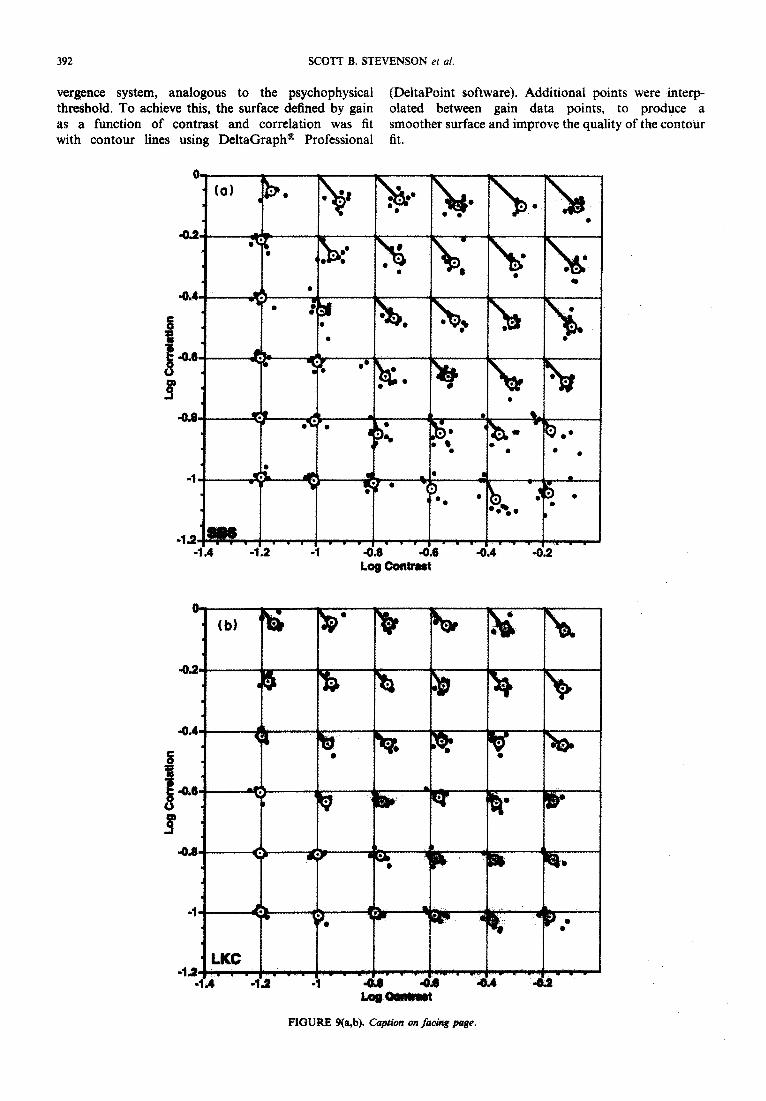
vergence system, analogous to the psychophysical (DeltaPoint software). Additional points were interp- threshold. To achieve this, the surface defined by gain olated between gain data points, to produce a as a function of contrast and correlation was fit smoother surface and improve the quality of the contour with contour lines using DeltaGraph@ Professional fit.
RGURE 9(a,b). Caption m facing puge.
EFFECT OF CONTRAST AND CORRELATION ON VERGENCE 393
Cosine component (p-p arcmin)
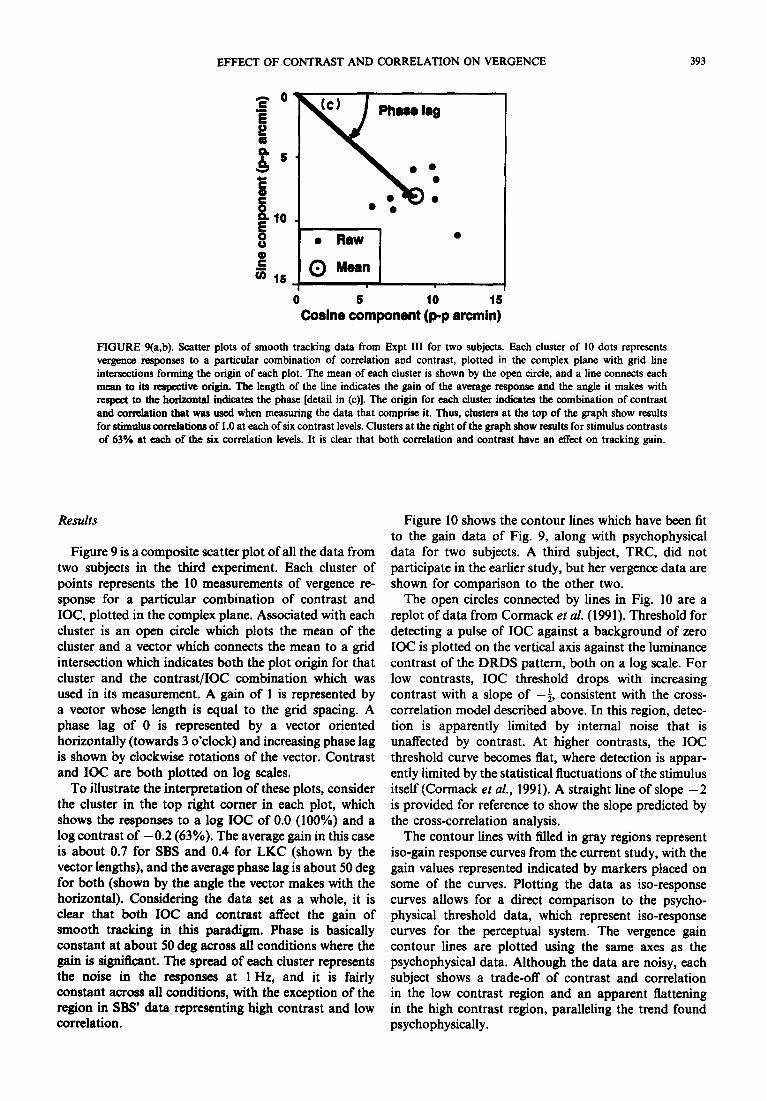
FIGURE 9(a,b). Scatter plots of smooth tracking data from Expt III for two subjects. Each cluster of 10 dots represents vergence responses to a particular combination of correlation and contrast, plotted in the complex plane with grid line intersections forming the origin of each plot. The mean of each cluster is shown by the open circle, and a line connects each mean to its mspective origin. The length of the line indicates the gain of the average response and the angle it makes with respect to the horixoutal indicates the phase [detail in (c)l. The origin for each cluster indicates the combination of contrast and correlation that was used when measuring the data that comprise it. Thus, clusters at the top of the graph show results for stimuhts correlationa of 1 .O at each of six contrast levels. Clusters at the right of the graph show results for stimulus contrasts of 63% at each of the six correlation levels. It is clear that both correlation and contrast have an etfect on tracking gain.
Results
Figure 9 is a composite scatter plot of all the data from two subjects in the third experiment. Each cluster of points represents the 10 measurements of vergence re- sponse for a particular combination of contrast and IOC, plotted in the complex plane. Associated with each cluster is an open circle which plots the mean of the cluster and a vector which connects the mean to a grid intersection which indicates both the plot origin for that cluster and the contrast/IOC combination which was used in its measurement. A gain of 1 is represented by a vector whose length is equal to the grid spacing. A phase lag of 0 is represented by a vector oriented horizontally (towards 3 o’clock) and increasing phase lag is shown by clockwise rotations of the vector. Contrast and IOC are both plotted on log scales.
To illustrate the interpretation of these plots, consider the cluster in the top right comer in each plot, which shows the responses to a log IOC of 0.0 (100%) and a log contrast of -0.2 (63%). The average gain in this case is about 0.7 for SBS and 0.4 for LKC (shown by the vector lengths), and the average phase lag is about 50 deg for both (shown by the angle the vector makes with the horizontal). Considering the data set as a whole, it is clear that both IOC and contrast affect the gain of smooth tracking in this paradigm. Phase is basically constant at about 50 deg across all conditions where the gain is significant. The spread of each cluster represents the noise in the responses at 1 Hz, and it is fairly constant across all conditions, with the exception of the region in SBS’ data representing high contrast and low correlation.
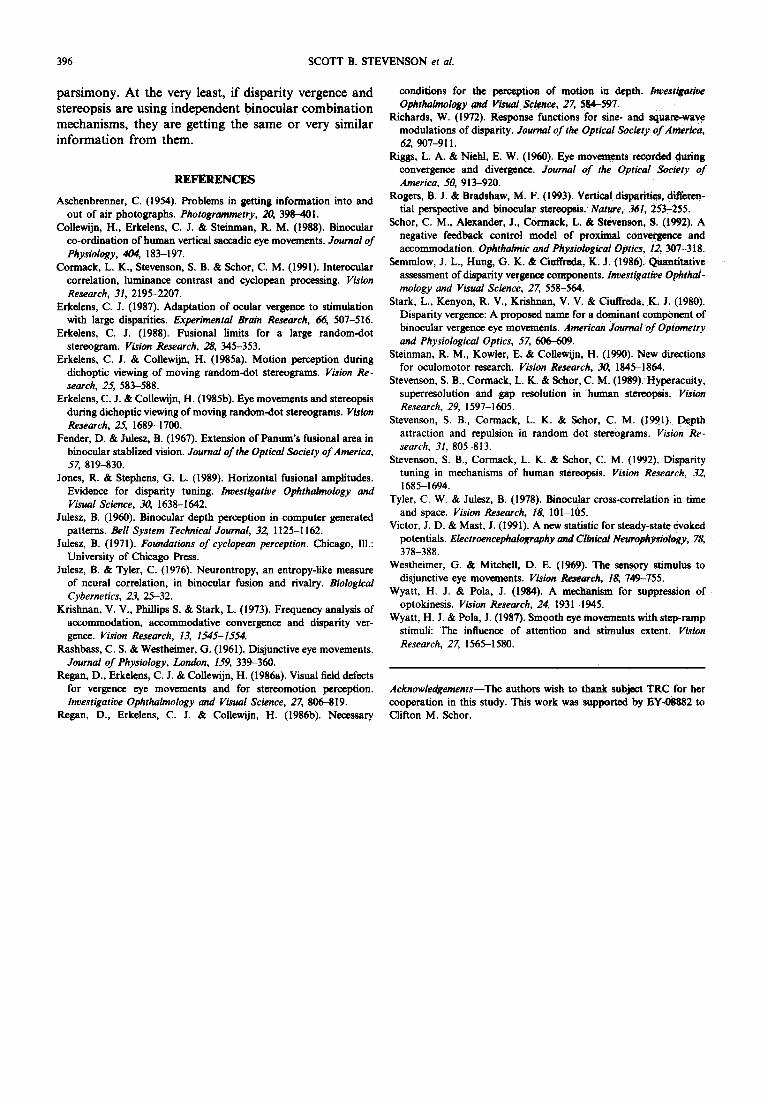
Figure 10 shows the contour lines which have been fit to the gain data of Fig. 9, along with psychophysical data for two subjects. A third subject, TRC, did not participate in the earlier study, but her vergence data are shown for comparison to the other two.
The open circles connected by lines in Fig. 10 are a replot of data from Cormack et al. (1991). Threshold for detecting a pulse of IOC against a background of zero IOC is plotted on the vertical axis against the luminance contrast of the DRDS pattern, both on a log scale. For low contrasts, IOC threshold drops with increasing contrast with a slope of -4, consistent with the cross- correlation model described above. In this region, detec- tion is apparently limited by internal noise that is unaffected by contrast. At higher contrasts, the IOC threshold curve becomes flat, where detection is appar- ently limited by the statistical fluctuations of the stimulus itself (Cormack et al., 1991). A straight line of slope - 2 is provided for reference to show the slope predicted by the cross-correlation analysis.
The contour lines with filled in gray regions represent iso-gain response curves from the current study, with the gain values represented indicated by markers placed on some of the curves. Plotting the data as iso-response curves allows for a direct comparison to the psycho- physical threshold data, which represent iso-response curves for the perceptual system. The vergence gain contour lines are plotted using the same axes as the psychophysical data. Although the data are noisy, each subject shows a trade-off of contrast and correlation in the low contrast region and an apparent flattening in the high contrast region, paralleling the trend found psychophysically.

394 SCOTT B. STEVENSON e/ ul.
Log Contrast
-1.6 -1.4 -1.2 -1 -6.6 -6.6 -6.4 -0.2 0 Log contrart
FIGURE 10. Iso-gain contour plots for three subjects, along with psychophysical detection data for two subjects from a previous study. Each contour line shows combinations of correlation and contrast which should produce a const+nt smooth tracking gain. The open symbols in the data for SBS and LKC plot correlation detection thresholds as a firaction ofIumbn&ce contrast, using the same axes as the contour plot. The solid line with slope -2 represents a theoretica tr&@g-relation b%&@en contrast and correlation, based on a cross-correlation analysis of left and right image pairs Psy~ltophyskal data were not
available for subject TRC.
DISCUSSION
The resufts from Expt I show that involuntary ver- gence movements can be elicited by dynamic random- element sterograms when the disparity is sufficiently small. The velocities of these movements are quite low, under 1 deglsec, and there are several factors which may contribute to this. First, the largest disparity we used was 0.5 deg. A typical velocity for a 0.5 deg, 100% correlated stimulus in our experiment was 40 min arc/set, which works out to 1.33 deg/sec per deg of disparity, for comparison to the 7-10 deg/sec per deg figure reported by Rashbass and Westheimer (1961) and confirmed by others. Second, the effective contrast of the patterns is relatively low, compared to the high contrast static patterns employed by previous studies. We measured the Michelson contrast on a static pattern at go%, but the effective contrast of the dynamic pattern is significantly lower than this due to averaging of successive frames by temporal integration in the visual system. Third, the
subject is actively resisting the change in vergence caused by the stimulus, and this attenuated the response as well, as can be= seen by comparing Fig. 4 with Rg. 5.
The results of voluntary convergence responses pre- sented in Fig. 5 illustrate the advantage of the compe- tition paradigm used in all the ather measurements reported here. Once the st~ul~s has axe ~~~ashold, the subject verges to it as rapidly as possible .and we see a response saturation fairly early in- the iOC function. The use of a competing ilxation +&get an&’ firvoluntary responses reveals, however, th.fiat thi ~t~~~~~ strength continues to increase beyond tb ~~~~~~~S~C~
detection/depth identification thr&&old, pPo&&ng response functions that continue to inorense to higher ICX levels. The para~i~ thus pro&&s a measure of suprathreshdd stimulus stien@h. -it has tbe’&awback, however, of reducing the overali r@@onse to the level of a few min arc, where the in~~t-~a~bili~y of vergence can obscure some effects, like the ef&ct of duty in Fig. 4. The involuntary sinusoidal tracking paradigin

EFFECT OF CONTRAST AND CORRELATION ON VERGENCE 395
used in Expt II provides some relief from the effects of vergence noise because of the extensive response averag- ing it affords.
The results of Expt II, presented in Figs 6-8 show that IOC a&&s smooth tracking gain in a manner that is very similar to the effect on step vergence velocity. The results presented in Fig. 8 are very comparable to those presented in Fig. 4. While Fig. 8 plots normalized gain against correlation, the vertical axis could equivalently be labeled normalized peak velocity, since peak velocity is proportional to gain for a given frequency. The frequency response functions of Fig. 7 are somewhat different from those published previously (Rashbass & Westheimer, 1961; Krishnan et al., 1973; Erkelens & Collewijn, 1985a, b), except for CMS. Both LKC and SBS show markedly reduced gains, particularly at low frequencies, probably as a result of the attempt to maintain steady fixation despite the depth modulation of most of the field. This might have affected low frequen- cies relatively more, since the subject had more time to make a corrective vergence movement to realign the Nonius when an offset was noticed. In particular, if the subjects used voluntary accommodative effort to pro- duce accommodative vergence responses, one would expect this to be more effective at low frequencies because accommodative vergence has a lower frequency roll-off than disparity vergence (e.g. Krishnan et al., 1973). Subject CMS is a presbyope and may not have been as facile at this since his accommodative efforts are ineffective in daily life, thus amounting for his higher gains. The preceding is highly speculative, however, since the subjects’ introspections were vague, introspections are generally of little value in this sort of situation and the putative accommodative changes would be too small to measure. The phase lags shown in Fig. 7 are very similar to previous reports of sinusoidal tracking (Krish- nan er al., 1973; Erkelens & Collewijn, 1985a, b). Krish- nan et al. (1973) showed that disparity vergence tracking phase was similar for “predictable” and “unpredictable’* stimuli, so one wouldn’t expect the attempt to track or not to alter phase significantly. Erkelens and Collewijn (1985a, b) showed that phase is unaffected by the amplitude of vergence response for stimulus modulation amplitudes between 1 and 5 deg and frequencies between 0.25 and 1.5 Hz, so one would not expect the change in amplitude with changing IOC to alter phase either.
The results from Expt III show that contrast, as well as IOC, affects tracking gain in a systematic way. The scatter plots in Fig. 9 show that the variability of vergence response at 1 Hz is roughly constant as the overall gain increases with increasing contrast and/or IOC. This is evident by the constant size of the clusters representing the 10 replications at each condition, The trend is violated for subject SBS in the lower right corner of the plot, where contrast is high and IOC is low. This is the condition where the signal to noise ratio is lowest, since the spurious correlations in the stimulus have high contrast but the signal itself is small, and it may be that the subject was drawn away from fixation by these “false
targets”. Using the spread of each cluster as a measure of noise in the measurement and the mean vector as signal (Victor 8c Mast, 1991), one could compute a d’ value for detecing vergence responses in this paradigm. Since the clusters are all very close to the same size, the average gain is proportional to d’. Thus, the pattern of results in Fig. 10 would be unchanged by converting iso-gain contours to iso-d’ contours.
The contour lines in Fig. 10 show a pattern that parallels the psychophysical results from the study of Cormack et al. (199 1), supporting a broader application of the cross-correlation analysis used in that report. There is sufficient variability in the data that only general trends can be assessed from these plots, but all three subjects show a change in slope of the contour lines from low contrast to high contrast, just as was found psycho- physically. The comparison of vergence analysis to psychophysics points up the relative sensitivity of these two methods. The lowest contour line plotted represents a gain of 0.1, which is equivalent to a peak-peak amplitude of 1.5 min arc. The standard deviation of the clusters in Fig. 9 average about 0.1 as well, for subjects LKC and TRC, so a gain of 0.1 represents a d’ of approx. 1. Subject SBS has an average cluster spread of 0.17, so a gain of 0.1 represents a d’ of about 0.6. The psychophysical results, shown in Fig. 10 by the open circles, represent 75% correct in a two-alternative forced-choice paradigm, equivalent to a d’ of 0.64. For both SBS and LKC, the psychophysical method shows a greater sensiti~ty to correlation than the vergence tracking gain method when compared in this way. The discrepancy says more about the methods than about the relative sensitivity of vergence and perception, and it may be that with considerably more averaging one could find that vergence is responding to the stimulus with a sensitivity similar to that of perception.
It is possible that the vergence threshold reflects a depth localization process as well as a correlation detec- tion process, while the psychophysical results reflect only the latter. Cormack et al. (1991) found that localization (stereoacuity) showed a square-root dependence on con- trast and a linear dependence on correlation, but did not measure stereoacuity for all combinations of the two variables, so a direct comparison to vergence data cannot be made. However, extrapolation from their data indicates that the same shape would be predicted for iso-response contours, whether based on signal localiz- ation or detection.
The results of these three experiments provide support for a common, early stage of binocular combination which informs both disparity vergence control and perceptual systems. The third experiment takes this further, in supporting the cross-correlation analysis as a description of what information the binocular combi- nation mechanism is extracting from the stimulus and passing on to these subsequent processes. The cross- correlation analysis takes into account both the degree of similarity of the two retinal images and the visibility of features within the images. The argument that the binocular combination stage is common is motivated by
396 SCOTT B. STE lENSON et al.
parsimony. At the very least, if disparity vergence and stereopsis are using independent binocular combination mechanisms, they are getting the same or very similar information from them.
REFXRENCES
Aschenbrenner, C. (1954). Problems in getting information into and out of air photographs. Phorogrammerry, 20, 398-401.
Collewijn, H., Erkelens, C. J. & Steinman, R. M. (1988). Binocular co-ordination of human vertical saccadic eye movements. Journal of Physiology, 404, 183-197.
Connack, L. K., Stevenson, S. B. & Schor, C. M. (1991). Interocular correlation, luminance contrast and cyclopean processing. Vision Research, 31, 2195-2207.
Erkelens, C. J. (1987). Adaptation of ocular vergence to stimulation with large disparities. Experimemal Brain Research, 66, 507-516.
Erkelens, C. J. (1988). Fusional limits for a large randomdot stereogram. Vision Research, 28, 345-353.
Erkelens, C. J. & Collewijn, H. (1985a). Motion perception during dichoptic viewing of moving random-dot stereograms. Vision Re- search, 25, 583-588.
Erkelens, C. J. & Collewijn, H. (1985b). Eye movements and stereopsis during dichoptic viewing of moving random-dot stereograms. Vision Research, 25, 1689-1700.
Fender, D. & Julesx, B. (1967). Extension of Panum’s fusional area in binocular stablii vision. Journal of the Optical Society of America, 57, 819-830.
Jones, R. C Stephens, G. L. (1989). Horizontal fusional amplitudes. Evidence for disparity tuning. Investigative Ophthalmology and Visual Science, 30, 1638-1642.
Julesz, B. (1960). Binocular depth perception in computer generated patterns. Bell System Technical Journal, 32, 1125-l 162.
Julesx, B. (1971). Foundations of cyclopean perception. Chicago, Ill.: University of Chicago Press.
Julesz, B. & Tyler, C. (1976). Neurontropy, an entropy-like measure of neural correlation, in binocular fusion and rivalry. Biological Cybernetics, 23, 25-32.
Krishnan, V. V., Phillips S. & Stark, L. (1973). Frequency analysis of accommodation, accommodative convergence and disparity ver- gence. Vision Research, 13, 1545-1.554.
Rashbass, C. S. & Westheimer, G. (1961). Disjunctive eye movements. Journal of Physiology, London, 159, 339-360.
Regan, D., Erkelens, C. J. & Collewijn, H. (1986a). Visual field defects for vergence eye movements and for stereomotion perception. Investigative Ophthalmology and V&al Science, 27, 806-819.
Regan, D., Erkelens, C. J. & Collewijn, H. (1986b). Necessary
conditions for the perception of motion in depth. Investigative Ophthalmology and Visual Science, 27, 584-597.
Richards, W. (1972). Response functions for sine- and square-wave modulations of disparity. Journal of the Optical Society of Anro*ica, 62, 907-9 11.
Riggs, L. A. & Niehl, E. W. (1960). Eye movements reoorded during convergence and divergence. Journal of the Opticai Society of America, 50, 913-920.
Rogers, B. J. & Bradshaw, M. F. (1993). Vertical disparities, diB&n- tial perspective and binocular stereopsis. Nature, 361, 253-255.
Schor, C. M., Alexander, J., Cormack, L. & Stevenson, S. (1992). A negative feedback control model of proximal convergence and accommodation. Ophthalmic and Physiological Optics, 12, 307-3 18.
Semmlow, J. L., Hung, 0. K. & Ciuffreda, K. J. (1986). Quantitative assessment of disparity vergence components. Invesriganve Ophthal- mology and Visual Science, 27, 558-564.
Stark, L., Kenyon, R. V., Krishnan, V. V. & CiulTreda, K. J. (1980). Disparity vergence: A proposed name for a dominant component of binocular vergence eye movements. American Journal of Optometry and Physiological Optics, 57, 606-609.
Steinman, R. M., Kowler, E. 8t Collewijn, H. (1990). New directions for oculomotor research. Vision Research, 30, 1845-1864.
Stevenson, S. B., Cormack, L. K. & Schor, C. M. (1989). Hyperacuity, superresolution and gap resolution in human stereopsis. V&on Research, 29, 1597-1605.
Stevenson, S. B., Cormack, L. K. & Schor, C. M. (1991). Depth attraction and repulsion in random dot stereograms. Vision Re- search, 31, 805-813.
Stevenson, S. B., Cormack, L. K. & Schor, C. M. (1992). Disparity tuning in mechanisms of human stereopsis. Vision Research, 32, 1685-1694.
Tyler, C. W. & Julesz, B. (1978). Binocular cross-correlation in time and space. Vision Research, IS, 101-105.
Victor, J. D. & Mast, J. (1991). A new statistic for steady-state evoked potentials. Electroencephalography and Clinical Neurophysiology, 78, 378-388.
Westheimer, G. & Mitchell, D. E. (1969). The sensory stimulus to disjunctive eye movements. Vision Research, 1% 749-755.
Wyatt, H. J. & Pola, J. (1984). A mechanism for suppression of optokinesis. Vision Research, 24, 1931-1945.
Wyatt, H. J. L Pola, J. (1987). Smooth eye movements with step-ramp stimuli: The influence of attention and stimulus extent. Vision Research, 27, 15651580.
Achnowledgemenrs-The authors wish to thank subject TRC for her cooperation in this study. This work was supported by EYdXB82 to Clifton M. Schor.