the effect of shareholder litigation risk on the ... files/17-048_413e9658-649c-4904... · the...
TRANSCRIPT
The Effect of Shareholder Litigation Risk on the Information Environment: The Case of Cross-Listed Firms
Anywhere Sikochi
Working Paper 17-048
Working Paper 17-048
Copyright © 2016 by Anywhere Sikochi
Working papers are in draft form. This working paper is distributed for purposes of comment and discussion only. It may not be reproduced without permission of the copyright holder. Copies of working papers are available from the author.
The Effect of Shareholder Litigation Risk on the Information Environment: The Case of Cross-Listed Firms
Anywhere Sikochi Harvard Business School
The effect of shareholder litigation risk on the information environment: The case of cross-listed firms*
Anywhere Sikochi [email protected]
Harvard Business School
Current draft: September 4, 2016
Abstract: I document the causal link between shareholder litigation risk and cross-listed firms’ information environment by exploiting a quasi-natural experiment in the form of a reduction in litigation risk resulting from the 2010 Supreme Court ruling in Morrison v. National Australia Bank. I first show that the ruling reduced litigation risk faced by cross-listed firms as evidenced by lower directors and officers insurance premiums for Canadian firms after the ruling. I then show that the information environment deteriorated for cross-listed firms after the ruling. The results are more pronounced for firms with low US share activity, in bad news firm-quarters, and for firms from countries with weak legal institutions. By implication, these findings suggest that improvements in foreign firms’ information environment upon listing in the US, as documented in prior literature, stem in part from the greater litigation risk associated with the US listing. Keywords: Cross-listing, Information environment, Shareholder litigation risk, D&O Insurance *Helpful comments and suggestions are appreciated from the following: Kimball Chapman, Dane Christensen, Kai Du, Dan Givoly, Guojin Gong, Jeremiah Green, Peter Iliev, Mark Lang, Rick Laux, Henock Louis, Michelle Lowry, Nancy Mahon, Stephani Mason (discussant), Karl Muller, Christopher Noe, Ian Tarrant, Hal White, David Wood, Biqin Xie, and workshop participants at Penn State University, the PhD Project Accounting Doctoral Student Association Annual Meeting (2014), and the American Accounting Association Diversity Section Midyear Meeting (2014). I acknowledge financial support from the Smeal College of Business at Penn State University, the KPMG Foundation, and Harvard Business School. All errors are my own.
1
I.Introduction
In this paper, I document the causal link between shareholder litigation risk and the
information environment of foreign firms with a listing on US exchanges. There is an ongoing
debate about the role of shareholder litigation risk in shaping the information environment of
foreign firms that list their shares in the United States.1 On the one hand, the legal bonding
hypothesis suggests that shareholder litigation risk plays an important role in the improvement of
firms’ information environment upon a US listing (e.g. Coffee 1999, 2002; Stulz 1999; Karolyi
2006, 2012). On the other hand, the reputation hypothesis suggests that the market, as opposed to
legal enforcement, imposes more punishment that influences managerial actions (Licht 2003,
Siegel 2005). This debate is unresolved because researchers are unable to disentangle the effects
of increased shareholder litigation risk upon a US listing from those of contemporaneous factors,
such as increased disclosure requirements, or stricter investor scrutiny.
One way to disentangle the effects of increased shareholder litigation risk upon a US listing
is to exploit an exogenous shock affecting the litigation risk faced by foreign firms listed on US
exchanges. In this paper, I use such an approach to establish a link between shareholder litigation
risk and the information environment of the firm. Specifically, I use a difference-in-differences
design around a quasi-natural experiment in the form of a reduction in shareholder litigation risk
faced by foreign firms resulting from the 2010 Supreme Court ruling in Morrison v. National
Australia Bank (‘the ruling’).2 The ruling chiefly affects foreign firms, whose shares primarily
trade overseas, because the ruling stipulates that shareholders can only file US lawsuits in
1 Shareholder litigation risk refers to the likelihood or expected cost of lawsuits filed in US courts against the firm by the firm’s shareholders for alleged securities fraud under Section 10(b) rule 10b-5 of the Securities Act of 1934. 2 Robert Morrison, et al., Petitioners, v. National Australia Bank Ltd., et al., Supreme Court of the United States, No. 08-1191, decided June 24, 2010. In addition to shareholder litigation, the ruling also related to the ability of the Securities Exchange Commission (SEC) and the Department of Justice (DOJ) to pursue cross border litigation, but the US Congress promptly restored the ability of the SEC and the DOJ in the Dodd-Frank Act of 2010.
2
connection with shares traded in the US. The focus on shareholder lawsuits allows me to hold
constant other contemporaneous factors related to a US listing and to examine only the effects of
a change in litigation risk.
The ruling can reduce shareholder litigation risk by lowering the frequency or severity of
claims against foreign firms. Frequency is affected because investors who buy or sell their shares
overseas can no longer join shareholder lawsuits. Since the ruling, plaintiffs have amended claims
to include purchasers of shares in the US only or have had claims dismissed because they included
shares purchased overseas.3 The resultant smaller class sizes reduce the likelihood of litigation as
the upfront litigation costs discourage plaintiffs’ attorneys from pursuing smaller lawsuits against
cross-listed firms (Skinner 1994). Severity of lawsuits, which can roughly be estimated by
settlement amounts or total investment losses (Baker and Griffith 2007), is affected because shares
purchased or sold on foreign exchanges are no longer included in the computation of total
investment losses.4
First, I examine changes in directors’ and officers’ (D&O) insurance premiums to show
whether the ruling does indeed reduce shareholder litigation risk and also to address potential
concerns in the literature that could diminish the effects of shareholder litigation risk. Core (2000)
suggests that litigation risk increases D&O insurance costs. Accordingly, a reduction in risk would
result in lower premiums. With respect to concerns in the literature, Alexander (1991) and Baker
and Griffith (2007) suggests that lawsuits typically settle within D&O insurance limits. When this
occurs it can limit firms’ costs from wrongdoing, and as a result managerial disclosure decisions
3 Examples are noted In Sheet Metal Workers Local 32 Pension Fund et al. vs. TEREX CORPORATION, et al., Reply Memorandum of Law …, September 9, 2010, and In re Vivendi Universal, S.A. Sec. Litig., Memorandum Opion & Order, February 6, 2012. 4 Settlement amounts reflect investment losses for each share multiplied by the number of shares, and this computation is the starting point of lawsuit filings or settlement negotiations.
3
may not be materially affected by changes in litigation risk. However, Baker and Griffith (2007)
also note that D&O insurance premiums are nontrivial and potentially influence managerial
behavior. My empirical findings suggests that the D&O insurance premiums for a sample of
Canadian firms with a US listing decrease after the ruling. I interpret the findings as evidence that
foreign firms with a US listing face lower litigation risk after the ruling, and that firms bear
litigation costs even when lawsuits settle within insurance limits.
Second, my main analyses test the proposition that the lower shareholder litigation risk
resulting from the ruling would lead to a change in the information environment of foreign firms
with a US listing. The direction of the change in the information environment is not clear.5 On the
one hand, if a US listing prior to the ruling entailed significant litigation risk as predicted by the
legal bonding hypotheses (e.g., Coffee 1999, Karyoli 2012), I would expect an overall
deterioration in the information environment. On the other hand, if litigation risk is inconsequential
upon a US listing as suggested by the reputation hypothesis (e.g., Licht 2003, Siegel 2005), I would
expect no relation between the ruling and the information environment.6 Moreover, if litigation
risk discouraged disclosure as managers feared being sued if it turns out the disclosures are too
optimistic or misleading (e.g., Rogers et al. 2009), then a reduction in litigation risk may increase
disclosure which would improve the information environment. Accordingly, I do not make a
directional prediction on how the reduction in litigation risk faced by cross-listed firms affects
their disclosure.
I employ a difference-in-differences design to examine the changes in cross-listed firms’
information relative to control firms around the ruling, and find evidence consistent with the
5 Lowry (2009) conclude that whether and how litigation affect disclosure is unclear. Further, the effect of litigation risk in foreign firms is not obvious (Leuz 2003; Leuz 2006). 6 Relatedly, the law governing shareholder lawsuits does not impose overarching duty to provide disclosure. As a result, a reduction in risk may be inconsequential.
4
proposition that lower litigation risk adversely affects the information environment of the firm, as
captured by information asymmetry. I document that, relative to a control group, foreign firms
with a US listing (hereafter ‘cross-listed firms’) exhibit higher information asymmetry after the
ruling.7 The findings are more pronounced for firms with low share activity in the US. As issuers
can only be sued for fraud in connection with US traded shares, cross-listed firms with low activity
on US exchanges are subject to lower shareholder litigation risk. Moreover, the deterioration in
the information environment is more pronounced in bad news firm-quarters and for firms from
countries with weak legal institutions.8 These results are robust to controlling for several known
determinants of information asymmetry including the exchange the firms are listed on.
My findings contribute to the literature related to cross-listing. While a large body of
research suggests that shareholder litigation risk is important in shaping the information
environment of foreign firms upon listing in the US (see review in Karolyi 2006, 2012), there is
also evidence suggesting that the significance of shareholder litigation risk is questionable (Licht
2003; Siegel 2005; Licht et al. 2013) or is not obvious (Leuz 2003). The identification of a quasi-
natural experiment enables me to disentangle the effects of shareholder litigation risk from those
of other factors related to a US listing and thus provide more precise evidence related to the effects
of shareholder litigation risk on cross-listed firms’ information environment.
My findings are also relevant to US policymakers who want to maintain the credibility of
US markets while respecting firms’ foreign jurisdictions. Immediately after the Supreme Court
ruling, the US Congress mandated the SEC to conduct a study to consider the extension of laws
7 Notably, my empirical results point to an overall decrease in information asymmetry and bid-ask spread for both US firms and cross-listed firms after the court ruling. This is primarily driven by abnormally high spreads for both set of firms during the global crisis. Figure 1 shows that bid-ask spreads are increasing (or higher) for cross-listed firms relative to US firms after the ruling. My conclusions based on difference-in-differences design focus on changes in bid-ask for cross-listed firms (treatment group) in excess of changes for US firms (control group). 8 Alternatively, I use analysts’ forecasting accuracy to capture the information environment and find some evidence of lower accuracy after the ruling, especially in bad news quarters.
5
governing shareholder litigation to foreign transactions. The SEC study failed to find conclusive
evidence as to the net benefits or costs of shareholder litigation on foreign transactions, but
acknowledged that “this area will be subject to further legal development in the years ahead” (The
SEC study 2012). My results are relevant to this expected legal development and they suggest that
shareholder litigation against cross-listed firms may have been beneficial in the financial markets.
Contemporaneous academic studies examine certain issues related to cross-listed firms and
the Supreme Court ruling, and in particular my study is closely related to Naughton et al. (2015).
Naughton et al. (2015) exploit the ruling to answer a similar research question and also conclude
that lower shareholder litigation risk reduces corporate disclosure. My study differs in two ways.
I focus on the overall information environment of the firm as opposed to specific disclosure (i.e.,
management forecasts). Both of these aspects (i.e., overall information environment and the
specific disclosures) are important. In response to a reduction in shareholder litigation risk, firms
may indeed reduce the frequency of management forecasts, but they may alternatively reduce the
precision of forecasts, simply omit material information, change disclosure tone, or issue
misleading statements.9 Any or all of these disclosure actions, with or without reducing the
frequency of disclosures, may affect firms’ overall information environment, which is the focus of
my study. Additionally, my study provides incremental contribution by documenting the changes
in D&O insurance premiums for Canadian firms with a US listing in the wake of the ruling. This
evidence not only shows that the Supreme Court ruling is a credible shock to litigation risk, but
also provides evidence that litigation risk can be costly to firms.
The remainder of the paper is as follows. Section II describes background information on
the Supreme Court ruling, documents evidence to validate the ruling as a shock to litigation risk,
9 Li, Wasley, and Zimmerman (2016) note that instead of issuing management forecasts to comply with regulation, manages could disclose other information or events.
6
and develops my hypothesis. Section III details my research design. I describe my primary results
in Section IV, associated cross-sectional tests in Section V, and robustness tests in Section VI. I
conclude in Section VII.
II.Backgroundinformation,settingvalidation,andhypothesesdevelopment
Litigation risk and the Supreme Court ruling in Morrison v. National Australia Bank
Shareholders pursue litigation against issuers under Section 10(b) of the Securities
Exchange Act of 1934. Section 10(b) is designed to protect investors from manipulative and
deceptive activities (e.g. material misstatements or omissions with intent to defraud or mislead
investors) that can occur in connection with the purchase or sale of securities. While the application
of Section 10(b) is clear with respect to fraud by domestic firms, there is no clear language with
respect to its application to fraud by cross-listed firms. So on the theory that Congress would not
have wanted to give foreign firms a free pass to defraud investors in the US, or use the US as a
base for fraudulent schemes directed at foreign investors, the courts applied certain tests to
determine the reach of Section 10(b) to cross-listed firms, namely the conduct test and effects test.
The conduct test held that fraudulent activities conducted in the US violated Section 10(b)
even if the associated purchase and sale of securities involved non-US investors. Under the effects
test, Section 10(b) applied if securities fraud occurring in foreign countries “caused foreseeable
and substantial harm to interests in the United States” (the SEC study 2012). Consequently, foreign
firms faced high litigation risk because both foreign and US investors could pursue litigation
against the firm.10
Morrison v. National Australia Bank was a class action on behalf of US and foreign
investors who purchased shares of National Australia Bank (NAB) on foreign exchanges. Shares
10 Foreign firms have been subject to some of the largest class actions. Iliev et al. (2014) note that two of the six largest payouts in US class action securities lawsuits were from foreign firms.
7
of NAB were not traded on any US exchange at the time of the lawsuit. The alleged fraud related
to HomeSide Lending, a company headquartered in Florida and wholly owned by NAB. Petitioners
sued NAB, HomeSide, and officers of both companies in Federal District Court following a decline
in NAB’s share prices after NAB wrote down significant value of HomeSide’s assets. Allegedly,
HomeSide and its officers had intentionally inflated the value of their assets, and NAB and its
chief executive officer were aware of this deception.
The Supreme Court agreed to hear Morrison v. National Australia Bank after the District
Court and the Second Circuit dismissed the case for lack of jurisdiction based on the conduct or
effects tests. In reviewing the case, the Supreme Court determined that application of Section 10(b)
using conduct and effects tests was inconsistent and becoming increasingly difficult to administer.
Accordingly, “rather than guess anew in each case,” the Supreme Court reaffirmed that, unless
otherwise noted, legislation of Congress applies only within the territorial jurisdiction of the US.
Specifically, the Supreme Court stipulated that Section 10(b) does not apply to the place where the
fraud originated, but applies to the purchase and sale of securities in the US. Consequently, the
Supreme Court ruling reduces the litigation risk faced by cross-listed firms by excluding investors
purchasing shares on foreign exchanges, where most of cross-listed firms’ shares are traded.
The ruling had immediate effect on existing and subsequent lawsuits against cross-listed
firms. For instance, prior to the Supreme Court ruling a jury voted in favor of a class consisting of
investors from the US, France, England, and the Netherlands who purchased or otherwise acquired
shares of Vivendi Universal, S.A. However, on February 17, 2011, applying Morrison, a judge
reversed the judgment and dismissed the claims against Vivendi.11 Further, several plaintiffs have
since filed amended complaints to include only purchasers of shares on US exchanges because the
11 In re Vivendi Universal, S.A. Sec. Litig., Memorandum Opion & Order, February 6, 2012
8
Supreme Court ruling held that plaintiffs could not sue issuers for fraud in connection with the
purchase or sale of securities on foreign exchanges.12
Validating the ruling as a setting for lower litigation risk using D&O insurance
In this section I address two concerns that could weaken the identification of a quasi-natural
experiment in the form of a reduction in shareholder litigation risk. First, does litigation risk
decrease in the wake of the Supreme Court ruling? Consistent with findings in Core (2000) and
Baker and Griffith (2007) that litigation risk increases D&O insurance costs, I examine whether
D&O insurance premiums decrease in the wake of the ruling. Second, does litigation impose costs
on firms and thereby affect managerial action? Alexander (1991) suggests that lawsuits are
typically resolved through predictable settlements, which are invariably within D&O limits. When
this occurs it can limit firms’ costs from litigation exposure and as a result managerial actions may
not be materially affected by a change in litigation risk. However, consistent with findings in Baker
and Griffith (2007) I show that D&O insurance premiums are nontrivial such that decreases in
these premiums can influence managerial actions.
Using hand collected D&O insurance data for Canadian firms, I document that the average
premiums for Canadian firms with a US listing were C$549,741 before the ruling but decreased
by roughly 30 percent after the ruling to C$386,190 as shown in Table 1 Panel B. The difference-
in-differences of C$162,028 in the bottom right cell in Panel B confirms the significant decrease
for firms with a US listing (F-test = 12.01, p-value = 0.0005).
Panel C presents multivariate results following the empirical design in Core (2000).13
Column (1) shows the results from a first stage regression of D&O limit on governance and
12 An example of such a development is noted In Sheet Metal Workers Local 32 Pension Fund et al. vs. TEREX CORPORATION, et al., Reply Memorandum of Law …, September 9, 2010. 13 The sample selection, empirical tests, and robustness tests are described in Appendix A.
9
business risk. I then use the residual obtained from the regression in column (1) as a control
variable in estimating a regression of natural logarithm of premium on the indicator variables for
the post period (CPost), cross-listing (CXlisted), and control variables. Results are presented in
columns (2), (3), and (4). After the ruling, I find a reduction in insurance premiums for Canadian
firms with a US listing as evidenced by negative and significant coefficient on CPost * CXlisted
in columns (2) to (4).
Overall, I interpret my findings as evidence that the Supreme Court ruling reduces litigation
risk faced by cross-listed firms and that firms incur litigation costs even when lawsuits settle within
insurance limits. Next, I discuss my hypothesis and design based on the reduction in litigation risk
resulting from the Supreme Court ruling.
Hypotheses development: how litigation risk relates to information environment
On the one hand, higher shareholder litigation risk can improve the information
environment (conversely lower risk can adversely affect firms’ information environment). Cross-
listing signals firms’ commitment to increased disclosure by subjecting the firms to increased
disclosure requirements and stronger legal environment (Coffee 1999; Stulz 1999; Lang et al.
2003; Karolyi 2012). Consistent with La Porta et al. (1998), the commitment is credible because
the US legal environment provides investors with recourse mechanisms if the firms back out on
their commitment. Costly shareholder litigation is one of the recourse mechanism that ensures
credible commitment in the US (Coffee 1999; Gande and Miller 2012; Karolyi 2012). In particular,
Coffee (1999) states that cross-listing in the US entails substantial shareholder litigation risk
because both foreign and US investors could sue a foreign firm in US courts. Several related
studies allude to the significant role of the shareholder litigation risk in shaping the information
environment of the cross-listed firms (for a discussion see Karolyi 2012). In general, firms may
10
provide more voluntary disclosure, thereby enriching their information environment, in order to
deter litigation (e.g., Skinner 1994, Field et al. 2005, Li, Wasley, and Zimmerman 2016). After the
ruling, however, cross-listing in the US no longer entail substantial shareholder litigation risk
because only securities transactions conducted in the US can be litigated in US courts.
Accordingly, on the premise that the substantial litigation risk prior to the ruling is
associated with improvements in foreign firms’ information environment upon listing their shares
in the US, a reduction in litigation risk faced by cross-listed firms after the ruling can lead to a
deterioration in the information environment. Specifically, in the wake of lower litigation risk,
firms may reduce the frequency of disclosures, reduce the precision of their forecasts, change the
tone in the disclosures, or simply omit material information from the issued forecasts or other
disclosures. Firms may also issue misleading statements in their disclosures because lower
shareholder litigation risk lessens the penalties for managers that knowingly make disclosures that
are subsequently proven false (Healy and Palepu 2001). Any or all of these actions may increase
information asymmetries between the firm and its investors, or among investors because corporate
insiders and other investors, such as institutional lenders (Bushman et al. 2010), with access to
private information will become better informed about firm performance.
On the other hand, higher shareholder litigation risk can have no effect on the information
environment. Research related to the reputation hypothesis would suggests that litigation risk does
not meaningfully affect the information environment of cross-listed firms. Licht (2003) and Siegel
(2005) strongly suggest that the market, as opposed to legal enforcement, imposes more
punishment that influences managerial actions. Further, shareholders can pursue litigation against
issuers under Section 10(b) of the Securities Exchanges Act of 1934 for material misstatements or
omissions with intent to defraud or mislead investors, but the law does not impose an overarching
11
duty on managers to disclose information. Therefore, there is no burden lifted as a result of the
Supreme Court ruling that allows firms to reduce disclosure of information and thereby change the
information environment of the firm.14
Other research suggests that lower litigation risk could adversely affect the information
environment (conversely, lower litigation risk can improve the information environment). Firms
are often sued based on statements made in earnings forecasts or on conference calls that may turn
out to be misleading or overly optimistic (e.g., Rogers et al. 2009). As a result, it is possible that
reducing litigation risk might spur managers to make more voluntary disclosures. Johnson et al.
(2001) predict and find that firms disclose more after the Private Securities Litigation Reform Act
(the “PSLRA”) lowered litigation risk for voluntary disclosures. Similarly, Baginski et al. (2002)
find that firms provide more frequent and precise earnings forecasts in Canada, where litigation
risk is lower, relative to the US. Additionally, Rogers and Van Buskirk (2009) find that firms
disclose far less after they are sued suggesting that fear of litigation discourages disclosure. So a
reduction in litigation risk faced by cross-listed firms after the ruling can lead to an improvement
in the information environment.
The discussions above suggest a lack of consensus on how litigation risk affects voluntary
disclosure. Accordingly, I do not provide directional hypotheses but test whether and how a
reduction in litigation risk affects the information environment of the firm.
III.Researchdesign
Sample selection
I define cross-listed firms as foreign firms that trade their shares on a major US exchange
(NYSE, AMEX, NASDAQ) in addition to their local, non-US exchanges. The cross-listed firms
14 It is important to note, however, that many experienced practitioners advise clients to behave as if the securities laws imposed an affirmative disclosure obligation (Cox et al. 2001, Rogers and Van Buskirk 2009).

12
are identified in CRSP by share code (SHRCD) as firms incorporated in foreign countries (SHRCD
= 12) or exchange traded American Depositary Receipts (ADRs) (SHRCD = 31). Following
existing studies (e.g. Fernandes and Ferreira 2008; Iliev et al. 2014), I verify cross-listed firms
from a variety of sources including directly from the stock exchanges’ web sites and from
depository institutions (Bank of New York, Citibank, and JP Morgan). I supplement the sample
with firms registered with the SEC as international registered and reporting companies as of
December 31, 2009 and that are used in the SEC study (2012).
I create my primary control sample using the universe of COMPUSTAT firms incorporated
and headquartered in the US (FIC = “USA” and LOC = “USA”). US firms provide a set of control
firms that faced similar litigation risk prior to the ruling, are unaffected by the Supreme Court
ruling, and are reasonably comparable to the cross-listed firms.15
Table 2 panel A reports the sample distribution by country of location after eliminating
firm-quarters with missing values for all the control variables in the primary tests. I obtain primary
data for bid-ask spread from CRSP, accounting data from COMPUSTAT, and analysts’ data from
I/B/E/S. I require firms to report quarterly earnings at least once in both the three years before and
after the Supreme Court, June 24, 2010. I exclude financial and regulated industries. The final
sample has 9,015 (447) cross-listed firm-quarters (firms) and 56,412 (2,617) US firm-quarters
(firms). Most of the cross-listed firms in my sample are located in Canada (111 firms, 24.8
percent), China (68 firms, 15.2 percent), and Israel (60 firms, 13.4 percent). Each of all other
countries has fewer than five percent of total cross-listed firms.
15 Further, on the premise that Canadian firms face a legal environment that is somewhat similar to US firms (Monestier 2011; Cheng et al. 2014), I perform my analyses with and without Canadian firms. I still expect the litigation costs for Canadian firms to decrease in the wake of limited legal liability in the US because a US listing is very costly for Canadian firms; Canadian firms with a US listing pay higher directors’ and officers’ insurance premiums (Core 2000; evidence in this paper).
13
Panel B presents the distribution of the sample by industry groupings defined in Barth et
al. (1998). Firm-quarters in the sample are concentrated in the following industries: computers
(18.3 percent), durable manufacturers (24.7 percent), retail (10.5 percent), and services (10.5
percent). Additionally, over one third of cross-listed firm-quarters are in the mining and
construction, and transportation industries.
Measuring information environment
I use information asymmetry to capture information environment.16 My proxy for
information asymmetry is bid-ask spread on the premise that a portion of the bid-ask is attributed
to information asymmetry (e.g. Coller and Yohn 1997; Muller and Riedl 2002; Muller et al. 2011;
Shroff et al. 2013). Stoll (1978) and Copeland and Galai (1983) provide theoretical evidence that,
in order to recoup losses incurred from transactions by informed traders, market makers widen the
bid-ask spread when they perceive increased information asymmetry in the stock market of a firm.
I define Bid_Ask as the average daily relative bid-ask spread calculated as follows: ((Ask
– Bid) / 0.5 (Ask + Bid)) measured over the pre-announcement period from the last day of the
fiscal quarter to three days before the current quarter earnings announcement date (the
measurement period).17 Ask is the daily closing ask price, and Bid is the daily closing bid price.18
Bid_Ask is increasing in information asymmetry such that a positive association signals high
information asymmetry.
16 I use information asymmetry to capture information environment because Armstrong et a. (2012) characterize information environment as variations in information asymmetry between managers and investors, information asymmetry among investors, informativeness of public financial statements, analyst following, and private information gathering (see also Frankel and Li 2004; Beyer et al. 2010). 17 This measurement period captures preemptive disclosures occurring after the end of the fiscal quarter but before the earnings announcement date (Francis et al. 1994; Skinner 1997). The results in this paper are robust to using full fiscal quarter. I discuss the robustness tests later in the paper. 18 I include only positive spreads less than or equal to $10 to minimize data errors (Coller and Yohn 1997). I use ‘bid-ask’, ‘bid-ask spread’, and ‘spreads’ interchangeably to refer to Bid_Ask.
14
Measuring low share activity on US exchanges
As issuers can now only be sued for fraud in connection with US traded shares, cross-listed
firms with low share activity on US exchanges are subject to lower shareholder litigation risk. To
capture low share activity in the US, I utilize US transactions data from CRSP to identify firms’
trading volume and shares outstanding on US exchanges. CRSP provides the shares outstanding
(SHROUT) only for the security, not the total shares for the company. That is, the shares
outstanding for ADRs are the shares outstanding of the ADRs, not the underlying issue. Similarly,
trading volume (VOL) is obtained from activity on US exchanges only.
Using this data, I define LoShr (LoVol) as an indicator variable equal to one if shares
outstanding (trading volume) on US exchanges is below the average for all the cross-listed firms
in my sample and zero otherwise. A positive association between information asymmetry and these
variables indicate more pronounced deterioration in the information environment of cross-listed
firms, whose legal exposure is reduced because of their low share activity in the US.
Empirical tests
To test for the changes, if any, in cross-listed firms’ information environment in the wake
of lower shareholder litigation risk resulting from the Supreme Court ruling, I employ a difference-
in-differences design as follows:
_ , = ∗ , ∗ , ∗ ,
∑ ∗ , μ , (1)
Following prior literature, I estimate the regressions on natural logarithm of all variables,
except for indicator variables, to address the theoretical multiplicative relationships between the
determinants of bid-ask spread (e.g. Stoll 1978).19 I include firm-fixed effects, represented by α, to
19 I adjust continuous variables with negative or zero observations by adding an appropriate constant (x). For example, the minimum possible value for analyst following is zero so LogAnalysts = Log (1+Analysts).
15
control for unobserved firm characteristics.20 The regression error term is represented by µ.
LogBid_Ask is the natural logarithm of bid-ask spread and is the proxy for information
asymmetry. Post is an indicator variable equal one if firm-quarters fall after June 24, 2010 and
zero otherwise. Xlisted is an indicator variable equal one if the firms is cross-listed and zero
otherwise. The difference-in-differences design allows me to attribute changes in information
environment of the cross-listed firms (treatment group) in excess of changes for US firms (control
group) to the treatment effect of the reduction in shareholder litigation resulting from the ruling.
This is captured by the coefficient on Post * Xlisted. A positive (negative) coefficient indicates
that cross-listed firms have incrementally higher (lower) information asymmetry in the post period
(i.e., after the ruling).
To show that firms with low share activity in the US face lower litigation risk, and hence
higher information asymmetry in the wake of the ruling, I re-estimate equation (1) with additional
terms for low share activity as follows:
_ , = ∗ , ∗ , ∗ , ∗ ,
∗ , ∗ , ∗ ,
∑ ∗ , μ , (2)
The term USActivity represents separate regressions for LoShr and LoVol. A positive
coefficient on Post * Xlisted * USActivity signals higher information asymmetry for cross-listed
firms whose shares outstanding or trading volume in the US are below average.21
I include control variables (Control(k)) drawn from existing theoretical predictions on bid-
20 Firm-fixed effects absorb the main effect for Xlisted, which is thus omitted from the regression estimation. 21 Interaction terms Post * USActivity and Xlisted * USActivity are omitted because, by construction, only cross-listed firms have low US Activity such that USActivity Xlisted * USActivity. Thus, Post * USActivity = Post * Xlisted * USActivity and Xlisted * USActivity = USActivity. I keep Post * Xlisted * USActivity for ease of interpreting results as effects of lower litigation risk after the ruling for cross-listed firms with low US activity.
16
ask spread. First, I include a set of control variables, LogTurnover, LogPrice, and LogRisk, to
control for the market makers’ inventory holding costs and order costs, which are portions of bid-
ask not attributed to information asymmetry. LogTurnover is the natural logarithm of daily average
share volume divided by shares outstanding during the measurement period. I use turnover on the
premise that holding costs and order costs are a function of trading activity (Stoll 1978; Coller and
Yohn 1997). Further, Demsetz (1968) suggests that order costs are affected by the demand for the
market makers’ services, which can be reflected by trading volume or trading activity. LogPrice
is the natural logarithm of average daily closing price during the measurement period, and controls
for order processing costs. LogRisk is the variance of daily returns during the measurement period
and proxies for return variability.
Second, I include a set of variables that capture public information availability and firm
characteristics that impact the information environment of the firm. Prior evidence suggests firm
size and analysts following are associated with greater availability of public information and more
transparent information environment of the firm. Specifically, analyst following controls for
private information acquisition by analysts and analysts’ scrutiny that affects a firm’s information
environment. Firm size is the natural logarithm of market capitalization plus total liabilities at the
end of the previous quarter (LogSize). Analysts following is the natural logarithm of one plus
number of analysts following the firm during the quarter (Log(1+Analysts)).22 I also control for
the natural logarithm of one plus the percent of shares held by institutional investors
(Log(1+InstOwn)). Existing evidence suggests a relation between disclosure and institutional
ownership. Additionally, I control for leverage on the premise that the monitoring by creditors and
the private information transfer between creditors and borrowers affects the firms’ information
22 I treat missing values for analysts as zero.

17
environment. Leverage is the natural log of one plus total debt divided by total assets at the end of
the previous fiscal quarter ((Log(1+leverage)).
I also control for growth opportunities and firm performance as these firm characteristics
are likely to influence managerial disclosure incentives. Growth opportunities are captured by the
natural logarithm of market-to-book ratio, measured as the market value of equity divided by the
book value of equity at the end of the previous quarter (LogMTB). Firm performance is the natural
logarithm of one plus the return on assets measured as income before extraordinary items divided
by the book value of total assets at the end of the previous quarter (Log(1+ROA)). I also control
for bad news (BNews), captured by Loss or NEG. Loss is an indicator variable equal to one if
current income is negative and zero otherwise. NEG is an indicator variable equal to one if the
cumulative abnormal return is negative and zero otherwise.
Third, I include LogGDP, Legal, and Recession to control for the effect of macro factors
on the firms’ information environment. LogGDP is the gross domestic product per capita (World
Economic Outlook Database, April 2013). Legal is an indicator variable equal one if the mean
score across three governance variables: (1) regulatory quality, (2) rule of law, and (3) control of
corruption (La Porta et al. 1998) is below average and zero otherwise.23 Each variable ranges from
approximately -2.5 (weak) to 2.5 (strong). Recession is an indicator variable equal one if firm-
quarters fall between December 2007 and June 2009 and zero otherwise (the National Bureau of
Economic Research).
Lastly, I control for the stock exchange the firm is listed on. I include indicator variables
for NYSE and NASDAQ, with AMEX omitted. The majority of publicly traded firms in the US
are listed on NYSE and NASDAQ and these two exchanges have some differences in how trades
23 La Porta et al. (1998) uses (1) judicial system efficiency, (2) rule of law assessment, and (3) corruption index from the International Country Risk Guide. I obtain free data from the World Bank Corporate Governance Indicators.
18
are executed, which could influence bid-ask spread. Investors on NYSE trade directly with other
investors and specialists facilitate the trades by matching buy order and sell orders. In some cases,
the specialists can buy or sell from their own inventories of shares. Investors on NASDAQ trade
with market maker. In both markets, however, information is important and informed trading can
impact bid and ask prices.
IV.Empiricalresults
Descriptive statistics
Table 3 presents summary statistics. The results show that, on average, cross-listed firms
and US firms have similar information asymmetry as evidenced by statistically insignificant
difference between average bid-ask spread for cross-listed firms (0.81 percent) and US firms (0.82
percent). Consistent with existing evidence, an average cross-listed firm in my sample is
significantly larger, but has less analyst coverage relative to an average US firm. An average cross-
listed firm is followed by 1.86 analysts and an average US firm is followed by 3.46 analysts. With
respect to leverage and ownership, US firms are highly levered at 0.58 debt-to-assets compared
with 0.24 debt-to-assets for cross-listed firms, and US firms in my sample have slightly fewer
institutional shareholders (17.5 percent) compared with cross-listed firms (18.2 percent). Further,
the results show that US firms have more growth opportunities as measured by market-to-book
ratio (3.06) relative to cross-listed firms (2.71). However, as measured by return on assets, the
average cross-listed firms have better economic performance relative to US firms. The means are
statistically different at the 1% level.
Hypothesis testing: univariate results
To test the effects of litigation risk on information asymmetry, I perform analyses on
changes in bid-ask before the ruling (pre-period) and after the ruling (post-period). Table 4 shows
19
univariate comparisons of means of bid-ask between cross-listed firms and US control firms across
the pre and post period.24 Overall, the level of information asymmetry decreases for both cross-
listed and US firms. The percentage bid-ask spread for US firms decreases by 0.35 from 0.99 in
the pre-period to 0.65 in the post-period. In panel A, Cross-listed firms, with Canada, have 0.95
and 0.68 average percentage bid-ask spread in the pre and post-period, respectively, for a decrease
of 0.26. While the bid-ask spread is slightly higher for US firms in the pre-period, the US firms
experience significantly larger decreases such that cross-listed firms have higher bid-ask spread in
the post period. The decreases (i.e. differences in spread between pre and post-period) for US firms
(0.35) and cross-listed firms (0.26) yield a difference-in-differences of 0.08, which is significant
at the 5% level (F-stat = 5.48).
The difference-in-differences test is even stronger in Panel B, where cross-listed firms,
without Canada, have 0.90 and 0.71 average percentage bid-ask spread in the pre-period and post-
period, respectively, for a decrease of 0.19. Based on the 0.35 decrease for US firms, the resulting
difference-in-differences in Panel B is 0.155, which is significant at the 1% level (F-stat = 14.10).
Overall, these univariate results suggest that the information environment is poorer for
cross-listed firms relative to US firms in the wake of the Supreme Court ruling. While there is an
overall decrease of information asymmetry and bid-ask spread for both US firms and cross-listed
firms after the court ruling as evidence by lower mean bid-ask in the post-period, my conclusions
based on difference-in-differences design focus on the change in bid-ask for cross-listed firms (the
treatment) relative to the US firms (the control).
Further, Figure 1 shows that in the periods after the ruling (particularly starting in 2011),
24 I perform analyses with (w/) and without (w/o) Canada because some evidence suggests that the legal environment in Canada is closely similar to the US yet the Canadian legal system is less conducive to meritless lawsuits over stock price declines that are prevalent in the US (Baker and Griffith 2007).
20
cross-listed firms have increasing (or higher) bid-ask spread relative to US firms. The overall
decrease in bid-ask spread is driven by the abnormally high levels exhibited during the global
financial crisis, as shown in Figure 1. The decrease is consistent with the bid-ask spread reverting
to the pre-crisis levels noted in 2007 Q1. The figure shows that bid-ask spreads for cross-listed
firms do trend in a similar pattern and are mostly lower than that for US firms prior to the ruling.25
Hypothesis testing: multivariate results
My results that information asymmetry increases for cross-listed firms relative to US firms
in the wake of the Supreme Court ruling are robust to controlling for factors identified in prior
literature as determinants of information asymmetry. I estimate equations (1) with LogBid_Ask as
the dependent variable and present the results in Table 5. The positive and significant coefficients
on Post * Xlisted suggest that cross-listed firms have significantly higher bid-ask relative to US
firms in the post-period. The results with Canadian firms show that the Supreme Court ruling is
associated with 7.6 percent higher bid-ask for cross-listed firms relative to US firms (γ = 0.07; t-
stat = 3.59), and the results without Canadian firms show a 10.7 percent higher bid-ask for cross-
listed firms (γ = 0.10; t-stat = 4.25).26
The control variables are mostly significant and have signs in line with existing findings.
For example, using columns with Canada, the coefficients on LogTurnover (γ = -0.21; t-stat = -
45.79) and LogPrice (γ = -0.57; t-stat = -52.34) are negative and coefficient on LogRisk (γ = 0.18;
t-stat = 54.10). Moreover, coefficients on LogSize (γ = -0.10; t-stat = -8.49), LogAnalysts (γ = -
0.10; t-stat = -19.49) and LogInstown (γ = -0.49; t-stat = -10.54) are negative consistent with larger
25 For this reason, I believe the global financial crisis would not affect the inferences drawn from my analyses in this paper or diminish the usefulness of the Supreme Court ruling as an exogenous shock. 26 I interpret the exponentiated regression coefficients when the outcome variable is log transformed (i.e. Log Bid-Ask). These values correspond to changes in the ratio of the expected geometric means of the original outcome variable. For example, in my analysis 7.6 percent higher bid-ask spread for cross-listed firms with Canada is derived from 1 - e(Post * Xlisted) = 1 - e(0.07..). (Introduction to SAS. UCLA: Statistical Consulting Group. From http://www.ats.ucla.edu/stat/sas/notes2/ as last accessed November 29, 2014).
21
firms, firms with more analysts’ coverage, and higher institutional ownership having more
transparent information environment. Loss firms are associated with higher information
asymmetry (γ = 0.02; t-stat = 3.35). Further, firms from high GDP per capita countries have lower
information asymmetry (γ = -0.60; t-stat = -8.77).
In Table 6, I present results from estimating equation (2) for share activity in the US. As
predicted, after the ruling, cross-listed firms with low share activity in the US have higher
information asymmetry than the cross-listed firms with high US share activity. The results in both
Panel A and B show very strong positive coefficients on Post * Xlisted * LoShr(LoVol). In Panel
A, the coefficients on Post * Xlisted * LoShr show that cross-listed firms (including Canada) with
fewer shares outstanding in the US have about 28.4 percent higher bid-ask than other cross-listed
firms (γ = 0.25; t-stat = 5.88). Without Canada, the coefficients on Post * Xlisted * LoShr show
that cross-listed firms with fewer shares outstanding in the US have about 30.0 percent higher bid-
ask relative to other cross-listed firms in the wake of the ruling (γ = 0.26; t-stat = 4.38). Similarly,
in Panel B coefficients on Post * Xlisted * LoVol show that cross-listed firms with low trading
volume have about 21.3 and 20.1 percent higher bid-ask.
Overall, the evidence suggests that the change in information asymmetry reflects a poorer
information environment for cross-listed firms relative to US firms after the ruling. Moreover,
after the ruling, the results are more pronounced for cross-listed firms with less exposure to
shareholder litigation risk because of below average shares outstanding or trading volume in the
US. I interpret these results as evidence that litigation risk plays a role in shaping the information
environment of cross-listed firms upon listing in the US.
V.Cross‐sectionalanalyses
To provide further support for my results, I examine the effects of lower litigation risk in
22
bad news firm-quarters and for firms from countries with weak legal institutions.
Litigation risk effects in bad news firm-quarters
Prior evidence suggests that managers consider bad news disclosures very differently from
good-news disclosures (Graham et al. 2005; Lowry 2009) and that managers generally have strong
incentives to withhold information due to costs associated with disclosure (Verrecchia 1983;
Kothari et al. 2009).27 However, managers also have incentives to preemptively disclose bad news
to mitigate litigation risk (Skinner 1994; Graham et al. 2005; Kothari et al. 2009; Roychowdhury
and Sletten 2012). For example, survey evidence in Graham et al. (2005) shows that the majority
of managers would disclose bad news faster than good news to avoid lawsuits.
Accordingly, I expect that a reduction in the litigation risk provides managers with an
opportunity to delay release of bad news.28 To test this effect of litigation risk in bad news firm
quarters, I re-estimate equation (1) including interactions for bad news firm-quarters as follows:
_ , = ∗ , ∗ , ∗ , ∗ , ∗ ,
∗ , ∗ , ∗ , ∗ , ∗ ,
∑ ∗ , μ , (3)
The coefficient of interest is (γ5) on Post * Xlisted * BNews and I expect γ5>0. I present the
results in Table 7. Bad news is alternatively captured by negative current earnings per share (Loss)
in Panel A and negative abnormal returns (NEG) in Panel B. In Panel A, the coefficients on Post
* Xlisted * Loss is positive as expected but is not statistically significant in the analysis with
Canadian firms (γ = 0.03; t-stat = 1.01). That is, I document that cross-listed firms have higher bid-
ask than US firms in the wake of the ruling (Post * Xlisted + Post * Xlisted * Loss > 0), but I find
27 Costs include drop in wealth tied to firm’s share price, which predictably falls after disclosure of bad news (see Milgrom 1981). 28 Roychowdhury and Sletten (2012) suggest that when perceived litigation risk is low bad news remains undisclosed until the time of actual earnings announcement.
23
no evidence that the effect of litigation risk is more pronounced for cross-listed firms (including
Canada) in bad news quarters. However, without Canada, I do find evidence that that the effect of
litigation risk is more pronounced for cross-listed firms in bad news quarters (γ = 0.07; t-stat =
1.81). This evidence is even stronger when I capture bad news by negative abnormal returns in
Panel B. With or without Canada, the evidence in Panel B suggests that cross-listed firms have
significantly higher bid-ask spread than US firms and that the results are more pronounced in bad
news firm-quarters.
Overall, I interpret the results as evidence that lower litigation risk reduces the cost of
withholding bad news information, and that litigation risk is an important factor in shaping firms’
information environment.
Litigation risk effects on firms from countries with weak legal institutions
I expect firms from countries with weak legal environment to have higher information
asymmetry in the wake of lower shareholder litigation risk. I define Legal as an indicator variable
equal to one when legal enforcement is below average for the countries in my sample, and zero
otherwise. I then estimate the following regression:
_ , = ∗ , ∗ , ∗ , ∗ ,
∗ , ∗ , ∗ ,
∑ ∗ , μ , (4)
The coefficient of interest is on Post * Xlisted * Legal and I expect a positive coefficient
consistent with firms from countries with weak legal environment having higher information
asymmetry that other cross-listed firms. All the variables are as defined in equation (1) above and
in Table B1 in Appendix B.29
29 The interaction terms Post * Legal and Xlisted * Legal are omitted because only cross-listed firms can be from weak legal environments such that Legal Xlisted * Legal. Therefore, by construction, Post * Legal = Post * Xlisted * Legal and Xlisted * Legal = Legal. I choose to keep Post * Xlisted * Legal such that the results are easily interpreted
24
I present the results in Table 8 and show that, all else equal, the effect of litigation risk on
cross-listed firms is driven by cross-listed firms domiciled in countries with weak legal
environment. Cross-listed firms (including Canada) have 23.4 percent higher bid-ask spread than
other cross-listed firms (γ = 0.21; t-stat = 5.51), and cross-listed firms (excluding Canada) have
31.7 percent higher bid-ask spread than other cross-listed firms (γ = 0.28; t-stat = 5.23).
Overall, the evidence suggests that following a reduction in litigation risk, cross-listed
firms from countries with weak legal institutions have higher information asymmetry than other
cross-listed firms. This evidence supports the notion that firms from countries with weak investor
protection environment are more likely to react opportunistically to lower litigation risk.
VI.Robustnesstests
Matched sample design
In my primary analyses, the set of control firms is comprised of all US firms meeting data
requirements. I use all the US firms because it is not clear that there is a uniform application of
litigation risk models to foreign firms and US firms (Cheng et al. 2014). Nonetheless, for
robustness, I replicate the primary analyses using cross-listed firms and matched US firms. I create
the matched sample by randomly matching cross-listed firms to US firms with the closest predicted
litigation risk (i.e. nearest neighbor matching without replacement). Following Iliev et al. (2014) I
compute the predicted litigation risk based on the coefficients in model 3 of table 7 of Kim and
Skinner (2012) and firm-level variables measured prior to the Supreme Court ruling. The firm-
level variables are membership in high litigation risk industry, natural log of total assets, sales
growth, abnormal returns, standard deviation of returns, returns skewness, and share turnover. I
standardize the firm-level variables and normalize the resulting predicted litigation risk to a range
as effects on bid-ask spread in the post period for cross-listed firms from weak legal environment.
25
between 0 and 1.
I replicate my primary analyses, and document largely consistent results. I document
similar results in all multivariate analyses in Table 5 to Table 8, except for Table 7 Panel A.
Overall, because mostly all the replicated results are consistent with my primary results, I conclude
that the matched sample design does not change my inferences.30
The measurement period as full fiscal quarter
My primary analyses are performed over the pre-announcement period, measured from the
end of the fiscal quarter to three days before actual earnings announcement date (Francis et al. 1994;
Skinner 1997). For robustness, I measure bid-ask spread and related control variables (turnover,
price, and risk) over the full quarter to capture both earnings forecasts and preemptive disclosures
over three days after previous quarter’s earnings announcement to three days before current fiscal
quarter earnings announcement.
I re-estimate all the multivariate regressions and find largely consistent results. I document
higher information asymmetry for cross-listed firms and especially for cross-listed firms with low
share activity in the US. I also document higher information for cross-listed firms from countries
with weak legal environment. Further, I document some weak evidence for higher information
asymmetry for bad news firm-quarters, as captured by negative cumulative returns. However, the
results for bad news firm quarters as captured by the loss indicator for the current fiscal quarter
are not significant with or without Canada. The results are not tabulated.
Overall, because the majority of the tests are significant and as predicted, I conclude that
there is higher information asymmetry for cross-listed firms in the wake of the ruling.
30 The replication analyses are not tabulated, but are available upon request.
26
Analysts’ forecasting accuracy as proxy for information asymmetry
I alternatively use analysts’ forecasting accuracy to capture firms’ information
environment. The frequency, completeness, tone, and accuracy of firm disclosures influence the
accuracy of analysts’ forecasts. Accordingly, as lower shareholder litigation risk weakens
credibility of disclosure and thereby affects any of the properties of firm disclosures, I expect less
accurate forecasts for cross-listed firms’ earnings. I replicate the multivariate and cross-sectional
analyses with forecasting accuracy (Accuracy) as the dependent variable.
I measure forecasting accuracy (Accuracy) as negative one multiplied by the absolute value
of the difference between actual earnings and mean forecast, scaled by the stock price at end of
the previous quarter. The mean forecast is measured three days prior to current quarter earnings
announcement. Actual earnings for the quarter are as reported in I/B/E/S. I multiply by (–100) to
give a measure that increases with greater forecasting accuracy and is expressed as a percent of
price. So a negative association with Accuracy signals less accurate analysts’ forecasts or higher
information asymmetry. I control for the same factors included in the primary analyses. I do,
however, exclude the control variables associated with bid-ask spread, namely turnover, risk, and
price. I also replace natural logarithm of total assets for firm size. Additionally, I control for
earnings volatility on the premise that volatile earnings are difficult to forecast.
I present the results in Table 9 and Table 10. After the ruling, I show that the forecasting
accuracy for cross-listed firms decreases relative to US firms. Table 9 shows that, all else equal,
forecasting accuracy for cross-listed firms’ earnings with (without) Canada decrease by about 0.09
(0.14) percent more than that for US firms. Further, evidence in Table 10 suggests that the decrease
in analysts’ forecasting accuracy is primarily driven by cross-listed firms with negative earnings
per share in the current quarter. The coefficient on Post * Xlisted is negative but insignificant, and
27
the coefficient on Post * Xlisted * Loss is negative and significant with Canada (γ = -0.34; t-stat =
-1.80) or without Canada (γ = -0.38; t-stat = -2.06). I interpret the results as evidence that lower
shareholder litigation risk causes managers to decrease guidance to analysts, thereby leading to
less accurate forecasts when the firm has a loss in the current quarter. This is consistent with extant
findings that analysts have difficulty estimating losses (e.g. Hwang et al. 1996).
However, I find no evidence of differences between accuracy of cross-listed firms in good
news firm-quarters and bad news firm-quarters when bad news is alternatively captured by
negative abnormal returns. Further, there is no statistically incremental decrease in accuracy of
cross-listed firms domiciled in countries with weak legal environments. There is also no difference
between cross-listed firms with low or high share activity in the US. In all these cases, however,
the overall accuracy for cross-listed firms’ earnings forecasts decreases as evidenced by negative
and statistically significant coefficients on Post * Xlisted. These cross-sectional tests are not
tabulated.
VII.Conclusion
Prior literature suggests that cross-listed firms’ information environment improves upon
listing in the US, but the literature is unable to disentangle the effects of the various factors causing
improvements in the information environment. Cross-listing simultaneously exposes foreign firms
to increased disclosure requirements, stricter regulatory and investor scrutiny, and higher litigation
risk. I extend this literature by examining the effects of shareholder litigation risk using a reduction
in shareholder litigation risk faced by cross-listed firms resulting from the 2010 Supreme Court
ruling in Morrison v. National Australia Bank,
I examine the effects of litigation risk on the firms’ information environment, as captured
by information asymmetry. After the ruling, I document higher information asymmetry for cross-

28
listed firms and show that the information asymmetry is particularly higher for cross-listed firms
with low share activity on US exchanges. I also document that information asymmetry is higher
for bad news firm-quarters and for firms from countries with weak legal environment. To provide
evidence to support the notion that shareholder litigation risk decreases in the wake of the Supreme
Court ruling, I show that D&O insurance premiums decrease after the ruling.
Overall, my findings are consistent with the notion that the Supreme Court ruling reduces
shareholder litigation risk faced by cross-listed firms and that the lower shareholder litigation risk
is associated with deterioration in the information environment. By implication, my findings
suggest that previously documented improvements in the information environment of foreign firms
upon listing their shares in the US may be attributed to the higher shareholder litigation risk
associated with the US legal environment.
29
References
Alexander, J. C. 1991. Do the merits matter? A study of settlements in securities class actions. Stanford Law Review, 497-598. Armstrong, C. S., Balakrishnan, K., and D. Cohen. 2012. Corporate governance and the information environment: Evidence from state antitakeover laws. Journal of Accounting and Economics 53 (1): 185-204. Baginski, S.P., J.M. Hassell, and M.D. Kimbrough. 2002. The effect of legal environment on voluntary disclosure: Evidence from management earnings forecasts issued in US and Canadian markets. The Accounting Review, 77(1), pp.25-50. Baker, T., and S. J. Griffith. 2007. Predicting Corporate Governance Risk: Evidence from the Directors'& Officers' Liability Insurance Market. The university of Chicago law review, 487-544. Barth, M. E., Beaver, W. H., and W. R. Landsman. 1998. Relative valuation roles of equity book value and net income as a function of financial health. Journal of Accounting and Economics 25 (1): 1-34. Bartlett, R. P. 2013. Do Institutional Investors Value the 10b-5 Private Right of Action? Evidence from Investor Trading Behavior Following Morrison v. National Australia Bank Ltd. Working paper, UC Berkeley. Available at SSRN: http://ssrn.com/abstract=2171006. Beyer, A., D. A. Cohen, T. Z. Lys, and B. R. Walther. 2010. The financial reporting environment: Review of the recent literature. Journal of accounting and economics 50 (2): 296-343. Bushman, R. M., A. J. Smith, and R. Wittenberg-Moerman. 2010. Price discovery and dissemination of private information by loan syndicate participants. Journal of Accounting Research 48 (5): 921-972. Cheng, B., S. Srinivasan, and G. Yu. 2014. Securities Litigation Risk for Foreign Companies Listed in the US. Working paper, Harvard Business School. Available at SSRN: http://ssrn.com/abstract=2163864. Chung, H. H. and J. P. Wynn. 2008. Managerial legal liability coverage and earnings conservatism. Journal of Accounting and Economics 46 (1): 135-153. Coffee Jr, J. C. 1999. The Future as History: The Prospects for Global Convergence in Corporate Governance and Its Implications. Northwestern University Law Review, 641–708. ________. 2002. Racing towards the top? The impact of cross-listings and stock market competition on international corporate governance. Columbia Law Review 102: 1757–1831. Coller, M. and T. L. Yohn. 1997. Management forecasts and information asymmetry: An examination of bid-ask spreads. Journal of Accounting Research 35: 181-191.
30
Copeland, T. E. and D. Galai. 1983. Information effects on the bid‐ask spread. The Journal of Finance 38: 1457-1469. Core, J. E. 2000. The directors' and officers' insurance premium: An outside assessment of the quality of corporate governance. Journal of Law, Economics, and Organization 16 (2): 449-477. Demsetz, H. 1968. The cost of transacting. The Quarterly Journal of Economics 82: 33-53. Fernandes, N., and M. A. Ferreira. 2008. Does international cross-listing improve the information environment. Journal of Financial Economics 88 (2): 216-244. Francis, J., D. Philbrick, and K. Schipper. 1994. Shareholder litigation and corporate disclosures. Journal of accounting research, 137-164. Frankel, R., and X. Li. 2004. Characteristics of a firm's information environment and the information asymmetry between insiders and outsiders. Journal of Accounting and Economics 37 (2): 229-259. Gagnon, L. J., and A. G. Karolyi. 2012. The economic consequences of the US Supreme Court’s Morrison v. National Australia Bank decision for foreign stocks cross-listed in US markets. Working paper, Cornell University. Available at SRN: http://ssrn.com/abstract=1961178. Gande, A., and D. P. Miller. 2012. Why Do US Securities Laws Matter to Non-US Firms? Evidence from Private Class-Action Lawsuits. Working paper, Southern Methodist University. Available at SSRN: http://ssrn.com/abstract=1939059. Graham, J. R., C. R. Harvey, and S. Rajgopal. 2005. The economic implications of corporate financial reporting. Journal of Accounting and Economics 40: 3-73. Healy, P. M., and K. G. Palepu. 2001. Information asymmetry, corporate disclosure, and the capital markets: A review of the empirical disclosure literature. Journal of accounting and economics 31 (1): 405-440. Hwang, L., C. Jan, and S. Basu. 1996. Loss firms and analysts' earnings forecast errors. The Journal of Financial Statement Analysis 1 (2). Iliev, P., D. P. Miller, and L. Roth. 2014. Uninvited US Investors? Economic Consequences of Involuntary Cross-Listings. Journal of Accounting Research 52: 473–519 Johnson, M.F., R. Kasznik, and K.K. Nelson. 2001. The impact of securities litigation reform on the disclosure of Forward‐Looking information by high technology firms. Journal of Accounting Research, 39(2), pp.297-327. Karolyi, G. A. 2006. The world of cross-listings and cross-listings of the world: Challenging conventional wisdom. Review of Finance 10: 99-152.
31
_______. 2012. Corporate governance, agency problems and international cross-listings: A defense of the bonding hypothesis. Emerging Markets Review 13 (4): 516-547. Kim, I., and D. J. Skinner. 2012. Measuring securities litigation risk. Journal of Accounting and Economics 53 (1): 290-310. Kothari, S. P., S. Shu, and P. D. Wysocki. 2009. Do managers withhold bad news? Journal of Accounting Research 47: 241-276. La Porta, R., F. López de Silanes, A. Shleifer, and R. Vishny. 1998. Law and finance. Journal of Political Economy 106: 1113-1155. Lang, M. H., K. V. Lins, and D. P. Miller. 2003. ADRs, analysts, and accuracy: Does cross listing in the United States improve a firm's information environment and increase market value? Journal of Accounting Research 41: 317-345. Leuz, C. 2003. Discussion of ADRs, Analysts, and Accuracy: Does Cross‐Listing in the United States Improve a Firm's Information Environment and Increase Market Value? Journal of Accounting Research 41: 347-362. ____. 2006. Cross listing, bonding and firms’ reporting incentives: A discussion of Lang, Raedy and Wilson (2006). Journal of Accounting and Economics 42: 285-299. Li, E., C. Wasley, and J. Zimmerman. 2016. The Disclose or Abstain Incentive to Issue Management Guidance. Journal of Law, Finance, and Accounting 1: 187-233. Licht, A. N. 2003. Cross-listing and corporate governance: bonding or avoiding. Chicago Journal of International Law 4: 141-163. ____, C. Poliquin, J. I. Siegel, and X. Li. 2013. What Makes the Bonding Stick? A Natural Experiment Involving the Supreme Court and Cross-Listed Firms. Working paper, Harvard Business School. Available at SSRN: http://ssrn.com/abstract=1744905. Lowry, M. 2009. Discussion of ‘Shareholder litigation and changes in disclosure behavior’. Journal of Accounting and Economics 47: 157-159. Milgrom, P. R. 1981. Good news and bad news: Representation theorems and applications. The Bell Journal of Economics 12: 380-391 Monestier, T. J. 2011. Is Canada the New Shangri-La of Global Securities Class Actions. Northwestern Journal of International Law & Business 32: 305 - 364. Muller III, K. A. and E. J. Riedl. 2002. External monitoring of property appraisal estimates and information asymmetry. Journal of Accounting Research 40: 865-881.
32
________, E. J. Riedl, and T. Sellhorn. 2011. Mandatory fair value accounting and information asymmetry: evidence from the European real estate industry. Management Science 57: 1138-1153. Naughton, J. P., T. O. Rusticus, C. Wang, and I. Yeung. 2015. Private Litigation Costs and Voluntary Disclosure: Evidence from the Morrison Ruling (October 7, 2015). Available at SSRN: http://ssrn.com/abstract=2432371 Roychowdhury, S., and E. Sletten. 2012. Voluntary disclosure incentives and earnings informativeness. The Accounting Review 87 (5): 1679-1708. Securities Exchanges Commission (SEC). 2012. The Study on the Cross-Border Scope of the Private Right of Action under Section 10(b) of the Securities Exchange Act of 1934. Available at http://www.sec.gov/news/studies/2012/929y-study-cross-border-private-rights.pdf Shroff, N., A. X. Sun, H. D. White, and W. Zhang. 2013. Voluntary disclosure and information asymmetry: Evidence from the 2005 Securities Offering Reform. Journal of Accounting Research 51: 1299-1345. Siegel, J. 2005. Can foreign firms bond themselves effectively by renting US securities laws? Journal of Financial Economics 75: 319-359. Skinner, D. J. 1994. Why firms voluntarily disclose bad news. Journal of Accounting Research 32: 38-60. ______. 1997. Earnings disclosures and stockholder lawsuits. Journal of Accounting and Economics 23 (3): 249-282. Stoll, H. R. 1978. The pricing of security dealer services: An empirical study of NASDAQ stocks. The Journal of Finance 33: 1153-1172. Stulz, R. M. 1999. Golbalization, Corporate Finance, and the Cost of Capital. Journal of Applied Corporate Finance 12: 8-25. Verrecchia, R. E. 1983. Discretionary disclosure. Journal of Accounting and Economics 5: 179-194. Wynn, J. P. 2008. Legal liability coverage and voluntary disclosure. The Accounting Review 83 (6): 1639-1669.
33
AppendixA:Analysesofthedirectors’andofficers’insurancepremiums
This section presents analyses on the changes in D&O insurance premiums, as described
in Section VII, to support the assumption that the Supreme Court ruling reduces shareholder
litigation risk faced by cross-listed firms. Core (2000) suggests that D&O insurers set insurance
premiums based on the assessment of the firms’ litigation risk. So I expect D&O insurance
premiums to decrease in the wake of lower litigation risk resulting from the ruling.
The results in this section are important in two ways. First they provide evidence to support
the assumption in my study (and related studies) that the Supreme Court ruling reduces the
litigation risk faced by cross-listed firms. Second, by using an exogenous shock, I provide more
precise evidence to support the notion that litigation risk is an important determinant of D&O
insurance costs.
Sample Selection
Since D&O insurance data is unavailable for US firms and several other cross-listed firms,
I use publicly available insurance data for Canadian firms (Core 2000; Chung and Wynn 2008;
Wynn 2008). I compare cross-listed and non-cross-listed Canadian firms that are locally listed on
the Toronto Stock exchange (TSX). I identify cross-listed firms from annual historical files of TSX
listing directory.31 Consistent with prior studies, I exclude financial services firms, structured
products, exchange traded funds (ETFs), and income trust funds.
I hand collected data on the D&O insurance from companies’ annual proxy circulars filed
with the Canadian Securities Administrators (www.sedar.com). Publicly traded firms in Canada
are required to disclose whether they purchased, and the details of, D&O liability insurance. I
exclude firms for which I did not locate a proxy circular on www.sedar.com. There are 78 (342)
31 http://www.tmx.com/en/mig/archives.html, last accessed September 25, 2014.
34
cross-listed firms (firm-years) and 384 (1,527) non-cross-listed firms (firm-years) in my sample.
The sample size presented in tables varies because of the following data choices. Consistent with
prior studies (e.g. Core 2000), I assume that a firm does not carry D&O insurance if a proxy filing
exists for the firm but no insurance data is disclosed.32 However, if the proxy filing indicates that
insurance exists but no premium or limit amounts are provided then I set the premium or limit to
missing.33
I match D&O insurance data with financial data from WorldScope measured at the end of
the most recent fiscal year prior to the filing of the proxy with disclosure of D&O insurance.34 This
is consistent with the assumption that the insurance was not only purchased at the beginning of the
fiscal year, but was also negotiated prior to the start of the fiscal year.
Empirical model
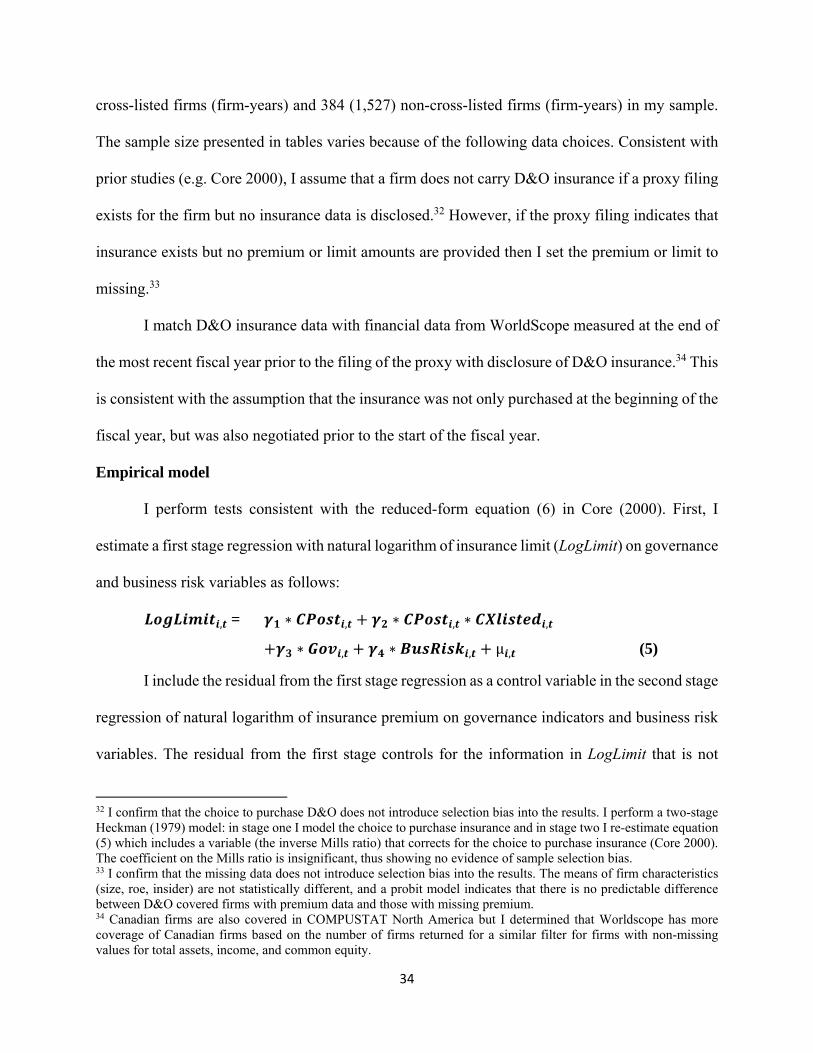
I perform tests consistent with the reduced-form equation (6) in Core (2000). First, I
estimate a first stage regression with natural logarithm of insurance limit (LogLimit) on governance
and business risk variables as follows:
, = ∗ , ∗ , ∗ ,
∗ , ∗ , μ , (5)
I include the residual from the first stage regression as a control variable in the second stage
regression of natural logarithm of insurance premium on governance indicators and business risk
variables. The residual from the first stage controls for the information in LogLimit that is not
32 I confirm that the choice to purchase D&O does not introduce selection bias into the results. I perform a two-stage Heckman (1979) model: in stage one I model the choice to purchase insurance and in stage two I re-estimate equation (5) which includes a variable (the inverse Mills ratio) that corrects for the choice to purchase insurance (Core 2000). The coefficient on the Mills ratio is insignificant, thus showing no evidence of sample selection bias. 33 I confirm that the missing data does not introduce selection bias into the results. The means of firm characteristics (size, roe, insider) are not statistically different, and a probit model indicates that there is no predictable difference between D&O covered firms with premium data and those with missing premium. 34 Canadian firms are also covered in COMPUSTAT North America but I determined that Worldscope has more coverage of Canadian firms based on the number of firms returned for a similar filter for firms with non-missing values for total assets, income, and common equity.
35
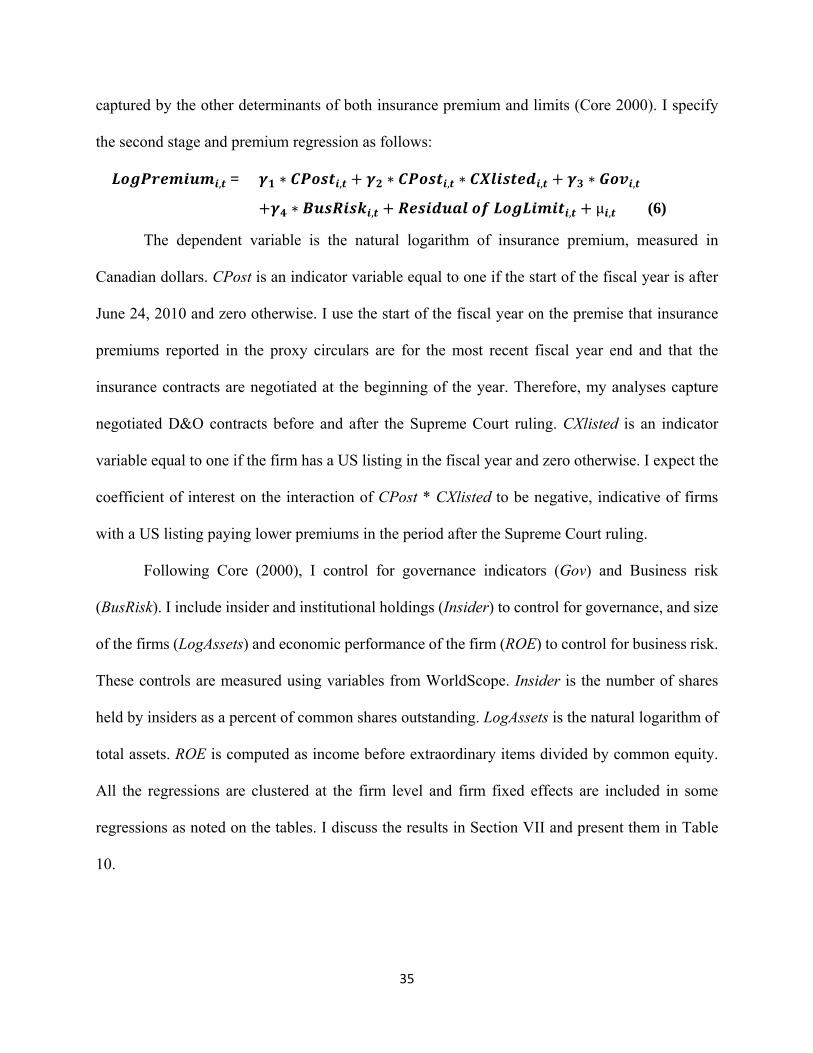
captured by the other determinants of both insurance premium and limits (Core 2000). I specify
the second stage and premium regression as follows:
, = ∗ , ∗ , ∗ , ∗ ,
∗ , , μ , (6)
The dependent variable is the natural logarithm of insurance premium, measured in
Canadian dollars. CPost is an indicator variable equal to one if the start of the fiscal year is after
June 24, 2010 and zero otherwise. I use the start of the fiscal year on the premise that insurance
premiums reported in the proxy circulars are for the most recent fiscal year end and that the
insurance contracts are negotiated at the beginning of the year. Therefore, my analyses capture
negotiated D&O contracts before and after the Supreme Court ruling. CXlisted is an indicator
variable equal to one if the firm has a US listing in the fiscal year and zero otherwise. I expect the
coefficient of interest on the interaction of CPost * CXlisted to be negative, indicative of firms
with a US listing paying lower premiums in the period after the Supreme Court ruling.
Following Core (2000), I control for governance indicators (Gov) and Business risk
(BusRisk). I include insider and institutional holdings (Insider) to control for governance, and size
of the firms (LogAssets) and economic performance of the firm (ROE) to control for business risk.
These controls are measured using variables from WorldScope. Insider is the number of shares
held by insiders as a percent of common shares outstanding. LogAssets is the natural logarithm of
total assets. ROE is computed as income before extraordinary items divided by common equity.
All the regressions are clustered at the firm level and firm fixed effects are included in some
regressions as noted on the tables. I discuss the results in Section VII and present them in Table
10.
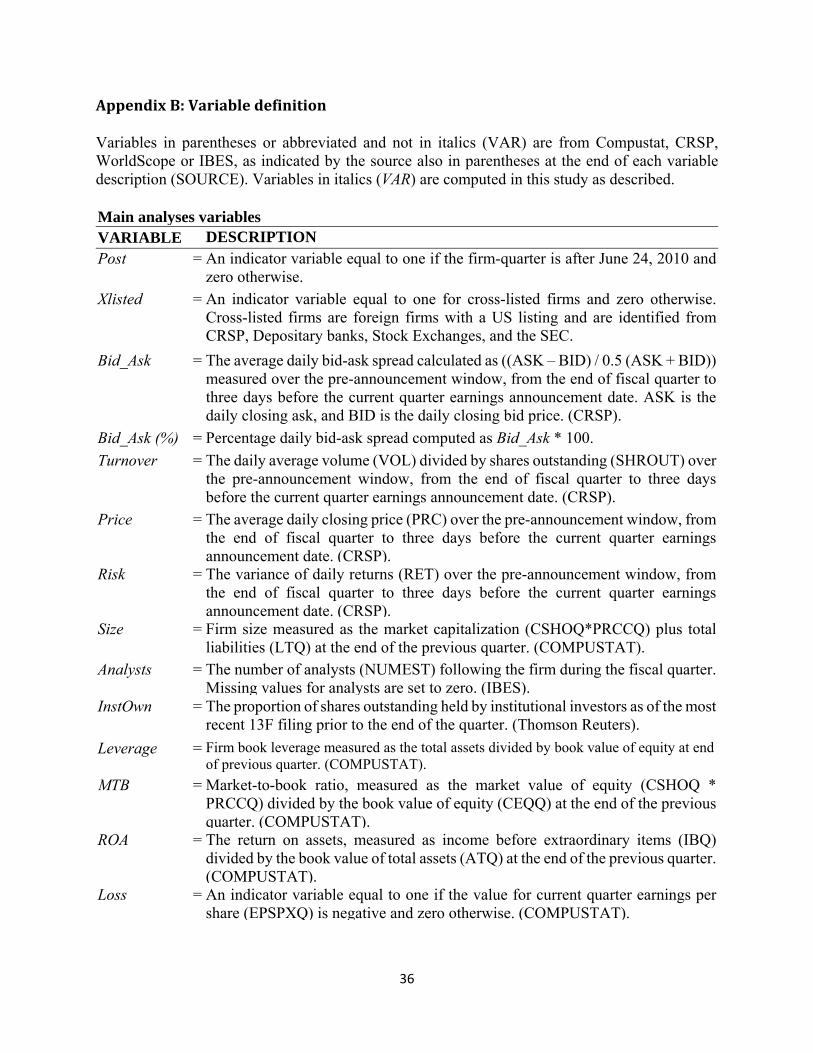
36
AppendixB:Variabledefinition
Variables in parentheses or abbreviated and not in italics (VAR) are from Compustat, CRSP, WorldScope or IBES, as indicated by the source also in parentheses at the end of each variable description (SOURCE). Variables in italics (VAR) are computed in this study as described. Main analyses variables VARIABLE DESCRIPTION Post = An indicator variable equal to one if the firm-quarter is after June 24, 2010 and
zero otherwise.
Xlisted = An indicator variable equal to one for cross-listed firms and zero otherwise.Cross-listed firms are foreign firms with a US listing and are identified from CRSP, Depositary banks, Stock Exchanges, and the SEC.
Bid_Ask = The average daily bid-ask spread calculated as ((ASK – BID) / 0.5 (ASK + BID)) measured over the pre-announcement window, from the end of fiscal quarter to three days before the current quarter earnings announcement date. ASK is the daily closing ask, and BID is the daily closing bid price. (CRSP).
Bid_Ask (%) = Percentage daily bid-ask spread computed as Bid_Ask * 100.
Turnover = The daily average volume (VOL) divided by shares outstanding (SHROUT) over the pre-announcement window, from the end of fiscal quarter to three days before the current quarter earnings announcement date. (CRSP).
Price = The average daily closing price (PRC) over the pre-announcement window, from the end of fiscal quarter to three days before the current quarter earnings announcement date. (CRSP).
Risk = The variance of daily returns (RET) over the pre-announcement window, from the end of fiscal quarter to three days before the current quarter earnings announcement date. (CRSP).
Size = Firm size measured as the market capitalization (CSHOQ*PRCCQ) plus total liabilities (LTQ) at the end of the previous quarter. (COMPUSTAT).
Analysts = The number of analysts (NUMEST) following the firm during the fiscal quarter. Missing values for analysts are set to zero. (IBES).
InstOwn = The proportion of shares outstanding held by institutional investors as of the most recent 13F filing prior to the end of the quarter. (Thomson Reuters).
Leverage = Firm book leverage measured as the total assets divided by book value of equity at end of previous quarter. (COMPUSTAT).
MTB = Market-to-book ratio, measured as the market value of equity (CSHOQ * PRCCQ) divided by the book value of equity (CEQQ) at the end of the previous quarter. (COMPUSTAT).
ROA = The return on assets, measured as income before extraordinary items (IBQ) divided by the book value of total assets (ATQ) at the end of the previous quarter. (COMPUSTAT).
Loss = An indicator variable equal to one if the value for current quarter earnings per share (EPSPXQ) is negative and zero otherwise. (COMPUSTAT).
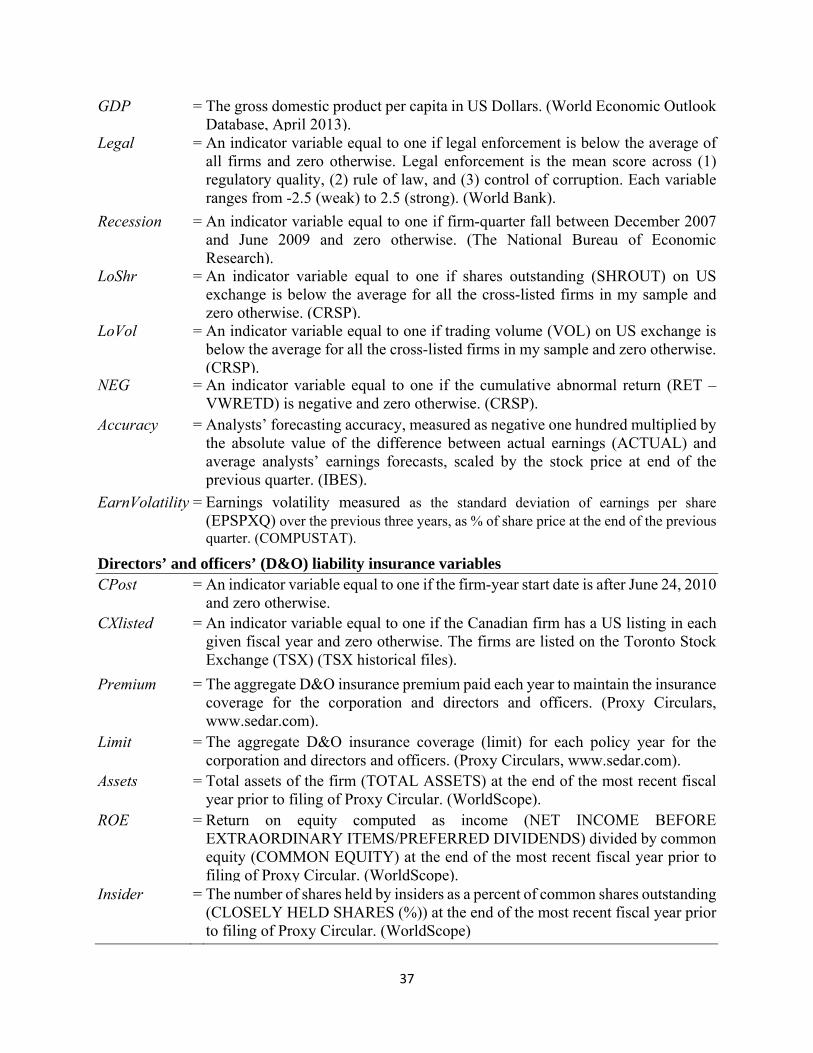
37
GDP = The gross domestic product per capita in US Dollars. (World Economic Outlook Database, April 2013).
Legal = An indicator variable equal to one if legal enforcement is below the average of all firms and zero otherwise. Legal enforcement is the mean score across (1) regulatory quality, (2) rule of law, and (3) control of corruption. Each variable ranges from -2.5 (weak) to 2.5 (strong). (World Bank).
Recession = An indicator variable equal to one if firm-quarter fall between December 2007 and June 2009 and zero otherwise. (The National Bureau of Economic Research).
LoShr = An indicator variable equal to one if shares outstanding (SHROUT) on US exchange is below the average for all the cross-listed firms in my sample and zero otherwise. (CRSP).
LoVol = An indicator variable equal to one if trading volume (VOL) on US exchange is below the average for all the cross-listed firms in my sample and zero otherwise. (CRSP).
NEG = An indicator variable equal to one if the cumulative abnormal return (RET –VWRETD) is negative and zero otherwise. (CRSP).
Accuracy = Analysts’ forecasting accuracy, measured as negative one hundred multiplied by the absolute value of the difference between actual earnings (ACTUAL) and average analysts’ earnings forecasts, scaled by the stock price at end of the previous quarter. (IBES).
EarnVolatility = Earnings volatility measured as the standard deviation of earnings per share (EPSPXQ) over the previous three years, as % of share price at the end of the previous quarter. (COMPUSTAT).
Directors’ and officers’ (D&O) liability insurance variables CPost = An indicator variable equal to one if the firm-year start date is after June 24, 2010
and zero otherwise. CXlisted = An indicator variable equal to one if the Canadian firm has a US listing in each
given fiscal year and zero otherwise. The firms are listed on the Toronto Stock Exchange (TSX) (TSX historical files).
Premium = The aggregate D&O insurance premium paid each year to maintain the insurance coverage for the corporation and directors and officers. (Proxy Circulars, www.sedar.com).
Limit = The aggregate D&O insurance coverage (limit) for each policy year for the corporation and directors and officers. (Proxy Circulars, www.sedar.com).
Assets = Total assets of the firm (TOTAL ASSETS) at the end of the most recent fiscal year prior to filing of Proxy Circular. (WorldScope).
ROE = Return on equity computed as income (NET INCOME BEFORE EXTRAORDINARY ITEMS/PREFERRED DIVIDENDS) divided by common equity (COMMON EQUITY) at the end of the most recent fiscal year prior to filing of Proxy Circular. (WorldScope).
Insider = The number of shares held by insiders as a percent of common shares outstanding(CLOSELY HELD SHARES (%)) at the end of the most recent fiscal year prior to filing of Proxy Circular. (WorldScope)
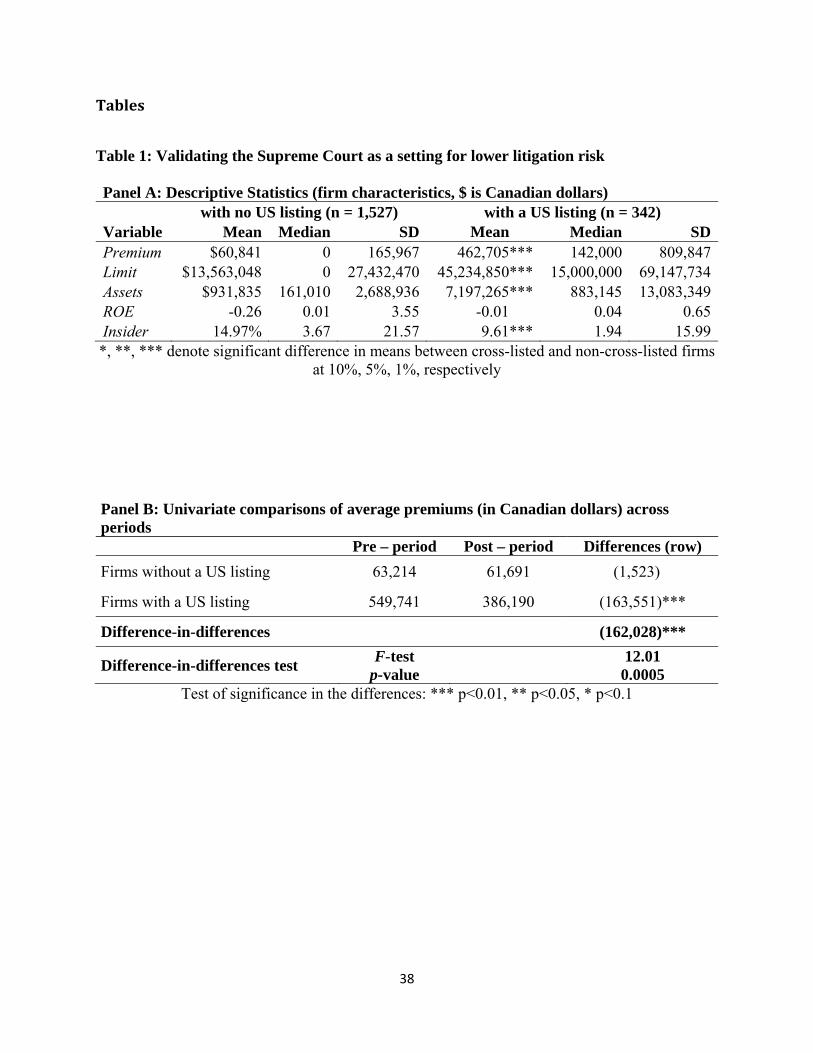
38
Tables
Table 1: Validating the Supreme Court as a setting for lower litigation risk Panel A: Descriptive Statistics (firm characteristics, $ is Canadian dollars) with no US listing (n = 1,527) with a US listing (n = 342) Variable Mean Median SD Mean*** Median SDPremium $60,841 0 165,967 462,705*** 142,000 809,847Limit $13,563,048 0 27,432,470 45,234,850*** 15,000,000 69,147,734Assets $931,835 161,010 2,688,936 7,197,265*** 883,145 13,083,349ROE -0.26 0.01 3.55 -0.01*** 0.04 0.65Insider 14.97% 3.67 21.57 9.61*** 1.94 15.99*, **, *** denote significant difference in means between cross-listed and non-cross-listed firms
at 10%, 5%, 1%, respectively
Test of significance in the differences: *** p<0.01, ** p<0.05, * p<0.1
Panel B: Univariate comparisons of average premiums (in Canadian dollars) across periods Pre – period Post – period Differences (row)
Firms without a US listing 63,214 61,691 (1,523) *
Firms with a US listing 549,741 386,190 (163,551)***
Difference-in-differences (162,028)***
Difference-in-differences test F-test
p-value
12.01 0.0005
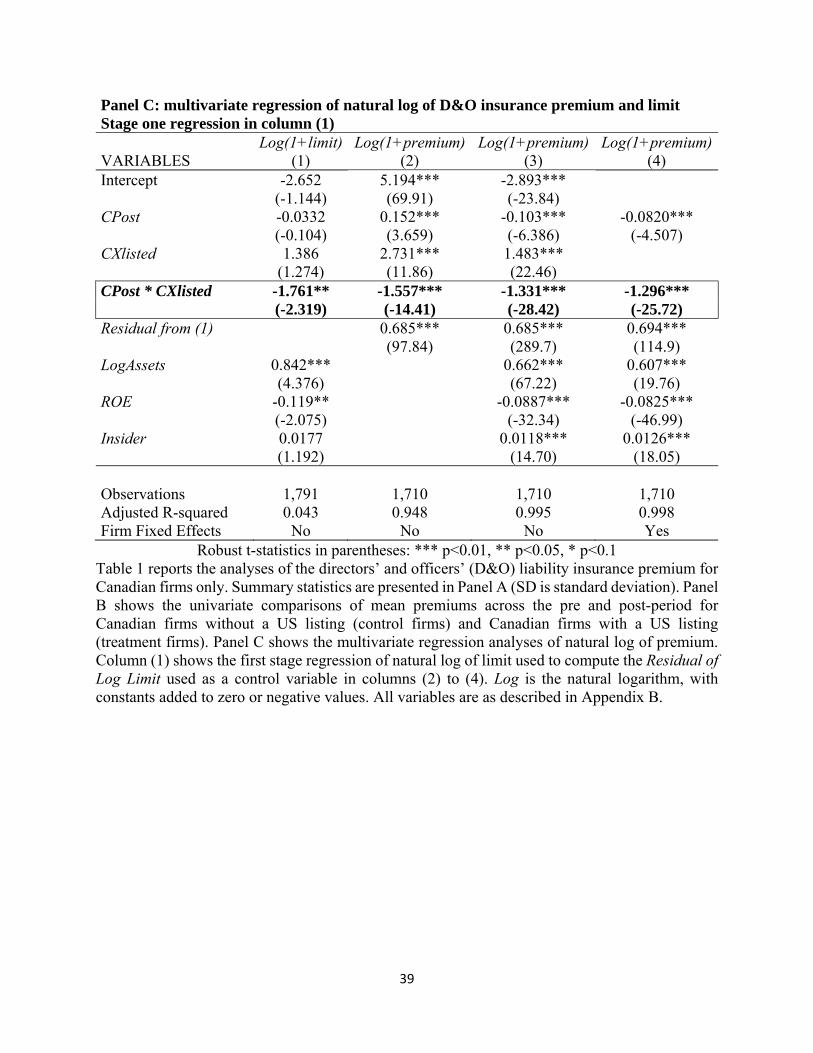
39
Panel C: multivariate regression of natural log of D&O insurance premium and limit Stage one regression in column (1) Log(1+limit) Log(1+premium) Log(1+premium) Log(1+premium)VARIABLES (1) (2) (3) (4) Intercept -2.652 5.194*** -2.893*** (-1.144) (69.91) (-23.84) CPost -0.0332 0.152*** -0.103*** -0.0820*** (-0.104) (3.659) (-6.386) (-4.507) CXlisted 1.386 2.731*** 1.483*** (1.274) (11.86) (22.46) CPost * CXlisted -1.761** -1.557*** -1.331*** -1.296*** (-2.319) (-14.41) (-28.42) (-25.72) Residual from (1) 0.685*** 0.685*** 0.694*** (97.84) (289.7) (114.9) LogAssets 0.842*** 0.662*** 0.607*** (4.376) (67.22) (19.76) ROE -0.119** -0.0887*** -0.0825*** (-2.075) (-32.34) (-46.99) Insider 0.0177 0.0118*** 0.0126*** (1.192) (14.70) (18.05) Observations 1,791 1,710 1,710 1,710 Adjusted R-squared 0.043 0.948 0.995 0.998 Firm Fixed Effects No No No Yes
Robust t-statistics in parentheses: *** p<0.01, ** p<0.05, * p<0.1 Table 1 reports the analyses of the directors’ and officers’ (D&O) liability insurance premium for Canadian firms only. Summary statistics are presented in Panel A (SD is standard deviation). Panel B shows the univariate comparisons of mean premiums across the pre and post-period for Canadian firms without a US listing (control firms) and Canadian firms with a US listing (treatment firms). Panel C shows the multivariate regression analyses of natural log of premium. Column (1) shows the first stage regression of natural log of limit used to compute the Residual of Log Limit used as a control variable in columns (2) to (4). Log is the natural logarithm, with constants added to zero or negative values. All variables are as described in Appendix B.
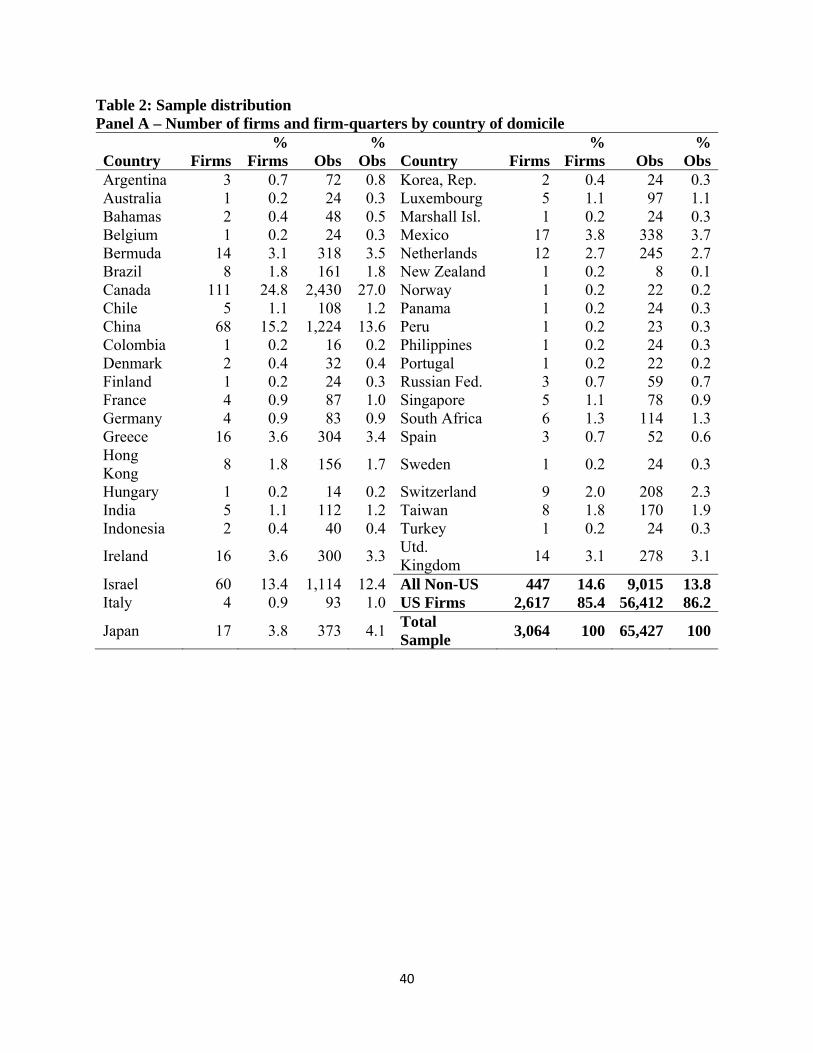
40
Table 2: Sample distribution Panel A – Number of firms and firm-quarters by country of domicile
Country
Firms %
Firms Obs%
Obs Country Firms%
Firms Obs%
ObsArgentina 3 0.7 72 0.8 Korea, Rep. 2 0.4 24 0.3Australia 1 0.2 24 0.3 Luxembourg 5 1.1 97 1.1Bahamas 2 0.4 48 0.5 Marshall Isl. 1 0.2 24 0.3Belgium 1 0.2 24 0.3 Mexico 17 3.8 338 3.7Bermuda 14 3.1 318 3.5 Netherlands 12 2.7 245 2.7Brazil 8 1.8 161 1.8 New Zealand 1 0.2 8 0.1Canada 111 24.8 2,430 27.0 Norway 1 0.2 22 0.2Chile 5 1.1 108 1.2 Panama 1 0.2 24 0.3China 68 15.2 1,224 13.6 Peru 1 0.2 23 0.3Colombia 1 0.2 16 0.2 Philippines 1 0.2 24 0.3Denmark 2 0.4 32 0.4 Portugal 1 0.2 22 0.2Finland 1 0.2 24 0.3 Russian Fed. 3 0.7 59 0.7France 4 0.9 87 1.0 Singapore 5 1.1 78 0.9Germany 4 0.9 83 0.9 South Africa 6 1.3 114 1.3Greece 16 3.6 304 3.4 Spain 3 0.7 52 0.6Hong Kong
8 1.8 156 1.7 Sweden 1 0.2 24 0.3
Hungary 1 0.2 14 0.2 Switzerland 9 2.0 208 2.3India 5 1.1 112 1.2 Taiwan 8 1.8 170 1.9Indonesia 2 0.4 40 0.4 Turkey 1 0.2 24 0.3
Ireland 16 3.6 300 3.3Utd. Kingdom
14 3.1 278 3.1
Israel 60 13.4 1,114 12.4 All Non-US 447 14.6 9,015 13.8Italy 4 0.9 93 1.0 US Firms 2,617 85.4 56,412 86.2
Japan 17 3.8 373 4.1Total Sample
3,064 100 65,427 100
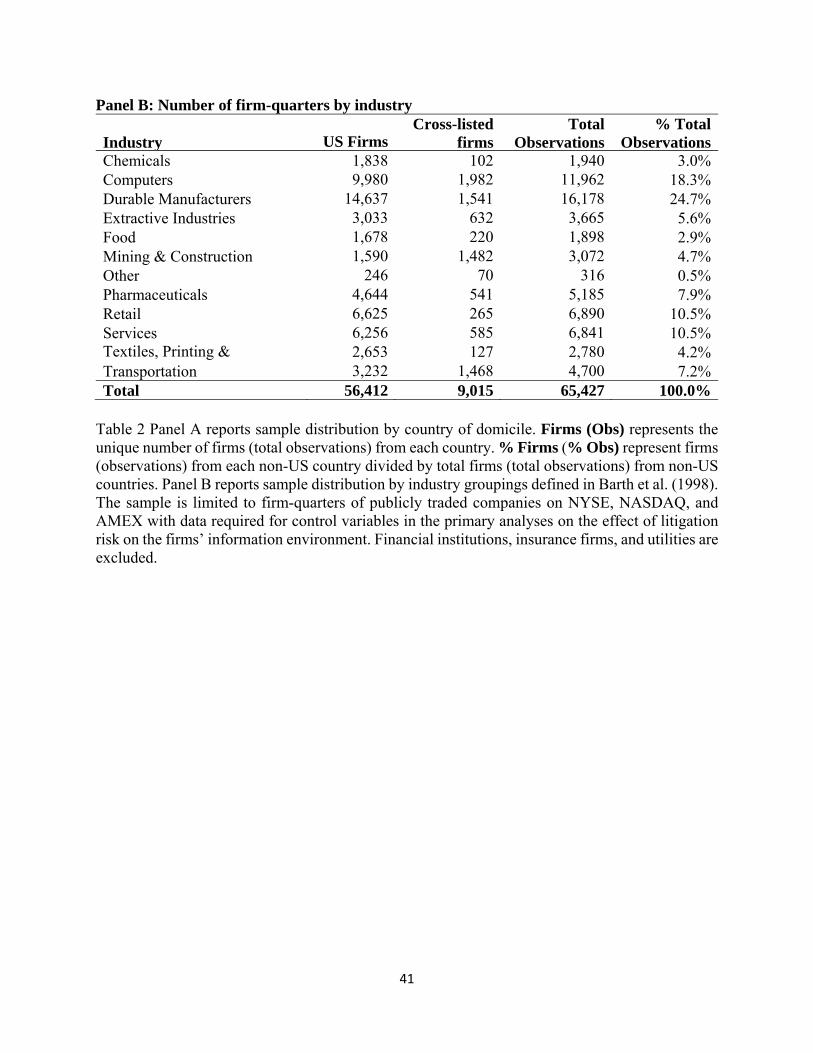
41
Panel B: Number of firm-quarters by industry Industry US Firms
Cross-listed firms
Total Observations
% Total Observations
Chemicals 1,838 102 1,940 3.0%Computers 9,980 1,982 11,962 18.3%Durable Manufacturers 14,637 1,541 16,178 24.7%Extractive Industries 3,033 632 3,665 5.6%Food 1,678 220 1,898 2.9%Mining & Construction 1,590 1,482 3,072 4.7%Other 246 70 316 0.5%Pharmaceuticals 4,644 541 5,185 7.9%Retail 6,625 265 6,890 10.5%Services 6,256 585 6,841 10.5%Textiles, Printing & 2,653 127 2,780 4.2%Transportation 3,232 1,468 4,700 7.2%Total 56,412 9,015 65,427 100.0% Table 2 Panel A reports sample distribution by country of domicile. Firms (Obs) represents the unique number of firms (total observations) from each country. % Firms (% Obs) represent firms (observations) from each non-US country divided by total firms (total observations) from non-US countries. Panel B reports sample distribution by industry groupings defined in Barth et al. (1998). The sample is limited to firm-quarters of publicly traded companies on NYSE, NASDAQ, and AMEX with data required for control variables in the primary analyses on the effect of litigation risk on the firms’ information environment. Financial institutions, insurance firms, and utilities are excluded.
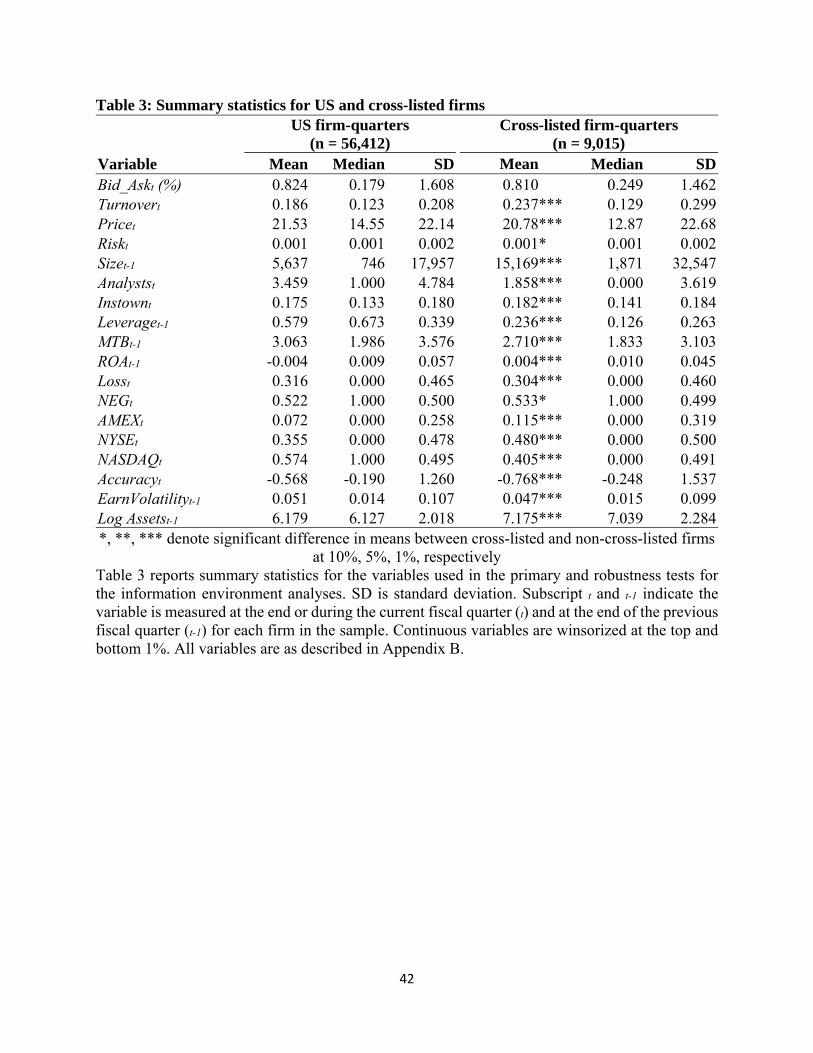
42
Table 3: Summary statistics for US and cross-listed firms
US firm-quarters
(n = 56,412) Cross-listed firm-quarters
(n = 9,015) Variable Mean Median SD Mean*** Median SDBid_Askt (%) 0.824 0.179 1.608 0.810*** 0.249 1.462Turnovert 0.186 0.123 0.208 0.237*** 0.129 0.299Pricet 21.53 14.55 22.14 20.78*** 12.87 22.68Riskt 0.001 0.001 0.002 0.001*** 0.001 0.002Sizet-1 5,637 746 17,957 15,169*** 1,871 32,547Analystst 3.459 1.000 4.784 1.858*** 0.000 3.619Instownt 0.175 0.133 0.180 0.182*** 0.141 0.184Leveraget-1 0.579 0.673 0.339 0.236*** 0.126 0.263MTBt-1 3.063 1.986 3.576 2.710*** 1.833 3.103ROAt-1 -0.004 0.009 0.057 0.004*** 0.010 0.045Losst 0.316 0.000 0.465 0.304*** 0.000 0.460NEGt 0.522 1.000 0.500 0.533*** 1.000 0.499AMEXt 0.072 0.000 0.258 0.115*** 0.000 0.319NYSEt 0.355 0.000 0.478 0.480*** 0.000 0.500NASDAQt 0.574 1.000 0.495 0.405*** 0.000 0.491Accuracyt -0.568 -0.190 1.260 -0.768*** -0.248 1.537EarnVolatilityt-1 0.051 0.014 0.107 0.047*** 0.015 0.099Log Assetst-1 6.179 6.127 2.018 7.175*** 7.039 2.284*, **, *** denote significant difference in means between cross-listed and non-cross-listed firms
at 10%, 5%, 1%, respectively Table 3 reports summary statistics for the variables used in the primary and robustness tests for the information environment analyses. SD is standard deviation. Subscript t and t-1 indicate the variable is measured at the end or during the current fiscal quarter (t) and at the end of the previous fiscal quarter (t-1) for each firm in the sample. Continuous variables are winsorized at the top and bottom 1%. All variables are as described in Appendix B.
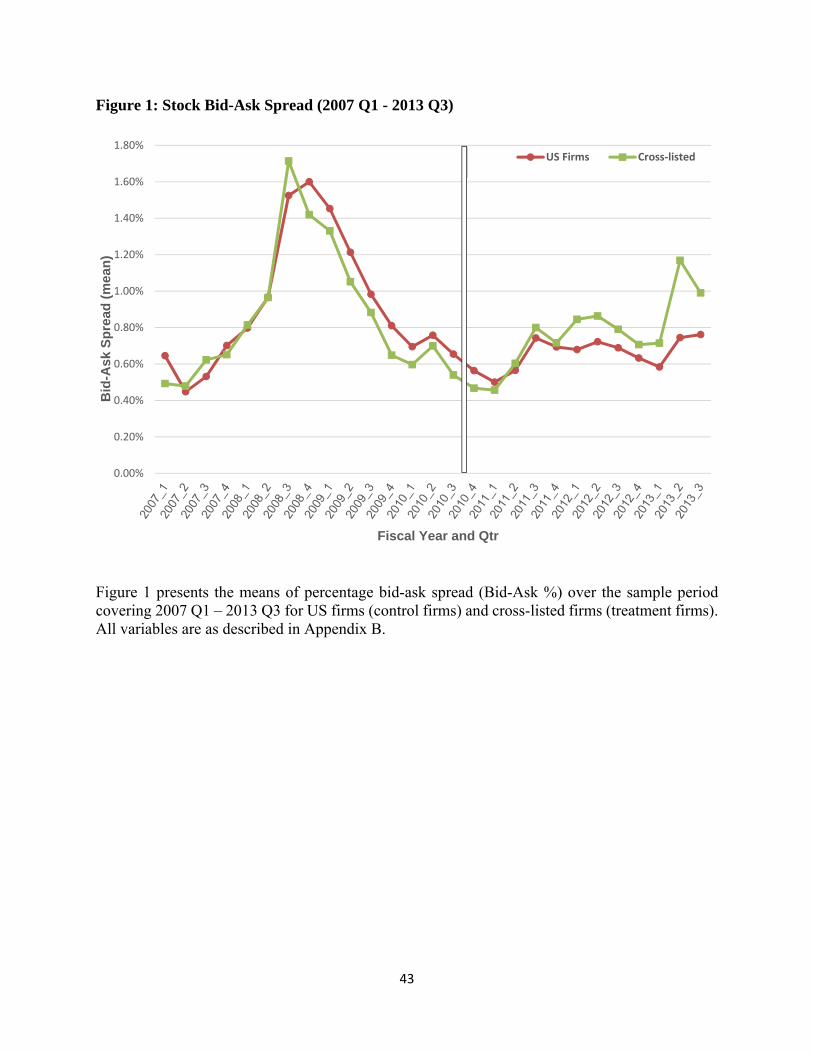
43
Figure 1: Stock Bid-Ask Spread (2007 Q1 - 2013 Q3)
Figure 1 presents the means of percentage bid-ask spread (Bid-Ask %) over the sample period covering 2007 Q1 – 2013 Q3 for US firms (control firms) and cross-listed firms (treatment firms). All variables are as described in Appendix B.
0.00%
0.20%
0.40%
0.60%
0.80%
1.00%
1.20%
1.40%
1.60%
1.80%
Bid
-Ask
Sp
read
(m
ean
)
Fiscal Year and Qtr
US Firms Cross‐listed
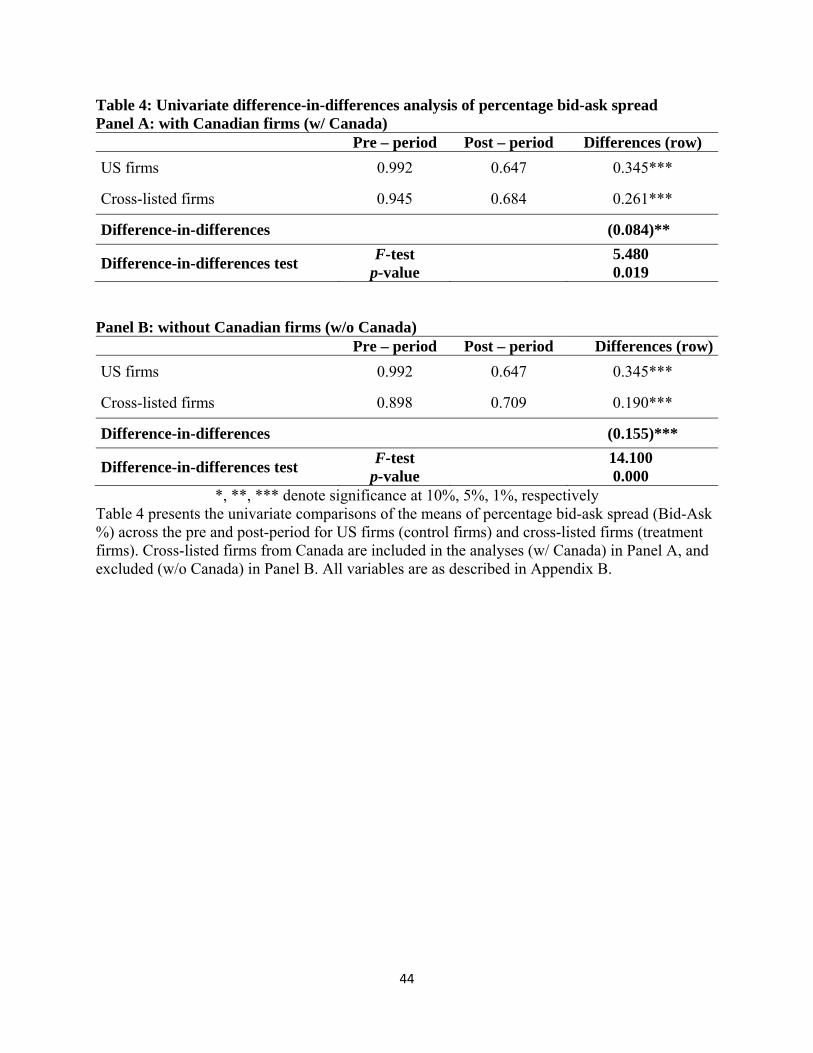
44
Table 4: Univariate difference-in-differences analysis of percentage bid-ask spread Panel A: with Canadian firms (w/ Canada) Pre – period Post – period Differences (row)
US firms 0.992 0.647 0.345***
Cross-listed firms 0.945 0.684 0.261***
Difference-in-differences (0.084)***
Difference-in-differences test F-test
p-value 5.480*** 0.019***
Panel B: without Canadian firms (w/o Canada) Pre – period Post – period Differences (row)
US firms 0.992 0.647 0.345***
Cross-listed firms 0.898 0.709 0.190***
Difference-in-differences (0.155)***
Difference-in-differences test F-test
p-value 14.100*** 0.000***
*, **, *** denote significance at 10%, 5%, 1%, respectively Table 4 presents the univariate comparisons of the means of percentage bid-ask spread (Bid-Ask %) across the pre and post-period for US firms (control firms) and cross-listed firms (treatment firms). Cross-listed firms from Canada are included in the analyses (w/ Canada) in Panel A, and excluded (w/o Canada) in Panel B. All variables are as described in Appendix B.
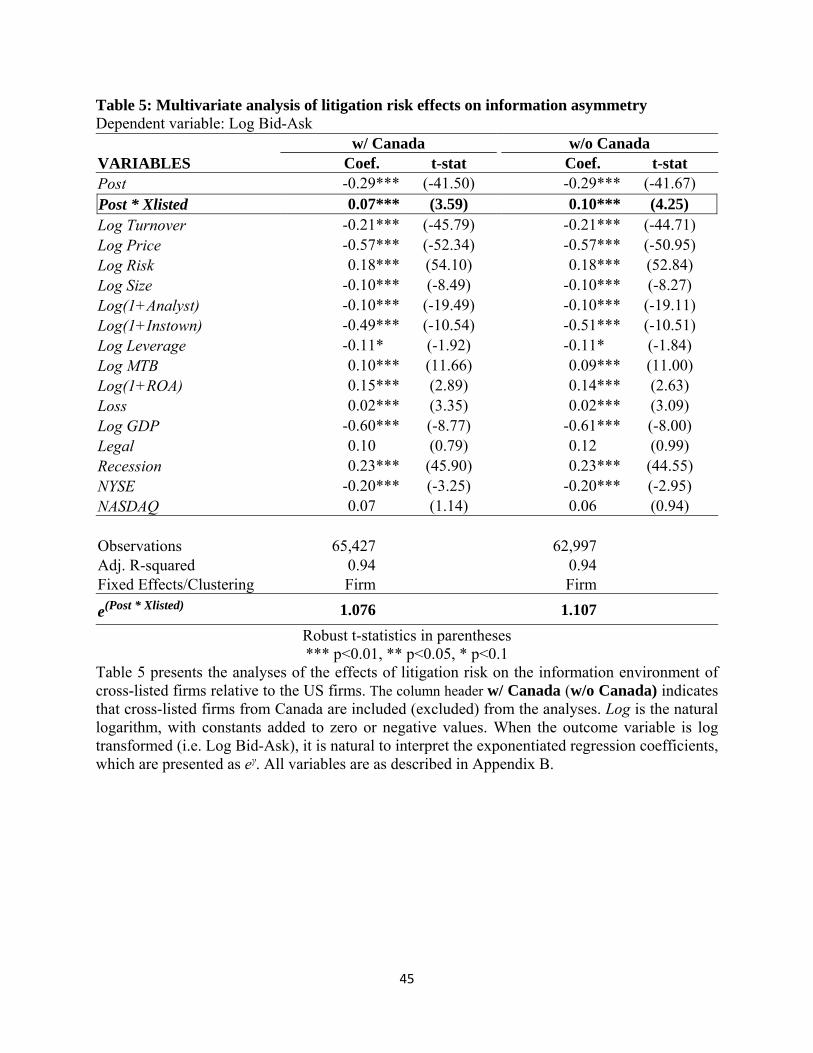
45
Table 5: Multivariate analysis of litigation risk effects on information asymmetry Dependent variable: Log Bid-Ask w/ Canada w/o Canada VARIABLES Coef. ** t-stat Coef. ** t-stat Post -0.29*** (-41.50) -0.29*** (-41.67) Post * Xlisted 0.07*** (3.59) 0.10*** (4.25) Log Turnover -0.21*** (-45.79) -0.21*** (-44.71) Log Price -0.57*** (-52.34) -0.57*** (-50.95) Log Risk 0.18*** (54.10) 0.18*** (52.84) Log Size -0.10*** (-8.49) -0.10*** (-8.27) Log(1+Analyst) -0.10*** (-19.49) -0.10*** (-19.11) Log(1+Instown) -0.49*** (-10.54) -0.51*** (-10.51) Log Leverage -0.11*** (-1.92) -0.11*** (-1.84) Log MTB 0.10*** (11.66) 0.09*** (11.00) Log(1+ROA) 0.15*** (2.89) 0.14*** (2.63) Loss 0.02*** (3.35) 0.02*** (3.09) Log GDP -0.60*** (-8.77) -0.61*** (-8.00) Legal 0.10*** (0.79) 0.12*** (0.99) Recession 0.23*** (45.90) 0.23*** (44.55) NYSE -0.20*** (-3.25) -0.20*** (-2.95) NASDAQ 0.07*** (1.14) 0.06*** (0.94) Observations 65,427*** 62,997*** Adj. R-squared 0.94*** 0.94*** Fixed Effects/Clustering Firm*** Firm***
e(Post * Xlisted) 1.076*** 1.107***
Robust t-statistics in parentheses *** p<0.01, ** p<0.05, * p<0.1
Table 5 presents the analyses of the effects of litigation risk on the information environment of cross-listed firms relative to the US firms. The column header w/ Canada (w/o Canada) indicates that cross-listed firms from Canada are included (excluded) from the analyses. Log is the natural logarithm, with constants added to zero or negative values. When the outcome variable is log transformed (i.e. Log Bid-Ask), it is natural to interpret the exponentiated regression coefficients, which are presented as eγ. All variables are as described in Appendix B.
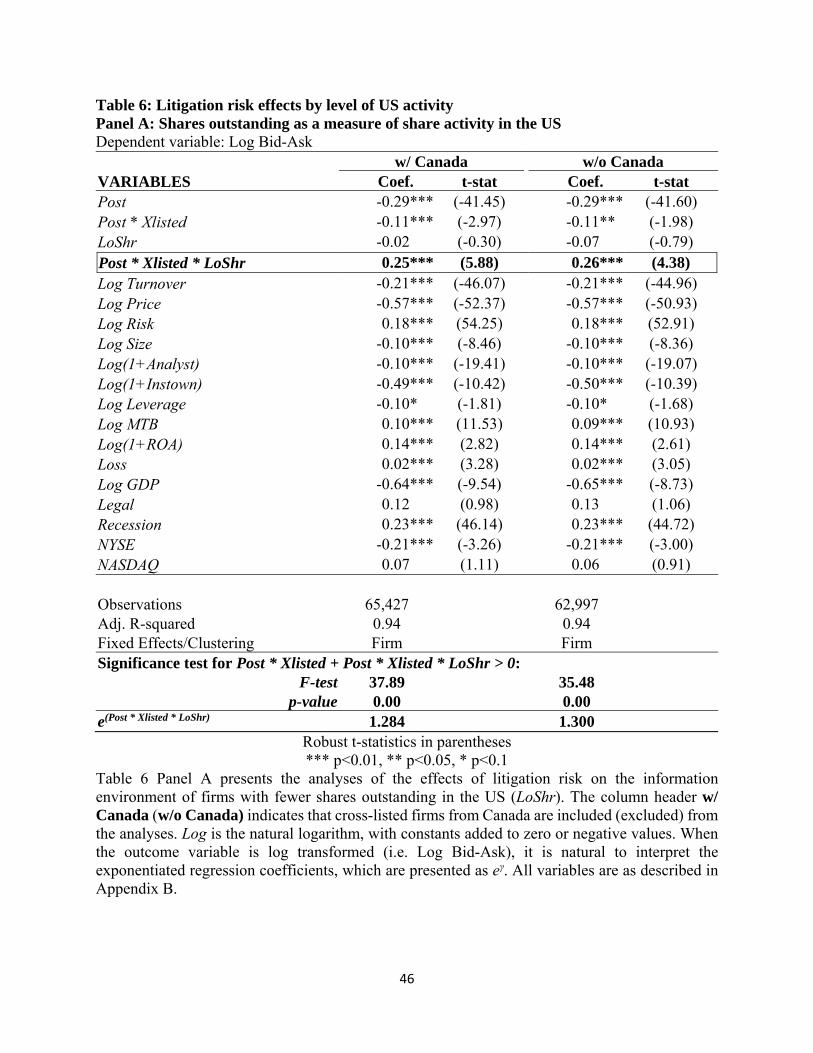
46
Table 6: Litigation risk effects by level of US activity Panel A: Shares outstanding as a measure of share activity in the US Dependent variable: Log Bid-Ask w/ Canada w/o Canada VARIABLES Coef. ** t-stat Coef. ** t-stat Post -0.29*** (-41.45) -0.29*** (-41.60) Post * Xlisted -0.11*** (-2.97) -0.11*** (-1.98) LoShr -0.02*** (-0.30) -0.07*** (-0.79) Post * Xlisted * LoShr 0.25*** (5.88) 0.26*** (4.38) Log Turnover -0.21*** (-46.07) -0.21*** (-44.96) Log Price -0.57*** (-52.37) -0.57*** (-50.93) Log Risk 0.18*** (54.25) 0.18*** (52.91) Log Size -0.10*** (-8.46) -0.10*** (-8.36) Log(1+Analyst) -0.10*** (-19.41) -0.10*** (-19.07) Log(1+Instown) -0.49*** (-10.42) -0.50*** (-10.39) Log Leverage -0.10*** (-1.81) -0.10*** (-1.68) Log MTB 0.10*** (11.53) 0.09*** (10.93) Log(1+ROA) 0.14*** (2.82) 0.14*** (2.61) Loss 0.02*** (3.28) 0.02*** (3.05) Log GDP -0.64*** (-9.54) -0.65*** (-8.73) Legal 0.12*** (0.98) 0.13*** (1.06) Recession 0.23*** (46.14) 0.23*** (44.72) NYSE -0.21*** (-3.26) -0.21*** (-3.00) NASDAQ 0.07*** (1.11) 0.06*** (0.91) Observations 65,427 62,997 Adj. R-squared 0.94 0.94 Fixed Effects/Clustering Firm Firm Significance test for Post * Xlisted + Post * Xlisted * LoShr > 0:
F-test 37.89 35.48 p-value 0.00 0.00
e(Post * Xlisted * LoShr) 1.284 1.300 Robust t-statistics in parentheses *** p<0.01, ** p<0.05, * p<0.1
Table 6 Panel A presents the analyses of the effects of litigation risk on the information environment of firms with fewer shares outstanding in the US (LoShr). The column header w/ Canada (w/o Canada) indicates that cross-listed firms from Canada are included (excluded) from the analyses. Log is the natural logarithm, with constants added to zero or negative values. When the outcome variable is log transformed (i.e. Log Bid-Ask), it is natural to interpret the exponentiated regression coefficients, which are presented as eγ. All variables are as described in Appendix B.

47
Panel B: Low trading volume as a measure of share activity in the US Dependent variable: Log Bid-Ask w/ Canada w/o Canada VARIABLES Coef. ** t-stat Coef. ** t-stat Post -0.29*** (-41.48) -0.29*** (-41.66) Post * Xlisted -0.07*** (-2.03) -0.04*** (-0.90) LoVol -0.10*** (-2.21) -0.10*** (-1.73) Post * Xlisted * LoVol 0.19*** (4.62) 0.18*** (3.66) Log Turnover -0.21*** (-45.66) -0.21*** (-44.51) Log Price -0.57*** (-52.30) -0.57*** (-50.90) Log Risk 0.18*** (54.17) 0.18*** (52.90) Log Size -0.10*** (-8.43) -0.10*** (-8.25) Log(1+Analyst) -0.10*** (-19.46) -0.10*** (-19.11) Log(1+Instown) -0.49*** (-10.51) -0.50*** (-10.45) Log Leverage -0.10*** (-1.87) -0.10*** (-1.76) Log MTB 0.10*** (11.56) 0.09*** (10.94) Log(1+ROA) 0.14*** (2.82) 0.14*** (2.61) Loss 0.02*** (3.34) 0.02*** (3.08) Log GDP -0.61*** (-9.12) -0.62*** (-8.33) Legal 0.11*** (0.94) 0.14*** (1.12) Recession 0.23*** (45.94) 0.23*** (44.59) NYSE -0.21*** (-3.28) -0.20*** (-2.98) NASDAQ 0.07*** (1.11) 0.06*** (0.92) Observations 65,427*** 62,997*** Adj. R-squared 0.94*** 0.94*** Fixed Effects/Clustering Firm*** Firm*** Significance test for Post * Xlisted + Post * Xlisted * LoVol > 0:
F-test 27.48*** 29.12*** p-value 0.00*** 0.00***
e(Post * Xlisted * LoVol) 1.213*** 1.201*** Robust t-statistics in parentheses *** p<0.01, ** p<0.05, * p<0.1
Table 6 Panel B presents the analyses of the effects of litigation risk on the information environment of cross-listed firms with low trading volume (LoVol). The column header w/ Canada (w/o Canada) indicates that cross-listed firms from Canada are included (excluded) from the analyses. Log is the natural logarithm, with constants added to zero or negative values. When the outcome variable is log transformed (i.e. Log Bid-Ask), it is natural to interpret the exponentiated regression coefficients, which are presented as eγ. All variables are as described in Appendix B.
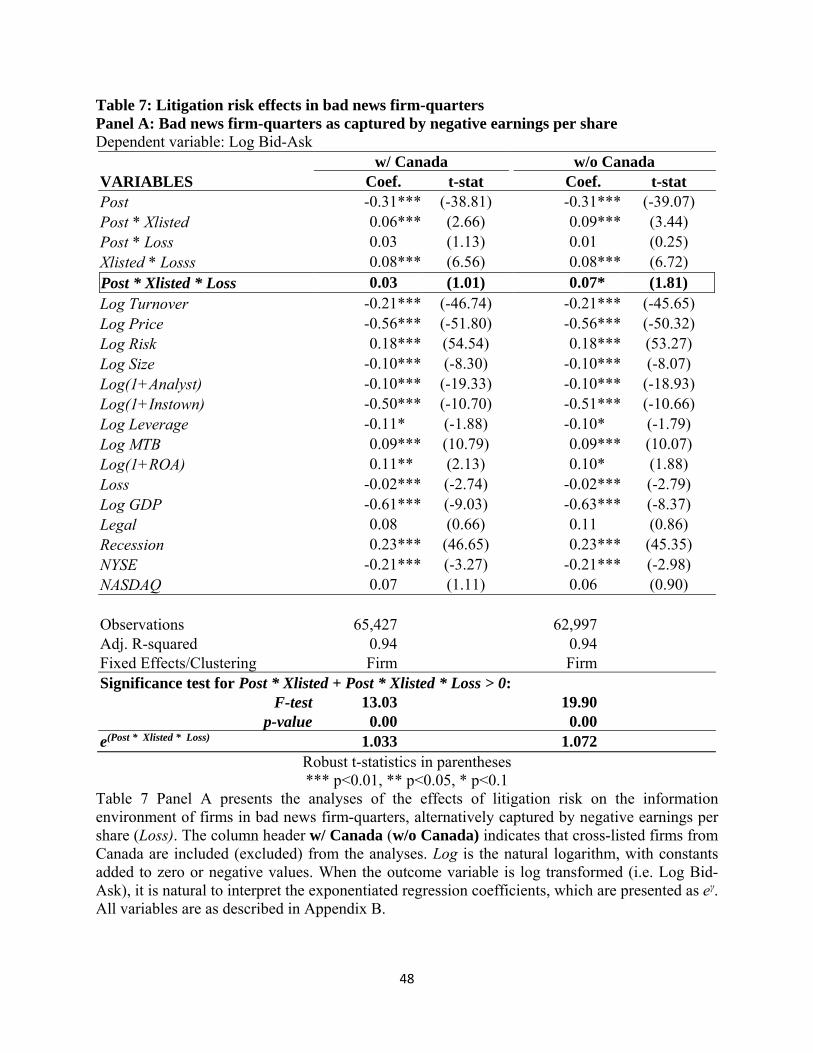
48
Table 7: Litigation risk effects in bad news firm-quarters Panel A: Bad news firm-quarters as captured by negative earnings per share Dependent variable: Log Bid-Ask w/ Canada w/o Canada VARIABLES Coef. ** t-stat Coef. ** t-stat Post -0.31*** (-38.81) -0.31*** (-39.07) Post * Xlisted 0.06*** (2.66) 0.09*** (3.44) Post * Loss 0.03*** (1.13) 0.01*** (0.25) Xlisted * Losss 0.08*** (6.56) 0.08*** (6.72) Post * Xlisted * Loss 0.03*** (1.01) 0.07*** (1.81) Log Turnover -0.21*** (-46.74) -0.21*** (-45.65) Log Price -0.56*** (-51.80) -0.56*** (-50.32) Log Risk 0.18*** (54.54) 0.18*** (53.27) Log Size -0.10*** (-8.30) -0.10*** (-8.07) Log(1+Analyst) -0.10*** (-19.33) -0.10*** (-18.93) Log(1+Instown) -0.50*** (-10.70) -0.51*** (-10.66) Log Leverage -0.11*** (-1.88) -0.10*** (-1.79) Log MTB 0.09*** (10.79) 0.09*** (10.07) Log(1+ROA) 0.11*** (2.13) 0.10*** (1.88) Loss -0.02*** (-2.74) -0.02*** (-2.79) Log GDP -0.61*** (-9.03) -0.63*** (-8.37) Legal 0.08*** (0.66) 0.11*** (0.86) Recession 0.23*** (46.65) 0.23*** (45.35) NYSE -0.21*** (-3.27) -0.21*** (-2.98) NASDAQ 0.07*** (1.11) 0.06*** (0.90) Observations 65,427*** 62,997*** Adj. R-squared 0.94*** 0.94*** Fixed Effects/Clustering Firm*** Firm*** Significance test for Post * Xlisted + Post * Xlisted * Loss > 0:
F-test 13.03*** 19.90*** p-value 0.00*** 0.00***
e(Post * Xlisted * Loss) 1.033*** 1.072*** Robust t-statistics in parentheses *** p<0.01, ** p<0.05, * p<0.1
Table 7 Panel A presents the analyses of the effects of litigation risk on the information environment of firms in bad news firm-quarters, alternatively captured by negative earnings per share (Loss). The column header w/ Canada (w/o Canada) indicates that cross-listed firms from Canada are included (excluded) from the analyses. Log is the natural logarithm, with constants added to zero or negative values. When the outcome variable is log transformed (i.e. Log Bid-Ask), it is natural to interpret the exponentiated regression coefficients, which are presented as eγ. All variables are as described in Appendix B.

49
Panel B: Bad news firm-quarters as alternatively captured by negative abnormal returns Dependent variable: Log Bid-Ask w/ Canada w/o Canada VARIABLES Coef. ** t-stat Coef. ** t-stat Post -0.31*** (-40.94) -0.31*** (-41.15) Post * Xlisted 0.05*** (2.39) 0.09*** (3.47) Post * NEG -0.02*** (-1.63) -0.02*** (-1.30) Xlisted * NEG -0.00*** (-0.40) -0.00*** (-0.35) Post * Xlisted * NEG 0.04*** (2.66) 0.03*** (1.74) Log Turnover -0.17*** (-37.75) -0.16*** (-36.79) Log Price -0.55*** (-47.24) -0.55*** (-45.99) Log Risk 0.13*** (41.77) 0.13*** (40.74) Log Size -0.17*** (-14.11) -0.17*** (-13.73) Log(1+Analyst) -0.09*** (-18.42) -0.09*** (-18.06) Log(1+Instown) -0.54*** (-11.32) -0.55*** (-11.23) Log Leverage 0.02*** (0.42) 0.03*** (0.44) Log MTB 0.07*** (8.39) 0.07*** (7.90) Log(1+ROA) 0.02*** (0.38) 0.01*** (0.15) NEG -0.04*** (-7.58) -0.04*** (-7.45) Log GDP -0.52*** (-7.47) -0.53*** (-6.84) Legal 0.05*** (0.40) 0.08*** (0.61) Recession 0.24*** (48.77) 0.24*** (47.22) NYSE -0.17*** (-2.54) -0.16*** (-2.21) NASDAQ 0.09*** (1.52) 0.09*** (1.38) Observations 65,427*** 62,997*** Adj. R-squared 0.95*** 0.95*** Fixed Effects/Clustering Firm*** Firm*** Significance test for Post * Xlisted + Post * Xlisted * NEG > 0:
F-test 18.01*** 21.63*** p-value 0.00*** 0.00***
e(Post * Xlisted * NEG) 1.044*** 1.034*** Robust t-statistics in parentheses *** p<0.01, ** p<0.05, * p<0.1
Table 7 Panel B presents the analyses of the effects of litigation risk on the information environment of firms in bad news firm-quarters, as alternatively captured by negative cumulative abnormal returns (NEG). The column header w/ Canada (w/o Canada) indicates that cross-listed firms from Canada are included (excluded) from the analyses. Log is the natural logarithm, with constants added to zero or negative values. When the outcome variable is log transformed (i.e. Log Bid-Ask), it is natural to interpret the exponentiated regression coefficients, which are presented as eγ. All variables are as described in Appendix B.
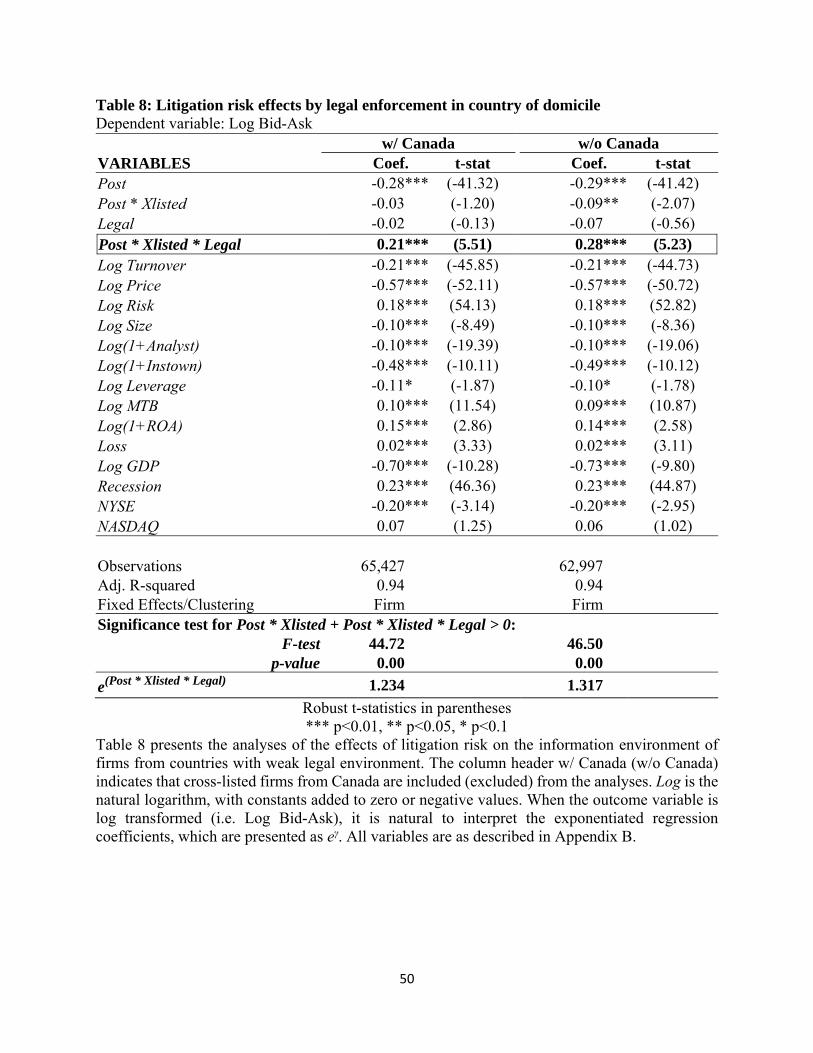
50
Table 8: Litigation risk effects by legal enforcement in country of domicile Dependent variable: Log Bid-Ask w/ Canada w/o Canada VARIABLES Coef. ** t-stat Coef. ** t-stat Post -0.28*** (-41.32) -0.29*** (-41.42) Post * Xlisted -0.03*** (-1.20) -0.09*** (-2.07) Legal -0.02*** (-0.13) -0.07*** (-0.56) Post * Xlisted * Legal 0.21*** (5.51) 0.28*** (5.23) Log Turnover -0.21*** (-45.85) -0.21*** (-44.73) Log Price -0.57*** (-52.11) -0.57*** (-50.72) Log Risk 0.18*** (54.13) 0.18*** (52.82) Log Size -0.10*** (-8.49) -0.10*** (-8.36) Log(1+Analyst) -0.10*** (-19.39) -0.10*** (-19.06) Log(1+Instown) -0.48*** (-10.11) -0.49*** (-10.12) Log Leverage -0.11*** (-1.87) -0.10*** (-1.78) Log MTB 0.10*** (11.54) 0.09*** (10.87) Log(1+ROA) 0.15*** (2.86) 0.14*** (2.58) Loss 0.02*** (3.33) 0.02*** (3.11) Log GDP -0.70*** (-10.28) -0.73*** (-9.80) Recession 0.23*** (46.36) 0.23*** (44.87) NYSE -0.20*** (-3.14) -0.20*** (-2.95) NASDAQ 0.07*** (1.25) 0.06*** (1.02) Observations 65,427*** 62,997*** Adj. R-squared 0.94*** 0.94*** Fixed Effects/Clustering Firm*** Firm*** Significance test for Post * Xlisted + Post * Xlisted * Legal > 0:
F-test 44.72*** 46.50*** p-value 0.00*** 0.00***
e(Post * Xlisted * Legal) 1.234*** 1.317***
Robust t-statistics in parentheses *** p<0.01, ** p<0.05, * p<0.1
Table 8 presents the analyses of the effects of litigation risk on the information environment of firms from countries with weak legal environment. The column header w/ Canada (w/o Canada) indicates that cross-listed firms from Canada are included (excluded) from the analyses. Log is the natural logarithm, with constants added to zero or negative values. When the outcome variable is log transformed (i.e. Log Bid-Ask), it is natural to interpret the exponentiated regression coefficients, which are presented as eγ. All variables are as described in Appendix B.
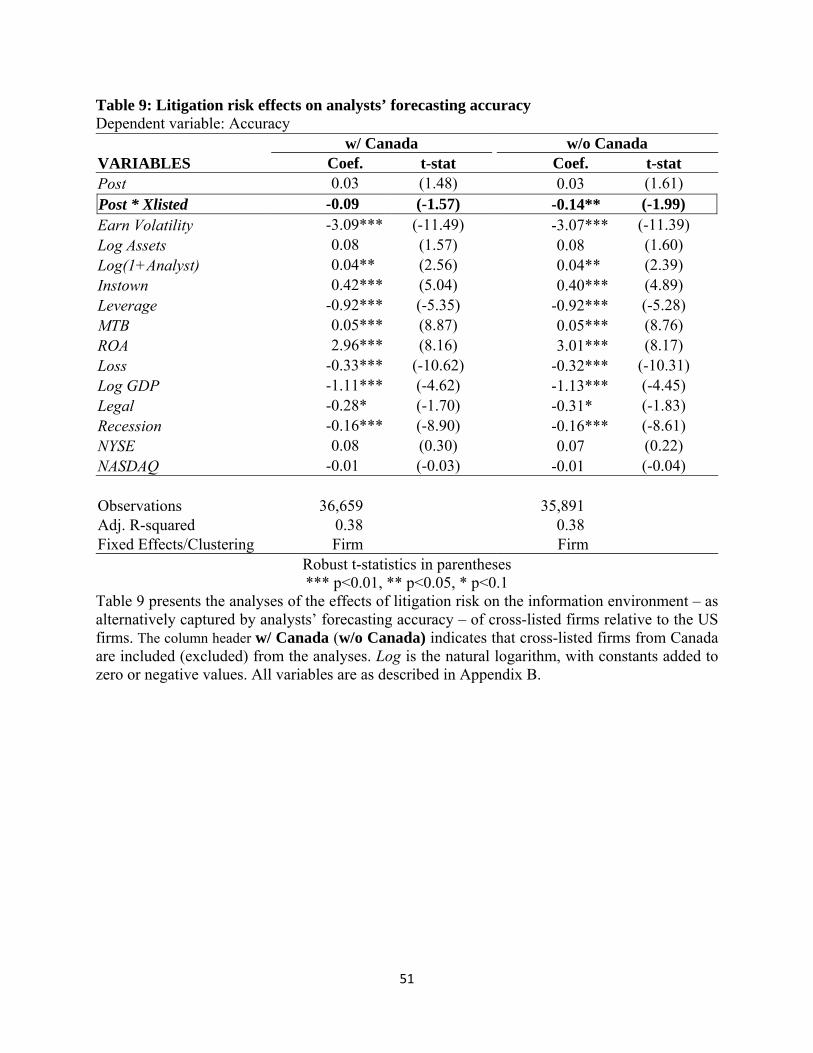
51
Table 9: Litigation risk effects on analysts’ forecasting accuracy Dependent variable: Accuracy w/ Canada w/o Canada VARIABLES Coef. ** t-stat Coef. ** t-stat Post 0.03*** (1.48) 0.03*** (1.61) Post * Xlisted -0.09*** (-1.57) -0.14*** (-1.99) Earn Volatility -3.09*** (-11.49) -3.07*** (-11.39) Log Assets 0.08*** (1.57) 0.08*** (1.60) Log(1+Analyst) 0.04*** (2.56) 0.04*** (2.39) Instown 0.42*** (5.04) 0.40*** (4.89) Leverage -0.92*** (-5.35) -0.92*** (-5.28) MTB 0.05*** (8.87) 0.05*** (8.76) ROA 2.96*** (8.16) 3.01*** (8.17) Loss -0.33*** (-10.62) -0.32*** (-10.31) Log GDP -1.11*** (-4.62) -1.13*** (-4.45) Legal -0.28*** (-1.70) -0.31*** (-1.83) Recession -0.16*** (-8.90) -0.16*** (-8.61) NYSE 0.08*** (0.30) 0.07*** (0.22) NASDAQ -0.01*** (-0.03) -0.01*** (-0.04) Observations 36,659 ** 35,891*** Adj. R-squared 0.38 ** 0.38*** Fixed Effects/Clustering Firm ** Firm **
Robust t-statistics in parentheses *** p<0.01, ** p<0.05, * p<0.1
Table 9 presents the analyses of the effects of litigation risk on the information environment – as alternatively captured by analysts’ forecasting accuracy – of cross-listed firms relative to the US firms. The column header w/ Canada (w/o Canada) indicates that cross-listed firms from Canada are included (excluded) from the analyses. Log is the natural logarithm, with constants added to zero or negative values. All variables are as described in Appendix B.
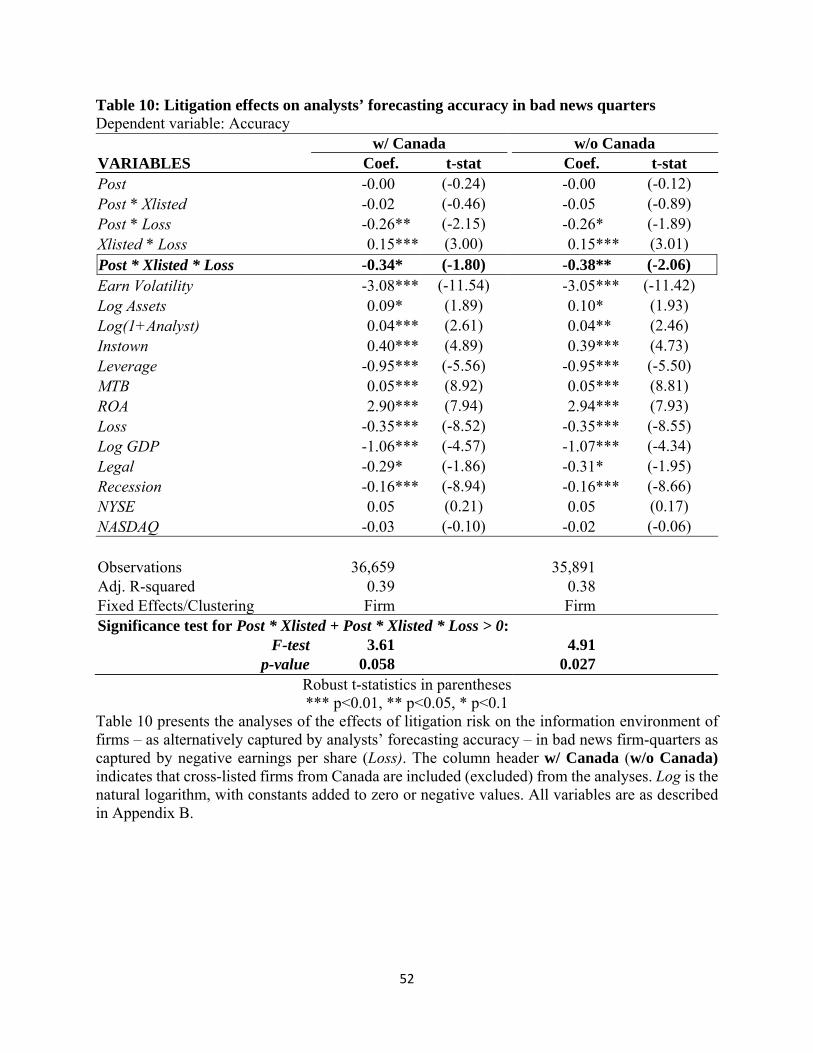
52
Table 10: Litigation effects on analysts’ forecasting accuracy in bad news quarters Dependent variable: Accuracy w/ Canada w/o Canada VARIABLES Coef. ** t-stat Coef. ** t-stat Post -0.00*** (-0.24) -0.00*** (-0.12) Post * Xlisted -0.02*** (-0.46) -0.05*** (-0.89) Post * Loss -0.26*** (-2.15) -0.26*** (-1.89) Xlisted * Loss 0.15*** (3.00) 0.15*** (3.01) Post * Xlisted * Loss -0.34*** (-1.80) -0.38*** (-2.06) Earn Volatility -3.08*** (-11.54) -3.05*** (-11.42) Log Assets 0.09*** (1.89) 0.10*** (1.93) Log(1+Analyst) 0.04*** (2.61) 0.04*** (2.46) Instown 0.40*** (4.89) 0.39*** (4.73) Leverage -0.95*** (-5.56) -0.95*** (-5.50) MTB 0.05*** (8.92) 0.05*** (8.81) ROA 2.90*** (7.94) 2.94*** (7.93) Loss -0.35*** (-8.52) -0.35*** (-8.55) Log GDP -1.06*** (-4.57) -1.07*** (-4.34) Legal -0.29*** (-1.86) -0.31*** (-1.95) Recession -0.16*** (-8.94) -0.16*** (-8.66) NYSE 0.05*** (0.21) 0.05*** (0.17) NASDAQ -0.03*** (-0.10) -0.02*** (-0.06) Observations 36,659*** 35,891*** Adj. R-squared 0.39*** 0.38*** Fixed Effects/Clustering Firm*** Firm*** Significance test for Post * Xlisted + Post * Xlisted * Loss > 0:
F-test 3.61*** 4.91*** p-value 0.058*** 0.027***
Robust t-statistics in parentheses *** p<0.01, ** p<0.05, * p<0.1
Table 10 presents the analyses of the effects of litigation risk on the information environment of firms – as alternatively captured by analysts’ forecasting accuracy – in bad news firm-quarters as captured by negative earnings per share (Loss). The column header w/ Canada (w/o Canada) indicates that cross-listed firms from Canada are included (excluded) from the analyses. Log is the natural logarithm, with constants added to zero or negative values. All variables are as described in Appendix B.