the effect of “schema development technique” on …
TRANSCRIPT

1
THE EFFECT OF “SCHEMA DEVELOPMENT TECHNIQUE”
ON STUDENTS’ READING ABILITY AT SENIOR HIGH SCHOOL
STUDENT
Deni Widiarti, Bambang Suwarno, Dedi Sofyan
Postgraduate Program of English Education
Department of Teaching and Art
Faculty of Teacher Training and Education
Bengkulu University
Bengkulu City, Indonesia
ABSTRACT
This study aimed to find the effect of “schema development technique” on students’ reading ability at senior high school students. It is also aimed to find whether schema
development technique could improve students’ reading ability on the aspect of literal
comprehension, inference and vocabulary building. The population was the tenth graders of SMA Negeri Rejang Lebong, from which two classes were selected as the research
sample. The instrument was a reading test. The instrument draft had been tried out. The
try out was done to find the validity and item characteristics of the original draft. From 90 try out item questions, 42 of them were found to be valid and 48 were invalid. The
reliabilty index was 0,898 (high). The findings of the research revealed that schema
development technique was effective for improving students overall comprehension. It
was also effective for improving two aspects (literal aspect and vocabulary building). However, it was not effective for improving students’ reading ability on inference aspect.
It’s caused by the nature of inference which requires for background knowledge towards
the reading text.
Key words: Schema Development Technique, Reading Ability, TEFL
ABSTRAK
Penelitian ini bertujuan untuk melihat dampak teknik schema development pada
kemampuan membaca siswa di Sekolah Menengah Atas. Selain itu juga bertujuan untuk menemukan apakah Schema Development Tecnique mampu meningkatkan kemampuan
membaca siswa pada aspek literal, aspek inference dan aspek vocabulary. Populasi
penelitian ini adalah siswa kelas X SMA Negeri 4 Rejang Lebong, terdiri dari dua kelas yang dipilih sebagai sampel penelitian. Instrument adalah test kemampuan membaca.
Draft instrument telah di uji coba dengan nilai r = 0.898 ( tinggi ). Uji coba telah
dilaksanakan untuk menemukan validitas dan karakteristik soal dari draft asli. Dari 90
soal uji coba, 42 soal valid dan 48 soal tidak valid. Indeks reliability adalah 0.898 ( tinggi ). Hasil dari penelitian ini membuktikan bahwa teknik Schema Development efektif untuk
meningkatkan kemampuan membaca siswa secara keseluruhan. Selain itu juga efektif
untuk meningkatkan kemampuan siswa pada dua aspek (aspect literal dan aspect

2
vocabulary). Akan tetapi, Teknik Schema Development tidak efektif dalam meningkatkan
aspek inference. Hal tersebut disebabkan oleh kemampuan inference membutuhkan
kemampuan awal tentang teks yang dibaca.
Kata Kunci :Teknik Schema Development, Kemampuan Membaca, TEFL
INTRODUCTION
The act of reading cannot be
separated from comprehension. The
students cannot achieve their
academic success without
comprehending what they read. In
comprehending the text, the students
should be monitored by their
teachers, hence the way to teach
comprehension should be well
understood by the teachers. Teaching
comprehension is an activity through
some steps: selecting a text,
explaining the strategy, modelling
the strategy, guided support,
practicing independently, and
reflecting( McNamara: 2006).
Therefore, it can be concluded that
reading comprehension is a long
process.
In addition, having a good
comprehension in reading can be
facilitated by many strategies.
McNamara(2006) whose thinking is
adopted by the College Board
underlines growing recognition that
the use of reading strategies is
essential; high ability students who
use reading strategies are getting
successful not only in
comprehending reading, but also in
overcoming reading problems and
becoming a better reader and
comprehender. In summary, the
students should have better strategies
for their good comprehension.
Nowadays, the need of reading
comprehension requires teachers to
facilitate students through interesting
strategies in learning process.
Reading is a complex process,
complex to learn and complex to
teach (Carnine, Silbert, and
Kameenui: 1990:3), so there must be
a technique which can help them to
read effectively and interestingly.
Explicit teaching
comprehension strategies is seen as a
possible approach to tackle the
problems faced by the students. In
this case, the researcher will try to
find interesting and effective way for
the students and the teachers so that
they can do their reading activity
well.
The students have to improve
their prior knowledge about reading
skill, because the student’s ability in
answering questions between the
lines is still poor. It can be proven by
their mark in Reading subject,
showed that many of students got
mark C. It can be proven by their
score of reading test in Daily
Examination. 50% students got score
under the Minimal Mastery Criteria
(KKM = 75), 40% students got score
75 and just 10% students get score
80. They must have background
knowledge in order to understand
content of text. And after that they
will be able to answer the questions
that the answer are not stated in the
text.
One of techniques which are
available is the Schema
Development Technique. By using
this technique, the students were
3
able to communicate information
because it can clarify complex
concepts into simple, meaningful
displays so that the students can
develop a holistic understanding of
the content to be learned (Siriphanich
and Laohawiriyano).
From this case the researcher
tries to apply Schema Development
Technique in teaching reading.
Schema theory is a theory about
knowledge, about how knowledge is
represented, and about how that
representation facilitates the use of
knowledge in various ways.
According to schema theorists, all
knowledge is packaged into units
called schemata, and embedded into
these units of knowledge is
information on how this knowledge
is to be used (Porter: 2007).
Schema Development
Technique is an active organization
of past reaction, on past experience.
Through Schema Development
Technique, the students will be able
to recall their memories or their past
experience. Because the use of this
technique is to build background
knowledge and to recall the
memories. The use of Schema
Development Technique is to make
students improve their ability in
comprehending the reading text,
which the answers that are not
directly stated in the text. Through
this technique, the student will be
taught the way how to understand the
text with knowledge from outside
before they read the text and answer
the questions. The students have to
be motivated to read more seriously
and efficiently in order to make
reading itself as their reading ability.
METHOD
The research employs Quasi
Experimental Design, especially in
the form of One-Group Pretest-
Posttest Design. This design is used
for seeing the effect of “Schema
Development Technique” in
improving students’ reading ability.
In the beginning, the researcher has
been given the pre-test to the sample
and after the treatment, the sample
has been given a post-test. The result
has been seen by comparing pre-test
score and post-test score
(Ruseffendi: 1994).
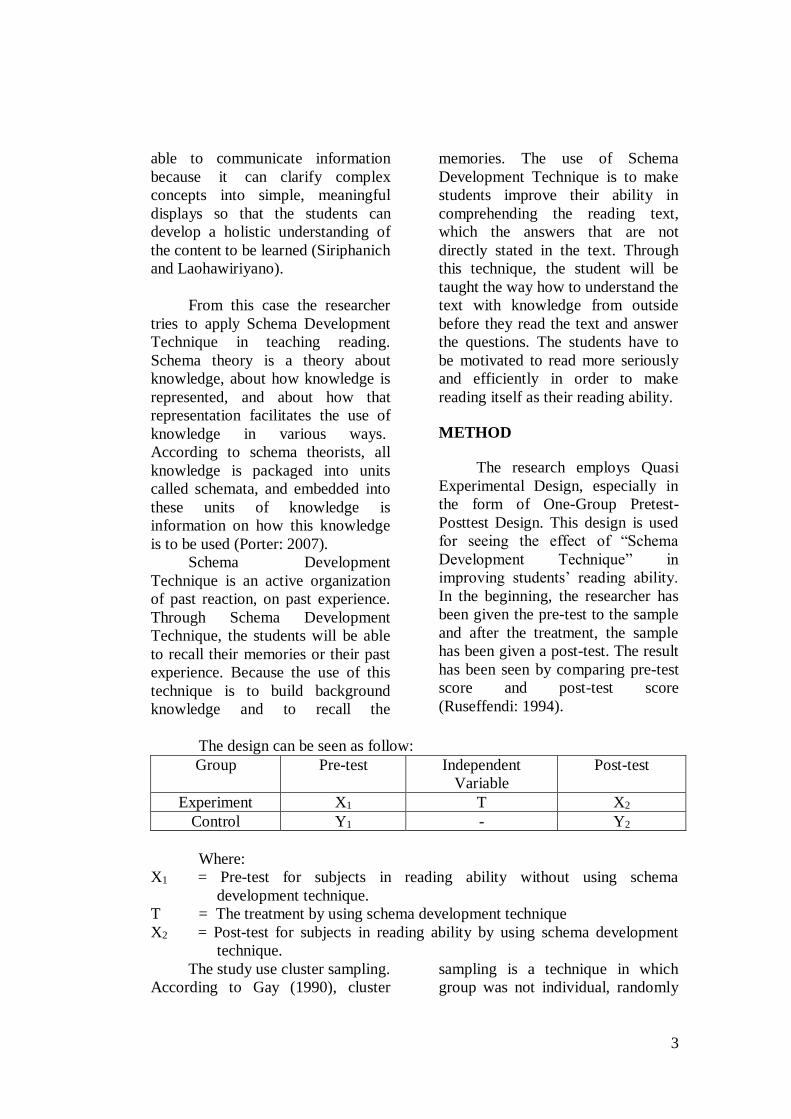
The design can be seen as follow:
Group Pre-test Independent
Variable
Post-test
Experiment X1 T X2
Control Y1 - Y2
Where:
X1 = Pre-test for subjects in reading ability without using schema
development technique.
T = The treatment by using schema development technique
X2 = Post-test for subjects in reading ability by using schema development
technique.
The study use cluster sampling.
According to Gay (1990), cluster
sampling is a technique in which
group was not individual, randomly
4
selected. All members of the selected
groups have similar characteristics.
The instrument that has been
used in this research is a reading
comprehension test and has been
prepared by the researcher that is
adopted from the student’s book and
other relevant books. The original
draft are 90 items.
The 90 questions have been tried out
to the students of class X IPS 2 of the
same school, but not belong to the
samples of this research. The try out
has been conducted to find its
validity and items characteristics,
items that pass should be met the
criteria of Felicity Value(FV) and
Discrimination Index(DI).The test
will be constructed based on the
following framework.
RESEARCH FINDING AND
DISCUSSION
A. Result of Total Pre-Test
and Post-Test
1. Try Out Result
Before doing the pre-test, the
test itself was tried out in class X
IPS2 of the same school. The try out
was used to find the validity and item
characteristics of the original draft.
From 90 try out item questions, 42 of
them were found to be valid and 48
were invalid. The realibilty index
was 0,898 (high). According to
Heaton (1988), the test is valid if the
Felicity Value (FV) is between 0,3
and 0,7 and Discrimination
Index(DI) score is to be equal or
more than 0,3.
2. Result of Normality Test
2.1 Pre-Test
The result of pre-test for
experiment group was calculated by
using the formula of normality test.
From the Chi Square Value, χ2
obtained was smaller than χ2 table
(0.120 < 47.4). And control class, χ2
obtained was smaller than χ2 table
(0.118 < 47.4). (See appendix 9)
2.2 Post-Test
The result of post-test for
control class was calculated by
using the formula of normality test.
From the Chi Square Value, χ2
obtained was smaller than χ2 table (
0.210 < 47,4). And control group, χ2
obtained was smaller than χ2 table
(0.2 < 47.4). ( See appendix 10 )
3. Result of Homogeneity Test
3.1 Pre-Test
Then the result of pre-test was
calculated by using the formula of F
value. From the F value calculation,
the F obtained was smaller than F
table (0.278 < 3.991), in other words,
both sample have equal variances.
Thus, analysis was continued by
using the t-test for equal variances.
(See appendix 11 )
3.2 Post-Test
The result of post-test was
calculated by using the formula of F
value. From the F-value calculation,
the F-count was 0.465 whereas the F-
table was 3.991. it means that F-
count was smaller than F-table
(0.465 < 3.991). In other words, both
samples have equal variances. Thus,
the analysis was continued by using
t-test formula for equal variances
(See appendix 12).
In order to to analyze the pre-
test and post-test result the score of
experimental group and control
group were compared by using t-test

5
was used to see whether the
treatment could improve students
reading ability or not.
4. Hypothesis testing
4.1 Pre-test
From t-test calculation, the
value of t-count was 0.355 and t-
table was 1.669. It showed that t
obtained was smaller than t-table (t-
count < t-table; 0.355 < 1.669).
Based on the explanation above, the
differences between the two groups
were small. Briefly, these two groups
have similar ability and therefore
those groups can be accepted as the
sample of the research.
From the result of pre-test
calculation, it means there was no
significant difference between the
experimental group and the control
group. In addition, the result of
hypothesis testing indicated the
alternative hypothesis (H0) “There is
no significant difference in students
reading ability between the
experimental group and control
group”. H0 was accepted and H1 was
rejected.
The pre-test was given on
January 15th and 17th ,2018 before
the treatment to know wether the two
groups had similar ability. The
treatment was held since January
22nd – February15th. The result of
pre-test was compared in the
following table :
Table 2. Pre-test Result
Class Max
score
Min
score
Mean
score
t-count t-table Difference Remark
E
76.1 35.7 63.21
0.355 1.669
No Significant
difference
Two tailed α =
0.05 C
76.1 38 63.95
Note :
E : Experiment Class
C : Control Class
The table 2 shown that the
highest score of the experiment class
(76.1) was gained by one student and
the lowest score (35.7) was gained
by one student. Meanwhile, in the
control class the highest score (76.1)
gained by one student and the lowest
score (38) was gained by one
student. From the calculation, it was
found that the mean score of
experiment class was 63.21 and
control class was 63.95.
4.2 Post-test
From t-test calculation, the
value of t-count was 1.807 and t-table
was 1.669. It showed that t obtained
was bigger than t-table (t-count > t-
table; 1.807 > 1.669). It can be
concluded that H0 was rejected and
H1 was accepted. In other words,
there was a significant difference in
post-test score average between the
experimental group and control
group. Shortly, this research was
successful and showed that
6
implementing schema development
technique could improve students’
reading ability at the tenth grade of
SMA Negeri 4 Rejang Lebong.
The post test was given on
February 21st and 22nd after the last
treatment. It was given to both
groups, the experimental class and
cotrol class. The post-test was
administered to see whether or not
Schema Development Technique
could make an improvement by the
experiment group. The result of the
post-test was used to find out the
maximum score, the minimum score,
and the mean score from both groups
that can be seen in the following
table.
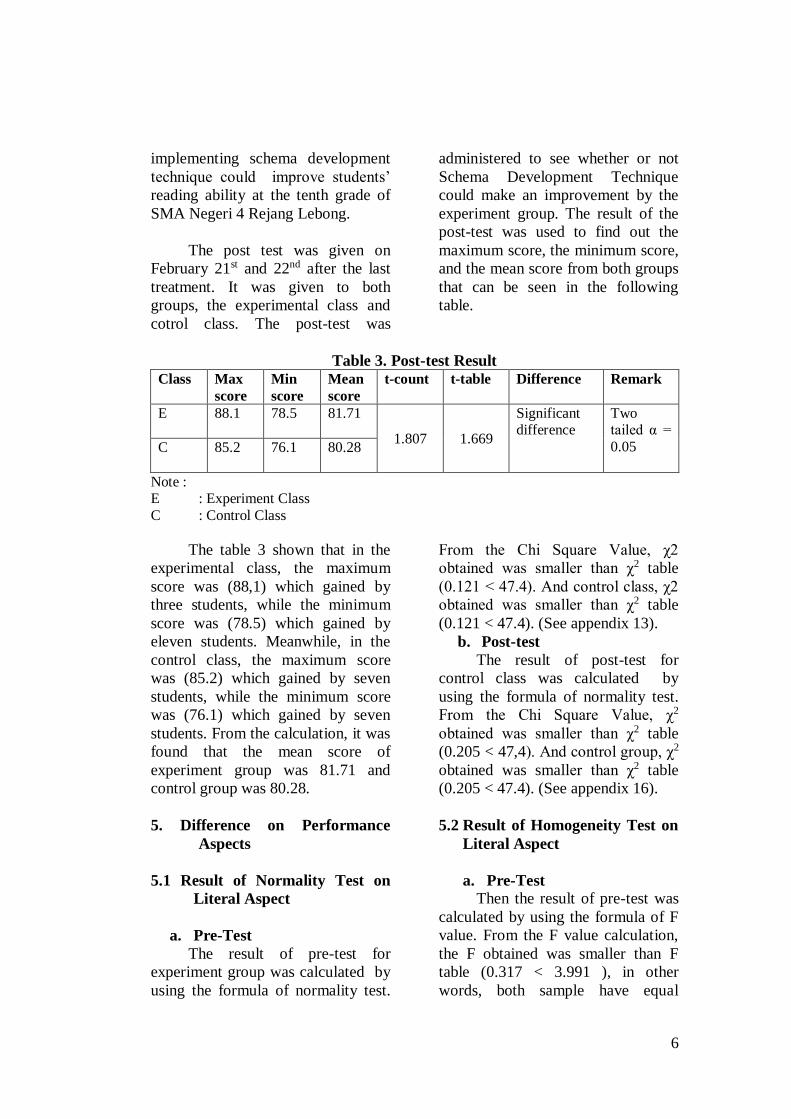
Table 3. Post-test Result
Class Max
score
Min
score
Mean
score
t-count t-table Difference Remark
E 88.1 78.5
81.71
1.807 1.669
Significant difference
Two tailed α =
0.05 C 85.2
76.1
80.28
Note : E : Experiment Class
C : Control Class
The table 3 shown that in the
experimental class, the maximum
score was (88,1) which gained by
three students, while the minimum
score was (78.5) which gained by
eleven students. Meanwhile, in the
control class, the maximum score
was (85.2) which gained by seven
students, while the minimum score
was (76.1) which gained by seven
students. From the calculation, it was
found that the mean score of
experiment group was 81.71 and
control group was 80.28.
5. Difference on Performance
Aspects
5.1 Result of Normality Test on
Literal Aspect
a. Pre-Test
The result of pre-test for
experiment group was calculated by
using the formula of normality test.
From the Chi Square Value, χ2
obtained was smaller than χ2 table
(0.121 < 47.4). And control class, χ2
obtained was smaller than χ2 table
(0.121 < 47.4). (See appendix 13).
b. Post-test
The result of post-test for
control class was calculated by
using the formula of normality test.
From the Chi Square Value, χ2
obtained was smaller than χ2 table
(0.205 < 47,4). And control group, χ2
obtained was smaller than χ2 table
(0.205 < 47.4). (See appendix 16).
5.2 Result of Homogeneity Test on
Literal Aspect
a. Pre-Test
Then the result of pre-test was
calculated by using the formula of F
value. From the F value calculation,
the F obtained was smaller than F
table (0.317 < 3.991 ), in other
words, both sample have equal

7
variances. Thus, analysis was
continued by using the t-test for
equal variances (See appendix 19).
b. Post-Test
The result of post-test was
calculated by using the formula of F-
value. From the F-value calculation,
the F-count was 0.575, whereas the
F- table was 3.991. It means that F-
count was smaller than F-table
(0.575 < 3.991. In other words, both
samples have equal variances. Thus,
the analysis was continued by using
t-test formula for equal variances
(See appendix 22).
5.3 Hypothesis testing on literal
aspect
a. Pre-Test
From t-test calculation, the
value of t-count was -0,334 and t-
table was 1.669. It showed that t
obtained was smaller than t-table (t-
count < t-table; -0.334 < 1.669).
Based on the explanation above, the
differences between the two groups
were small. Briefly, these two groups
have similar ability and therefore
those groups can be accepted as the
sample of the research.
The result of hypothesis testing
indicated the alternative hypothesis
(H0) “There is no significant
difference in students reading ability
between the experimental group and
control group”. H0 was accepted and
H1 was rejected.
In order to answer the second
problem, the researcher also analyze
the result of literal aspect score
analysis of pre-test. The result was
compared in the following table.
Table 4. Literal Pre-Test Result
Class Max
score
Min
score
Mean
score
t-count t-table Difference Remark
E
84.5
39 70.22
-0.334 1.669
No
Significant
difference
Two
tailed α =
0.05 C
82.2
41 68,84
Note :
E : Experiment Class
C : Control Class
The table 4 shown that the
maximal score of the experimental
group (84.5) was gained by two
students and the minimum score (39)
was gained by one student.
Meanwhile, in the control group the
maximum score (82.2) also was
gained by one student and the
minimum score 41 was gained by
one student. From the calculation, it
was found that the mean score of
experimental group was 70.22 and
control group was 68.84.
Experimental mean score is bigger
than control group.
8
b. Post-test
From t-test calculation, the
value of t-count was 1,722 and t-
table was 1.669. It showed that t
obtained was bigger than t-table (t-
count > t-table; 1,722 > 1.669). It can
be concluded that H0 was rejected
and H1 was accepted. In other words,
there was a significant difference in
post-test score average between the
experimental group and control
group in literal aspect. Shortly, this
research was successful and showed
that implementing schema
development technique could
improve students’ reading ability at
the tenth grade of SMA Negeri 4
Rejang Lebong.
The result of literal post-test
score was used to find out maximum
score, minimum score and the mean
score from both groups that can be
seen in the following table.
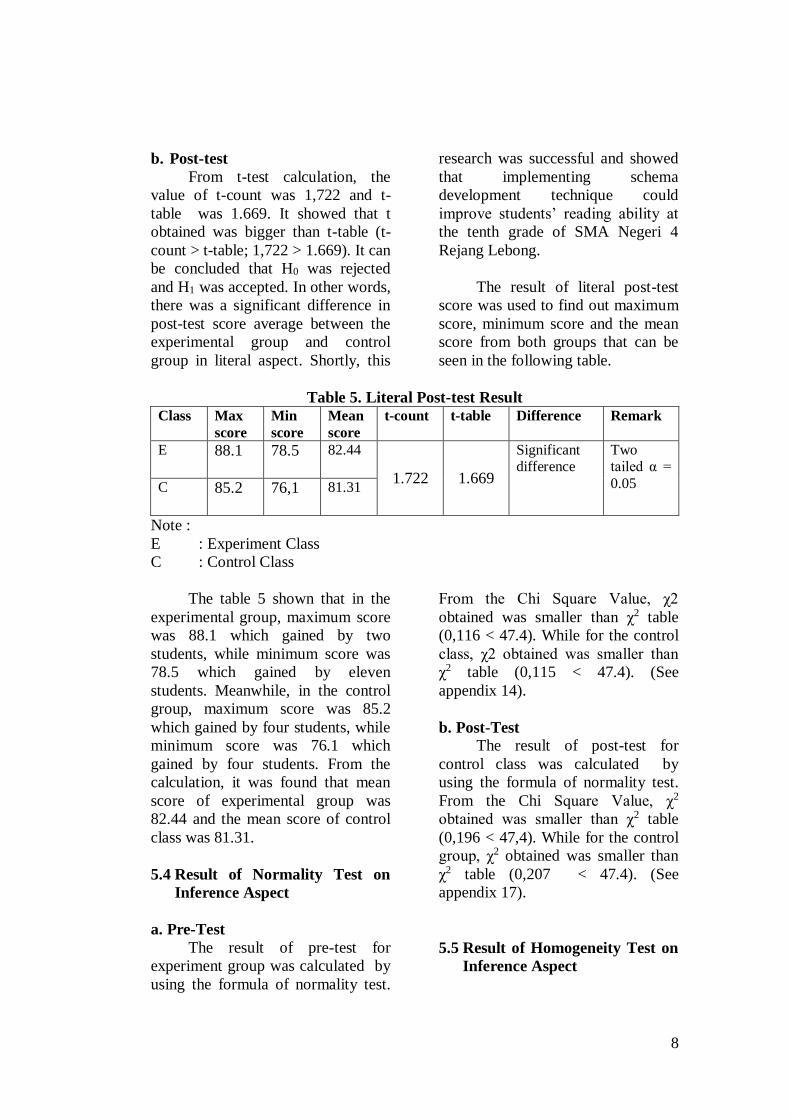
Table 5. Literal Post-test Result
Class Max
score
Min
score
Mean
score
t-count t-table Difference Remark
E
88.1
78.5
82.44
1.722 1.669
Significant difference
Two tailed α =
0.05 C
85.2
76,1
81.31
Note :
E : Experiment Class
C : Control Class
The table 5 shown that in the
experimental group, maximum score
was 88.1 which gained by two
students, while minimum score was
78.5 which gained by eleven
students. Meanwhile, in the control
group, maximum score was 85.2
which gained by four students, while
minimum score was 76.1 which
gained by four students. From the
calculation, it was found that mean
score of experimental group was
82.44 and the mean score of control
class was 81.31.
5.4 Result of Normality Test on
Inference Aspect
a. Pre-Test
The result of pre-test for
experiment group was calculated by
using the formula of normality test.
From the Chi Square Value, χ2
obtained was smaller than χ2 table
(0,116 < 47.4). While for the control
class, χ2 obtained was smaller than
χ2 table (0,115 < 47.4). (See
appendix 14).
b. Post-Test
The result of post-test for
control class was calculated by
using the formula of normality test.
From the Chi Square Value, χ2
obtained was smaller than χ2 table
(0,196 < 47,4). While for the control
group, χ2 obtained was smaller than
χ2 table (0,207 < 47.4). (See
appendix 17).
5.5 Result of Homogeneity Test on
Inference Aspect
9
a. Pre-Test
Then the result of pre-test was
calculated by using the formula of F
value. From the F value calculation,
the F obtained was smaller than F
table (0,331 < 3.991 ), in other
words, both sample have equal
variances. Thus, analysis was
continued by using the t-test for
equal variances (See appendix 20).
b. Post-test
The result of post-test was
calculated by using the formula of F-
value. From the F-value calculation,
the F-count was 1.472, whereas the
F- table was 3.991. It means that F-
count was smaller than F-table
(1,472 < 3.991. In other words, both
samples have equal variances. Thus,
the analysis was continued by using
t-test formula for equal variances
(See appendix 23).
5.6 Hypothesis testing on Inference
aspect
a. Pre-Test From t-test calculation, the
value of t-count was -0,341 and t-
table was 1.669. It showed that t
obtained was smaller than t-table (t-
count < t-table; -0.341 < 1.669).
Based on the explanation above, the
differences between the two groups
were small or not significant, these
two groups have similar ability.
The result of hypothesis testing
indicated the alternative hypothesis
(H0) “There is no significant
difference in students reading ability
between the experimental group and
control group” on inference aspect.
H0 was accepted and H1 was
rejected.
In order to answer the second
problem, the researcher analyze the
result of Inference Aspect score
analysis of pre-test. The result was
compared in the following table.
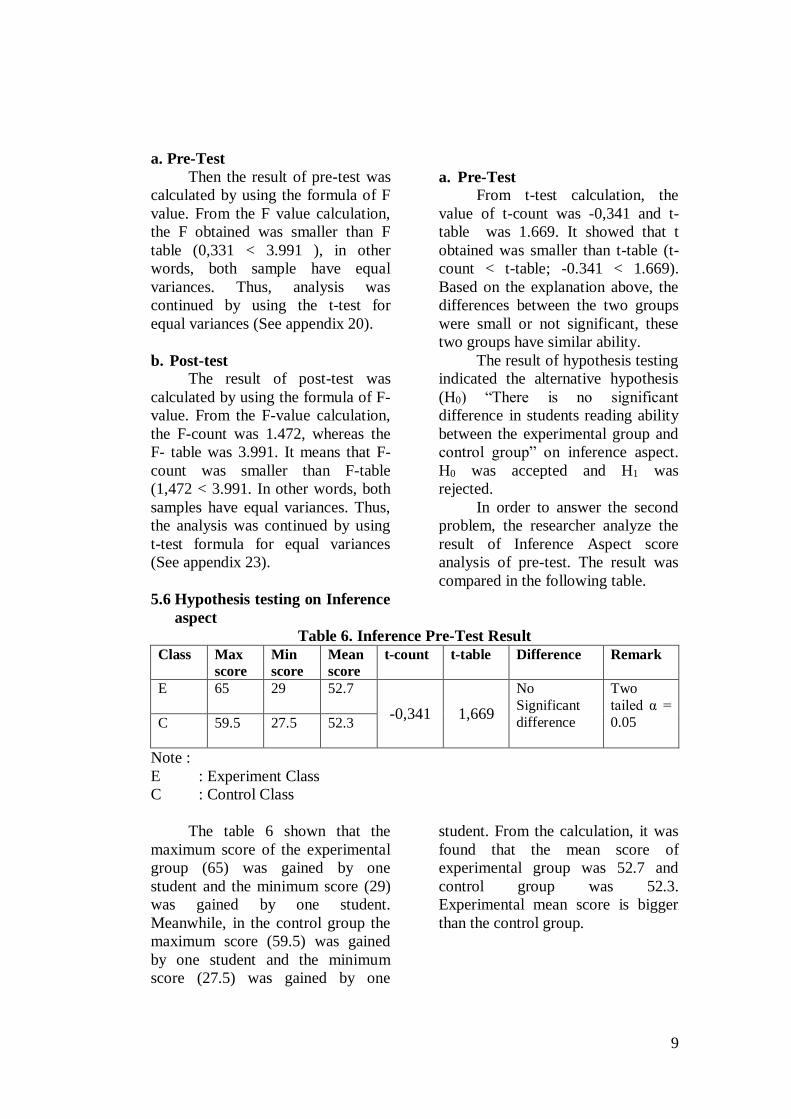
Table 6. Inference Pre-Test Result
Class Max
score
Min
score
Mean
score
t-count t-table Difference Remark
E
65 29 52.7
-0,341 1,669
No
Significant
difference
Two
tailed α =
0.05 C
59.5 27.5 52.3
Note :
E : Experiment Class
C : Control Class
The table 6 shown that the
maximum score of the experimental
group (65) was gained by one
student and the minimum score (29)
was gained by one student.
Meanwhile, in the control group the
maximum score (59.5) was gained
by one student and the minimum
score (27.5) was gained by one
student. From the calculation, it was
found that the mean score of
experimental group was 52.7 and
control group was 52.3.
Experimental mean score is bigger
than the control group.
10
b. Post-test
From t-test calculation, the
value of t-count was 1.270 and t-
table was 1.669. It showed that t
obtained was smaller than t-table (t-
count < t-table; 1.270 > 1.669). It can
be concluded that H0 was accepted
and H1 was rejected. In other words,
there was no significant difference in
post-test score average between the
experimental group and control
group in inference. Shortly, this
research was not successful and
showed that implementing schema
development technique could not
improve students’ reading ability at
the tenth grade of SMA Negeri 4
Rejang Lebong.
The result inference post-test
score was used to find out maximum
score, minimum score, and mean
score of both groups that can be seen
in the following table.
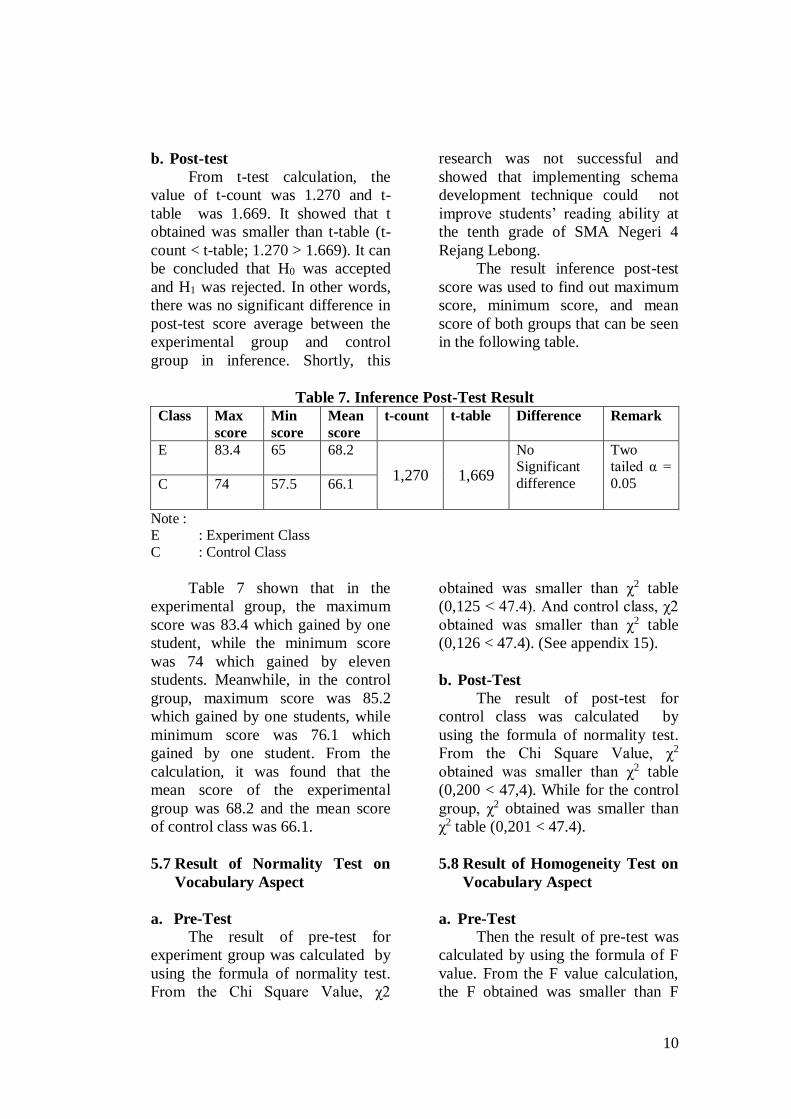
Table 7. Inference Post-Test Result
Class Max
score
Min
score
Mean
score
t-count t-table Difference Remark
E
83.4 65 68.2
1,270 1,669
No Significant
difference
Two tailed α =
0.05 C
74 57.5 66.1
Note : E : Experiment Class
C : Control Class
Table 7 shown that in the
experimental group, the maximum
score was 83.4 which gained by one
student, while the minimum score
was 74 which gained by eleven
students. Meanwhile, in the control
group, maximum score was 85.2
which gained by one students, while
minimum score was 76.1 which
gained by one student. From the
calculation, it was found that the
mean score of the experimental
group was 68.2 and the mean score
of control class was 66.1.
5.7 Result of Normality Test on
Vocabulary Aspect
a. Pre-Test
The result of pre-test for
experiment group was calculated by
using the formula of normality test.
From the Chi Square Value, χ2
obtained was smaller than χ2 table
(0,125 < 47.4). And control class, χ2
obtained was smaller than χ2 table
(0,126 < 47.4). (See appendix 15).
b. Post-Test
The result of post-test for
control class was calculated by
using the formula of normality test.
From the Chi Square Value, χ2
obtained was smaller than χ2 table
(0,200 < 47,4). While for the control
group, χ2 obtained was smaller than
χ2 table (0,201 < 47.4).
5.8 Result of Homogeneity Test on
Vocabulary Aspect
a. Pre-Test
Then the result of pre-test was
calculated by using the formula of F
value. From the F value calculation,
the F obtained was smaller than F

11
table (0,299 < 3.991 ). In other
words, both sample have equal
variances. Thus, analysis was
continued by using the t-test for
equal variances (See appendix 24).
b. Post-Test
The result of post-test was
calculated by using the formula of F-
value. From the F-value calculation,
the F-count was 0,085, whereas the
F- table was 3.991. It means that F-
count was smaller than F-table
(0,085 < 3.991. In other words, both
samples have equal variances. Thus,
the analysis was continued by using
t-test formula for equal variances.
5.9 Hypothesis testing on
Vocabulary aspect
a. Pre-Test
From t-test calculation, the
value of t-count was -0,341 and t-
table was 1.669. It showed that the t
obtained was smaller than t-table (t-
count < t-table; -0,327 < 1.669).
Based on the explanation above, the
differences between the two groups
were small or not significant briefly,
these two groups have similar ability.
The result of hypothesis testing
indicated the alternative hypothesis
(H0) “There is no significant
difference in students reading ability
between the experimental group and
control group” on vocabulary aspect.
H0 was accepted and H1 was rejected
In order to answer the second
problem, the researcher analyzed the
result of Vocabulary score analysis
of pre-test. The overall results were
shown in the following table.
Table 8. Vocabulary Pre-Test Result
Class Max
score
Min
score
Mean
score
t-count t-table Difference Remark
E 82 40 69.9 -0,327 1,669
No Significant
difference
Two tailed
α = 0.05 C 79.33 38.3 69.8
Note :
E : Experiment Class
C : Control Class
The 8 shown the maximum
score of the experimental group (82)
was gained by one student and the
minimum score (40) was gained by
one student. Meanwhile, in the
control group the maximum score
(79.33) was gained by one student
and the minimum score (38.3) was
gained by one student. From the
calculation, it was found that the
mean score of experimental group
was 69.9 and control group was 69.8.
Experimental mean score is bigger
than control group.
b. Post-Test
From t-test calculation, the
value of t-count was 1.741 and t-
table was 1.669. It showed that t
obtained was bigger than t-table (t-
count > t-table; 1.741 > 1.669). It can
be concluded that H0 was rejected
and H1 was accepted. In other words,
there was a significant difference in
post-test score average between the
experimental group and control
group in vocabulary aspect. Shortly,
this research was successful and
showed that implementing schema
development technique could
12
improve students’ reading ability at
the tenth grade of SMA Negeri 4
Rejang Lebong.
The result vocabulary post-test
score was used to find out maximum
score, minimum score, and mean
score from both groups that can be
seen in the following table.
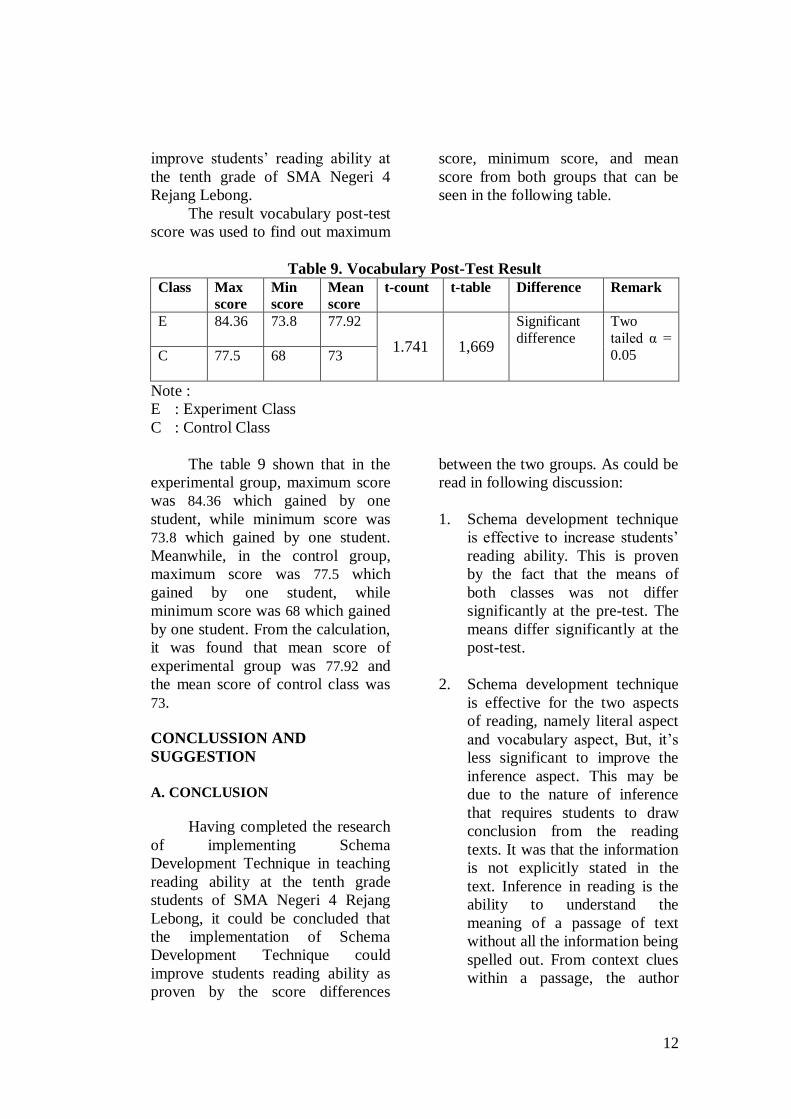
Table 9. Vocabulary Post-Test Result
Class Max
score
Min
score
Mean
score
t-count t-table Difference Remark
E
84.36 73.8 77.92
1.741 1,669
Significant
difference
Two
tailed α =
0.05 C
77.5 68 73
Note :
E : Experiment Class
C : Control Class
The table 9 shown that in the
experimental group, maximum score
was 84.36 which gained by one
student, while minimum score was
73.8 which gained by one student.
Meanwhile, in the control group,
maximum score was 77.5 which
gained by one student, while
minimum score was 68 which gained
by one student. From the calculation,
it was found that mean score of
experimental group was 77.92 and
the mean score of control class was
73.
CONCLUSSION AND
SUGGESTION
A. CONCLUSION
Having completed the research
of implementing Schema
Development Technique in teaching
reading ability at the tenth grade
students of SMA Negeri 4 Rejang
Lebong, it could be concluded that
the implementation of Schema
Development Technique could
improve students reading ability as
proven by the score differences
between the two groups. As could be
read in following discussion:
1. Schema development technique
is effective to increase students’
reading ability. This is proven
by the fact that the means of
both classes was not differ
significantly at the pre-test. The
means differ significantly at the
post-test.
2. Schema development technique
is effective for the two aspects
of reading, namely literal aspect
and vocabulary aspect, But, it’s
less significant to improve the
inference aspect. This may be
due to the nature of inference
that requires students to draw
conclusion from the reading
texts. It was that the information
is not explicitly stated in the
text. Inference in reading is the
ability to understand the
meaning of a passage of text
without all the information being
spelled out. From context clues
within a passage, the author
13
gives information about plot,
characters, setting, time period
and other elements of story by
the things he or she infers. Word
choice and word order give clues
about the story as it unfolds to
the reader. Readers take the
clues they are given and draw
conclusions based on their own
worldview and personal
experiences.(Richards, 2017)
B. SUGGESTION
Based on the conclusion above,
the researcher would like to give
suggestions related to this research,
which hopefully will be helpful for
English teacher, students, institution,
and further researcher.
1. For English teacher, stimulate the
students to be active in the
teaching learning process is very
important. Teacher should
motivate and challenge them to
read more effectively in teaching
and learning process of reading.
Based on that reason, the
language teacher should choose a
certain teaching technique that
can build a good atmosphere of
teaching learning process such as
reading use Schema
Development Technique.
Teacher should use the Schema
Development Technique to
improve students’ reading ability
on literal aspect, vocabulary
aspect, especially for inference
aspect.
2. For the students, a great
motivation is something that
students should have. With a
great motivation, they will
practice more in order to explore
their English. They also should
practice the reading ability more,
because it can give more
knowledge for them. Reading
also can enrich their vocabulary.
Schema development technique
is an effective technique for
improving students’ reading
ability.
3. Based on some limitation in this
study, it’s better for further
researcher to conduct a study
with this technique and should
pay attention to vocabulary
teaching and learning process. It
is suggested should be given
separated treatment and
assessment for vocabulary
building.
REFERENCES
Ahmad, F. (2016).Contoh-soal-
narrative-text-sma-
pilihanganda. Retrivied on
April 29th, 2018 from
https://umuminfo.blogspot.co
.id/2016/10/.html.
Alemi, M. (2010). The effects of pre-
reading activities on esp
reading comprehension.
Sharif University of
Technology, Tehran, Iran :
Published Thesis.
Alderson, J. C. (2000). Assessing
reading. Cambridge, UK
University Press.

14
Anderson and Pearson. (1987). “A
schema theoretic view of
basic processes in reading
comprehension”, TESOL
Quarterly, vol 21 no 3.
Ary, D. (2002). Introduction in
research in education.
Beltmont, CA: Wadsworth
Thomson learning.
Arikunto, S. (1998). Prosedur
penelitian suatu peningkatan.
Jakarta, Indonesia: Rineka
Cipta.
Ben, T.(2003).Pre reading
strategies. Retrivied on April
29th, 2018 from
www.lawnerds.com/guide/rea
ding.html.
Bycina and Dubbin. F. (1991).
Teaching English as a second
language. New York, NY:
Newbury House.
Cain, K., Lemmon, K., & Oakhill, J.
(2004). Individual differences
in the inference of word
meanings from context: The
influence of reading
comprehension, vocabulary
knowledge, and memory
capacity. Journal of
Educational Psychology,
96(4), 671-681.
Cain, K., Oakhill, J. (2006). Profiles
of children with specific
reading comprehension
difficulties. British Journal of
Educational Psychology. 76,
683-393. DOI:
10.1348/000709905X67610.
Ciardiello. (1998). Handbook of
research on reading
comprehension. United
Stated of America, USA :
University of North Carolina
and Greenshoro.
Carrel, P. L, et al. (1986). Interactive
approaches to second
language reading.
Cambridge, UK: Cambridge
University.
Carrel, P and Eisterhold. (1987).
“Schema theory and esl
reading pedagogy”.TESOL
Quarterly, vol 21 no 3.
Chastain, K. (1988). Developing
second-language skills,
theory and practice, 3rd
ed. Boston,MA: Harcourt
brace Jovanovich, Inc.
Chia, H.I. (2001). Reading activities
for effective top down
processing. Delhi, India :
Asoke K. Ghosh.
Devine, T.G. (1986). Teaching
reading comprehension from
theory to practice. London,
UK: Allin and Bacon.
Dewi, C. K. (2014). Improving the
Reading Comprehension of
Grade VIII Students at SMP
N 1 Mlati Using Schema
Activation Strategy in the
Academic Year of 2013/2014.
Universitas Negeri
Yogyakarta,Indonesia :
Unpublished Thesis.

15
Gay, L.R. (1990). Educational
reasearch. New York, NY:
Macmillan.
Heaton, J.B. (1988). Writing English
language test. New York,
NY: Longman
Harmer, J. (2007). The practice of
english language teaching.
New York, NY: Longman
Klingner, J. K., & Vaughn, S.
(1996). Reciprocal teaching
of reading comprehension
strategies for students with
learning disabilities who use
English as a second
language. Elementary School
Journal, 96, 275-293.
Manola, Frank. (1998). Flexible
common schema study.
McNamara, D.S., &Magliano, J. P.
(2006). Towards a
comprehensive model of
comprehension. In B. Rose
(Ed.), The psychology of
learning and motivation
(pp.297-384).New York, NY:
Academic Press.
Mohamed, Abd Al Kareem. (2014).
The impact of using schema
theory on reading
comprehension among eighth
grade students in karak
governorate in of pre-
prepared knowledge
activities. Al-Hussein Bin
Talal University :
Unpublished Thesis.
Morgan, Nicola. (2000). Pre reading
skills. Retrivied on April 29th
2018, from
Nunan, David.(1991). Language
teaching methodology.
Sydney, Australia: Macquarie
University.
Nuttall, Christine. (1996). Teaching
reading skill in a foreign
language. London, UK:
Heineman.
Porter, Louise. (2007). Theory and
practice for teachers.
Australia, Camberas :
National Library of Australia.
Ruseffendi, E.T. (1994). Dasar-
dasar penelitian penelitian
dan bidang non-eksata
lainnya. Semarang,
Indonesia: IKIP Semarang
Press
Richard.2017. Hearst Seattle Media,
LLC
Sasson, D. (2007). Improving ESL
Reading Skills.
www.google.com
Seymour, K. (2017). Schema theory
and reading comprehension.
Retrivied on April 29th, 2018
from
https://wehavekids.com/educ
ation/Reading-
Comprehension-Theory
Sirkin, R. Mark. (1994). Statistics for
social sciences second
edition. London, UK: Sage
Publication.

16
Varaprasad, C. (1997). Some
classroom strategies, vol 35
no 3
www.bahasainggrisoke.com
Zakharenko. (2007). How can pre-
reading strategies benefit
students with disabilities.
Newyorks, NY : St. John
Fisher College.