the effect of political and labour unrest on productivity
TRANSCRIPT

Working paper
The effect of political and labour unrest on productivity
Evidence from Bangladeshi garments
Anik Ashraf Rocco Macchiavello Atonu Rabbani Christopher Woodruff
December 2015

The Effect of Political and Labour Unrest on Productivity: Evidence from Bangladeshi
Garments
Anik Ashraf, Rocco Macchiavello, Atonu Rabbani and Christopher Woodruff*
15 December 2015
Abstract: We examine the effects of political strikes and labour unrest on production in 33 large ready-made garment factories in Bangladesh. We find that the political strikes (hartals) lasting one or two days have very little effect on productivity or worker absenteeism. We see some negative effects on factories for strikes lasting five days or more. The main channel for negative effects appears to be supply chain disruptions rather than worker absenteeism. These effects are much more modest that is typically portrayed in the press, but are similar to other academic studies. Labour unrest has a more immediate negative effect, increasing absenteeism and quality defect rates and decreasing output. Where protests extent to a second day, we find that production falls by around 10 percent among factories in the affected area. We also compare the magnitude of hartals and labour unrest with the effects of temperature on production.
* Ashraf, Macchiavello and Woodruff: Department of Economics, University of Warwick; Rabbani: Department of Economics, University of Dhaka. We thank the International Growth Centre for both financial and logistical support for the project.
The Effect of Political and Labour Unrest on Productivity: Evidence from Bangladeshi
Garments
Firms in low-income countries often face unstable external environments. Dealing with the
uncertainty, a central task for entrepreneurs in any environment, is particularly challenging in
unstable environments (McMillan and Woodruff 2002). That entrepreneurs can adapt to deal
with uncertainty is evident. The ready-made garment sector in Bangladesh, for example, has
grown by more than 14 per cent per year between 1994 and 2014 in spite of an often-volatile
business environment. But growth has slowed to around 5 per cent in 2015, coincident with
both tragic accidents in the sector and a marked increase in political strife in the country.
Here, we focus on and isolate the role of political conflict on productivity in the sector during
the past two years. The political conflict is most visible through regular hartals, or general
strikes called by political activists. The activists aim to shut down economic activity by
preventing movement of people and goods, blocking roads and sometime destroying vehicles
that venture out.
The popular view is that the hartals and blockades have a significant effect on the economy.
A widely cited 2005 UNDP study suggested that hartals cost the Bangladeshi economy three
to four per cent of GDP during the 1990s. A study by the Dhaka Chamber of Commerce and
Industry (DCCI) put the cost to the Bangladeshi economy of political strikes cost at USD 200
million per day, with $45 million of that coming from the garment sector.† The 22.5 per cent
share of the costs the DCCI allocates to the garment sector is almost double the sector’s share
of the economy. The methods used to obtain these estimates are often unclear. But the UN
study starts by making the assumption is that all output is lost on the day of a hartal, and that
output is not made up on other days. This produces an estimated loss of 4.5 per cent of GDP,
since 4.5 per cent of the days were days of hartals. This initial estimate is reduced to 3-4 per
cent for reasons that are not made entirely clear. ‡
The ready-made garment sector is one of the most important sectors in the Bangladeshi
economy. It accounts for 80 per cent of Bangladesh’s exports and around one-eighth of GDP.
† See http://archive.thedailystar.net/beta2/news/one-shutdown-means-tk-1600cr-losses/. Related estimates are discussed at http://archive.thedailystar.net/beta2/news/economy-reels-from-hartals/ and https://sourcingjournalonline.com/strikes-cost-bangladesh-3-billion-in-15-days/. (Accessed 5 November 2015) ‡ See Sabet and Tazreen for a discussion of this and other commonly-cited estimates of the costs of hartals.

The sector has played a significant role in recent economic growth, which has lifted
Bangladesh out of the group of low-income countries. Understanding the how the sector has
coped with hartals, and whether the costs are as large as many of the estimates, is therefore
important.
In this paper, we use extremely detailed production data from 809 production lines in 33 large
factories to examine the effects of hartals on production and productivity in the garment
sector. The factories are all located in Dhaka and the surrounding area. We have daily
production line-level measures of productivity, absenteeism and quality defects spanning the
period from January 2012 through July 2014. Data collected from local news reports and
other sources indicate there were 96 hartal days in 46 separate hartal events, 19 of which
lasted for more than one day. We also collected data on labour protests, identifying 14
separate worker protests in the readymade garment sector, four of which lasted for more than
one day. The hartals are usually national in scope, but labour unrest is often local, and we
identify the effects on factories in the areas in which the labour actions occurred.
We are not the first to examine the effects of hartals on output in Bangladesh, though our data
allow a different and in some dimensions much more detailed analysis than the existing
studies. The closest paper to ours is Ashan and Iqbal (2014), which uses the transaction-level
trade data between 2005 and 2013 to examine the effects of hartals on garment exports from
Bangladesh. They find that exports fall by about 6 per cent on the day of a hartal, an effect
which is partly offset during the week following the hartal. The effects are concentrated
among smaller firms and are stronger when the hartal extends for more than 12 hours.
We make two contributions relative to the literature measuring the effects of hartals. First,
our factory-level data that allows us to trace measured productivity effects through several
channels. We examine effects of political and labour unrest on absenteeism, on productivity
conditional on the number of workers present, and on supply-chains. Second, we benchmark
the magnitude of the effects of hartals against the effects of another external factor affecting
production, weather.§ We find that the effects of sustained hartals are as large as a rise of
§ Temperature has been shown to have a significant effect on output. For a review of recent literature, see Dell, Jones and Olken (2012). Achyuta, Kala and Nyshadham (2014) use the conversion from fluorescent to LED lighting in a large garment factory in India to show that temperature on the production floor has a large effect on productivity.

about 6 degrees centigrade in average daily temperature. Worker protests have immediate
effects equivalent to around a 7 degree centigrade rise in average temperatures.
This paper also adds to the literature on the effects of shocks on firms performance and
behaviour. For example, Advaryu et al. (2015) study the effects of pollution shocks on
workers’ efficiency in a sample of Indian garment manufacturers; Alcott et al. (2014) study
the impact of electricity shortages; while Hjort (2015) and Ksoll et al. (2010) study the
impact of a short-run spell of political instability in Kenya.
In addition to studies on the impact of specific shocks on firms’ output and behaviour, a long
established tradition points at the negative impact of uncertainty on firms’ investment
decisions (see, e.g., Bloom et al. (2007) and Bloom (2009)). Our analysis does not consider
this additional channel.
The data are consistent with the effects of hartals being entirely driven by transportation and
supply chain effects. Factories adjust fully to shock on the first day of a hartal, with some
evidence that efficiency actually increases the day before and the day of a hartal. However,
the output effects become more strongly negative with the hartals last for several days. RMG
worker protests have more immediate effects on factory output, and these effects carry over
to the days immediately after the protest.
Background
Bangladesh is the third largest exporter of readymade garments in the world, with 4,000 to
5,000 factories employing roughly four million workers. These factories are mostly clustered
in the areas around Dhaka or in Chittagong. Most of the fabric and other inputs used in
production are imported, and among the factories exporting any part of their production,
essentially all of the output is exported. The most important port for imports and exports is
Chittagong. Contracts between factories and buyers usually call for goods to be delivered to
the port in Chittagong by a certain date or, failing that, to be shipped by air at the factory’s
expense to London or some other destination. For the factories in our data, all located around
Dhaka, the availability of transportation links to Chittagong, and particularly the one main
two- and four-lane highway between Dhaka and Chittagong, is crucially important.
Bangladesh’s political instability is viewed as an important hindrance for RMG sector
development and the country’s economic progress at large.** Historically, political strikes or
‘hartals’ in Bangladesh has been one influential form of political protests, which essentially is
a non-cooperation movement against the incumbent government in an attempt to create
pressure regarding specific issues. These strikes are usually called by opposition political
parties through public announcements, at least one day before a strike. The strikes aim to shut
down economic activity and transportation. In theory while the strikes are meant to be a
voluntary act on the part of participants, the opposition party activists try to enforce it through
picketing and by stopping vehicles that defy the strikes. Strikers and law enforcement
agencies often clash during the picketing, and destruction of vehicles operating in defiance of
the strike is also common. In some extreme cases, there have been fatalities. The intensity of
violence was particularly severe in 2013 when there were serious political disagreements on
various issues regarding the then-forthcoming national elections and trials of opposition
political leaders accused of war crimes during the country’s liberation war of 1971. For
example, over the period of January - mid May, 2013 there were about 55 days of political
unrest including 27 national strikes. Media reports suggest that a total of 143 lives were lost,
more than 3,500 people were injured, and more than 1,500 vehicles were destroyed because
of strike violence (Sabet and Tazreen, 2013). During the strikes, many businesses shut down
and the transportation system comes to a near halt, either because the populace supports or
simply fears the consequences of the strike. Public sector offices remain open as an act of
defiance and in recent years private sector offices, and especially factories in various
manufacturing industries, have remained open as well. However, lack of transport on the road
implies that it is harder for the workers and managers to go the offices/factories, to get raw
materials transported in, or even carry out physical movements of other materials or
documents. Given the importance of the port of Chittagong to the RMG sector, the effects of
transport on the supply chain may be a particularly relevant channel. Several analysts have
argued that the strikes create considerable economic loss for the country. Hussain et al (2014)
estimate the loss through forgone production in the 2013-14 fiscal year alone as $ 1.4 billion
(Hussain et al, 2014), with a further $2.2 billion lost in the first three months of 2015
(Hussain, 2015).
** See, for example, Hussain, 2015. A survey of foreign buyers conducted by McKinsey in 2011 revealed that half of them considered “political and economic instability” to a highly important issue. Nevertheless, this is only the fifth most important issue listed by the buyers. (McKinsey 2011, page 10.)

Worker unrest specific to the RMG sector has also become more frequent in recent years. The
reasons for specific actions by workers range from factory-specific issues such as delays in
salary or bonus payments, to industry-wide issues such as minimum wage rates. The lives of
many RMG workers were lost in well-publicized tragedies including the Tazreen Factory fire
on November 24, 2012 and the collapse of Rana Plaza collapse on April 24, 2013. A typical
RMG worker protest in our context involves workers from a RMG factory or factories in a
particular location leaving work and gathering on streets to protest against the factories or the
industry management at large. The workers from the factory initiating the protest might also
ask the workers at neighbouring factories to join. These protests can also become violent,
causing damage to the factories and leading to clashes between protesters and law enforcing
agencies (e.g. The Daily Star, 2012). The effect of these protests is likely to be more severe
for factories whose workers participate in the protests. These factories may shut down
completely for a day or more. But there may be some effect on other nearby factories even
when their workers do not participate. For instance, the conflicts may increase stress and
create distractions for both workers and managers in other factories. These distractions might
affect productivity of the workers and divert the attention of managers away from regular
operation management. For fear that its workers may join the protests, the nearby factories
may shorten work hours or reduce work load on the protest days. Any of these channels may
lead to a fall in productivity in the factories.
Data
We use data from three sources. First, we use detailed production data collected from 33
factories in and around Dhaka. The production data were gathered in the context of two
previous projects in the sector which involved interventions providing supervisory training to
either production line workers or existing supervisors. (See Macchiavello, Menzel and
Woodruff (2014) for a description of the first project.) All of the factories produce woven or
light knit (e.g. t-shirts) products. The factories are not a random sample of factories in the
sector, but are broadly representative of factories working for the middle to higher tier of
foreign buyers. Table 1 provides some summary statistics for the factories, which are all
suppliers of well-known European brands. They are large, with a typical factory having
around 20 production lines and more than 1000 employees. Figure 1 shows the size of the

factories in the project from which most of our data come, relative to the distribution of all of
the factories in the buyer ACCORD.††
For all of the factories in the sample, we have continuous data over at least four months. We
focus our analysis on the sewing section of the factories, home to about two-thirds of the
factory’s workers. For our purposes, the most important measures are absenteeism, line
runtime, quality defects and efficiency. All of these measures are collected directly except for
efficiency, which we calculate according to the industry practices, and which is essentially a
measure of output per worker-hour. Output, however, is measured not in the number of
products but in the number of minutes a fully efficient line would take to sew the output,
calculated in a manner described below.
Second, we collect information on two types of external shocks faced by the producers. The
first set of shocks are the political strikes, or hartals, that are usually called by the political
opposition parties in Bangladesh in protest of certain acts or decisions by the government.
The frequency of hartals increased markedly in the period 2012-14, particularly in the lead-up
to national elections held in January 2014. During the period January, 2012 to May, 2014
there were 96 instances of strikes that directly affected Dhaka. We focus on these strikes
since Dhaka is where all of our sample factories are located.‡‡ The distribution of political
strikes across months is shown on Figure 1. A main tactic of the political strikes is to limit the
movement of people and goods by closing roads, thus causing some damage to the economy.
Urban public transit shuts down during the strikes and those traveling by car risk being
assaulted and having their cars damaged or even burned.§§ Businesses may or may not choose
to shut down. The hartals are also marked by occasional violence between picketers and law
enforcing agencies. We collected data on these strikes from The Daily Star, a widely
circulated national daily newspaper. We also collected information about which political
parties called for the strike and when, and what were the reasons behind the strike.
†† The Accord on Fire and Building Safety in Bangladesh (ACCORD) is one of two agreements among brands that were forged following the Rana Plaza disaster. The program website describes the ACCORD as a “legally binding agreement between brands and trade unions designed to work towards a safe and healthy Bangladeshi Ready-Made Garment Industry.” (http://bangladeshaccord.org/ - accessed 3 November 2015) ‡‡ There was additional hartal was localized to Chittagong, which we do not record as affecting the plants in our data. Chittagong is the main port through which inputs and output flow, and results are of course robust to classifying this day as a hartal day. §§ The preferred mode of transport for foreign aid workers during hartals is an ambulance, hired in place of cars.

A review of the reasons the political parties cite for calling strikes indicates that they are
largely associated with strictly political conflicts at national level, rather than with any
particular economic policy or anything that is directly linked to the garments industry. In
particular, the cause of most of the strikes called by the major political parties in 2013 was
either disagreement about how the national election of 2014 was to be conducted, or
grievances over outcomes of legal cases filed against opposition leaders charged with war
crimes during the 1971 war for independence. The cause of the strikes is unrelated to
production, but they may affect production either by making it difficult for workers to reach
factories or by limiting the transportation of goods – inputs coming to the factory and
production going out. We posit that the first effect should be immediate, and the second more
severe when the hartals last for several consecutive days. Because hartals are sometimes
announced several days in advance, factories may anticipate these problems and plan ahead
to work around them. We leave it to the data to tell us how effectively they are able to
address the challenges caused by the political strikes.
The second set of shocks we consider is more closely associated with the RMG industry in
Bangladesh. As with the hartals, we collected data from The Daily Star accounts of RMG
worker protests, including the specific geographic areas involved in the protests. A typical
protest starts at a single factory, with workers refusing to work and taking to the streets.
These protests may involve all of the workers or only a fraction at a particular factory, but
they are often joined by workers of neighbouring factories in the area. Figure 2 shows the
distribution of the worker protests across time in eight different areas covered by our data.
The duration of the protests can range from one to more than one day, and conditional on
successful negotiations, the workers return to the factories. Larger and more geographically
spread protests have followed more serious incidents of factory fires and factory building
collapse, including the Tazreen fire and the Rana Plaza collapse. Protests following these
events also often last for a much longer period.
Finally, in an effort to benchmark the effects of the strikes against other shocks, we collect
Bangladesh Meteorological Department data on temperature, humidity and rainfall from the
Dhaka weather station. These data come at three-hour intervals, and we use simple averages
of the temperature and humidity over either the 24 hour period or the period from 6 AM to 6
PM on the production day.

Relationships of interest: We match the data on political strikes and RMG worker protests to
daily production data from the 33 factories in the greater Dhaka region. Production in the
woven and light-knit sector is organized in production lines. The length of the line varies with
the type of product being produced, with as few as 15 sewing machine operators (e.g. a line
producing tank tops) or as many as 80 (e.g., a line producing pants). Each operator performs a
specific task – e.g., sewing the side seam or the bottom hem. Production is sequential. Cut
fabric enters at the start of the line and the completed product exits at the end of the line.
Absenteeism can therefore be costly to efficiency, and requires movement of workers across
or within lines to fill in gaps left by those who are absent.
Each factory records data in its own way, and often the templates for recording data change
across time within the same factory. The level of detail also varies across factories. We have
harmonized the data so that they are comparable across factories, at least in terms of
definitions. We are interested in several outcomes. First, we will examine whether strikes
change the number of worker-hours in the factories. Worker-hours may change either
because the number of workers showing up changes or because the start / end times are
adjusted. We examine factory-level absenteeism rates and whether factories are more likely
to shut production lines on days of political strikes or worker unrest. We also examine
whether factories adjust to absenteeism, or expected absenteeism, by increasing the length of
the work day. For most factories, we have line-level data on the number of hours the line
operates.
Next, we examine whether the strikes affect the efficiency with which lines operate and / or
the quality of the output. By focusing on sewing, we are able to capture a measure of output
which is very close to a pure quantity measure, at least within a given factory. Industrial
engineers are trained to estimate the number of minutes a fully-efficient worker would take to
produce a given garment. They do this by considering each step of the sewing process and
summing the time required for each. The times come from a combination of international
databases and in-factory time-and-motion studies. The result is a ‘standard minute values’ –
SMVs (or standard allowable minutes – SAMs). Multiplying the SMV by the number of units
produced yields a measure of minutes of sewing output which is highly comparable across
products. For example, if a line producing 1000 shirts with an SMV of 15 minutes has
production of 15,000 output minutes, while a line producing 2000 tank tops with an SMV of
6 minutes has production of 12,000 output minutes. Efficiency is then measured as the ratio

of the output minutes and the amount of labour time – the sum of minutes worked by
operators and helpers on the line over the same time period*** – used to produce the output.
The result, the industry standard measure of efficiency, is essentially an output-labour ratio:
Efficiency = !"#$"# ∗ !"#[(# !"#$%&'$( ! # !"#$"%&) ∗ !"#$%&' !" !"#$%&']
(1)
While in theory the SMV measure makes output comparable across factories, in practice,
factories use different standards to assign the allowable time for each process. Some factories
stay quite closely to the international standards, allowing any local circumstances to be
absorbed into the measured efficiency, while others take the local circumstances into account
in setting the SMV measure. However, careful analysis of the data leaves us confident that
the measures are consistent within factories. All of our regressions will include either factory
or line fixed effects to absorb any differences in the standards applied in measuring SMVs.†††
Figure 3 shows the distribution of efficiency, line runtimes, and absenteeism for our sample
of factories.
Quality defect rates are also of interest. Factories typically report both the number or
percentage of garments that require some re-work and the number or percentage that must be
rejected. Reject rates are typically very low, averaging 0.6 per cent in our sample. Rework
rates are much higher, averaging around 8 per cent (with a median of almost 6 per cent).
Because the re-work time is included in the measure of “input minutes”, the efficiency
measure incorporates differences in quality.
Finally, we examine supply chain issues with a measure of the inputs fed into the line on a
give day. The input measure is the number of sets of cut fabric pieces entering the line. This
should be affected on the day of the strike only if the cutters are absent on that day. But
where strikes last for longer periods, the delivery of fabric and other inputs may be affected.
Results
*** We could improve this measure by a step if we had the wage bill for the line. However, the industry typically uses three grades for operators, and we most often know only the total number of operators, not the number by grade. ††† We are currently working to make the data comparable across factories by comparing SMVs across factories at the process level for the same or very similar products. But calibrated data are not crucial for this analysis.

We begin by examining the contemporaneous effect of shocks on various outcome variables,
estimating the following equation.
𝑦!"# = 𝛼 + 𝛽!𝐻! + 𝛽!𝑅!" + 𝑿𝒊𝒕! 𝛅 + 𝛼! + 𝛾! + ε!"# [1]
𝑦!"# is the outcome of interest 𝑦 for line 𝑖 in factory 𝑓 on day 𝑡. 𝐻! is a dummy variable that
takes the value 1 if day 𝑡 was a strike day. Similarly, 𝑅!" is another dummy variable that
takes the value 1 if there was a RMG protest in the neighbourhood of factory 𝑓 on day 𝑡. 𝑿𝒊𝒕!
is a set of time varying controls for line 𝑖, 𝛼! is line fixed effect, and 𝛾! is the year-month
fixed effect.
Table 2 shows the effects of political strikes and protests on various measures of labour
inputs. Column 1 shows that political strikes, perhaps surprisingly, have a positive effect on
attendance, reducing the absenteeism rate by just over 1 percentage point, against a sample
mean of just over 8 per cent. However, absenteeism is measured at the line level, and is
conditional on the line operating. Factories may adjust to worker absenteeism by moving
workers from one line to another. This is required to prevent bottlenecks on lines, given the
sequential nature of the production. If enough workers are absent, a factory may choose to
close one production line and use the workers present from that line to fill in the gaps on
other lines. In column 2, we therefore examine whether hartals result in the closing of lines.
Indeed, we find that political strikes are associated with a 0.9 per cent increase in the
likelihood a line is closed. Together, then, the data on absenteeism per line and line closures
suggest that the hartals have almost no effect on worker attendance. This likely reflects the
fact that workers tend to live quite close to the factories, and may not rely on busses or other
transportation to travel to the factory.
Factories may also adjust the length of the work day, and column 3 shows they do so.
However, the average time a line operates increases by only about 4 minutes (0.06 of an
hour) on days with political strikes. The net effect of changes in absenteeism and runtime is
an increase in the number of worker-hours on lines that operate (Column 4), which is offset
by the reduction in the probability a line operates.
While the political strikes appear to have no effect on labour input, RMG worker protests
have a clearer negative effect. Both absenteeism and line closures increase when there are
protests, with absenteeism increasing by 0.4 per cent and the probability a line is closed

increasing by 1.7 per cent. The line runtime also decreases, by just over 25 minutes (0.43
hours). The net effect is a decrease of almost 28 hours of labour input per line, about 7 per
cent of the sample mean of 406 work hours per line-day.
Do the disruptions decrease efficiency, either through the disruption to labour or other
channels? Columns 5 and 6 on Table 2 show the effects of political strikes and worker
protests on efficiency and defect rates. The first takeaway from the table is that political
strikes have little or no effect on efficiency and defect rates. RMG worker protest, on the
other hand, have a significant effect on output efficiency, reducing the output per worker by
1.68 percentage points, almost 3.5% of the sample mean. There is no significant effect on
defect rates.
In sum, there are no contemporaneous effects of political strikes on worker absenteeism or
productivity. In contrast, RMG worker protests in the immediate neighbourhood of the
factory increase absenteeism, shorten the workday and decrease output per worker-hour. As
we have noted, the tactic of political strikes is to shut down transportation. The lack of a
contemporaneous effect likely stems from the fact that workers tend to live close to the
factories. Apparently a strike of a single day does not disrupt transportation enough to affect
productivity at the factories. The hartals often extend for more than one day, however. We
next turn to assessing the possibility that the longer hartals have cumulative effects which are
more significant.
To understand cumulative effect of shocks, we estimate the following equation:
𝑦!"# = 𝛼! + 𝛽!!𝐻!!! + 𝛽!!𝑅!"!! + 𝑿𝒊𝒕! 𝛅 + 𝛾! + ε!"# [2]
where 𝐻!! is a dummy variable that takes the value 1 if day 𝑡 was a strike day for 𝑘 -th time in
a row, and 𝑘 ∈ {1, 2, 3, 4, 5 𝑎𝑛𝑑 𝑎𝑏𝑜𝑣𝑒}. Similarly, 𝑅!! is a dummy variable that takes the
value 1 if day 𝑡 was a RMG Protest day for 𝑟 -th time in a row and 𝑟 ∈ {1, 2 𝑎𝑛𝑑 𝑎𝑏𝑜𝑣𝑒}.
The other variables are the same as Equation 1. There are only few RMG protests lasting
more than one day, which is why we limit the categories for persistent protest effects to all
events lasting more than a single day. On the other hand, incidences of consecutive hartals
are more common, allowing us to examine effects of continuous strikes in a more nuanced
manner. We consider anticipation effects, since many hartals are announced in advance,
below.

The results are presented on Table 3. Note that the variables are defined such that the variable
for “1st day of strike” is zero on the second consecutive hartal day, when the “second day of
strike” variable is set to 1. This means that the coefficients for multiple hartal days are
independent rather than additive. Looking first at labour input, we now see a clear positive
effect on labour hours the first day of a hartal. Absenteeism conditional on the line operating
falls by 0.9 percentage points (column 1), the probability a line is closed falls by 2.5
percentage points (column 2) and runtime increases by about 4 minutes. Worker hours
increases even conditional on a line operating; the actual effect is larger because the number
of lines operating also increases.
However, consecutive hartals result in a reversal of this pattern. Beginning on the second
consecutive day, lines are around 4 percentage points more likely to be closed; runtime flips
from positive to negative –though still fairly modest in magnitude – on the 4th consecutive
day, and total labour hours conditional on a line operating also flips on the 4th consecutive
day. Absenteeism remains lower than the periods unaffected by hartals for all of the periods.
The pattern reversals evident with consecutive hartals in the labour input data also appear in
the efficiency results. There are very small, statistically insignificant but precisely measured,
effects of hartals on efficiency for when the duration is three days or less (column 5 of Table
3). But the efficiency effect becomes negative when the duration extends to four days, and
significantly negative for durations beyond four days. Column 6 shows that there is no effect
on defect rates, regardless of the length of the political strike.
The duration effects are much less stark for the worker protests. The effect on labour input is
slightly lower on the second or higher day after the start of a protest, with the probability a
line is closed showing the largest effect. But the effect of total labour input (total worker-
hours per line) is always negative, and the efficiency effect is very similar as well. Defect
rates increase slightly, but significantly, the first day of a protest, but return to normal levels
the second day.
These results suggest that factories see little impact from a hartal lasting a single day, but
begin to suffer more negative effects during hartals lasting more than a few days. Disruption
of the supply chain is one possible channel for the negative effects. Road closures over a
series of days may begin to disrupt both the ability to receive inputs and the ability to ship
output. Unfortunately, we do not have data on shipments into and out of the factory. But we

do know the input fed into each line on each days. These inputs are measured as the number
of sets of inputs required to produce one complete garment. Under normal condition, inputs
will begin to enter the line a day or so before the line begins producing the style, and will
flow at a steady rate more or less matching the level of daily output. Disruptions in the supply
chain will reduce the flow of inputs into the line.
The last column of Table 3 shows how the quantity of inputs at the line level is affected by
political strikes and worker protests. We see that there is no effect for hartals with a duration
of less than 2 days, but the inputs begin to drop on the third consecutive day of political
strikes. The effect becomes larger for hartals of longer duration. This pattern is consistent
both with supply disruption from road blockades and with the pattern we saw in the length of
the work day and line efficiency, both of which turn negative after four consecutive days of
hartals. In contrast, the effect of the RMG worker protests on inputs is immediate. Inputs fall
on the first day and remain lower for protests of longer duration. We posit that the likely
cause of this is absenteeism in the cutting section rather than supply chain disruptions.
Anticipation and recovery effects: Since many political strikes are announced in advance,
factories may adjust production before the strikes in anticipation of disruptions during the
strikes. Although we have seen that production is not affected by political strikes of a single
day, it is not always clear in advance whether the strikes will extend beyond a day or not.
After the strikes are over, we might also ask whether production is affected during a
readjustment phase. To examine these effects, we run regressions with the follow
specification:
𝑦!"# = 𝛼! + 𝛽!𝐻! + 𝛽!!𝐻!!! + 𝛽!!(𝐻!! ∗ 𝐻!)! + 𝛽!𝑅!" + 𝛽!!𝑅!"!! + 𝛽!!(𝑅!"! ∗ 𝑅!)! +
𝑿𝒊𝒕! 𝛅 + 𝛾! + ε!"# [3]
where 𝑚 ∈ {−3 𝑎𝑛𝑑 𝑒𝑎𝑟𝑙𝑖𝑒𝑟,−2,−1,+1,+2,+3,+4 𝑎𝑛𝑑 𝑎𝑓𝑡𝑒𝑟} indicates that day 𝑡 is 𝑚
days before (negative signs) or after (positive signs) a political strike. The pre-strike indicator
variable takes the value 1 only if the strike is announced by that date. Since RMG worker
protests are not announced in advance, there are no anticipation effects for the protests.
However, we do test for recovery effects after protests. Because the day after a political strike
may also be a strike day, we also interact the pre- and post-strike dummies with a dummy
indicating that the day itself is a strike day. Hence, if March 1st is a strike day and March 2nd
is not – and no further strikes are anticipated at the point – then the recovery effect will be

measured by the coefficient 𝛽! alone. If March 2nd is also a strike day, then the dummy
variable associated with 𝛽! and day t+1 will also turn on, and the effect will be the sum of
𝛽! and 𝛽! for day t+1.
The results are presented on Table 4. It is easiest to think of the effects of an isolated hartal
which is anticipated at least three days in advance. We see that absenteeism falls before the
hartal, significantly so one and three days before. Absenteeism continues to be reduced on the
strike day and the day after, but then increases to higher than normal levels from the 4th
through the 7th day after the strike. Line closures (column 2) accentuate the absenteeism
effect the day before and two days following the strike, when the probability a line is closed
is significantly reduced, and in the period 4-7 days after the strike, when the probability of a
line closing increases along with absenteeism. Factories run production lines slightly longer
the two days before and the day of the strike, and then shorter the two days after the strike.
Combined, the results in the first three columns indicate that labour inputs the day before and
the day of the strike, and return to normal levels or fall just below two to seven days after the
strike. Efficiency (column 4) follows a roughly similar pattern, increasing the day before the
strike and remaining abnormally high through the day after the strike, but then dropping
below normal levels two and three days after the strike.
Summing the coefficients across the 11-day period suggests that neither labour inputs nor
efficiency are affected by an isolated political strike lasting a single day. The probability a
line is closed increases by about 1 percentage point over the 11 days, offset by a roughly 0.7
percentage point increase in the time a line is run conditional on operating. There are daily
effects on absenteeism and efficiency, but the net effect is nearly zero, suggesting that the
hartal shifts production across days, but does not alter the net output.‡‡‡ In contrast, there is
evidence that worker protests have more enduring effects on productivity, with efficiency
falling by slightly more than a percentage point for several days after the protest
Benchmarking the effects: The effects of worker protests on output is substantial, but political
strikes have almost no effect on output unless they continue for several consecutive days. But
how substantial are these effects? One way to benchmark them is to compare the magnitudes
‡‡‡ For efficiency, over the five-day period from one day before through three days after the strike, where the effects are statistically significant, the net effect is +0.82 percentage points, or +0.16 percentage points per day.
against changes in output caused by other factors outside the firm. Adhvaryu et al (2014) find
that temperature has a substantial effect on productivity, measured as the output-to-target
ratio, in a large Indian garment manufacturer. We measure the effect of temperature and
humidity on efficiency to provide a benchmark for the magnitude of the political and labour
disruptions. The weather analysis also serves to check the voracity of the production data as a
whole by providing a comparison with results from outside Bangladesh.
The Dhaka Meteorological Station measures temperature and humidity at three-hour
intervals. Our output data have a daily frequency. We average the five temperature and
humidity readings between 6 AM and 6PM on each date. The distribution of these average
readings are shown on Figure 5. We see that most of the temperatures fall between of 18 and
33 degrees centigrade and most of the humidity between 35 and 90 per cent. Column 1 of
Table 5 shows that both temperature and humidity have highly significant effects on
productive efficiency. An increase in temperature of one degree decreases productive
efficiency by 0.21 percentage points, not quite half a per cent of the mean efficiency level.
We note that this is very close to the magnitude of the effect Adhvaryu et al. find (0.23) in a
linear specification in their Indian factories. Humidity has a somewhat smaller effect,
decreasing efficiency by 0.04 percentage points for each percentage point increase in
humidity.§§§
We might expect temperature to have highly non-linear effects, with an increase in one
degree having a larger effect in the upper range than the lower range. However, Figure 5
shows this is not the case. The figure graphs coefficients from a regression using dummies for
each degree, allowing us to trace out the effects by degree. The effect is surprisingly linear,
with a notably larger drop only at the very top of the distribution, where the number of
observations is small. Note that in this regard, our results differ from Adhvaryu et al, as they
find a much large effect as temperatures rise from around 20 to 24 degrees, and again from 30
to 34. The second and third columns of Table 5 add additional controls, which have only a
very small effect on the temperature measures.
The results on Table 3 indicated that continuous hartals reduce productive efficiency by just
under 1.4 percentage points five to eight days in. Worker protests reduce efficiency by 1.5 to
§§§ The standard deviation of humidity (14.3) is more than three times that of temperature (4.4), so the effect of a standard deviation change in temperature is almost double the effect of a standard deviation change in humidity.

2.1 percentage points. The hartal effects are equivalent to an increase in temperature of about
7 degrees centigrade, and the protest effects equivalent to 7 to 10 degrees centigrade.
Conclusions
Political strikes have been increasingly common in Bangladesh in recent years. There is
considerable interest in and considerable differences in opinion about the effects of the strikes
on economic activity. The ready-made garment sector is an excellent place to examine these
effects, as the sector accounts for roughly one-eighth of the country’s GDP. Using very
detailed production data from 33 large factories, we find that factories adjust production fully
in the face of a single isolate hartal. Production increases the day before and the day of the
hartal, and then falls back in the two days after the hartal. But there is no net change in
output. However, both extended hartals and worker protests have more substantial negative
effects. Perhaps surprisingly, even extended hartals have little effect on worker absenteeism.
But we begin to see significant effects on inputs delivered to production lines after three days
of strikes, and significant negative effects on efficiency after five days of hartals. The
efficiency effects of longer-term hartals are similar to the effect of an increase in temperature
of 7 degrees centigrade.
Worker protests have larger and more immediate effects, and higher costs to the affected
factories. A protest in the neighbourhood of a factory reduces both the total number of labour
hours and the output per labour hour even during protests of a single day. Moreover, the data
suggest that the protests have lingering effects. There is no reallocation of the work across
days around the period of the strikes.
We are not aware of other estimates of the effect of RMG worker protests on productivity in
the sector. But our results on political strikes, and particularly those for an isolated hartal,
contrast with the estimates of more substantial costs from several sources. Methodologically,
our approach is closest to work by Ahsan and Iqbal (2014), and our results appear to be
similar to theirs. They find modest effects of hartals on large firms, though their analysis does
not differentiate between one-off and sustained hartals. Combining these two types of events,
our data also suggest modest effects on our set of large RMG factories.
Volatility in the external environment is a reality that firms in most low-income countries
face. The data here suggest that firms have adapted to deal with these disruptions quite well.

However, there is at least one characteristic of the setting which appears to be important. The
fact that workers tend to live fairly close to the factories where they work may explain the
lack of an effect on absenteeism and production on the day of the hartal. The effects of
transportation operate through supply chains rather than labour, and show up only after
several days of continuous strike activities.
The analysis suggests that the direct costs of hartals are negligible for all but hartlas spanning
many consecutive days. But there may be other channels not addressed by our data through
which hartals affect production in the RMG sector. For example, we are not able to say
anything about costs to factories from delayed shipments out. Contracts with buyers typically
call for buyers to pay shipment costs from the port of Chittagong, but sellers are liable for the
much more expensive air freight charges when goods are not delivered to the port on time.
Hence, transportation delays that we find affecting inputs may also result in substantial costs
to factories due to delayed shipments out.**** Finally, the hartals may have more substantial
effects in other sectors of the economy, for example the retail sector, and on smaller
businesses.
But, the data do suggest that the estimates of the effect of hartals which rely on the
assumption of an across the board proportional decrease in output across all sectors are likely
to overstate the costs of hartals. Many firms and sectors are able to move production across
time more easily than others, significantly attenuating the effects of hartals on output.
**** An April 2013 BGMEA report stated that 15 factories surveyed incurred additional air freight costs of $1.71 million as a result of hartals. (Dhaka Mirror: http://www.dhakamirror.com/business/15-rmg-units-incur-3-31m-loss-for-political-turmoil/ . Accessed 4 November 2015.)
References
Adhvaryu, Achyuta, Namrata Kala and Anant Nyshadham, 2014, “The Light and the Heat: Productivity Co-benefits of Energy-saving Technology,” working paper, PEDL.
Ahsan, Reshad N and Kazi Iqbal, 2014, “Political Strikes and Impacts of Trade: Evidence from Bangladeshi Transaction-level Export Data,” International Growth Centre Working paper, October 2014.
Adhvaryu, A., Kala, N., and Nyshadham, A. (2015). Management and Shocks to Worker Productivity: Evidence from Air Pollution Exposure in an Indian Garment Factory. working paper
Allcott, H., Collard-Wexler, A., and O’Connell, S. D. (2014). How do electricity shortages affect productivity? evidence from india. Technical report, National Bureau of Economic Research.
Ayres, Alyssa, 2015, “IMF Worried About Bangladesh’s Growth,” Forbes Magazine, March 11, 2015. (http://www.forbes.com/sites/alyssaayres/2015/03/11/imf-worried-about-bangladeshs-growth/ . Accessed 31 July 2015)
Bloom, Nick, Stephen Bond, and John Van Reenen, 2007. "Uncertainty and investment dynamics." The Review of Economic Studies Vol. 74(2), pp. 391-415.
Bloom, Nicholas. "The impact of uncertainty shocks", 2009. Econometrica, Vol 77(3), pp. 623-685.
Dell, Melissa, Benjamin F. Jones and Benjamin A. Olken, 2014. “What do we Learn from Weather? The New Climate-Economy Literature,” Journal of Economic Literature, Vol 52(3), pp. 740-798.
Hjort, J. (2013). Ethnic divisions and production in firms. Technical report, CESifo Working Paper
Hussain, Zahid, 2015, “Bangladesh development update (April 2015)” Washington DC, World Bank Group.
Hussain, Zahid, Nadeem Rizwan and Adiba Sanjana, 2014, “Bangladesh development update”. Washington DC, World Bank Group.
Ksoll, C., Macchiavello R., and Morjaria A. (2010). “Guns and Roses: The Impact of the Kenyan Post-Election Violence on Flower Exporting Firms”, working paper, Univiersity of Warwick.
Macchiavello, Rocco, Andreas Menzel and Christopher Woodruff, 2014, “Managerial Capital and Productivity: Evidence from a Training Program in the Bangladeshi Garment Sector”, International Growth Centre Working paper.
McMillan, John and Christopher Woodruff, 2002. “The Central Role of Entrepreneurs in Development”, Journal of Economic Perspectives, Vol 16(3), pp. 153-70.

Sabet, Daniel M. and Afsana Tazreen, 2013, “The Cost of Political Instability” CES Current Events Analysis Series, May 2013
Shonchoy, Abu and Kenmei Tsubota, 2014, “Economic Impact of Political Protests (Strikes) on Firms: Evidence from Bangladesh, working paper, JETRO.

Table 1: Key Descriptive Statistics for Production Data Variable n Mean Std. Dev. Min Max Total Number of Sample Factories 33
- Sample: Efficiency 28
- Sample: Absenteeism 22
# of Lines in Factory in a day 12037 22.42 15.75 1 88 SAMPLE: Efficiency
Standard Minute Value (SMV) 157,258 13.46 9.78 0 712
Runtime (Hrs) 170,008 10.44 2.71 0 24
Efficiency (%) 159,849 0.51 0.21 0 1.6
SAMPLE: Absenteeism
Standard Minute Value (SMV) 106,841 14.90 12.26 0 712
Runtime (Hrs) 121,502 10.12 2.35 0 24
Absenteeism (%) 117,871 0.08 0.11 0 1
Efficiency (%) 105,707 0.54 0.29 0 1.6
Note: Sample Period = Jan 2012 – July 2014; Total Factory-Days = 12,037; Total Line-Days = 269,833. The total number of 33 factories were classified into broadly two sub-samples called ‘Efficiency’ and ‘Absenteeism’, based on the adequacy of relevant data useful for various analysis on efficiency and absenteeism, respectively. Some factories are included in both the sub-samples. In some of the tables reported in this paper, we sometimes also refer to a sub-sample called “Phase 2”, which were basically 20 factories from Phase 2 of the larger project. But all of these factories are contained within ‘Efficiency’ and ‘Absenteeism’ sub-samples.

Table 2: Impact of Shocks (1) (2) (3) (4) (5) (6) VARIABLES Absenteeism Pr(Line
Closure) Runtime Av. Hrs. Efficiency Alter Rate
Political Strike -0.0103*** 0.00827*** 0.0581*** 6.764*** 0.00113 -9.04e-05 (0.00105) (0.00189) (0.0146) (1.006) (0.00154) (0.000456) RMG Protest 0.00384** 0.0169*** -0.431*** -27.62*** -0.0168*** 0.00211 (0.00164) (0.00319) (0.0380) (2.223) (0.00310) (0.00154) Above Median SMV 0.00308* 0.341*** 70.48*** -0.0158*** 0.0122*** (0.00170) (0.0392) (4.045) (0.00412) (0.00161) Factory Weekend 0.00370 0.283*** -2.362*** -102.5*** -0.0165*** 0.00222** (0.00246) (0.00164) (0.0811) (4.732) (0.00224) (0.000958) Constant 0.105*** 10.65*** 454.8*** 0.454*** 0.0634*** (0.00559) (0.0761) (9.514) (0.0133) (0.00528) Observations 87,477 184,928 150,969 150,530 148,298 84,326 Line FE YES YES YES YES YES YES Year-Month FE YES YES YES YES YES YES SE Cluster LINE LINE LINE LINE LINE LINE Clusters 368 445 623 665 665 412 Sample Absenteeism Phase 2 Efficiency Efficiency Efficiency Quality Adj. R Sq. 0.214 0.526 0.792 0.196 0.563 Note: All but Column 2 in the above table are OLS regressions with lines that are open in a given day. Columns 1 shows the effect of shocks on ‘Absenteeism’, that is the share of workers absent for a given line in a given day. Column 2 reports marginal effects from corresponding Logit regression on the probability of a line being open during a Strike day, RMG Protest day or during the Factory’s regular weekend day. Column 3 checks how the effect on ‘Runtime’, i.e. the total number of hours a line operated in a given day. Columns 4 reports results for ‘Available Hours’ which is the total number of worker-hours used by a line-day. Column 5 reports regression for Efficiency (Total Input Minutes/SMV*Output), while Table 6 does it for Alter Rate, which is the share of total production from a line-day that had to be altered. This uses only the factories for which we had adequate quality data. Column 1 uses factories for which we have adequate absenteeism data. Column 2 uses factories only from Phase 2, while Columns 3-5 use all factories used in Efficiency sample. Strike day, RMG Protest and Factory Weekend are all binary variables which takes the value 1 for a given day if that day was a Strike day, RMG Protest day or an otherwise regular Factory Weekend, respectively. ‘Above Median SMV’ is a binary variable that takes the value 1 if the garment that a given line of a given factory works on a given day has a SMV that is above the median SMV within the factory over the whole sample period. All standard errors are clustered at line level; the number of clusters (lines) are reported under ‘Clusters’. *** p<0.01, ** p<0.05, * p<0.1

Table 3: Cumulative Effect of Shocks on Production
(1) (2) (3) (4) (5) (6) (7) Absenteeism Prob(Line Runtime Av. Hrs. Efficiency Alter Rate Input VARIABLES Closure) 1st day of Strike -0.00871*** -0.0248*** 0.0624*** 6.122*** 0.00204 -5.17e-05 -16.92 (0.00107) (0.00229) (0.0150) (1.057) (0.00154) (0.000564) (14.57) 2nd day of Strike -0.0107*** 0.0456*** 0.146*** 13.75*** 0.00374 -0.000752 4.882 (0.00116) (0.00265) (0.0221) (1.393) (0.00241) (0.000801) (19.45) 3rd day of Strike -0.0129*** 0.0338*** 0.0661** 6.558*** 0.00155 0.000919 -41.41** (0.00105) (0.00277) (0.0279) (1.794) (0.00299) (0.000917) (19.72) 4th day of Strike -0.0193*** 0.0100 -0.187*** -4.227* -0.00676 -0.000241 -64.63** (0.00181) (0.00625) (0.0405) (2.365) (0.00442) (0.000954) (30.99) 5/6/7/8th days of Strike -0.00378** -0.0308*** -0.126** -2.671 -0.0138* -0.000215 -140.5*** (0.00174) (0.00893) (0.0630) (4.733) (0.00727) (0.00109) (35.53) 1st day of RMG Protest 0.00394** -0.00622* -0.442*** -24.43*** -0.0150*** 0.00329** -211.8*** (0.00189) (0.00376) (0.0421) (2.263) (0.00334) (0.00150) (25.77) 2/3/4th day of RMG Protest 0.00360 0.0644*** -0.410*** -34.64*** -0.0209*** -0.00278 -130.3*** (0.00249) (0.00432) (0.0670) (4.278) (0.00529) (0.00266) (39.01) Above Median SMV 0.00308* 0.341*** 70.49*** -0.0158*** 0.0122*** -307.5*** (0.00170) (0.0392) (4.045) (0.00413) (0.00161) (25.46) Factory Weekend 0.00365 0.282*** -2.363*** -102.6*** -0.0167*** 0.00222** -233.8*** (0.00246) (0.00161) (0.0811) (4.727) (0.00224) (0.000962) (23.59) Constant 0.105*** 10.65*** 454.8*** 0.454*** 0.0634*** 1,535*** (0.00559) (0.0761) (9.512) (0.0133) (0.00528) (79.60) Observations 87,477 184,928 150,969 150,530 148,298 84,326 39,878 Line FE YES YES YES YES YES YES YES Year-Month FE YES YES YES YES YES YES YES Clusters 368 445 623 623 623 412 159 Sample Absenteeism Phase 2 Efficiency Efficiency Efficiency Quality Efficiency SE Cluster LINE LINE LINE LINE LINE LINE LINE Adj. R Sq. 0.214 0.526 0.792 0.196 0.563 0.293 Note: All but Column 2 are OLS regressions conditional on a line being open; Column 2 reports marginal effects from corresponding Logit regression on the probability of a line being open during n-th Strike day, or n-th RMG Protest day or during the Factory’s regular weekend day. “n-th Strike/RMG Protest in a Row” indicates there were n-1 strikes/RMG unrests in the immediate previous days. All of these variables are binary. In addition, ‘Above Median SMV’ is a binary variable that takes the value 1 if the garment that a given line of a given factory works on a given day has a SMV that is above the median SMV within the factory over the whole sample period. All standard errors are clustered at line level; the number of clusters (lines) are reported under ‘Clusters’. *** p<0.01, ** p<0.05, * p<0.1

Table 4: Breaking Down Cumulative Effect of Shocks on Production
(1) (2) (3) (4) VARIABLES Absenteeism Prob(Line Cls.) Runtime Efficiency 3+ Days Before a Strike Day -0.0110*** 0.0242*** -0.110*** -0.00304 (0.00131) (0.00250) (0.0266) (0.00320) 2nd Days Before a Strike Day 0.000228 0.0896*** 0.0837*** -0.00330 (0.00122) (0.00267) (0.0248) (0.00303) 1st Day Before a Strike Day -0.00675*** -0.0274*** 0.193*** 0.00961*** (0.000981) (0.00366) (0.0237) (0.00204) Strike Day -0.0135*** 0.00546 0.174*** 0.00502** (0.00180) (0.00347) (0.0218) (0.00248) 1st Day After a Strike Day -0.00568*** -0.0169*** -0.0667*** 0.00353* (0.000892) (0.00221) (0.0189) (0.00185) 2nd Day After a Strike Day 0.00497*** -0.0241*** -0.200*** -0.00534*** (0.00120) (0.00228) (0.0237) (0.00157) 3rd Day After a Strike Day -0.00165 0.0194*** 0.0172 -0.00476*** (0.00109) (0.00206) (0.0208) (0.00173) 4/5/6/7th Day After a Strike Day 0.0113*** 0.0145*** 0.142*** -0.000755 (0.00107) (0.00163) (0.0196) (0.00178) (Strike Day) * (3+ Days Before a Strike Day) 0.0192*** -0.0850*** 0.226*** 0.00419 (0.00171) (0.00630) (0.0422) (0.00460) (Strike Day) * (2nd Days Before a Strike Day) -0.00109 -0.0152*** -0.0155 0.00489 (0.00171) (0.00489) (0.0475) (0.00450) (Strike Day) * (1st Day Before a Strike Day) 0.00477*** 0.0559*** -0.451*** -0.0203*** (0.00149) (0.00490) (0.0370) (0.00363) (Strike Day) * (1st Day After a Strike Day) 0.00321*** 0.0922*** 0.0855*** -0.00569** (0.00120) (0.00389) (0.0277) (0.00284) (Strike Day) * (2nd Day After a Strike Day) -0.0106*** 0.0422*** 0.0347 -0.000613 (0.00172) (0.00429) (0.0332) (0.00260) (Strike Day) * (3rd Day After a Strike Day) 0.00100 -0.0840*** -0.0573* 0.00431 (0.00133) (0.00644) (0.0337) (0.00306) (Strike Day) * (4/5/6/7th Day After a Strike Day) 0.00881*** -0.0823*** -0.0642** 0.00104 (0.00164) (0.00405) (0.0266) (0.00316) RMG Protest Day 0.00391** -0.00880** -0.484*** -0.0169*** (0.00194) (0.00377) (0.0444) (0.00364) 1/2/3rd Day After a RMG Protest Day -0.00207 0.0137*** -0.132*** -0.0111*** (0.00173) (0.00406) (0.0313) (0.00304) (RMG Protest Day)*(1/2/3rd Day After a RMG Protest Day) 0.00528 0.0607*** 0.248*** 0.00808 (0.00326) (0.00657) (0.0753) (0.00615) Constant 0.103*** 10.64*** 0.454*** (0.00560) (0.0763) (0.0133) Observations 87,477 184,928 150,969 148,298 Clusters 368 445 623 623 Sample Absenteeism Phase 2 Efficiency Efficiency Adj. R Sq. 0.219 0.527 0.196 Note: All Specifications include (a) SMV & Factory Weekend Covariates (b) Line FE (c) Year-Month FE. Days before a strike are days only after the corresponding strike was announced – i.e. when the upcoming strike was anticipated. All standard errors are clustered at Line Level. Factories used for all the specifications are from ‘Efficiency’ Sample. *** p<0.01, ** p<0.05, * p<0.1

Table 5: Effect of Temperature & Humidity on Efficiency (1) (2) (3) VARIABLES Efficiency Efficiency Efficiency Avg. Temperature (6am-6pm) -0.00212*** -0.00204*** -0.00205*** (0.000370) (0.000379) (0.000454) Avg. Humidity (6am-6pm) -0.000466*** -0.000413*** -0.000492*** (6.80e-05) (6.88e-05) (0.000103) Above Median SMV -0.0158*** -0.0278 (0.00412) (0.0241) Factory Weekend -0.0164*** -0.0164*** (0.00224) (0.00223) Ab. Med. SMV * Avg. Temp. (6am-6pm) 2.46e-05 (0.000655) Ab. Med. SMV * Avg. Hum. (6am-6pm) 0.000174 (0.000162) Constant 0.538*** 0.521*** 0.526*** (0.0171) (0.0174) (0.0209) Observations 159,849 148,298 148,298 Line FE YES YES YES Year-Month FE YES YES YES SE Cluster LINE LINE LINE Clusters 665 665 665 Sample Efficiency Efficiency Efficiency Adj. R Sq. 0.280 0.196 0.196 Note: Temperature and Humidity measures have been averaged over 3-hourly readings for Dhaka city, collected from Bangladesh Meteorological Department. ‘Above Median SMV’ is a binary variable that takes the value 1 if the garment that a given line of a given factory works on a given day has a SMV that is above the median SMV within the factory over the whole sample period. “Factory Weekend” is a binary variable to indicate an otherwise weekend day for a given factory. All standard errors are clustered at line level; the number of clusters (lines) are reported under ‘Clusters’. *** p<0.01, ** p<0.05, * p<0.1
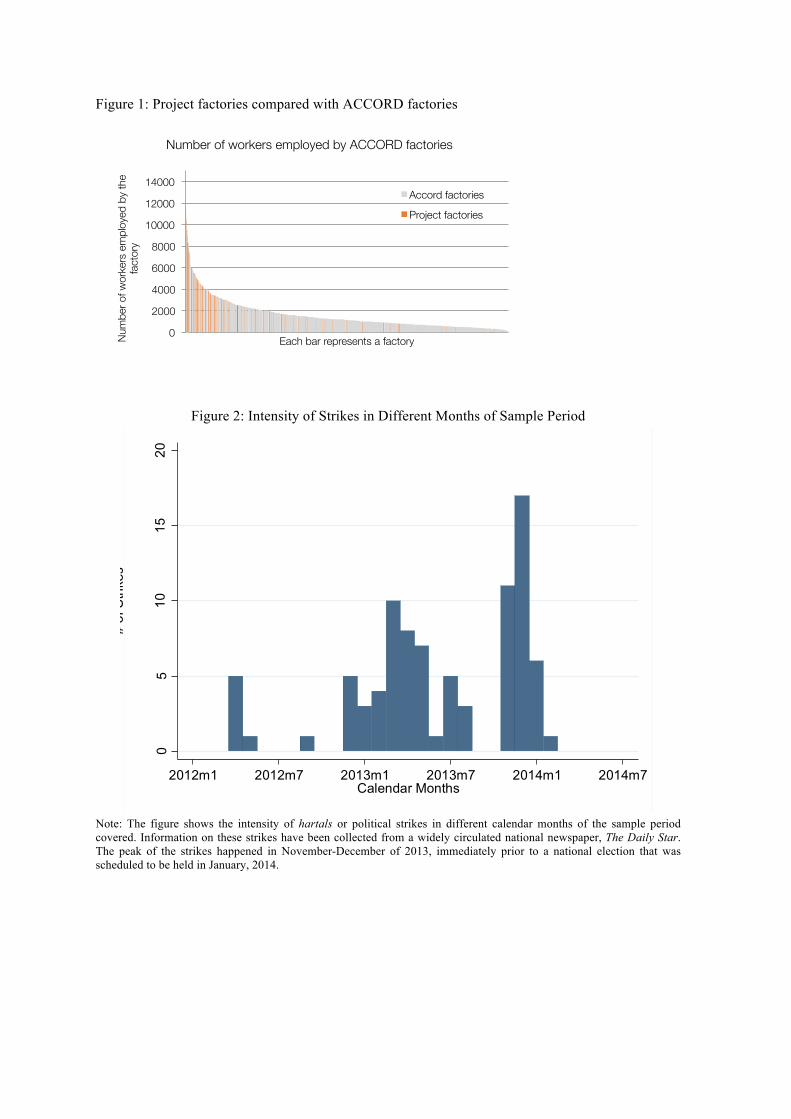
Figure 1: Project factories compared with ACCORD factories
Figure 2: Intensity of Strikes in Different Months of Sample Period
Note: The figure shows the intensity of hartals or political strikes in different calendar months of the sample period covered. Information on these strikes have been collected from a widely circulated national newspaper, The Daily Star. The peak of the strikes happened in November-December of 2013, immediately prior to a national election that was scheduled to be held in January, 2014.
0
2000
4000
6000
8000
10000
12000
14000
Num
ber o
f wor
kers
em
ploy
ed b
y th
e fa
ctor
y
Each bar represents a factory
Number of workers employed by ACCORD factories
Accord factories
Project factories
05
1015
20
# of
Stri
kes
2012m1 2012m7 2013m1 2013m7 2014m1 2014m7Calendar Months

Figure 3: Intensity of RMG Unrests in Different Months of Sample Period (by locations)
Note: The above figure plots the intensity of RMG unrests in different calendar months of the sample period, shown with respect to locations of the factories in the sample. The locations have been defined as geographical clusters where the sample factories are located in. Information on these unrests have been collected from a widely circulated national newspaper, The Daily Star. There are 2, 5, 15 and 4 factories in Locations 1, 3, 4 and 8, while there is 1 factory in each of Locations 2, 5, 6 and 7. Location 1, 3 and 4 were mostly hit by RMG unrests in the sample period covered, while Location 5 and 7 did not have any such unrests.
Figure 4: Distribution Plots
Note: The above figures plot the distribution of Efficiency, Daily Runtime Hours for lines and Rate of Absenteeism for workers. Efficiency for a given line in a given day is defined as the ratio of total time estimated to be required to complete whatever quantity of garments were completed and the actual time required to complete them. The former is estimated as the product of total outputs and Standard Minute Value (SMV). SMV is the average time required to complete one piece of a garment, as estimated by the factories for each style of garments. Daily Runtime Hours is the length of time (in hours) that a line operated for in a given day. Rate of absenteeism is the number of workers (operators + helpers) who were absent in a given line in a given day as a ratio of the total number of workers who were registered with that line. Most lines in the sample operate at a level close to 50%. Daily runtime has multi-modal distribution where most lines operate for 8, 10 or 12 hours in a day.
02
46
# of
RM
G U
nres
ts
2012m10 2013m4 2013m10 2014m4
Location 1
02
46
# of
RM
G U
nres
ts
2013m4 2013m7 2013m10 2014m1 2014m4 2014m7
Location 2
02
46
# of
RM
G U
nres
ts
2012m1 2012m7 2013m1 2013m7 2014m1
Location 3
02
46
# of
RM
G U
nres
ts
2012m1 2012m7 2013m1 2013m7 2014m1 2014m7
Location 4
02
46
# of
RM
G U
nres
ts
2012m4 2012m7 2012m10 2013m1 2013m4
Location 5
02
46
# of
RM
G U
nres
ts
2013m1 2013m4 2013m7 2013m10 2014m1
Location 6
02
46
# of
RM
G U
nres
ts
2013m4 2013m7 2013m10 2014m1 2014m4
Location 7
02
46
# of
RM
G U
nres
ts
2012m1 2012m7 2013m1 2013m7 2014m1 2014m7
Location 8
Note: Calendar Months in x-axis of all plots. There are 2, 5, 15 and 4 factories in Locations 1, 3, 4 and 8 respectively, and 1 factory in each of Locations 2, 5, 6 and 7.
0.5
11.
52
2.5
Den
sity
0 .5 1 1.5Efficiency
kernel = epanechnikov, bandwidth = 0.0152
Efficiency
0.1
.2.3
Den
sity
0 5 10 15 20 25Hours
kernel = epanechnikov, bandwidth = 0.2136
Daily Runtime Hours for Lines
02
46
8
Den
sity
0 .2 .4 .6 .8 1Percentage of Workers Absent
kernel = epanechnikov, bandwidth = 0.0053
Absenteeism

Figure 5: Daily Temperature and Humidity over Sample Period
Note: Temperature and Humidity measures have been averaged over 3-hourly temperature readings for Dhaka city, collected from Bangladesh Meteorological Department.
0.0
5.1
Den
sity
10 20 30 40Avg. Temperature (6am-6pm)
kernel = epanechnikov, bandwidth = 1.0076
Temperature
0.0
1.0
2.0
3D
ensi
ty
20 40 60 80 100Avg. Humidity (6am-6pm)
kernel = epanechnikov, bandwidth = 3.2649
Humidity

Figure 6A: Non-Linear Estimates for Impact of Temperature on Efficiency
Note: The above figure plots the coefficients from a regression of efficiency on dummies of average daily temperature (6am-6pm) and average daily humidity (6am-6pm). Omitted category is average daily temperature of 17°C. 95% confidence interval reported by dotted lines. Factories used in this regression are from ‘Efficiency’ sample. Temperature measures have been averaged over 3-hourly temperature readings for Dhaka city, collected from Bangladesh Meteorological Department.
Figure 6B: Non-Linear Estimates for Impact of Humidity on Efficiency
Note: The above figure plots the coefficients from a regression of efficiency on dummies of average daily temperature (6am-6pm) and average daily humidity (6am-6pm). Omitted category is average daily humidity of 37%. 95% confidence interval reported by dotted lines. Factories used in this regression are from ‘Efficiency’ sample. Humidity measures have been averaged over 3-hourly humidity readings for Dhaka city, collected from Bangladesh Meteorological Department.
-.08
-.06
-.04
-.02
0
Est
imat
ed C
hang
e in
Effi
cien
cy
18 19 20 21 22 23 24 25 26 27 28 29 30 31 32 33 34Temperature (C)
-.04
-.02
0.0
2.0
4.0
6
Est
imat
ed C
hang
e in
Effi
cien
cy
38394041424344454647484950515253545556575859606162636465666768697071727374757677787980818283848586878889Humidity (%)

Figure 7A: Non-Linear Estimates for Impact of Temperature on Runtime (hrs)
Note: The above figure plots the coefficients from a regression of Runtime (daily operation hours of lines) on dummies of average daily temperature (6am-6pm) and average daily humidity (6am-6pm). Omitted category is average daily temperature of 17°C. 95% confidence interval reported by dotted lines. Factories used in this regression are from ‘Efficiency’ sample. Temperature measures have been averaged over 3-hourly temperature readings for Dhaka city, collected from Bangladesh Meteorological Department.
Figure 7B: Non-Linear Estimates for Impact of Humidity on Runtime (hrs)
Note: The above figure plots the coefficients from a regression of Runtime (daily operation hours of lines) on dummies of average daily temperature (6am-6pm) and average daily humidity (6am-6pm). Omitted category is average daily humidity of 37%. 95% confidence interval reported by dotted lines. Factories used in this regression are from ‘Efficiency’ sample. Temperature measures have been averaged over 3-hourly temperature readings for Dhaka city, collected from Bangladesh Meteorological Department.
-.50
.5
Est
imat
ed C
hang
e in
Run
time(
hrs)
18 19 20 21 22 23 24 25 26 27 28 29 30 31 32 33 34Temperature (C)
-.50
.51
Est
imat
ed C
hang
e in
Run
time(
hrs)
38394041424344454647484950515253545556575859606162636465666768697071727374757677787980818283848586878889Humidity (%)

Designed by soapbox.
The International Growth Centre (IGC) aims to promote sustainable growth in developing countries by providing demand-led policy advice based on frontier research.
Find out more about our work on our website www.theigc.org
For media or communications enquiries, please contact [email protected]
Subscribe to our newsletter and topic updates www.theigc.org/newsletter
Follow us on Twitter @the_igc
Contact us International Growth Centre, London School of Economic and Political Science, Houghton Street, London WC2A 2AE