the effect of outdoor air pollution on mortality risk: an
TRANSCRIPT
The effect of outdoor air pollution on mortality risk: an ecological study from Santiago, Chile Manuel Salinasa & Jeanette Vegab
Introduction Santiago, the capital city of Chile, has special environmental conditions. It is located in the plain zone of the Central Valley, with a median altitude of 500 m. The Metropolitan Area is limited to the east by the Andes Mountains, and to the north by a chain of peaks (San Crist6bal and Manquehue). The winds are 60% SW with a mean speed of 3 to 4 m, and 20% NNE with a mean speed of 1 to 2 m. The climate is predominantly dry in summer and cold in winter with few rainy days (annual mean rainfall of 330 mm). The region is affected by the subtropical high pressure phenomenon known as the South Pacific Anticyclone, which generates a dynamic atmospheric thermal inversion layer that, in winter, can stay as low as 200 to 300 m above ground level and is relatively stable (1).
This combination of factors leads to poor atmospheric ventilation and therefore to frequent air pollution episodes of great concem to the population because of the potential health risk from a variety of pollutants that frequently reach high levels during the cold seasons. Special attention is given to the high prevalence of respiratory diseases during the winter among children and the elderly, which are attributed by the media and general public to the effects of air pollution.
In Chile, respiratory diseases constitute the third leading cause of general population mortality, and for infant mortality they follow perinatal and congenital diseases (2). Most of the paediatric deaths are due to acute respiratory infections among malnourished and socially deprived children. Respiratory diseases also account for the majority of hospital use and for about 50% of children's visits to primary care centres.
There exists abundant evidence on the deleterious effects of air pollution on health. Acute episodes of air pollution have been linked to mortality in the Meuse Valley (Belgium) in 1930, in Donora (Pennsylvania, United States of America) in 1948, and in London (United Kingdom) in 1952 (3, 4). In relation to the health effects of low concentrations of air pollutants, there appears to be no detectable threshold, as seen in the analysis of daily mortality in the Philadelphia and Steubenville
a Epidemiologist, Catholic University of Chile, Santiago, Chile.
b Epidemiologist, Pan American Health Organization, Santiago, Chile (E-mail: [email protected]).
118
communities in the United States (4). Up to a 4% increment in daily mortality counts has been associated with each 100 pg/m3 increase in suspended particulate matter per cubic meter, estimated for the previous day (3-5). A recent review and metaanalysis of 12 studies on mortality and air pollution estimated a relative risk of 1.06 (95% confidence intervall.05 -1.07) for a lOO pg increment in total suspended particles. The author concluded that the most reasonable interpretation of results is causal (6).
Different Chilean studies have analysed the relationship between morbidity and mortality and air pollution. For morbidity, an ecological study showed differences in the proportion of daily visits to primary care centers for respiratory conditions in the capital compared to a control city located 45 miles (70 km) to the north, without the heavy emission rate of air pollutants of Santiago. Nevertheless, this study did not measure actual air pollution in the control city.c In another study, the same cities were compared as part of an epidemiological monitoring system for health effects of air pollution. The study showed a higher proportion of bronchial obstructive diseases in Santiago during winter, and a higher incidence of pneumonia in the control city during spring. Sulphur dioxide and particulate matter (PM10) were measured in the control city in a 2-month period during which the air quality standards were not exceeded. In Santiago they were exceeded frequently for suspended particles, ozone and carbon monoxide.d
With regard to mortality, studies conducted in Chile have found an association between daily mortality and air quality data, controlling for confounders such as mean temperature and humidity. These studies have used linear regression models assuming a normal distribution for the outcome variable.
The purpose of the present study was to determine the effect of air pollution on daily mortality in Santiago and to analyse whether the geographical distribution of the risk of death within the Metropolitan Area of Santiago was due to the bad quality of urban air.
c Epidemiological study on effects of air pollution, Final Report, Metropolitan Region Government, Santiago, December 1989.
d Epidemiological monitoring system for the effects of air pollution in Santiago, FinalReport, Special Commission for the Control of Air Pollution, Santiago,June 1993.
Rapp. trimest. statist. sanit. mond., 48 (1995)
Data and methods The present study analysed mortality in Greater Santiago from 1988 to 1991, extracting data from the records at the National Institute of Statistics. For each death, the age, municipality of residence, and cause of death were registered.
First, the risks of death in the 32 municipalities of the province of Santiago plus 2 municipalities (San Bemardo and Puente Alto) included geographically in the urban region of Santiago were compared. According to the last census, in 1992, this area has 4 756 700 inhabitants, with the population per municipality ranging from 41100 to 328 900. Standardized mortality ratios (SMR) were calculated for each municipality using as the standard the population of Chile and the age-specific mortality rates for each year under analysis. Age distribution for municipalities was obtained from the Demographic Annual Reports edited by the National Institute of Statistics.e.f,g,h Deaths due to injuries and poisoning (ICD 800 to 999) were excluded.
Subsequently, a correlation analysis was performed between SMRs, infant mortality rates and proportion of the population living under the poverty level for each of the municipalities. For this purpose, data were obtained from the last official survey on social conditions, carried out every two years by the Ministry of Planning.i
To analyse the risk of mortality for specific respiratory system diagnoses, we arbitrarily defined
. 14 population zones taking into account their population size and geographical location. The aim of this procedure was to stabilize incidence rates across geographical zones through a merger of communities of larger population size. Specific mortality rates for pneumonia (ICD 480 to 487), chronic obstructive pulmonary disease (COPD) (ICD 491, 492, 496) and asthma (ICD 493) were calculated for each zone.
In addition, in order to analyse seasonal differences in the geographical distribution of risk, we calculated monthly SMRs by zone, using the country's age-specific mortality rates for the same month of the year. Maps and graphs were elaborated to show temporal and geographical trends of risks in the general and specific mortality, using the Epimap software (7).
Finally, a multiple regression analysis was done assuming a Poisson distribution model. The de-
e Boletin de dernografta. Instituto Nacional de Estadisticas, Santiago, 1988.
f Boletin de demografta. Instituto Nacional de Estadisticas, Santiago, 1989.
g Boletin de demografta. Instituto Nacional de Estadisticas, Santiago, 1990.
h Boletin de dernografta. Instituto Nacional de Estadisticas, Santiago, 1991.
i Encuesta nacional de condiciones socioecon6micas. Ministerio de Planificaci6n, Santiago, 1992.
Wld hlth statist. quart., 48 (1995)
pendent variable was daily deaths counts occurring in Greater Santiago (excluding injuries and poisonings). The independent variables were levels of outdoor air pollutants, daily mean temperature, and humidity. These data were obtained from the Air Quality Monitoring Network ofSantiagoj Each observation correSponded to one day in the period between January 1, 1988 and December 31, 1991, with the following variables:
• number of non-violent deat)ls; • relative humidity(%); • temperature, in degrees Celsius; • previous day's temperature, in degrees Cel
sius; • suspended particles less than 10 pm and greater
than 2.5 pm of aerodynamic diameter, expressed in pg/m3;
• suspended particles less than 2.5 pm of aerodynamic diameter, expressed in pg/m3;
• carbon monoxide, maximum moving 8-hour average, expressed in parts per million (ppm);
• sulphur dioxide, daily mean, expressed in pg/ m3; and
• ozone, maximum hourly concentration, expressed in pg/m3.
Data on pollutants and meteorological variables came from 5 monitoring stations located in the city. The data included in the analysis were daily means from the different stations for each day, considering missing values as non-existent . Data analysis was carried out using STATA statistical softwarek, controlling for eo-linearity and interaction among regression variables.
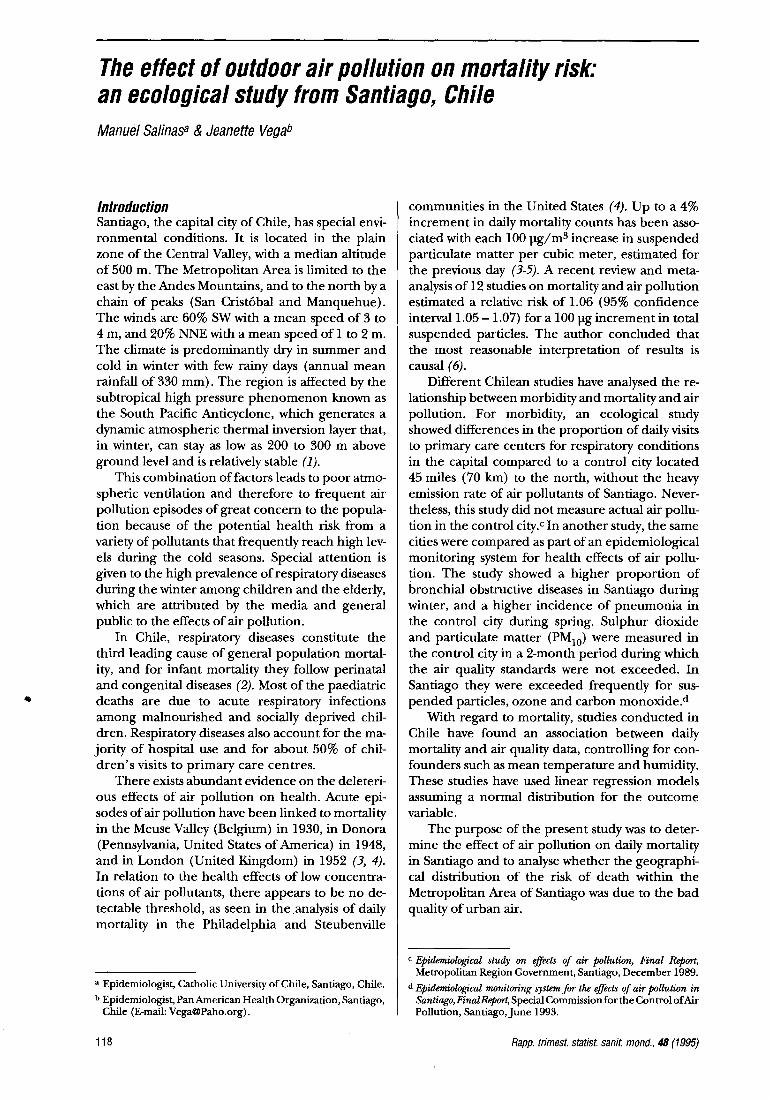
Results Standardized mortality ratios, infant mortality rates, and proportion of population living below the poverty level, for each of the municipalities are shown in Table 1. Map 1 shows the SMR by municipality in Greater Santiago. SMRs for the urban municipalities were in general under 100, which was to be expected considering that there is a strong centralization of the services as well as better living conditions in the capital in comparison with the rest of the country; nevertheless, 8 of the municipalities have SMRs above 100, 7 of which are located in the inner zone of the city. In this zone, air pollutants were more concentrated than in the outer zones of the city. This was due to the high number of mobile sources circulating in this area, suggesting an association between environmental air pollution and risk of death.
j Red de monitareo ambiental de calidad del aire. Servicio de Salud del Ambiente, Ministerio de Salud, Santiago, 1988-1991.
k STATA (1993): Computing Resource Center, 1640FiftbStreet, Santa Monica, California, United States of America.
119
•
Map 1 Standardized mortality ratio (SMR), municipalities of Greater Santiago, Chile, 1988-1991
Carte 1 Indices comparatifs de mortalite (I CM) dans les municipalites de !'agglomeration de Santiago, Chili, 1988-1991
SMR-ICM
c=:J 39.7- 48.3
c=:J 48.4-65-7
c=:J 65.8-83.1
l~m~ilmi';l 83.2- 91.9
.. 92.0 -100.6
.. 100.7-109.3
.. 109.4-118.0
.. 118.1 -126.7
.. 126.8-135.6 WH095374
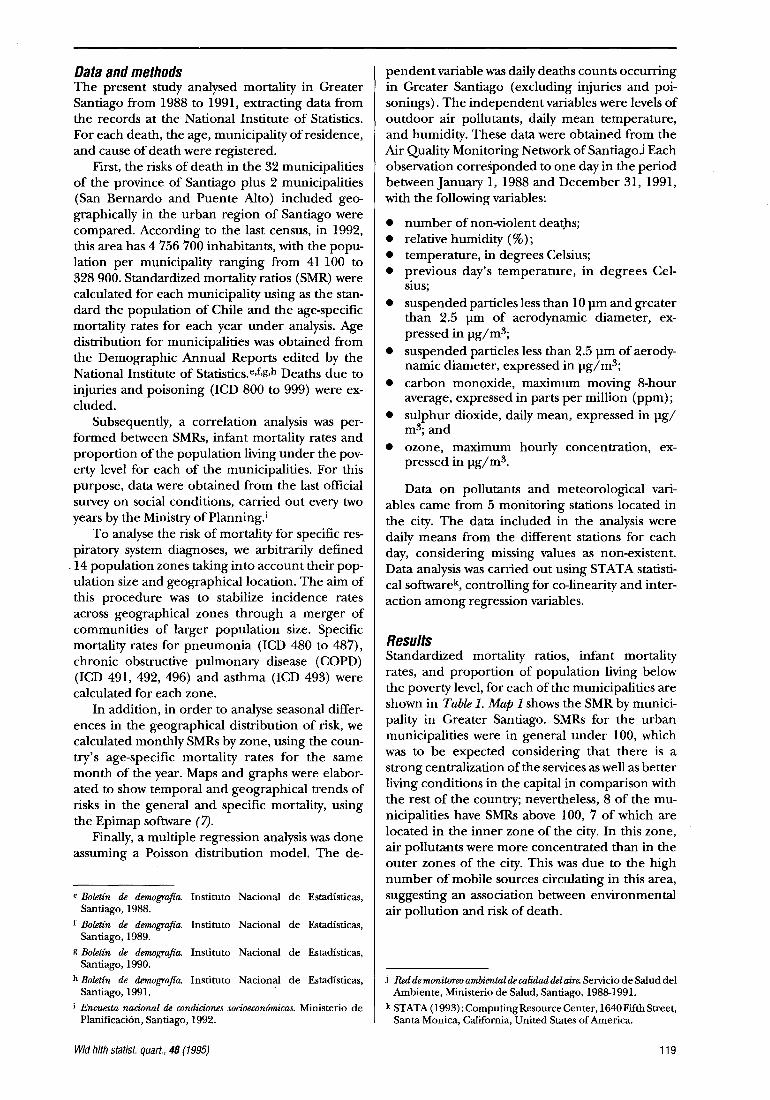
Map 2 Standardized mortality ratios (SMR) for pneumonia, zones of Greater Santiago, Chile, 1988-1991
Carte 2 Indices comparatifs de mortalite (ICM) due a la pneumonie, zones de !'agglomeration de Santiago, Chili, 1988-1991
SMR-ICM
c=:J 74.0- 79.4
c=:J 79.5 - 84.9
I >< I 85.o- 90.4
1Ir&sm1r'ml 90.5- 96.o
IB 96.1 - 101 .5
.. 101 .6-107.0
.. 107.1-112.6
.. 112.7-118.1
.. 118.2-123.6
.. 123.7-129.3 WH095375
120
Municipalities of Greater Santiago
1. Cerrillos 18. Maipu 2. Cerro Navia 19. Nunoa 3. Conchali 20. P.A. Cerda 4. El Basque 21. Penalolen 5. E. Central 22. Providencia 6. Huechuraba 23. Pudahuel 7. lndependencia 24. Puente Alto 8. La Cisterna 25. a. Normal 9. La Florida 26. auilicura 10. La Reina 27. Recoleta 11. Las Condes 28. Renca 12. La Granja 29. San Bernardo 13. La Barnechea 30. San Miguel 14.Lo Espejo 31 .San Raman 15. Lo Prado 32. Santiago 16. La Pintana 33. San Joaquin 17. Macul 34. Vitacura
lo Barnechea
Zones of Greater Santiago, Chile Zones de l'agglomeralion de Santiago, Chill
1. North 2- Nord 2: Huechuraba/auilicura 2. North 1 - Nord 1: I ndependencia/ Recoleta/Conchali 3. North-west- Nord-Ouest: Renca/C. Navia/Lo Prado 4. Downtown 1 - Centre-vi lie 1: Santiago 5. Downtown 2- Centre-vi lie 2: Est. Central/a. Normal 6. West- Quest: Pudahuei/Maipu 7. South 1 - Sud 1: Cerrillos/PA Cerda/Lo Espejo 8. South 2- Sud 2: El Basque/San Bernardo/La Plntana 9. East 1 - Est 1: Providencia/Nunaa 10. East 2 - Est 2: Las CondesNitacura/La Reina 11 . East- Est: Macui/Penalolen 12. South-east 1 - Sud-Est 1: La Cisterna/San Miguei/San
Ramon/La Granja/San Joaquin 13. South-east 2- Sud-Est 2: La Florida/Pte. Alto
Rapp. trimest. statist. sanit. mond. , 48 (1995)
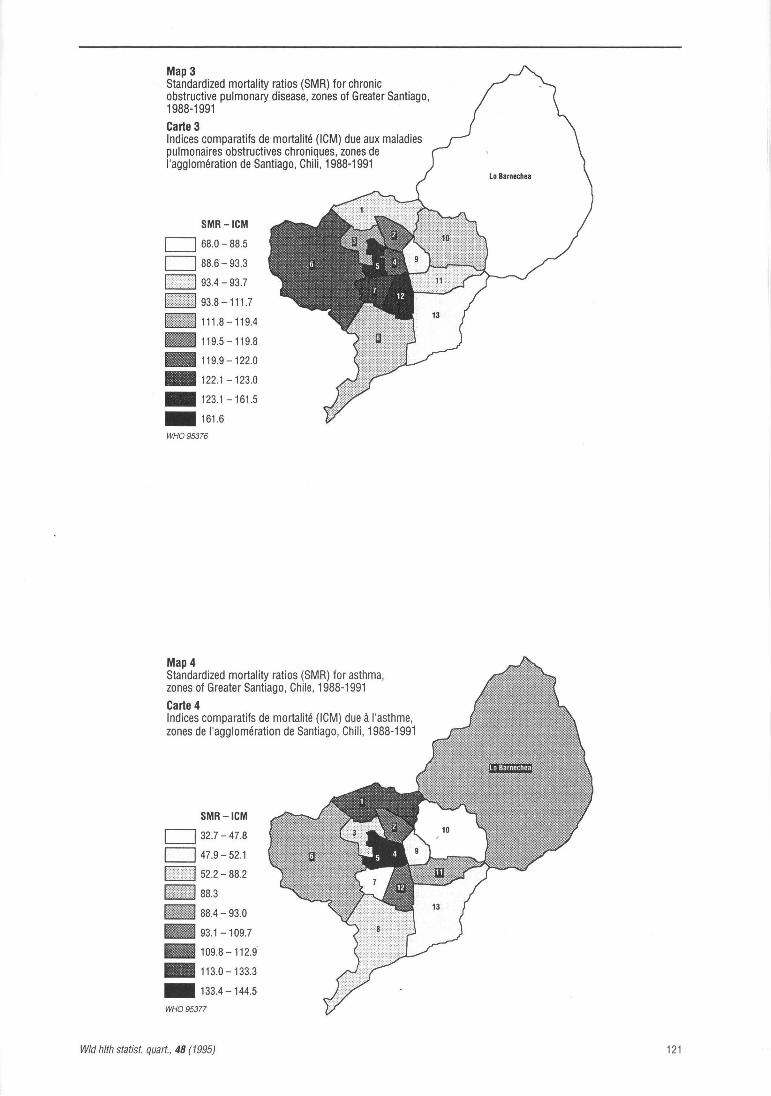
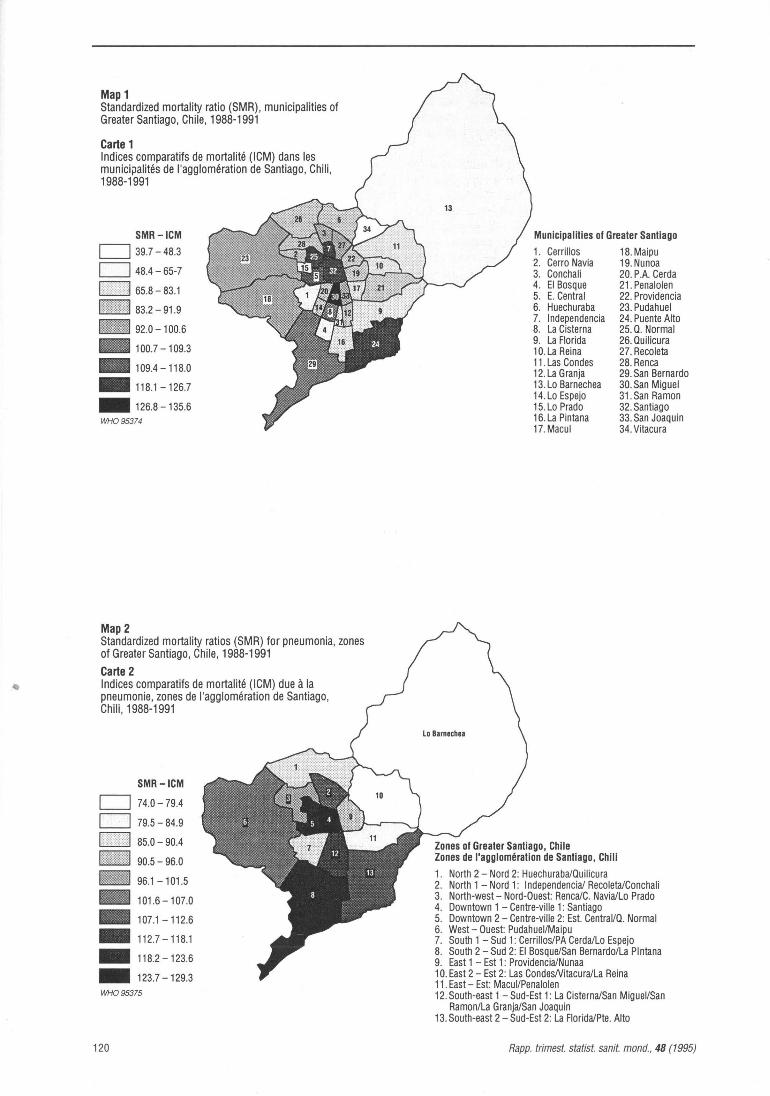
Map 3 Standardized mortality ratios (SMR) for chronic obstructive pulmonary disease, zones of Greater Santiago, 1988-1991
Carte 3 Indices comparatifs de mortalite (ICM) due aux maladies pulmonaires obstructives chroniques, zones de !'agglomeration de Santiago, Chili, 1988-1991
SMR-ICM
CJ 68.0 - 88.5
CJ 88.6 - 93.3
93.4-93.7
93.8-111.7
- 1111.8-119.4
1111119.5-119.8
.. 119.9-122.0
.. 122.1 - 123.0
.. 123.1-161.5
.. 161.6
WH095376
Map 4 Standardized mortality ratios (SMR) for asthma, zones of Greater Santiago, Chile, 1988-1991
Carte 4 Indices comparatifs de mortalite (ICM) due a l'asthme, zones de !'agglomeration de Santiago, Chili , 1988-1991
SMR-ICM
CJ 32.7- 47.8
CJ 47.9-52.1
52.2-88.2
IHii'IJIIIIilil 88.3
1B11 88.4- 93.o
IJII 93.1 -109.7
.. 109.8-112.9
.. 113.0-133.3
.. 133.4-144.5
WH095377
Wld hlth statist. quart., 48 (1995)
Lo Barnachaa
121

Table 1 Standardized Mortality Ratio (SMR), Infant Mortality Rate (IMR), proportion of population under poverty level by municipalities of Greater Santiago, 1988-1991
Tableau 1 lndice comparatif de mortalite (SMR), taux de mortalite infantile (TMI) et proportion de la population vivant en dessous du seuil de pauvrete dans les ditterentes municipalites de !'agglomeration de Santiago, 1988-1991
Municipality- SMR IMR- Poverty-Municipalite TMI Pauvrete
Cerrillos 62.9 17.1 20.4 Cerro Navia 90.5 16.4 35.9 Conchali 98.2 10.9 33.6 El Basque 65.2 12.9 30.1 E. Central 112.2 10.7 23.2 Huechuraba 84.1 15.2 37.0 lndependencia 121.2 15.3 15.8 La Cisterna 108.3 10.2 19.0 La Florida 74.5 10.6 24.2 La Reina 81.2 7.8 5.6 Las Condes 76.9 5.8 2.9 La Granja 89.1 8.6 33.6 Lo Barnechea 64.0 9.1 25.6 Lo Espejo 90.2 16.5 38.0 Lo Prado 81.0 9.5 34.2 La Pintana 81.6 14.0 42.8 Macul 79.7 12.5 20.2 Maipu 95.0 7.6 19.0 Nunoa 91.2 5.6 7.7 P.A. Cerda 85.6 11.6 38.2 Penalolen 84.9 10.4 28.5 Providencia 85.7 8.6 0.2 Pudahuel 92.5 18.1 23.3 Puente Alto 118.9 9.6 22.4 0. Normal 119.4 18.8 27.2 Quilicura 88.2 11.9 31.6 Recoleta 94.9 15.1 24.2 Renca 90.3 16.7 30.8 San Bernardo 107.7 13.3 30.6 San Miguel 135.6 12.2 16.5 San Raman 82.7 13.4 34.4 Santiago 120.5 13.9 21.9 San Joaquin 92.9 14.9 19.0 Vitacura 39.7 7.3 2.1
The correlation analysis between SMRs and proportion of population under the poverty level or without access to health services revealed no correlation (r = 0.07 and r = 0.08 respectively). The linear correlation coefficient was stronger when poverty was related to infant mortality rates across municipalities (r = 0.5). This indicates that in this particular city, infant mortality was somehow more related to living conditions than was general mortality, which was, in turn, probably more associated with environmental risk factors such as urban air pollution.
The grouping of municipalities into 24 zones is shown in Map 2. Table 2 and Maps 2-4 show the specific SMRs for pneumonia, COPD and asthma
122
Table 2 Specific SMR for respiratory conditions, zones of Greater Santiago, 1988-1991
Tableau 2 lndice comparatif de mortalite imputable aux maladies respiratoires dans differents zones de !'agglomeration de Santiago, 1988-1991
Zone- Quartier
Downtown 2 - Centre-vi lie 2 North 2 - Nord 2 Northeast - Nord-Est West- Quest South 1 - Sud 1 Southeast 1 - Sud-Est 1 South 2 - Sud 2 Southeast 2 - Sud-Est 2 East- Est West 1 - Quest 1 West 2 - Quest 2 North 1 - Nord 1 Downtown 1 - Centre-ville 1 Lo Barnechea
PneumoniaPneumonie
121.9 87.1 99.5
107.0 90.2
117.4 118.5 111.2 81.0 95.0 74.0
108.6 129.3 79.2
Chronic obstructive pulmonary diseaseMaladies
pulmonaires obstructives chroniques
132.7 161.6 111.8 119.9 122.1 123.1 103.4 88.6 93.4 91.5 93.8
119.5 120.1 68.0
AsthmaAsthme
155.2 113.0 65.9 92.0 47.9
110.6 52.2 93.1 88.4 47.9 32.7
109.7 133.4 88.3
by zone. The analysis of specific respiratory SMRs by zone was consistent with the distribution of risk for general mortality. The central zones of the city were those with the highest risk for every specific respiratory cause of death.
The analysis of seasonal trends in death risks among zones showed no great variations in most of the zones. A slight increase in deaths during winter appeared, which is in agreement with the tendency observed nationally. However, zones with the highest SMR values tended to have a substantial increase during the cold season and corresponded to those located in the central area of the city (Figs. 1 & 2).
Regression analysis of daily mortality data versus air quality data are shown in Tables 3 & 4. When the model included all days with available data during the 4-year period, the number of deaths was associated directly with humidity and carbon monoxide and indirectly with temperature. There was no significant association with other variables. There was only a marginal association with the concentration of fine suspended particles (under 2.5 pm). When the days with levels of fine suspended particles below 150 ].lg/m3 were analysed separately, the suspended particles level variable was included in the model.
Discussion The analysis of SMR within the territory of Greater Santiago showed a clear pattern in the geographi-
Rapp. trimest. statist. sanit. mond., 48 (1995)

Flg.1 Standardized mortality ratios (SMR) by month, zones with higher SMR, Santiago, Chile, 1988-1991 Taux comparatifs de mortalite, par mois, pour les districts ayant les taux de mortalite les plus eleves, Santiago, Chili, 1988-1991
--Southeast 1 - Sud-est 1 --Downtown 1 -Centre vllle 1 - - Downtown.2- Centre vllle 2 -- North1-Nord1
11 Ill IV V VI VII VIII IX X XI XII
Month-Mois
Table 3 Poisson regression model for the total number of days
Tableau 3 Modele de regression de Poisson pour le nombre total de jours
Fig. 2 Standardized mortality ratios (SMR) by month, zones with lower SMR, Santiago, Chile, 1988-1991
Taux comparatifs de mortalite, par mois, pour les districts ayant les taux les moins eleves, Santiago, Chili, 1988-1991
1401-r-------------------. West 2 - Quest 2 Southeast 2 - Sud-est 2 South 1 - Sud 1 South 2 - Sud 2 East-Est Northeast - Nord-est
11 Ill IV V VI VII VIII IX X XI XII
Month-Mois
Variable Risk ratioRapport de risque
Standard errorErreur type
p 95% Cl I ntervalle de confiance
de 95%
PM2.5 CO Humidity- Humidite Temperature- Temperature
Notes: Global XL X2 total = 670 203 P< 0.0005 R2 = 11.7%
Table 4
1.000246 1.011929 0.997519 0.977607
0.0001543 0.0017316 0.0006826 0.0014398
0.111 < 0.005 < 0.005 < 0.005
Poisson regression model (days with fine particulate matter levels under 150 ~gfm3)
Tableau 4
(0.999944- 1.000548) (1.008541 - 1.015329) (0.996182- 0.998857) (0.974789- 0.980433)
Modele de regression de Poisson (jours pendant lesquels le taux de particules etait inferieur a 150 ~gfm3)
Variable
PM2.5 CO Humidity- Humidite Temperature- Temperature
Notes: Global X 2- X2 total = 591 734 P< 0.0005 R2 = 11.2%
Risk ratioRapport de risque
1.000545 1.011248 0.997741 0.978814
Standard errorErreur type
0.0002319 0.0019537 0.0007230 0.0014985
0.019 < 0.005 0.002 < 0.005
95% Cl I ntervalle de confiance
de 95%
(1.000090- 1.000999) (1.007425 -1.015084) (0.996325- 0.999159) (0.975882- 0.981756)
cal distribution of risk of death, both for general mortality (excluding injuries and poisoning) and specific respiratory causes (pneumonia, COPD, and asthma). The SMRs were higher for the· central communities of the city, despite the fact that most socially-deprived populations live in the periphery of Santiago, towards the south and west_ This phenomenon was supported by the lack of correlation
with a variety of socio-economic indicators of poverty and unsanitary conditions. Infant mortality rates, on the contrary, tended to be more concordant with these social indicators; in general the rates were higher in those municipalities with the worst living conditions.
Wld h/th statist. quart., 48 (1995)
The analysis of mortality risk by specific respiratory causes showed that the highest values were
123
consistently situated in the inner city zones. It was possible to observe a gradient in the intensity of this pattern that is more marked for asthma mortality than for mortality from pneumonia. Considering that pneumonia is a frequent cause ofinfant mortality, it is reasonable to expect that the distribution of a specific risk is partially linked to risk factors associated with infant health (poverty, sanitary conditions, cultural characteristics of the community).
COPD and asthma, in contrast, are principal causes of death in adults. In this case, the distribution of specific mortality risks was not associated with variables showing a deterioration of living conditions or a lack of access to health services, but rather to chronic exposure to heavy air pollution, as is often observed in the inner zones of Santiago.
The air quality monitoring network (MACAM) consists of only 5 stations and there are no data on air quality for communities located in the periphery. Therefore, it is not possible to assess directly the association between local SMRs and air quality measurements. However, dispersion models based on meteorological data and emission surveys have confirmed that the highest concentrations of air pollutants are found in downtown Santiago.
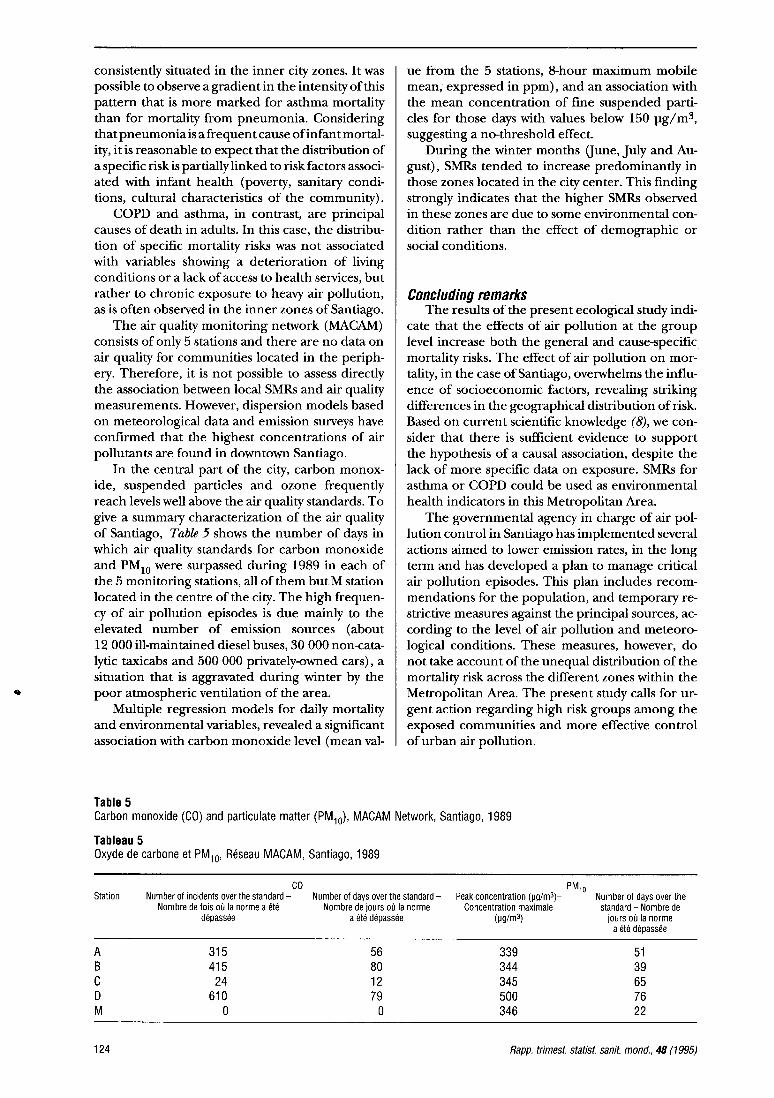
In the central part of the city, carbon monoxide, suspended particles and ozone frequently reach levels well above the air quality standards. To give a summary characterization of the air quality of Santiago, Table 5 shows the number of days in which air quality standards for carbon monoxide and PM10 were surpassed during 1989 in each of the 5 monitoring stations, all of them but M station located in the centre of the city. The high frequency of air pollution episodes is due mainly to the elevated number of emission sources (about 12 000 ill-maintained diesel buses, 30 000 non-catalytic taxicabs and 500 000 privately-owned cars), a situation that is aggravated during winter by the poor atmospheric ventilation of the area.
Multiple regression models for daily mortality and environmental variables, revealed a significant association with carbon monoxide level (mean val-
Table 5
ue from the 5 stations, 8-hour maximum mobile mean, expressed in ppm), and an association with the mean concentration of fine suspended particles for those days with values below 150 pg/m3, suggesting a no-threshold effect.
During the winter months Qune, July and August), SMRs tended to increase predominantly in those zones located in the city center. This finding strongly indicates that the higher SMRs observed in these zones are due to some environmental condition rather than the effect of demographic or social conditions.
Concluding remarks The results of the present ecological study indi
cate that the effects of air pollution at the group level increase both the general and cause-specific mortality risks. The effect of air pollution on mortality, in the case of Santiago, overwhelms the influence of socioeconomic factors, revealing striking differences in the geographical distribution of risk. Based on current scientific knowledge (8), we consider that there is sufficient evidence to support the hypothesis of a causal association, despite the lack of more specific data on exposure. SMRs for asthma or COPD could be used as environmental health indicators in this Metropolitan Area.
The governmental agency in charge of air pollution control in Santiago has implemented several actions aimed to lower emission rates, in the long term and has developed a plan to manage critical air pollution episodes. This plan includes recommendations for the population, and temporary restrictive measures against the principal sources, according to the level of air pollution and meteorological conditions. These measures, however, do not take account of the unequal distribution of the mortality risk across the different zones within the Metropolitan Area. The present study calls for urgent action regarding high risk groups among the exposed communities and more effective control of urban air pollution.
Carbon monoxide (CO) and particulate matter (PM10), MACAM Network, Santiago, 1989
Tableau 5 Oxyde de carbone et PM10, Reseau MACAM, Santiago, 1989
Station
A B c D M
124
CO Number of incidents over the standard
Nombre de fois ou la norme a ete depassee
315 415 24
610 0
Number of days over the standardNombre de jours ou la norme
a ete depassee
56 80 12 79
0
PM10 Peak concentration (~gfm3)
Concentration maximale (~gfm3)
339 344 345 500 346
Number of days over the standard- Nombre de
jours ou la norme a ete depassee
51 39 65 76 22
Rapp. trimest. statist. sanit. mond., 48 (1995)
Summary
The aim of this ecological study was to investigate the effect of outdoor air pollution on the mortality risk of metropolitan inhabitants in Santiago de Chile. Causespecific deaths by the day for the years 1988-1991 in Santiago de Chile were extracted from mortality data tapes of the National Center for Statistics. Deaths from accidents were excluded. Total and some specific respiratory diseases deaths were compared calculating the risk of death by municipality and month of the year using age-adjusted standardized mortality ratios (SMRs) controlling for socioeconomic level. Daily counts of deaths were regressed using a Poisson model on the total and fine suspended particles, S02, CO and ozone on the preceding day, controlling for temperature and humidity.
A clear pattern in the geographical distribution of risk of death, both for general mortality and specific respiratory causes (pneumonia, COPD and asthma) was found using SMR, with higher values in the most polluted areas regardless of socioeconomic and living conditions. A highly significant positive association was found between total mortality and both fine suspended particles and CO level. The association remained significant for those days with fine suspended particles levels below 150 IJg/dl suggesting a no-threshold effect for the total number of deaths.
These results are in agreement with previously reported associations, and they add to the body of evidence showing that particulate pollution is associated with increases daily mortality.
Resume
Incidence de la pollution de /'air ambiant sur le risque de mortalite. Etude ecologique menee a Santiago (Chili)
11 s'agissait d'etudier !'incidence de la pollution de l'air ambiant sur le risque de mortalite auquel sont exposes les habitants de Santiago du Chili. Le taux de mortalite par cause et par jour enregistre a Santiago entre 1988 et 1991 a ete obtenu a partir des registres de mortalite du Centre national de statistique. Les deces par accident ont ete omis. On a compare le taux de mortalite total et le taux de mortalite imputable a certaines maladies respiratoires, en calculant le risque de mortalite par comte et par mois a l'aide d'indices comparatifs de mortalite par age tenant compte du niveau socio-economique. On a calcule la regression du nombre de deces
Wld hlth statist. quart., 48 (1995)
par jour au moyen d'un mode le de Poisson applique aux particules totales et fines en suspension et a la teneur en S02 , CO et ozone le jour precedent, et tenant compte de la temperature et de l'humidite.
L'indice comparatif de mortalite (SMR) a permis de degager une repartition geographique precise du risque de mortalite, tant pour la mortalite generale que pour les maladies respiratoires (pneumonie, maladies pulmonaires obstructives chroniques et asthme), les valeurs maximales etant observees dans les zones les plus polluees, independamment des facteurs socioeconomiques et des conditions d'existence. Une relation positive est apparue tres nettement entre la mortalite totale et le taux de particules fines en suspension et d'oxyde de carbone. Cette association est cependant demeuree importante les jours ou le taux de particules fines en suspension eta it inferieur a 150 1-Jg/dl' laissant a penser qu'il n'existe pas d'effet seuil pour le nombre total de deces.
Ces resultats confirment les liaisons deja observees et prouvent, une fois de plus, que la pollution par les particules s'associe a une augmentation de la mortalite journaliere.
References/References 1. World Health Organization. Major poisoning episodes from
environmental chemicals. Environmental & Occupational Epidemiology Series. WHO, Geneva, 1992.
2. Boletin anual de nacimientos y defunciones. Ministerio de Salud -Instituto Nacional de Estadisticas. Chile, 1990.
3. Thurston G.D. et al. Reexamination of London, England, mortality in relation to exposure to acidic aerosols during 196~1972 winters. Environmental health perspectives, 79:73-82 (1989).
4. Schwartz J. &: Dockery D.W. Particulate air pollution and daily mortality in Steubenville, Ohio. American journal of epidemiology, 135(1):12-19 (1992).
5. Schwartz J. Air pollution and daily mortality: a review and m eta analysis. Environmental research, 64 ( 1) :36-52 ( 1994).
6. Ware J.H. et al. Effects of ambient sulfur dioxide and suspended particles on respiratory health of preadolescent children. American review of respiratrny disease, 133:834-842 (1986).
7. Dean J.A. et al. EPIMAP: a mapping program for IBMcompatible microcomputers. Centers for Disease Control and Prevention, Atlanta, Georgia, U.S.A., 1993.
8. lippmann M. Morbidity associated with air pollution. In: Hutzin_ger, 0. ed. The handbook of environmental chemistry, 4 (PartC-AirPoUution). Springer, Heidelberg 1991 (pp. 31-71).
125