the effect of oligomeric terminal group balance on ... · drücken in einem semi‐batch‐reaktor...
TRANSCRIPT
The Effect of Oligomeric Terminal Group Balance on Catalyzed Polycondensation of Poly(Ethylene Terephthalate)
von
Himanshu Patel
aus Vallabh Vidyanagar, Indien
von der Faukultät II – Mathematik und Naturwissenschaften
der Technischen Universität Berlin
zur Erlangung des akademischen Grades
Doktor der Naturwissenschaften
- Dr. rer. nat. –
genehmigte Dissertation
Promotionsausschuss:
Vorsitzender: Prof. Dr. T. Ressler, TU Berlin
1. Berichter: Prof. Dr. R. Schomäcker, TU Berlin
2. Berichter: Dr. habil. G. Feix, Equipolymers GmbH
Tag der wissenschaftlichen Aussprache: 23. Juli 2008
Berlin, 2008
D 83
Acknowledgement
This work was made during my time as a Ph.D. student at the R&D department for PET/PTA, Equipolymers GmbH, Schkopau. I take this opportunity to express my gratitude to Dr. habil. G. Feix, my research supervisor, mentor, for his invaluable guidance, teaching and advice throughout the course of this investigation. I have learnt from him to interpret, concise and correct my approach to science from formulation to the presentation of my results.
I wish to thank Professor Dr. R. Schomäcker, for his trust in giving me this responsibility and for his motivation and support in numerous ways during the discussions with him. It is my honor to acknowledge Professor Dr. K.H. Reichert, who was my source of inspiration to choose this career. I shall be grateful to him for the encouragement I got from him during my research work.
I am grateful to Dr. habil. V. Voerckel, Dr. U. Pfannmöller and H. Stäuber for taking keen interest and giving remarks for my work. I would like to thank Equipolymers GmbH for an exciting project and financial support.
My special thanks goes to Dr. S. Hiller who gave me much technical assistance during the first steps of my project. I would like to thank Silvia Hubold for helping me in carrying out experiments at all stages, I am also thankful to Manuela Laute and Claudia Bunk for providing express analytical results of my experiments.
I would like to thank all my past and present colleagues (in alphabetical order) Dr. R. Eckert, Dr. F. Köller, M. Nagel, Dr. A. Rastogi, I. Ritter, D. Runkel, H. Schaarschmidt, K. Scheibe, M. Sela, Dr. M. Stolp and J.P. Wiegner for all the scientific and social support. I consider it a privilege to have been a member of this group for the past 4 years. We have had countless productive discussion in the laboratory as well as memorable experience during the hiking trips with J.P. Wiegner. Thank you for your immense understanding and contribution to this success.
My endless thanks to my past and present university colleagues: Mohammed, FaissalAli and Fatemeh for everything they have done. I wish to thank my friends in Germany and abroad for their constant support and encouragement.
I dedicate this thesis to my parents and I am deeply and thoroughly indebted to them. Thereafter I am thankful to all my family members for all the freedom and moral support they have given to choice of my career and life style.
My last but not least goes to my beloved wife Dharti. Thank you for your love, support and patience during the long process towards this goal.

Abstract of Dissertation
“The effect of oligomeric terminal group balance on catalyzed polycondensation of
Poly(ethylene terephthalate)”
By
Himanshu Patel
Poly(ethylene terephthalate) commonly known as PET has been a commercially
important polymer since its introduction in 1950s and it is mainly used in fiber and packaging
industries. It is mainly produced by synthesis of terephthalic acid (TPA) and ethylene glycol
(EG). For PET synthesis, at first, primary esterification of TPA with EG takes place. The chain
prolongation is further obtained by the reaction between carboxyl‐groups (COOH) and ester‐
end groups (OH) of the oligomers (secondary esterification) and simultaneously through the
reaction between ester‐end groups (transesterification).
The major factors influencing the overall reaction rate include the catalyst,
temperature, pressure, diffusion rate of volatile byproducts but also the reactant balance
which means the end group balance COOH/(COOH+OH). The effects of first four factors are
readily understood. However, the influence of the end group balance in the melt phase
polycondensation has not been studied extensively. This is of utmost importance since the
batch reactor and continuous reactor cascade generate different oligomeric structure
consequently it becomes difficult to transfer the kinetic data of the melt phase
polycondensation from laboratory to the continuous plant.
The primary goal of this project was to study the influence of end group balance on the
reaction rates of secondary esterification and transesterification reactions. Another task was to
study the influence of end group balance on the reaction rates in the presence of different
catalysts. An essential prerequisite of these studies was to produce oligomers with defined end
group balance in the primary esterification, which acts as a starting point of the melt phase
polycondensation.
The esterification phase was performed with specific EG/TPA feed mol ratio under
different reaction pressure to produce oligomers with varied end group balance by removing
water as a byproduct and EG as an excess reactant in a semibatch reactor. The produced water
was distilled‐off and the remaining EG was managed by pressure and its reflux from the
column. By controlling of the EG content in the liquid phase along with the reaction, oligomers

with broad range of end group balance can be produced. Such oligomers could also be
produced by primary esterification in continuous reactor cascade, which further acts a starting
point of the continuous melt polycondensation phase.
The first step of the primary esterification involves the dissolution of TPA in EG and in
the esterified product (oligomers). Consequently, the TPA dissolution rate is also influenced by
the specific surface of TPA crystals and the actual particle size distribution.
The influence of TPA particle size distribution on the primary esterification rate was
simulated by using newly developed model for primary esterification. Esterification model was
developed by considering esterification reactions and solid‐liquid mass transport of TPA in
liquid phase and liquid‐vapor mass transfer effect for EG and water. It was observed that the
esterification rate became more sensitive towards TPA particle size distribution as the EG/TPA
feed ratio was lowered.
The esterified oligomer were further reacted under high vacuum (~ 0.1 mbar) to obtain
amorphous PET as observed in continuous melt polycondensation (Mn: ~ 20000 g/mol) by
effective removal of reaction condensate EG and water due to constant regeneration of
specific surface (Helix stirrer).
Two catalysts system were studied: Antimony and Titanium complexes. The maximum
overall reaction rate of the Antimony catalyzed polycondensation was observed with
oligomeric end group balance (COOH/(COOH+OH)) in the range of 0.2 to 0.3; while titanium
based catalyst have shown optimal reaction rate with decreasing (COOH/(COOH+OH)) balance
and optimum towards zero, which means oligomers with only ester‐end groups exhibits
maximum reaction rate.
The polycondensation model was developed by considering esterification and
transesterification reactions, side reactions such as formation of vinyl‐ester and acetaldehyde,
coupled with antimony inhibition factor considered from literature and liquid‐vapor mass
transfer effect of EG and water. Using the model, the kinetics of the PET polymerization
including the side reactions, the chain length of the produced polymers with respect to
terminal group balance were well modeled.

Zusammenfassung der Dissertation
“Der Einfluss des Verhältnisses der OligomerEndgruppen auf die katalysierte
Polykondensation von Poly(ethylenterephthalat)”
Von
Himanshu Patel
Poly(ethylenterephthalat) – im folgenden PET – ist seit seiner Einführung in den 50er
Jahren des vorigen Jahrhunderts ein weit genutzter Kunststoff für die Faser‐ und
Verpackungsindustrie geworden. Heute wird es vornehmlich aus Terephthalsäure (TPA) und
Ethylenglykol (EG) hergestellt. Bei der PET‐Synthese erfolgt zunächst die primäre Veresterung
der TPA mit EG. Darauf folgt der Kettenaufbau sowohl durch die Reaktion zwischen Carboxyl‐
Gruppen (COOH) und Ester‐Endgruppen (OH) der Oligomeren (sekundäre Veresterung) und
simultan durch die Reaktion der Ester‐Endgruppen miteinander (Umesterung).
Die Hauptfaktoren, welche die Gesamtreaktionsgeschwindigkeit beeinflussen, sind
neben den Katalysatoren die Temperatur, der Druck, die Diffusionsgeschwindigkeit der
flüchtigen Reationsprodukte, aber auch das Verhältnis der Reaktanten, d.h. das Verhältnis der
Endgruppen COOH/(COOH + OH). Der Einfluss der vier erstgenannten Faktoren ist in der
Literatur vielfach beschrieben, weniger jedoch der Effekt des o. g. Endgruppen‐Verhältnisses in
der Schmelzphasen‐Polykondensation. Dieser ist insofern von Bedeutung, da Batch‐Reaktoren
und kontinuierlich arbeitende Anlagen unterschiedliche Oligomerstrukturen erzeugen. Insofern
ist die Übertragung von kinetischen Information zur der Schmelzepolykondensation vom Labor
auf Großanlagen zusätzlich erschwert.
Das Ziel dieser Arbeit war es, den Einfluß dieses Endgruppen‐Verhältnisses auf die
Reaktionsgeschwindigkeiten der sekundären Veresterung und Umesterung, aber auch des
Gesamtumsatzes bei der Verwendung verschiedener Katalysatoren zu messen und zu
berechnen. Eine wesentliche Voraussetzung dieser Studien war die Herstellung von Oligomeren
mit definierten Endgruppenverhältnissen in der primären Veresterung als Ausgangspunkt der
Schmelzphasen‐Polykondensation.
Um die Endgruppenverhältnisse der Oligomeren definiert einzustellen, wurde die
primäre Veresterung bei verschiedenen EG/TPA‐Molverhältnissen und bei verschiedenen
Drücken in einem Semi‐Batch‐Reaktor durchgeführt. Das entstehende Wasser wurde
abdestilliert, die im Reaktionssystem verbleibende Menge EG wurde durch den Druck und
somit vom Rückfluss der Kolonne gesteuert. Dadurch konnte die Menge EG in der flüssigen
Phase auch während der Reaktion gesteuert und eine breitere Variation der Oligomeren‐
Endgruppen erzielt werden. Auf diese Weise konnte auch solche Oligomerstrukturen
hergestellt werden, wie sie bei der primären Verseterung in kontinuierlichen Anlagen erzeugt
und als Ausgangspunkt für die kontinuierliche Schmelzphasen‐Polykondensation dienen.
Der erste Schritt der pimären Veresterung ist die Auflösung der festen TPA in EG. bzw.
in den gebildeten Veresterungsprodukten. Dadurch sind die weiteren Reaktionsschritte von der
Auflösungsgeschwindigkeit der TPA beeinflußt. Diese wiederum hängt von der spezifischen
Oberfläche der TPA, d.h. von der aktuellen Korngrößenverteilung der TPA‐Kristalle und damit
vom Grad der Auflösung der TPA ab.
Aus diesem Grunde wurde der Einfluss der Korngrößenverteilung auf die
Geschwindigkeit der primären Veresterung durch ein neu entwickeltes Modell für die primäre
Veresterung simuliert. Dieses Modell berücksichtigt neben der spezifischen Oberfläche die
einzelnen Veresterungsreaktionen und die Massenübergänge fest‐flüssig für die TPA und
flüssig‐gas für EG und Wasser. Es konnte gezeigt werden, daß die Korngrößenverteilung einen
steigenden Einfluß auf die Veresterungsgeschwindigkeit besitzt, wenn das Molverhältnis
EG/TPA kleiner wird.
Die gezielt synthetisierten Oligomere wurden im Vakuum bis zu einem
Molekulargewicht polykondensiert, wie es in kontinuierlichen Anlagen in der Schmelzphasen‐
Polykondensation üblich ist (ca. 20000 g/mol). Dies gelang durch eine effektive Überführung
von EG und Wasser in die Gasphase mit Hilfe von Vakuum (ca. 0,1 mbar) und der ständigen
Erneuerung der Oberfläche (Spiralrührer).
Es wurden zwei Katalysatorsysteme untersucht: Antimon‐ und Titanverbindungen. Die
maximale Gesamtreaktions‐geschwindigkeit der Antimon‐katalysierten Polykondensation
erzielt man mit COOH/(COOH + OH)‐Verhältnissen der Oligomeren zwischen 0,2 bis 0,3. Bei der
hier verwendeten Titanverbindung steigt die Reaktionsgeschwindigkeit mit abnehmendem
COOH/(COOH+OH)‐Verhältnis an, das Optimum liegt bei Null. Das heißt, das Oligomer sollte
nur Ester‐Endgruppen besitzen.
Das in der Arbeit vorgestellte Modell zur Beschreibung der Polykondensation enthält
die Veresterungs‐ und Umsterungs‐Reaktionen, Zerfallsreaktionen zu Vinylester und
Acetaldehyd, einen von der Literatur bereits eingeführten Antimon‐Inhibition‐Faktor und die
Massenübergänge flüssig‐gas für EG und Wasser. Die Kinetik der PET‐Polykondensation,
einschließlich der Teilreaktionen, die Kettenlänge und das Endgruppenverhältnis des APET
konnten durch das Modell gut beschrieben werden.
i
Contents Abstract of Dissertation.................................................................................................................................III
Abstract of Dissertation (Deutsch) ............................................................................................................V
Chapter 1: Poly(Ethylene Terephthalate) – Chemistry and Production Technology..……………………………………….…………………………………………………………………….4
History and economical importance……...................................................................................................4
Chemistry...............................................................................................................................................................4
Esterification/Hydrolysis...................................................................................................................5
Transesterification/Glycolysis.........................................................................................................6
Etherification..........................................................................................................................................6
Thermal Degradation..........................................................................................................................7
Acetaldehyde Generation...................................................................................................................8
PET production by melt‐polymerization...................................................................................9
References............................................................................................................................................19
Chapter 2: Experimental Details..........................................................................................................21
Materials...............................................................................................................................................21
Reactor specification and experimental procedure...........................................................21
Experiment optimization...............................................................................................................23
Esterification phase............................................................................................................23
Polycondensation phase....................................................................................................24
Evaluation of experimental results...........................................................................................26
Determination of intrinsic viscosity. ...........................................................................26
Determination of carboxyl end groups of the resin................................................27
Determination of diethylene glycol (DEG)…………………………………………….27
Determination of water in reaction byproduct mixture…………………………..27

ii
Chapter 3: Semibatch Esterification Process for PET Synthesis………………….………..28
Abstract.................................................................................................................................................28
Introduction........................................................................................................................................29
Experimental method......................................................................................................................31
Results and discussion....................................................................................................................32
Mathematical model..........................................................................................................32
Influence of monomer feed ratio on water generation rate……………….…….40
Influence of monomer feed ratio on carboxyl fraction………………………….....41
Influence of monomer feed ratio on chain length and molecular weight......42
Influence of monomer feed ratio on conversion………….………………………......44
Different functional group concentration profile during esterification phase………………………………………………………………………………………………….…..45
Influence of TPA particle size on conversion…………………………………………..46
Influence of monomer feed ratio on DEG formation………………………………..48
Conclusion............................................................................................................................................48
Nomenclature.....................................................................................................................................49
Appendix...............................................................................................................................................50
References............................................................................................................................................51
Chapter 4: Influence of Reaction Pressure on Semibatch Esterification Process of
PET Synthesis..................................................................................................................................................53
Abstract.................................................................................................................................................53
Introduction........................................................................................................................................54
Experimental method......................................................................................................................54
Results and discussion....................................................................................................................56
Conclusion............................................................................................................................................68
Nomenclature.....................................................................................................................................69
References............................................................................................................................................70

iii
Chapter 5: Influence of Oligomeric Carboxyl and Hydroxyl Group Balance on
Catalyzed Polycondensation of PET Synthesis.............................................................................71
Abstract.................................................................................................................................................71
Introduction........................................................................................................................................72
Experimental method......................................................................................................................73
Results and discussion....................................................................................................................76
Conclusion............................................................................................................................................86
Nomenclature.....................................................................................................................................87
References............................................................................................................................................88
Appendix............................................................................................................................................................89
Curriculum Vitae……....................................................................................................................................93
4
Chapter 1: Poly(ethylene terephthalate) ‐ Chemistry and Production
Technology
History and economical importance
Polyesters are now one of the economically most important class of polymers in use today
and one of the widely applied polyester is PET. In the last century, pioneering work of
Carothers and his research group elucidated the fundamental principle of condensation
process and synthesized true aliphatic polyesters in 1930.1 However, the development of
aliphatic polyester did not earn him the commercial success due to their melting points
being too low for their practical utility. In 1940, Whinfield initiated research on making
polyester from terephthalic acid and ethylene glycol at Calico Printers Association (CPA) in
UK and came with success and filed the patent.2,3,4 DuPont acquired the Whinfield and
Dickson patent of polyester fiber in the USA while ICI possessed the patent license for the
rest of the world. Initially, DuPont commercialized the process for continuous
polymerization of PET in 1952.5 However, until 1963 most PET was made by a discontinuous
polymerization process. In 1962, Zimmer developed an integrated continuous ester
interchange and polycondensation process.6 Excellent properties and reasonable price of
PET fibers attracted fast development of the resin production technology. With a global
production of >40 million tones per annum, PET is considered as a one of the leading
polymer resins in the recent times. About 63% of PET is used as fibers in staple, filament and
woven forms while the remaining 37% is used as a packaging resin for bottles, containers,
sheet and film. Global growth rates for PET usage in fibers and packaging are estimated
around 4% and 8% per year, respectively.7 The growth for packaging application is due to a
very favorable image of environmentally friendly and recyclable polymers in western
countries, while for textile applications is due to a strong demand in the far‐east area to
meet the needs of an increasing economy and population.8
Chemistry
Polyesters are defined as polymers containing at least one ester‐linking group per repeating
unit.8 PET formation involves two main reactions, esterification of carboxyl end groups with
hydroxyl end groups and transesterification of glycolesters with terminal hydroxyl group.

5
Additionally, ester interchange reaction of ester groups and reaction of carboxyl groups with
bound ester groups (acidolysis) also takes place. However, the quality of the polymer is also
affected by several side reactions such as diethylene glycol (DEG) formation, thermal
scission of diester group, acetaldehyde and cyclic oligomers formation reactions.
Esterification/Hydrolysis
Esterification reaction is the key reaction and occurs at all stages in PET synthesis. It is
coupled with reverse reaction being hydrolysis. Esterification/hydrolysis reactions have an
equilibrium constant about 1.25 and proceed via AAC2 mechanism (scheme 1.1 and scheme
1.2). This reaction is a proton catalyzed reaction with an overall order of 3 (2 with respect to
acid and 1 with respect to alcohol).9 Although acid is an efficient catalyst for esterification
reaction, Titanium based catalysts are also found to be very active for the same. Otton and
Ratton10 studied the influence of the nature of the carboxylic acid on the reaction rate and
concluded that the different reactivity of carboxylic acid among terephthalic acid (TPA),
isopthalic acid (IPA) and oligomers is influenced by steric and electronic conditions of the
carboxyl groups. The esterification rate constant is dependent on the pKa of the carboxylic
acid.
COOH HOC2H4OH COOC2H4OH+ + H2O
Scheme 1.1 Generation of prepolymer with terminal hydroxyl by esterification of acid with
EG.
HOC2H4OOCCOOH
COOC2H4OOC
+
+ H2O
Scheme 1.2 Chain propagation by esterification of acid with hydroxyl terminated
prepolymer.
6
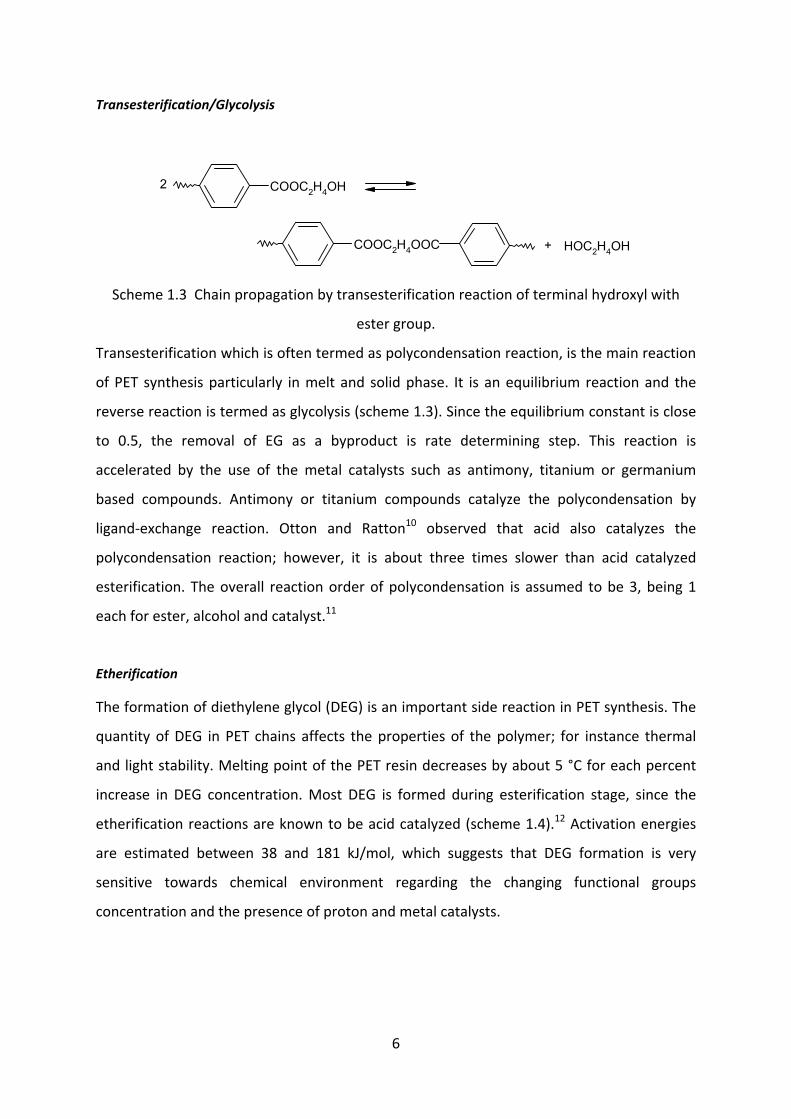
Transesterification/Glycolysis
COOC2H4OH
HOC2H4OHCOOC2H4OOC +
2
Scheme 1.3 Chain propagation by transesterification reaction of terminal hydroxyl with
ester group.
Transesterification which is often termed as polycondensation reaction, is the main reaction
of PET synthesis particularly in melt and solid phase. It is an equilibrium reaction and the
reverse reaction is termed as glycolysis (scheme 1.3). Since the equilibrium constant is close
to 0.5, the removal of EG as a byproduct is rate determining step. This reaction is
accelerated by the use of the metal catalysts such as antimony, titanium or germanium
based compounds. Antimony or titanium compounds catalyze the polycondensation by
ligand‐exchange reaction. Otton and Ratton10 observed that acid also catalyzes the
polycondensation reaction; however, it is about three times slower than acid catalyzed
esterification. The overall reaction order of polycondensation is assumed to be 3, being 1
each for ester, alcohol and catalyst.11
Etherification
The formation of diethylene glycol (DEG) is an important side reaction in PET synthesis. The
quantity of DEG in PET chains affects the properties of the polymer; for instance thermal
and light stability. Melting point of the PET resin decreases by about 5 °C for each percent
increase in DEG concentration. Most DEG is formed during esterification stage, since the
etherification reactions are known to be acid catalyzed (scheme 1.4).12 Activation energies
are estimated between 38 and 181 kJ/mol, which suggests that DEG formation is very
sensitive towards chemical environment regarding the changing functional groups
concentration and the presence of proton and metal catalysts.

7
COOC2H4OH HOC2H4OH
COOH HOC2H4OC2H4OH+
+
COOC2H4OH HOC2H4OOC
COOH HOC2H4OC2H4OOC
+
+
COOC2H4OH HOC2H4OC2H4OOC
HOC2H4OC2H4OHCOOC2H4OOC
+
+
Scheme 1.4 Different mechanisms for the DEG formation.
Thermal Degradation
Thermal degradation of PET has major influence on the PET quality by affecting the
molecular weight, formation of acid end groups and acetaldehyde, and yellowing of the
polymer. Thermal degradation becomes more visible at temperatures above the melting
point, which is inevitable during synthesis and processing. These reactions are mainly
influenced by metal catalyst such as zinc, cobalt and nickel. However, degradation reactions
could be reduced by addition of triarylphosphites or triarylphosphates blocking the metal
ions. Any small traces of oxygen can also accelerate the thermo‐oxidative degradation.
Thermal ester degradation is a first order reaction.

8
COOC2H4OOC
COOH CH2=CHOOC+
Scheme 1.5 Thermal degradation of internal ester link.
Acetaldehyde Generation
Acetaldehyde migration even in the concentration as low as few ppm causes flavor in the
PET bottled soft drinks.13 Thermal scission of ester bond generates terminal vinyl group
and/or acid (scheme 1.5 and scheme 1.6). However, the transesterification of terminal vinyl
group liberates acetaldehyde (scheme 1.7). Sufficient amounts of hydroxyl groups will
esterify the acid groups as well as transesterify the vinyl groups and that reforms the broken
ester group with additional acetaldehyde generation. As the hydroxyl concentration drops,
the molecular weight will begin to fall due to excess of carboxyl and vinyl group
accumulation.
COOC2H4OH COOH CH3CHO+
Scheme 1.6 Acetaldehyde generation by thermal degradation of terminal hydroxyl group.
COOCH=CH2 HOC2H4OOC
COOC2H4OOC CH3CHO+
+
Scheme 1.7 Acetaldehyde generation by thermal degradation of terminal hydroxyl group.
9
PET production by melt‐polymerization
PET is polyester formed by step‐growth polycondensation mainly from terephthalic acid
(TPA) and ethylene glycol (EG). More than 90% of PET production is based on TPA and EG
route because of the economical benefits. The rest of the PET production is based on
dimethyl terephthalate (DMT) and EG. Since TPA of sufficient purity was not available in the
early days, the DMT route was the only process used in commercial production of PET.
However, the process based on TPA became popular since late 1960s due to possible
purification of TPA by recrystallization. Process based on TPA and EG offers several
advantages over the DMT and EG route. Process based on TPA offers higher reaction rates,
lower storage and transport cost of TPA compared to DMT due to TPA being in powder form
while DMT is stored molten in insulated heated tanks and is shipped also in molten form,
lower treatment cost due to water produced as byproduct instead of methanol, self
catalyzed esterification reaction which reduces the needs for external esterification
catalyst.16
A basic difference between the preparation of PET from DMT and EG, or from TPA and EG,
consists in that TPA does not melt by itself at the temperatures used throughout the
polymerization path. Esterification of TPA with EG is required to homogenize the reaction
mixture in the first esterification reactor. The process based on TPA and EG route consists of
two stages. In the first stage, TPA is esterified with excess EG under pressure at 230 – 270 °C
with elimination of water, yielding prepolymer consisting bis‐2 hydroxy ethylene
terephthalate (BHET) and short chain oligomers. In the second stage, the prepolymer is then
heated to 270‐ 290 °C under progressively reduced pressure until excess EG is eliminated
and high mol mass PET is obtained. The formation of PET involves two main reactions, (1)
esterification of carboxyl end groups of TPA with the hydroxyl end groups of EG or of esters
and (2) polycondensation of esters with terminal hydroxyl groups. For the applications such
as bottles or technical yarns where the high strength properties are required, further
polymerization in solid state (SSP) is performed under vacuum or in an inert gas
atmosphere. The global market of PET is mostly dominated by the two common grades, i.e.
fiber‐grade PET and bottle‐grade PET. These grades differ mainly in molecular weight and
are described in the Table 1.1.14

Fila
Table 1.1
Prope
Acid
Ash, p
Meta
Wate
4‐For
p‐Tol
C
Sp
H
H
Ig
Textile application
Melt
Mn < 2100
ment
: Molecula
Table 1.2 :
erty
number, mg
ppm
als, ppm
er, wt%
rmylbenzoic
uic acid, pp
Table 1
rystal densi
pecific heat
eat of form
eat of com
gnition temp
n
00
Fiber
r weights of
: Specificati
g KOH g‐1
c acid, ppm
pm
.3 : Physica
ity, g cm‐3, 2
t, J g‐1 K‐1, to
mation, kJ m
bustion, kJ
perature in
Melt
Mn < 25000
Technical yarns
10
f PET resins
on and ana
Specific
675 ± 2
≤ 15
≤ 9
≤ 0.2
≤ 25
125 ± 4
l properties
25 °C
o 100 °C
ol‐1
mol‐1, 25 °C
air, °C
Techapplic
0High Vi
finis
Me
Mn < 4
s according
lysis of TPA
cation
2
45
s of TPA (pu
1.58
1.2
‐816
C 3189
680
nical cation
iscosity sher
elt
40000
M
M
Technicayarns, tyre
cord
to their app
A (purified)16
Typical val
673‐675
< 3
< 2
0.1
15
125
urified)16
8
6
9
Chips
Mn ~ 20000
Solid state poly.
Mn < 40000
l e
plications15
6
ue
Bottlapplica
Chip
Mn ~ 20
Solid state
Mn ~ 2502800
Bottle grador technica
le tion
ps
0000
e poly.000 to 00
de chips al yarns
11
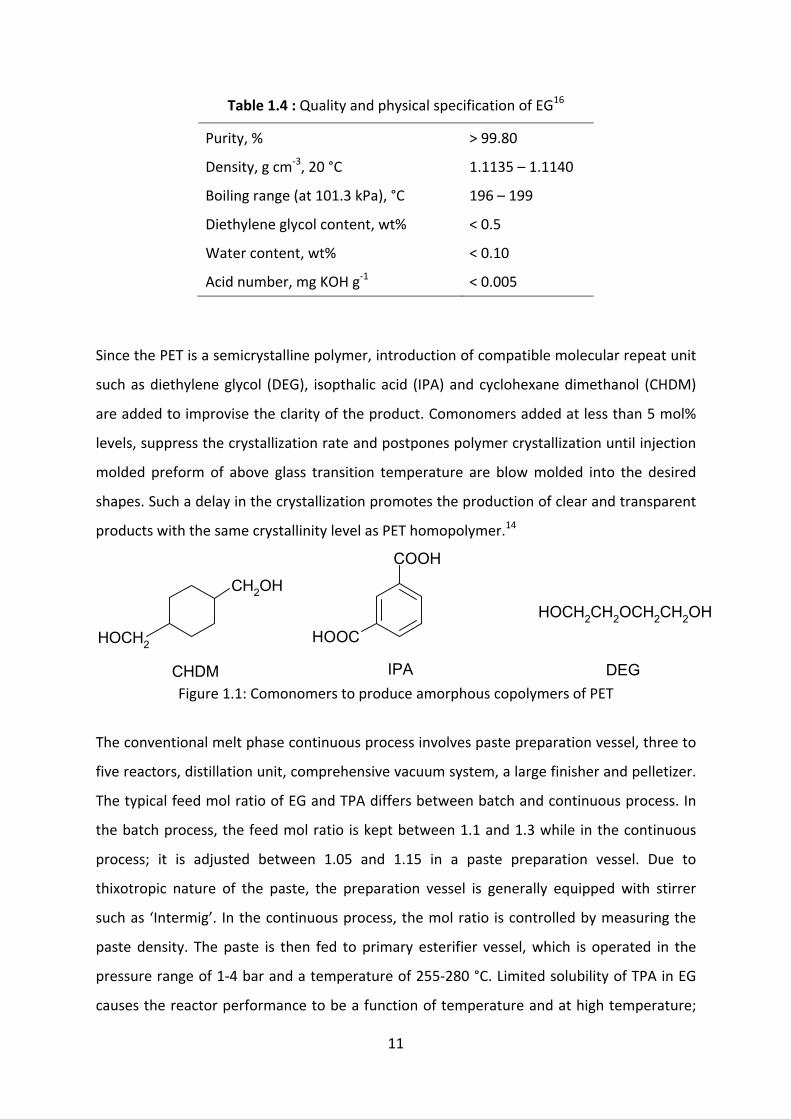
Table 1.4 : Quality and physical specification of EG16
Purity, % > 99.80
Density, g cm‐3, 20 °C 1.1135 – 1.1140
Boiling range (at 101.3 kPa), °C 196 – 199
Diethylene glycol content, wt% < 0.5
Water content, wt% < 0.10
Acid number, mg KOH g‐1 < 0.005
Since the PET is a semicrystalline polymer, introduction of compatible molecular repeat unit
such as diethylene glycol (DEG), isopthalic acid (IPA) and cyclohexane dimethanol (CHDM)
are added to improvise the clarity of the product. Comonomers added at less than 5 mol%
levels, suppress the crystallization rate and postpones polymer crystallization until injection
molded preform of above glass transition temperature are blow molded into the desired
shapes. Such a delay in the crystallization promotes the production of clear and transparent
products with the same crystallinity level as PET homopolymer.14
CH2OH
HOCH2 HOOC
COOH
HOCH2CH2OCH2CH2OH
CHDM IPA DEGFigure 1.1: Comonomers to produce amorphous copolymers of PET
The conventional melt phase continuous process involves paste preparation vessel, three to
five reactors, distillation unit, comprehensive vacuum system, a large finisher and pelletizer.
The typical feed mol ratio of EG and TPA differs between batch and continuous process. In
the batch process, the feed mol ratio is kept between 1.1 and 1.3 while in the continuous
process; it is adjusted between 1.05 and 1.15 in a paste preparation vessel. Due to
thixotropic nature of the paste, the preparation vessel is generally equipped with stirrer
such as ‘Intermig’. In the continuous process, the mol ratio is controlled by measuring the
paste density. The paste is then fed to primary esterifier vessel, which is operated in the
pressure range of 1‐4 bar and a temperature of 255‐280 °C. Limited solubility of TPA in EG
causes the reactor performance to be a function of temperature and at high temperature;

12
the reactor performance is limited by the solid‐liquid mass transfer rate. Under these
conditions, the reactor performance depends on the TPA particle size.17 The average chain
length of the esterified oligomers and carboxyl content are mainly controlled by the feed
mol ratio and temperature. Oligomers are further passed through secondary esterifier that
normally runs at atmospheric pressure and at high temperature compare to primary
esterifier. The major task of the secondary esterifier is to complete the dissolution of TPA
and to have the homogeneous slurry. The product of secondary esterifier is fed by gravity to
the pre‐polymerizer, which operates at a medium vacuum pressure. Excess of EG and water
remained in the polymer are removed in this stage. Pre‐polymer with intrinsic viscosity of
about 0.2 dl/g is pumped by gear pumps through a filter into the intermediate polymerizer
and finally to the finisher. Both reactors operate under low vacuum pressure close to 1
mbar. Horizontal stirrer is installed in these reactors to generate a large polymer surface
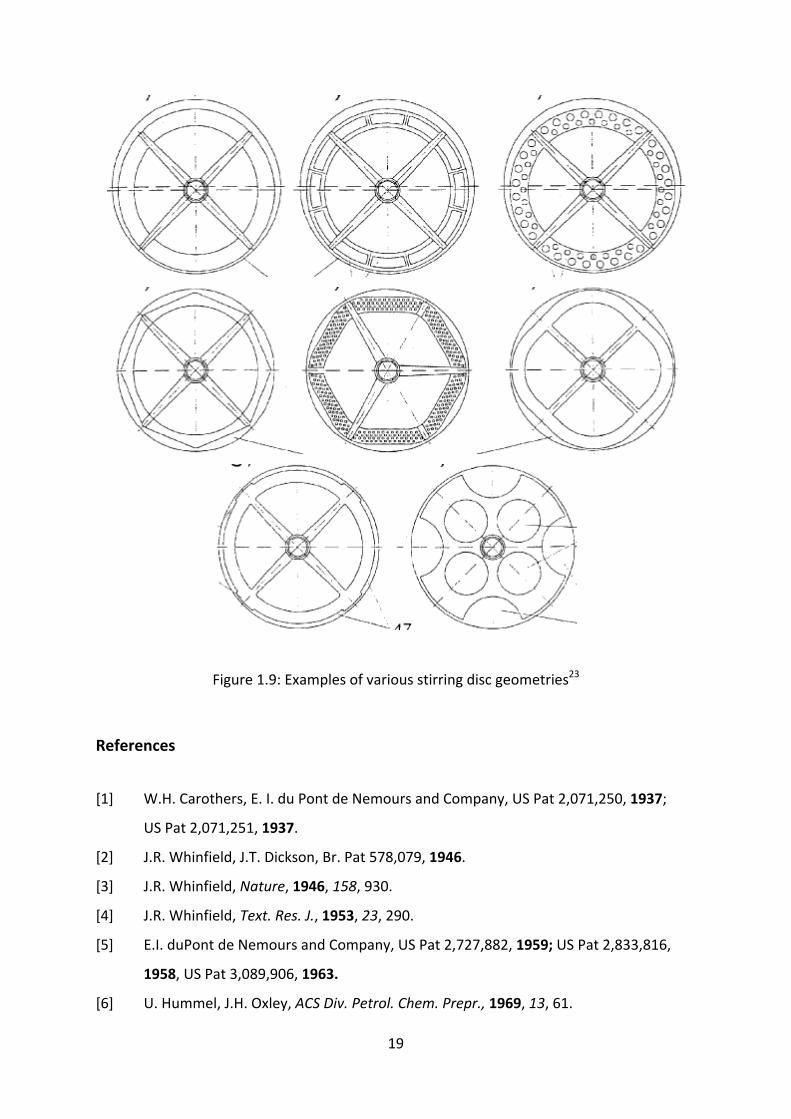
area. Engineering companies uses different sitter types on their proprietary bases (Figure
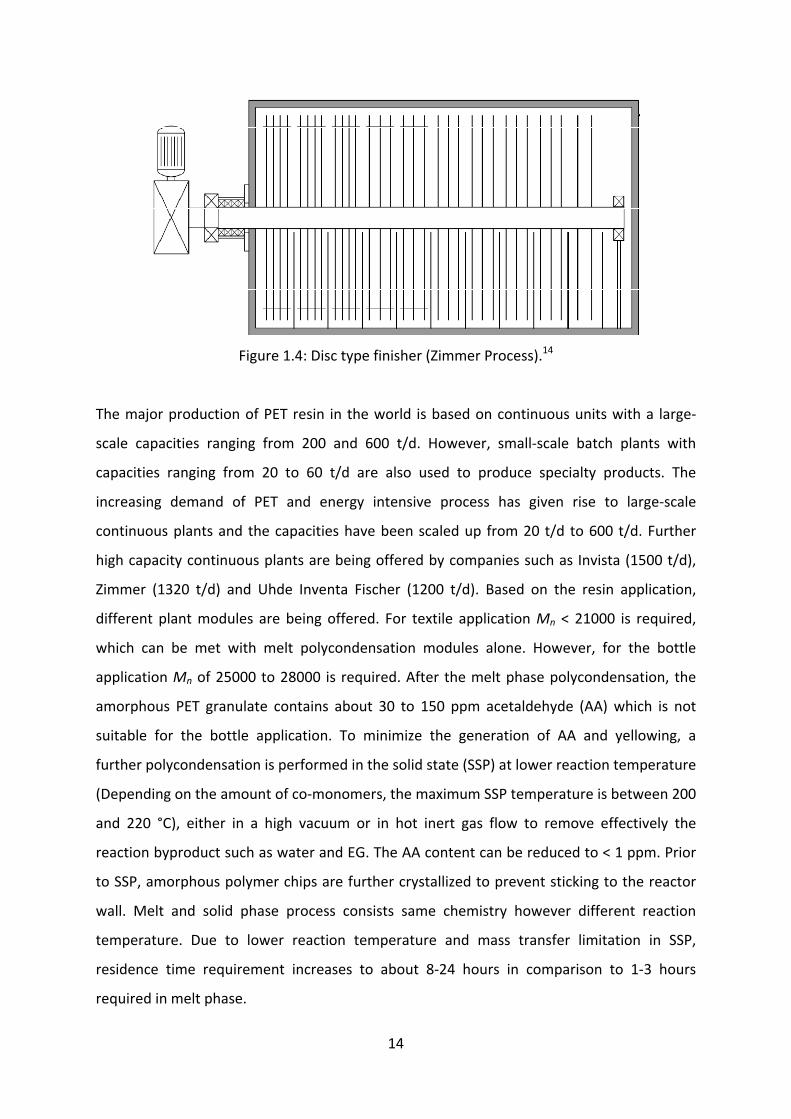
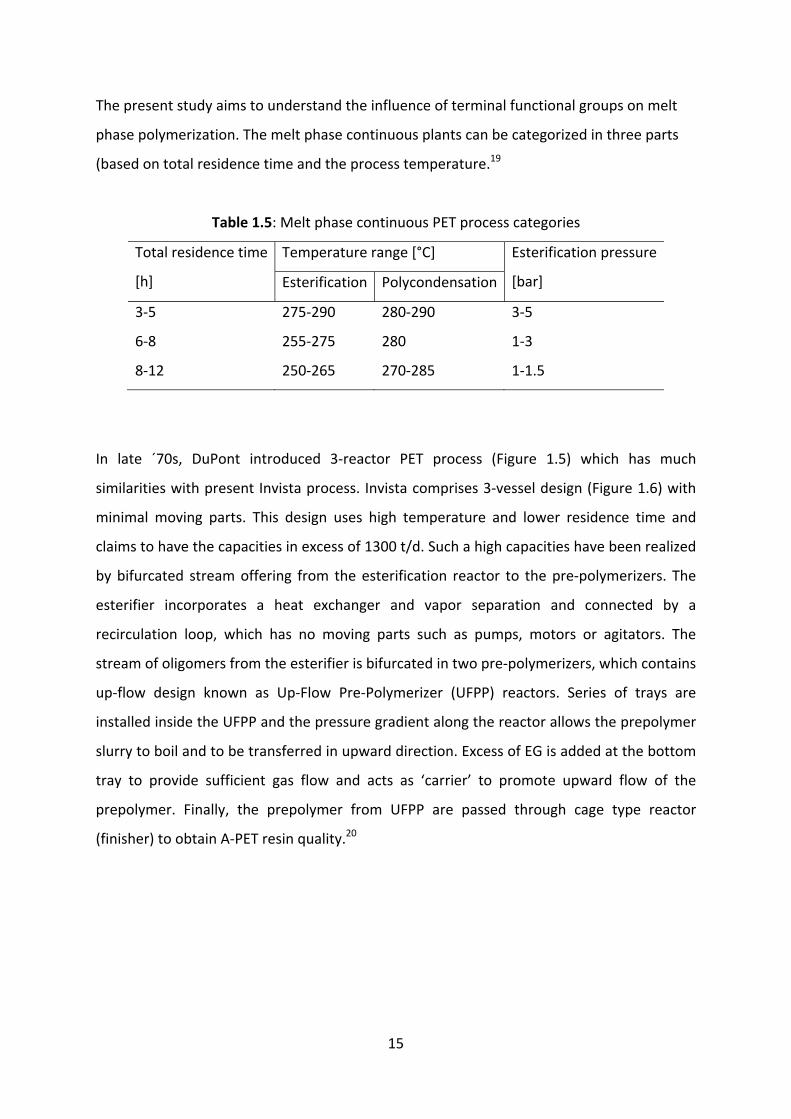
1.9). However, cage (Figure 1.3) or disc type (Figure 1.4) reactors are the most common and
provide plug flow transport with little back mixing which further facilitate narrow residence
time distribution and higher average chain length. The cage type finisher is built on shaftless
design, which is claimed to improve the product quality by avoiding polymer sticking to a
shaft. It is heated by heat‐transfer medium flowing through a jacket, which causes higher
temperature at the reactor wall than the temperature of the polymer melt. A few millimeter
of clearance between the cage stirrer and the reactor wall provides a good heat transfer.18
The disc‐type finisher is heated mainly by stirring through shearing of the high‐viscosity
melt. The temperature of the reactor wall is lower than the temperature of the polymer
melt, which is claimed to improve the product quality by avoiding the polymer overheating
at the reactor wall. The melt intrinsic viscosity is measured by the viscometer at the outlet
of the polymer discharge pump and the desired degree of polycondensation can be set by
adjusting the vacuum, reaction temperature and the average residence time in the finisher.
The melt viscosity in the polycondensation phase increases from approximately 0.8 to 400
Pa s. Such a high melt viscosity and degradation reactions overtake the polycondensation
reaction and limit the molecular weight. For this reason, solid‐state polycondensation is
commonly used.
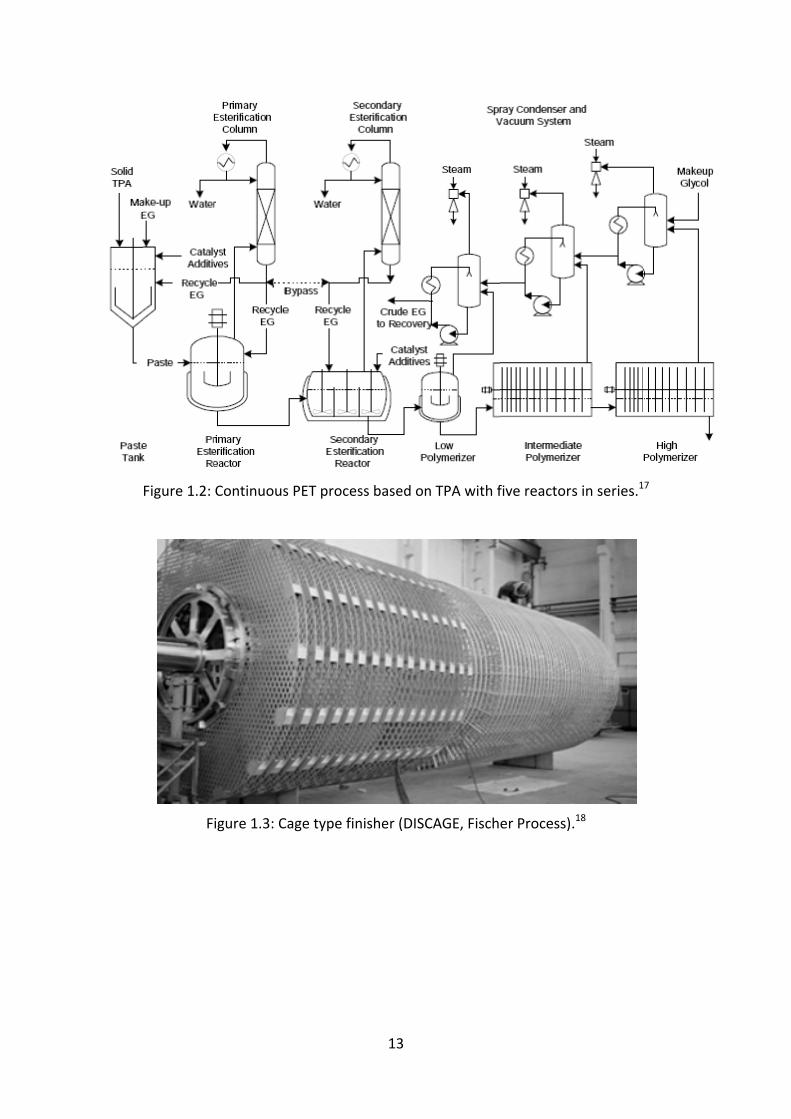
Figure 1.2:
Fi
Continuous
igure 1.3: C
s PET proce
Cage type fin
13
ss based on
nisher (DISC
n TPA with f
CAGE, Fisch
five reactor
er Process)
s in series.1
.18
7
14
Figure 1.4: Disc type finisher (Zimmer Process).14
The major production of PET resin in the world is based on continuous units with a large‐
scale capacities ranging from 200 and 600 t/d. However, small‐scale batch plants with
capacities ranging from 20 to 60 t/d are also used to produce specialty products. The
increasing demand of PET and energy intensive process has given rise to large‐scale
continuous plants and the capacities have been scaled up from 20 t/d to 600 t/d. Further
high capacity continuous plants are being offered by companies such as Invista (1500 t/d),
Zimmer (1320 t/d) and Uhde Inventa Fischer (1200 t/d). Based on the resin application,
different plant modules are being offered. For textile application Mn < 21000 is required,
which can be met with melt polycondensation modules alone. However, for the bottle
application Mn of 25000 to 28000 is required. After the melt phase polycondensation, the
amorphous PET granulate contains about 30 to 150 ppm acetaldehyde (AA) which is not
suitable for the bottle application. To minimize the generation of AA and yellowing, a
further polycondensation is performed in the solid state (SSP) at lower reaction temperature
(Depending on the amount of co‐monomers, the maximum SSP temperature is between 200
and 220 °C), either in a high vacuum or in hot inert gas flow to remove effectively the
reaction byproduct such as water and EG. The AA content can be reduced to < 1 ppm. Prior
to SSP, amorphous polymer chips are further crystallized to prevent sticking to the reactor
wall. Melt and solid phase process consists same chemistry however different reaction
temperature. Due to lower reaction temperature and mass transfer limitation in SSP,
residence time requirement increases to about 8‐24 hours in comparison to 1‐3 hours
required in melt phase.
15
The present study aims to understand the influence of terminal functional groups on melt
phase polymerization. The melt phase continuous plants can be categorized in three parts
(based on total residence time and the process temperature.19
Table 1.5: Melt phase continuous PET process categories
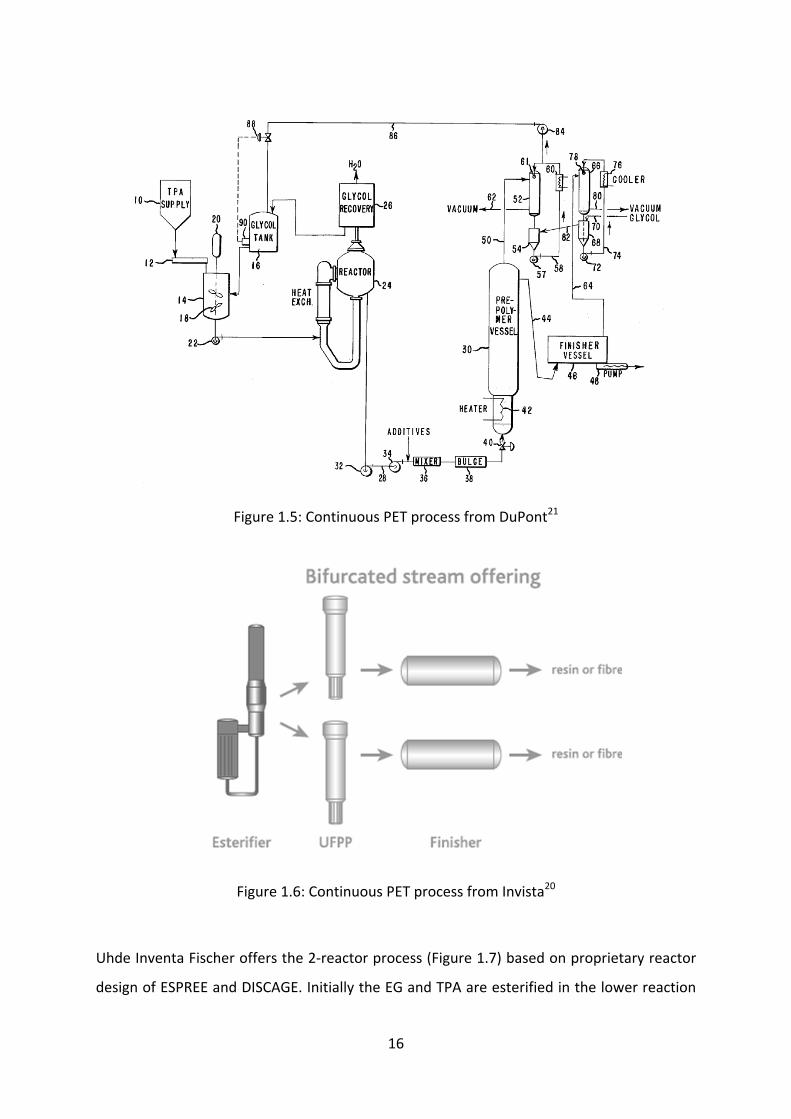
In late ´70s, DuPont introduced 3‐reactor PET process (Figure 1.5) which has much
similarities with present Invista process. Invista comprises 3‐vessel design (Figure 1.6) with
minimal moving parts. This design uses high temperature and lower residence time and
claims to have the capacities in excess of 1300 t/d. Such a high capacities have been realized
by bifurcated stream offering from the esterification reactor to the pre‐polymerizers. The
esterifier incorporates a heat exchanger and vapor separation and connected by a
recirculation loop, which has no moving parts such as pumps, motors or agitators. The
stream of oligomers from the esterifier is bifurcated in two pre‐polymerizers, which contains
up‐flow design known as Up‐Flow Pre‐Polymerizer (UFPP) reactors. Series of trays are
installed inside the UFPP and the pressure gradient along the reactor allows the prepolymer
slurry to boil and to be transferred in upward direction. Excess of EG is added at the bottom
tray to provide sufficient gas flow and acts as ‘carrier’ to promote upward flow of the
prepolymer. Finally, the prepolymer from UFPP are passed through cage type reactor
(finisher) to obtain A‐PET resin quality.20
Total residence time
[h]
Temperature range [°C] Esterification pressure
[bar] Esterification Polycondensation
3‐5 275‐290 280‐290 3‐5
6‐8 255‐275 280 1‐3
8‐12 250‐265 270‐285 1‐1.5
Uhde In
design
nventa Fisch
of ESPREE a
Figure 1
Figure 1
her offers t
and DISCAG
.5: Continuo
1.6: Continu
the 2‐reacto
GE. Initially
16
ous PET pro
uous PET pro
or process (
the EG and
ocess from D
ocess from
(Figure 1.7)
d TPA are es
DuPont21
Invista20
) based on p
sterified in
proprietary
the lower
y reactor
reaction

chambe
under p
Oligom
pressur
gases a
boiling
achieve
vertical
outside
generat
similar
of abou
polyme
er of ESPRE
pressure an
ers flows d
re and with
as well as a
point oligo
ed. In the fo
tubes whi
e. Steady inc
tion and he
conditions
ut 40 is tran
erization.
Figure 1.7:
E tower (Fig
nd with def
down the s
h steady te
additional in
omers. The
ollowing film
ch form de
crease of th
eat exchang
like previou
nsformed by
Two reacto
gure 1.8). P
fined reside
sequence o
emperature
nert gas, w
product is
m chambers
efined films
he polycond
ge. The pro
us zone is a
y a pump in
ors single‐st
17
Produced ol
ence time ti
of the react
increase.
which furthe
then led to
s, feed cylin
s on the in
densation r
oduct is led
achieved. Pr
nto DISCAGE
tream PET p
ligomers are
ill their rele
tion cups b
Pressure re
er facilitate
o the flash
nders distri
ner tube su
reaction is a
d to second
repolymer w
E reactor to
process by U
e directed t
ease in the
by continuo
elease is ef
es intense b
zone where
butes the o
urface and
achieved by
d falling film
with degree
o obtain furt
Uhde Invent
to top of th
top reactio
ously releas
ffected by
back mixing
e lower pre
oligomers e
obtains he
y such high
m zone wh
e of polyme
ther high de
ta‐Fischer18
he tower
on cups.
sing the
reaction
g of low
essure is
venly to
eat from
surface
here the
erization
egree of
8
18
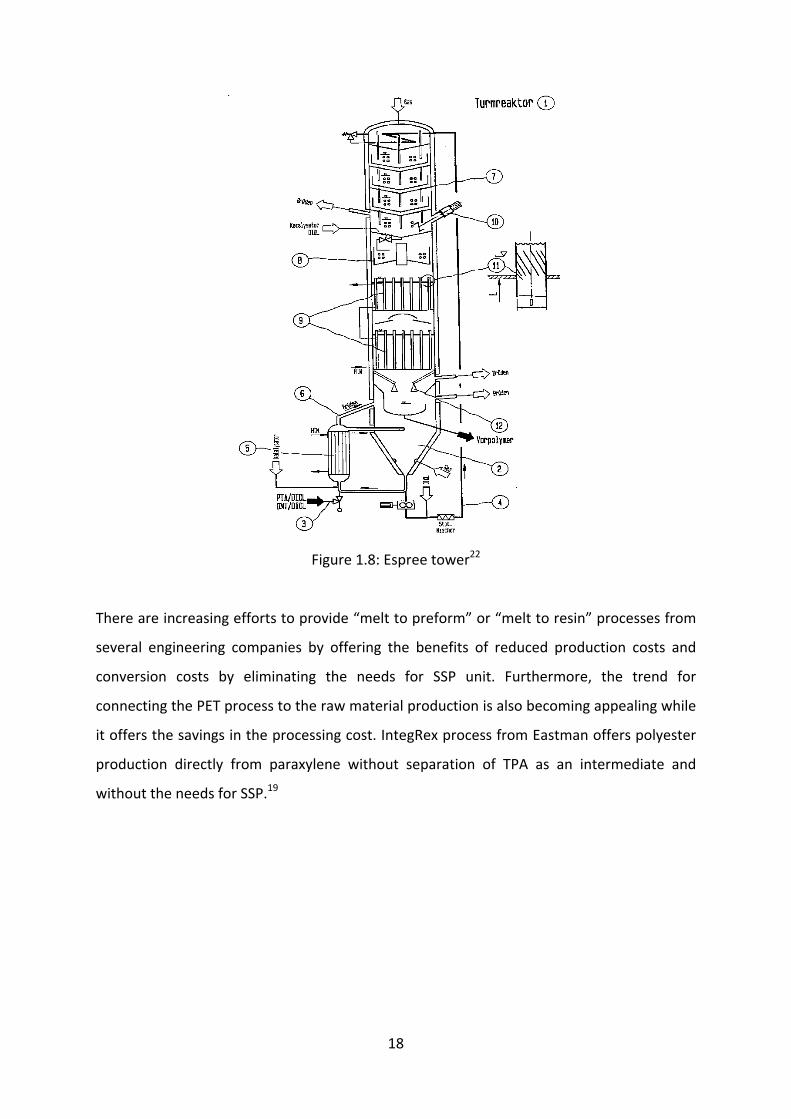
Figure 1.8: Espree tower22
There are increasing efforts to provide “melt to preform” or “melt to resin” processes from
several engineering companies by offering the benefits of reduced production costs and
conversion costs by eliminating the needs for SSP unit. Furthermore, the trend for
connecting the PET process to the raw material production is also becoming appealing while
it offers the savings in the processing cost. IntegRex process from Eastman offers polyester
production directly from paraxylene without separation of TPA as an intermediate and
without the needs for SSP.19
19
Figure 1.9: Examples of various stirring disc geometries23
References
[1] W.H. Carothers, E. I. du Pont de Nemours and Company, US Pat 2,071,250, 1937;
US Pat 2,071,251, 1937.
[2] J.R. Whinfield, J.T. Dickson, Br. Pat 578,079, 1946.
[3] J.R. Whinfield, Nature, 1946, 158, 930.
[4] J.R. Whinfield, Text. Res. J., 1953, 23, 290.
[5] E.I. duPont de Nemours and Company, US Pat 2,727,882, 1959; US Pat 2,833,816,
1958, US Pat 3,089,906, 1963.
[6] U. Hummel, J.H. Oxley, ACS Div. Petrol. Chem. Prepr., 1969, 13, 61.

20
[7] S. Beury, Chemical Market Associates Inc., 2006 World Terephthalates and Polyester
Analysis, August 31, 2005, http://www.cmaiglobal.com.
[8] M.E. Rogers, T.E. Long, Synthetic methods in step‐growth polymers, John Wiley &
Sons, 2003.
[9] A. Fradet, E. Marechal, Adv. Polym. Sci., 1982, 43, 51.
[10] J. Otton, S. Ratton, J. Polym. Sci., Part A: Polym. Chem. 1991, 29, 377.
[11] C.M. Fontana, J. Polym. Sci., Part A‐1, 1968, 6, 2343.
[12] J. W. Chen, L. W. Chen, J. Polym. Sci., Part A: Polym. Chem., 1998, 36, 3073.
[13] J. S. Schaul, Polymer Plast. Technol. Engng., 1981, 41, 209.
[14] J. Scheirs and T. E. Long, Modern Polyesters: Chemistry and Technology of Polyesters
and Copolyesters, John Wiley & Sons, 2003.
[15] E. Van Endert, Man‐made fiber year book (CTI), 1986.
[16] R.J. Sheehan, Ullmann Encyclopaedia, Wiley‐VCH Verlag GmbH & Co. KgaA, 2005.
[17] D. Tremblay, paper presented at the AIChE annual meeting, Houston Texas, March
14‐19, 1999.
[18] www.uhde‐inventa‐fishcer.com
[19] U. Thiele, Polyester Bottle Resins – Production, Processing, Properties and Recycling,
Vol. 5, PET planet print, 2007.
[20] http://ipt.invista.com
[21] E.I. duPont de Nemours and Company, US Pat 4,110,316, 1978.
[22] Uhde Inventa Fischer GmbH & Co. KG, Pat DE 101,554,19 A1, 2003.
[23] F. Wilhem and F. Finkeldei, Patent application publication, US 2003/0139543 A1,
2003.

21
Chapter 2: Experimental Details
Materials
The following materials are used in the experiments as well as in analysis of the samples.
Reactants: Terephthalic Acid (Equipolymers), Ethylene Glycol (Equipolymers), Diethylene
Glycol (CG Chemikalien) and Isophthalic Acid (Merck, purity > 99%) were used as received.
Catalysts: Antimony Triacetate (Atofina), Titanium Butalate (Fluka, purity > 97% gravimetric)
Ti based chealted catalyst (Equipolymers), Hydrotalcite (Sasol)
Additives: Tetramethylene Ammonium Hydroxide (Fluka), Cobalt Acetate (Equipolymers),
Phosphoric Acid (Merck, 85% aqueous solution)
Chemicals used for measuring carboxyl‐end group concentration:
O‐cresol (Merck), Chloroform (Merck), Potassium Hydroxide in Ethanol (Merck), Ethanol for
dilution (J.T. Baker, absolute), Bromophenol Blue (Merck, pH 3.0‐4.6) were used to titrate
carboxyl value of samples.
Chemicals used measuring intrinsic viscosity (IV):
1:1 mixture of Phenol and O‐dichloro Benzene (OSC OrganoSpezial Chemie GmbH, Water <
200 ppm)
Reactor specifications and experimental procedure
Volume: 1000 ml
Inner diameter: 101.6 mm
Inner depth: 137.16 mm
Maximum pressure: 70 bar
Maximum vacuum: 0.1 mbar
Maximum temperature: 350 °C
Split ring connector with PTFE gasket.
Magnetic drive: Maximum torque: 13 Nm; Stirring speed: 0‐180 rotation/min
22
Esterification line
P Polycondensation line
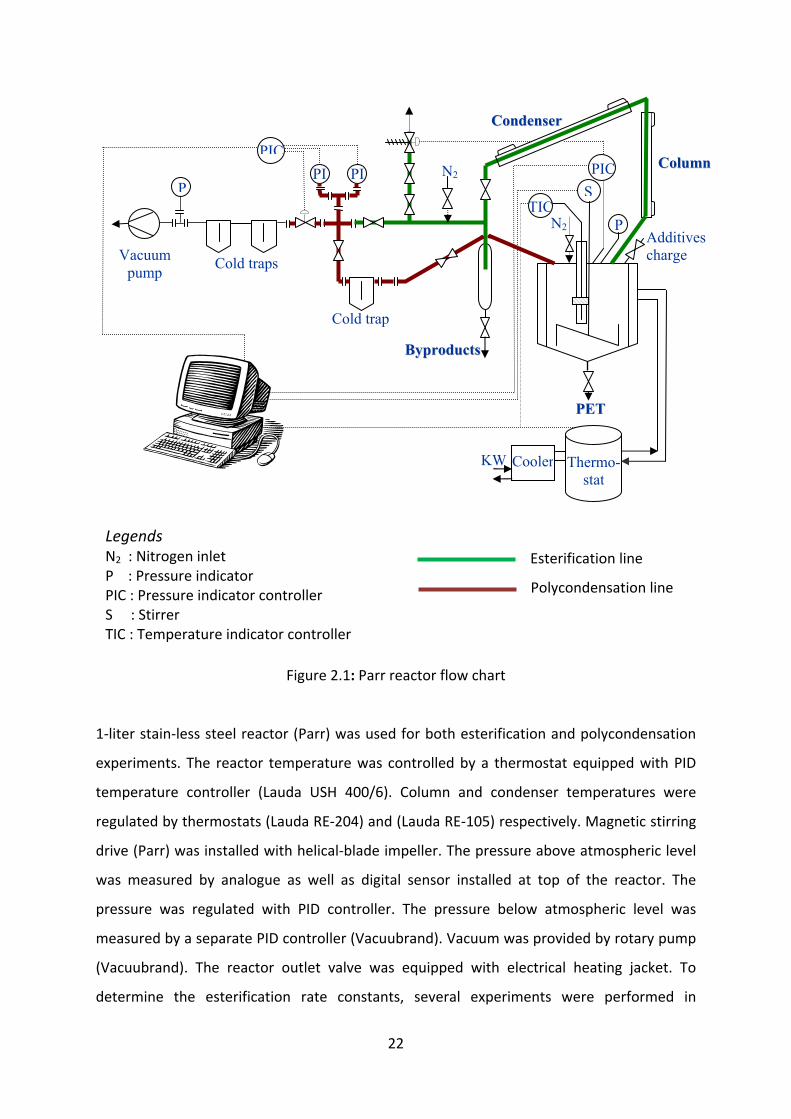
Figure 2.1: Parr reactor flow chart
1‐liter stain‐less steel reactor (Parr) was used for both esterification and polycondensation
experiments. The reactor temperature was controlled by a thermostat equipped with PID
temperature controller (Lauda USH 400/6). Column and condenser temperatures were
regulated by thermostats (Lauda RE‐204) and (Lauda RE‐105) respectively. Magnetic stirring
drive (Parr) was installed with helical‐blade impeller. The pressure above atmospheric level
was measured by analogue as well as digital sensor installed at top of the reactor. The
pressure was regulated with PID controller. The pressure below atmospheric level was
measured by a separate PID controller (Vacuubrand). Vacuum was provided by rotary pump
(Vacuubrand). The reactor outlet valve was equipped with electrical heating jacket. To
determine the esterification rate constants, several experiments were performed in
SN2
PPEETT
BByypprroodduuccttss
KW Cooler Thermo-stat
PIC
P N2
CCoolluummnn
CCoonnddeennsseerr
PPI PI
Vacuum pump
Cold trap
Cold traps
Additives charge
PIC
TIC
Legends N2 : Nitrogen inlet P : Pressure indicator PIC : Pressure indicator controller S : Stirrer TIC : Temperature indicator controller

23
Juchheim semibatch reactor of 5‐liter reaction volume. Details of the equipment and the
experimental procedure are presented in Chapter 3.
Figure 2.2: Experimental setup
Experiment optimization
Esterification phase
Esterification phase generally includes three phases. Solid TPA is dissolved in EG and liquid
reaction mass to be further reacted to form oligomers. At the same time, by product water
is evaporated from melt to vapor phase. Reactor performance can be affected by mass
transfer limitation if the solid TPA particles are relatively large, poor agitation in the reactor,
shorter residence time, reaction temperature and pressure. Influence of TPA particle size
and reaction pressure is discussed in chapter 3 and 4 respectively. Residence time of 95
minutes for the given esterification conditions was obtained since the resulted oligomers
24
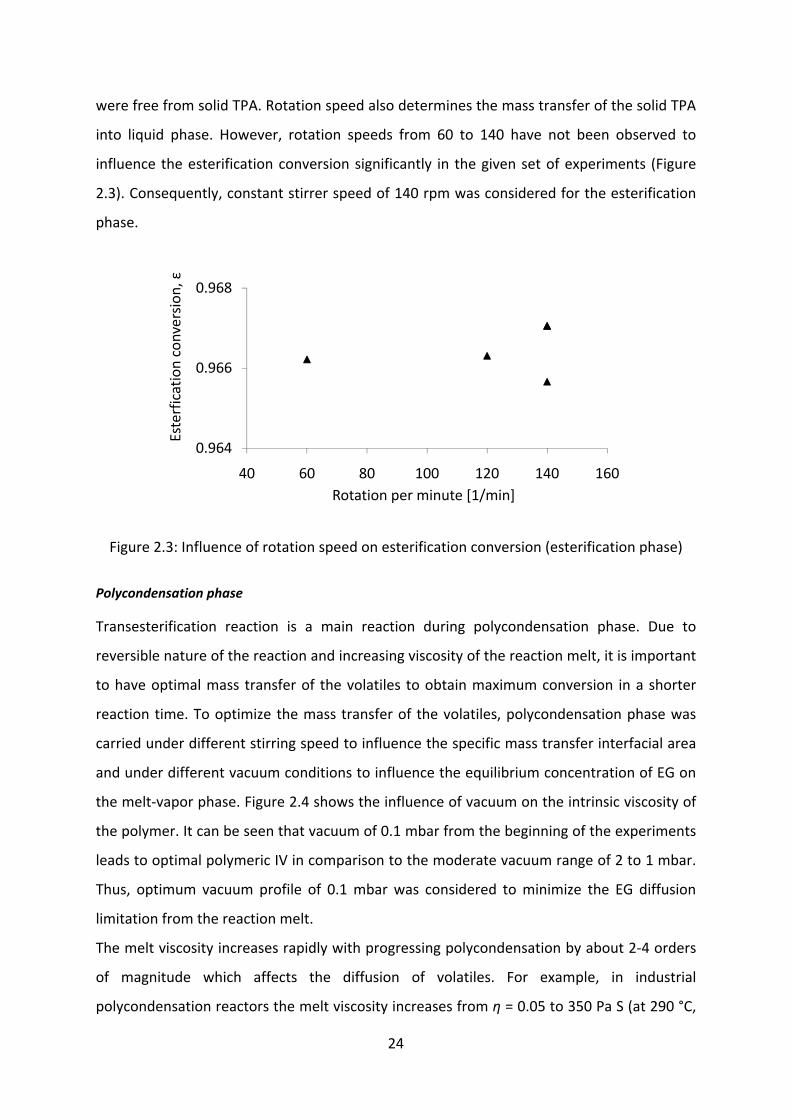
were free from solid TPA. Rotation speed also determines the mass transfer of the solid TPA
into liquid phase. However, rotation speeds from 60 to 140 have not been observed to
influence the esterification conversion significantly in the given set of experiments (Figure
2.3). Consequently, constant stirrer speed of 140 rpm was considered for the esterification
phase.
Figure 2.3: Influence of rotation speed on esterification conversion (esterification phase)
Polycondensation phase
Transesterification reaction is a main reaction during polycondensation phase. Due to
reversible nature of the reaction and increasing viscosity of the reaction melt, it is important
to have optimal mass transfer of the volatiles to obtain maximum conversion in a shorter
reaction time. To optimize the mass transfer of the volatiles, polycondensation phase was
carried under different stirring speed to influence the specific mass transfer interfacial area
and under different vacuum conditions to influence the equilibrium concentration of EG on
the melt‐vapor phase. Figure 2.4 shows the influence of vacuum on the intrinsic viscosity of
the polymer. It can be seen that vacuum of 0.1 mbar from the beginning of the experiments
leads to optimal polymeric IV in comparison to the moderate vacuum range of 2 to 1 mbar.
Thus, optimum vacuum profile of 0.1 mbar was considered to minimize the EG diffusion
limitation from the reaction melt.
The melt viscosity increases rapidly with progressing polycondensation by about 2‐4 orders
of magnitude which affects the diffusion of volatiles. For example, in industrial
polycondensation reactors the melt viscosity increases from η = 0.05 to 350 Pa S (at 290 °C,
0.964
0.966
0.968
40 60 80 100 120 140 160
Esterfication conversion
, ε
Rotation per minute [1/min]

25
IV=0.64 dl/g). Therefore, the effect of change in the rpm of the stirrer on the IV was
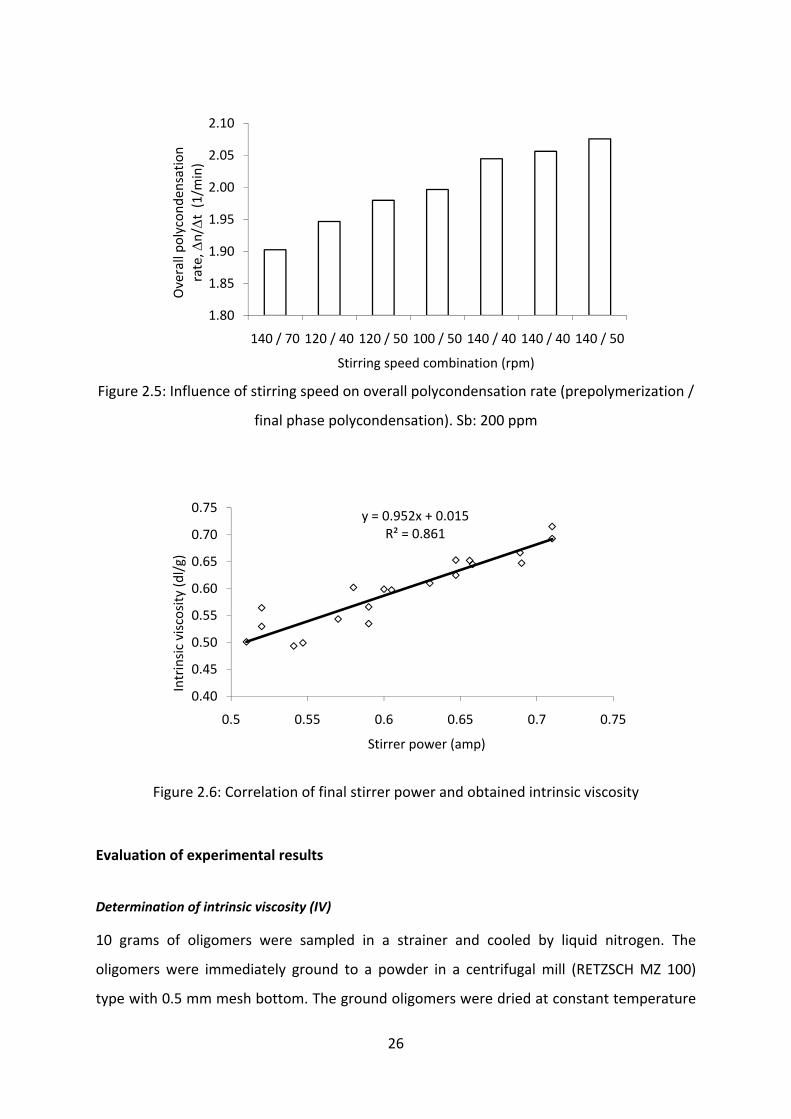
elucidated for the prepolymerization and final polycondensation phase. From Figure 2.5, it is
seen that maximum speed in the prepolymerization and moderate speed in the final phase
polycondensation gives optimum reaction rate. In the prepolymerization phase, very high
rpm facilitates the removal of excess of unreacted EG, which has been left over after the
completion of esterification phase. However, as the melt viscosity builds up, the reaction
temperature also increases. Thus, by lowering the stirring speed, the shearing effect can be
lowered and the temperature can be maintained as desired. Also low stirring speed allows
the high viscous melt to form thin films which further increases the interfacial area and the
removal of EG can be intensified.
Figure 2.4: Influence of vacuum on intrinsic viscosity in polycondensation phase. Sb: 200
ppm, Polycondensation RPM: 30
0.2
0.4
0.6
0.8
1.0
100 120 140 160 180 200 220Time [min]
Stir
rer p
ower
[am
p]
0
0.5
1
1.5
2
2.5
Vac
uum
[mba
r]
Ampere (High Vacuum) Ampere (Low Vacuum)High Vacuum Low Vacuum
IV: 0.76 dl/g
IV: 0.51 dl/g
26
Figure 2.5: Influence of stirring speed on overall polycondensation rate (prepolymerization /
final phase polycondensation). Sb: 200 ppm
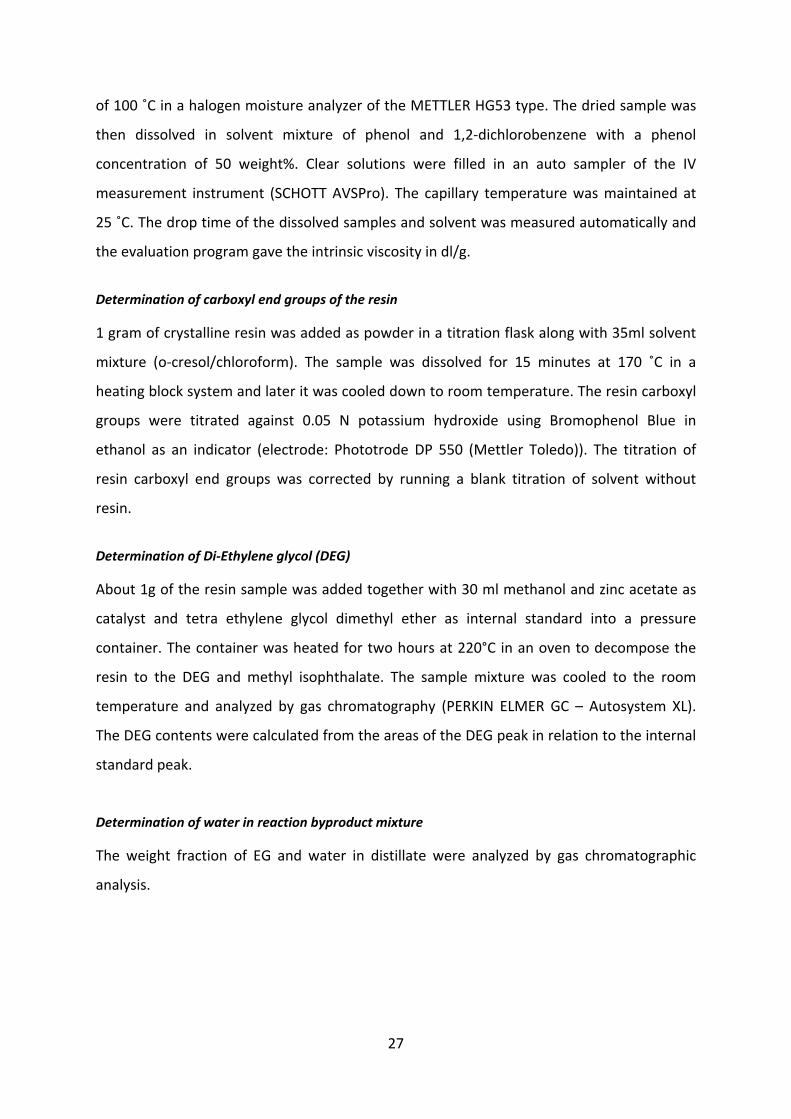
Figure 2.6: Correlation of final stirrer power and obtained intrinsic viscosity
Evaluation of experimental results
Determination of intrinsic viscosity (IV)
10 grams of oligomers were sampled in a strainer and cooled by liquid nitrogen. The
oligomers were immediately ground to a powder in a centrifugal mill (RETZSCH MZ 100)
type with 0.5 mm mesh bottom. The ground oligomers were dried at constant temperature
1.80
1.85
1.90
1.95
2.00
2.05
2.10
140 / 70 120 / 40 120 / 50 100 / 50 140 / 40 140 / 40 140 / 50
Overall po
lycond
ensatio
n rate, Δ
n/Δt (1/min)
Stirring speed combination (rpm)
y = 0.952x + 0.015R² = 0.861
0.40
0.45
0.50
0.55
0.60
0.65
0.70
0.75
0.5 0.55 0.6 0.65 0.7 0.75
Intrinsic viscosity
(dl/g)
Stirrer power (amp)
27
of 100 ˚C in a halogen moisture analyzer of the METTLER HG53 type. The dried sample was
then dissolved in solvent mixture of phenol and 1,2‐dichlorobenzene with a phenol
concentration of 50 weight%. Clear solutions were filled in an auto sampler of the IV
measurement instrument (SCHOTT AVSPro). The capillary temperature was maintained at
25 ˚C. The drop time of the dissolved samples and solvent was measured automatically and
the evaluation program gave the intrinsic viscosity in dl/g.
Determination of carboxyl end groups of the resin
1 gram of crystalline resin was added as powder in a titration flask along with 35ml solvent
mixture (o‐cresol/chloroform). The sample was dissolved for 15 minutes at 170 ˚C in a
heating block system and later it was cooled down to room temperature. The resin carboxyl
groups were titrated against 0.05 N potassium hydroxide using Bromophenol Blue in
ethanol as an indicator (electrode: Phototrode DP 550 (Mettler Toledo)). The titration of
resin carboxyl end groups was corrected by running a blank titration of solvent without
resin.
Determination of Di‐Ethylene glycol (DEG)
About 1g of the resin sample was added together with 30 ml methanol and zinc acetate as
catalyst and tetra ethylene glycol dimethyl ether as internal standard into a pressure
container. The container was heated for two hours at 220°C in an oven to decompose the
resin to the DEG and methyl isophthalate. The sample mixture was cooled to the room
temperature and analyzed by gas chromatography (PERKIN ELMER GC – Autosystem XL).
The DEG contents were calculated from the areas of the DEG peak in relation to the internal
standard peak.
Determination of water in reaction byproduct mixture
The weight fraction of EG and water in distillate were analyzed by gas chromatographic
analysis.
28
Chapter 3: Semibatch Esterification Process for Poly(ethylene terephthalate) Synthesis
Abstract
Esterification kinetics in poly(ethylene terephthalate) (PET) synthesis has been studied by
using a semibatch reactor. Terephthalic acid (TPA) was esterified with ethylene glycol (EG) in
absence of external catalysts to study the kinetics of this acid catalyzed reaction. A
comprehensive mathematical model for esterification in a semibatch reactor has been
developed by considering functional group approach. The model was validated using a
series of experimental data for different monomer feed ratios. Rate constants were
optimized by data fitting with final oligomeric chain length and fraction of oligomeric
carboxyl groups in total terminal groups, α. Solid‐liquid equilibrium of TPA was considered
by introducing TPA particle size distribution and varying TPA solubility in EG and oligomers.
TPA particle size was tracked with time as a function of monomer feed ratio. It was also
observed that conversion became more sensitive towards TPA particle size as the EG/TPA
feed ratio was lowered. It is advantageous to use the model based on TPA particle size for
mass transfer limited esterification reactions. The effect of monomer feed ratio on
conversion, degree of polymerization, functional group concentration and system
heterogeneity can be predicted with this model.

29
Introduction
With a global production of 35 million tones per annum, Poly(ethylene terephthalate) (PET)
is considered as a one of the leading polymer resins in the recent times. About 63% of PET is
used as fibers in staple, filament and woven forms while the remaining 37% is used as a
packaging resin for bottles, containers, sheet and film. Global growth rates for PET usage in
fibers and packaging are around 4% and 8% per year, respectively.1 PET is a polyester
formed by step‐growth polycondensation mainly from Terephthalic acid (TPA) and ethylene
glycol (EG). The formation of PET involves two main reactions, (1) esterification of carboxyl
end groups of TPA with the hydroxyl end groups of EG and (2) polycondensation of esters
with terminal hydroxyl groups.
Direct esterification reaction between TPA and EG is considered as a key process. During
esterification, TPA reacts with EG yielding low molecular weight oligomers and water where
the latter is continuously removed to favor the forward reaction. The esterification reaction
is accompanied by the reverse hydrolysis reaction. The polycondensation is also an
equilibrium reaction, it is accompanied by the reverse glycolysis reaction. During
polycondensation, terminal hydroxyl group react with glycol ester in the presence of catalyst
such as antimony (Sb) to produce polymer and EG where the latter is removed by vacuum to
promote polymerization. The polycondensation is coupled with mass transfer limitation at
high degree of polymerization because non‐removal of EG promote the reverse glycolysis
reaction. In an industrial PET process, esterification and polycondensation proceed
simultaneously. It is important to have the optimum ratio of reactive end groups
(COOH/OH) during each step to allow esterification and polycondensation to proceed in
parallel.2
The esterification process involves three phases, i.e. a solid phase containing undissolved
TPA; a homogeneous liquid phase containing oligomers, EG and dissolved TPA; a gas phase
containing volatiles such as water, EG, diethylene glycol (DEG) and other reaction
byproducts. Kinetic analysis becomes difficult due to the very low solubility of TPA in the
reaction medium.7 It is important to understand the effect of process variables on the
esterification process in order to improve the productivity of existing plants.
Kinetics of the esterification process has been studied mostly by using model compounds to
simplify the evaluation of the experimental data. Reimschuessel3 studied the kinetics with
30
model molecules such as esterification of benzoic acid with EG and TPA with 2‐(2‐
methoxyethoxy) ethanol. Otton et al.4 studied different carboxylic acids. However,
simplification with model compounds does not address the TPA solubility in the reaction
mass as the TPA dissolution and its consumption by reaction proceeds simultaneously.
Ravindranath and Mashelkar5, Yamada6 and Kang et al.7 have studied esterification of TPA
with EG and proposed a mathematical model for a three phase continuous esterification
process. Ravindranath and Mashelkar assumed for their simulation that total conversion, p
obtained from the esterification phase is close to zero (chain length, n=1) but in reality it
changes from zero to 0.9 (n=10) in continuous esterification reactors.6 Also, they assumed
that the carboxyl groups concentration in liquid phase remains constant until the reaction
mixture becomes homogeneous. However, the concentration of liquid carboxyl groups
changes due to the fact that TPA solubility depends on the availability of EG and oligomers
and also on TPA particle size which reduces with TPA dissolution.6 Yamada obtained higher
solubility of TPA in EG than in the oligomers, which is in contrast with the solubility data
given by Kumar and Gupta8. Kang et al. considered the TPA solubility according to Yamada
and have assumed the process to be controlled by the reaction rate, they introduced
characteristic dissolution time (τ) which is a function of shape and size of solid TPA particles
and mixing characteristic of reactor.9 However, the validity of τ was not given.
In the current work, we have introduced the influence of TPA particle size distribution on
the dissolution of TPA. Influence of other process variables such as monomer feed ratio,
temperature and acid catalyst concentration were studied. A comprehensive kinetic model
is developed by using a small‐scale semibatch reactor to determine the esterification rates
in PET process based on a functional group approach. The effect of monomer feed ratio on
conversion, degree of polymerization, functional group concentration, DEG formation and
system heterogeneity was investigated. The results obtained were treated with multi
parameter kinetics and good agreement was found between experiment and simulation.
31
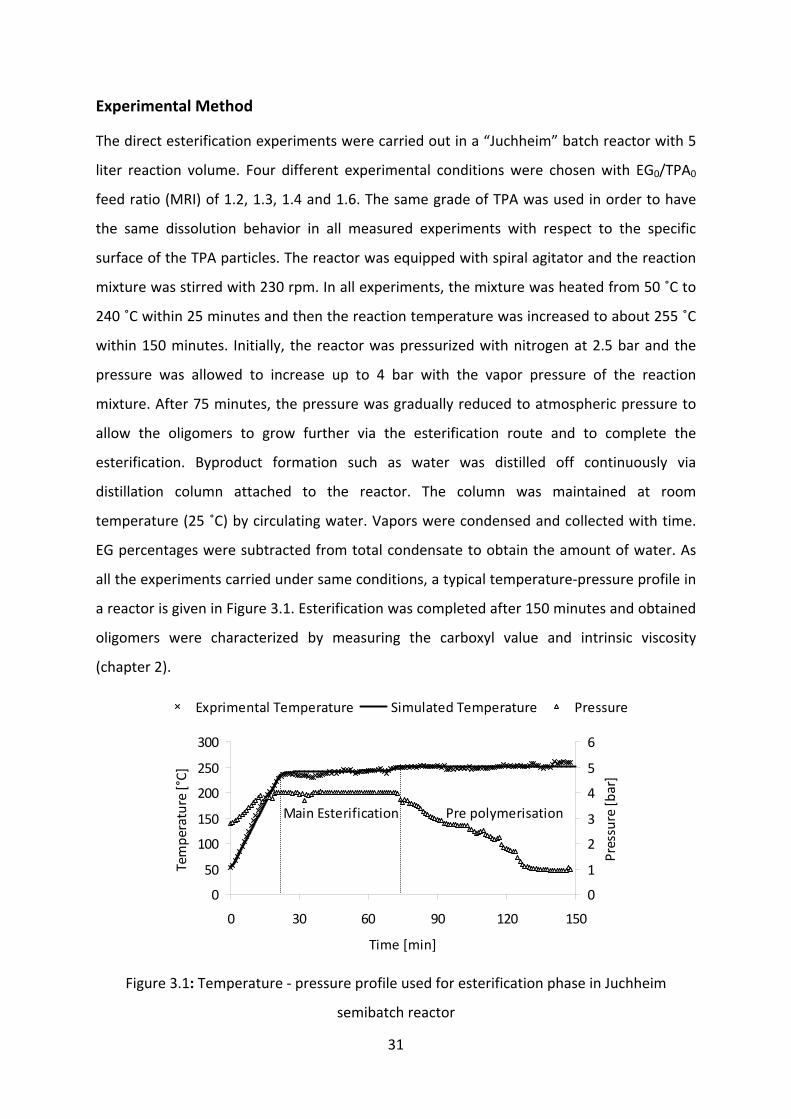
Experimental Method
The direct esterification experiments were carried out in a “Juchheim” batch reactor with 5
liter reaction volume. Four different experimental conditions were chosen with EG0/TPA0
feed ratio (MRI) of 1.2, 1.3, 1.4 and 1.6. The same grade of TPA was used in order to have
the same dissolution behavior in all measured experiments with respect to the specific
surface of the TPA particles. The reactor was equipped with spiral agitator and the reaction
mixture was stirred with 230 rpm. In all experiments, the mixture was heated from 50 ˚C to
240 ˚C within 25 minutes and then the reaction temperature was increased to about 255 ˚C
within 150 minutes. Initially, the reactor was pressurized with nitrogen at 2.5 bar and the
pressure was allowed to increase up to 4 bar with the vapor pressure of the reaction
mixture. After 75 minutes, the pressure was gradually reduced to atmospheric pressure to
allow the oligomers to grow further via the esterification route and to complete the
esterification. Byproduct formation such as water was distilled off continuously via
distillation column attached to the reactor. The column was maintained at room
temperature (25 ˚C) by circulating water. Vapors were condensed and collected with time.
EG percentages were subtracted from total condensate to obtain the amount of water. As
all the experiments carried under same conditions, a typical temperature‐pressure profile in
a reactor is given in Figure 3.1. Esterification was completed after 150 minutes and obtained
oligomers were characterized by measuring the carboxyl value and intrinsic viscosity
(chapter 2).
Figure 3.1: Temperature ‐ pressure profile used for esterification phase in Juchheim
semibatch reactor
0
50
100
150
200
250
300
0 30 60 90 120 150
Time [min]
Temperature [°C]
0
1
2
3
4
5
6
Pressure [b
ar]
Exprimental Temperature Simulated Temperature Pressure
Main Esterification Pre polymerisation
32
Results and Discussion
Mathematical model
Reaction scheme
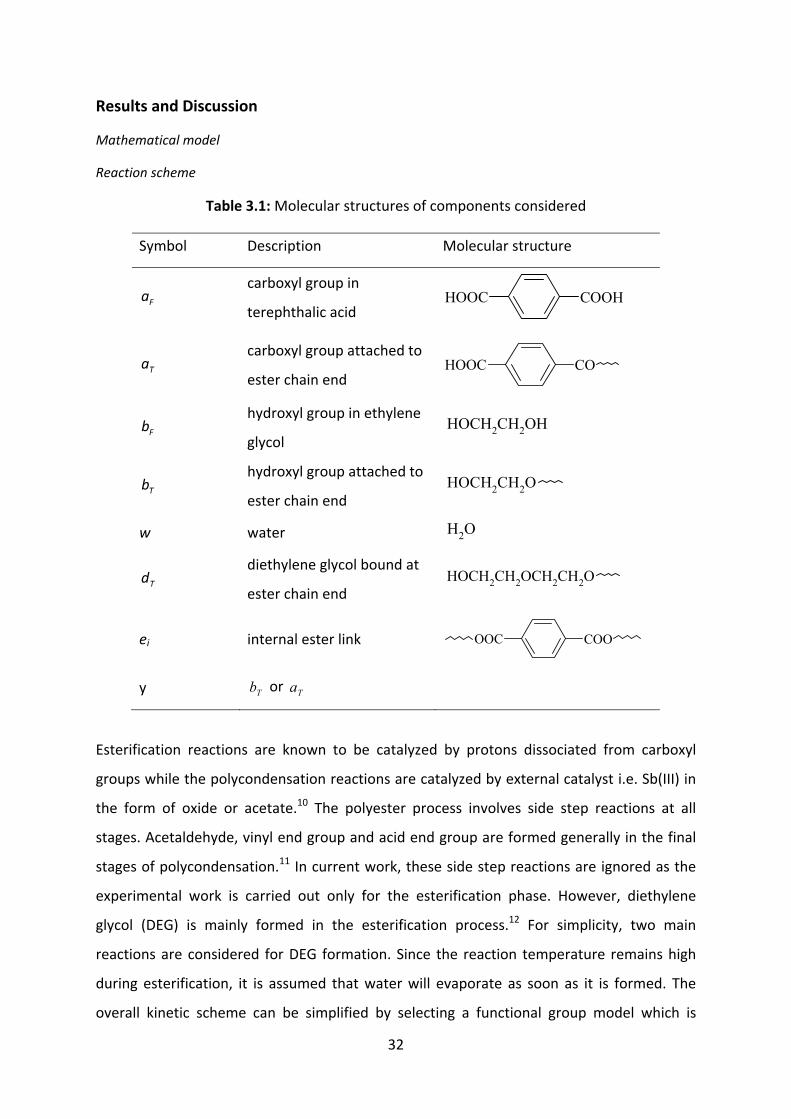
Table 3.1: Molecular structures of components considered
Symbol Description Molecular structure
Fa carboxyl group in
terephthalic acid
Ta carboxyl group attached to
ester chain end
Fb hydroxyl group in ethylene
glycol
Tb hydroxyl group attached to
ester chain end
w water
Td diethylene glycol bound at
ester chain end
ei internal ester link
y Tb or Ta
Esterification reactions are known to be catalyzed by protons dissociated from carboxyl
groups while the polycondensation reactions are catalyzed by external catalyst i.e. Sb(III) in
the form of oxide or acetate.10 The polyester process involves side step reactions at all
stages. Acetaldehyde, vinyl end group and acid end group are formed generally in the final
stages of polycondensation.11 In current work, these side step reactions are ignored as the
experimental work is carried out only for the esterification phase. However, diethylene
glycol (DEG) is mainly formed in the esterification process.12 For simplicity, two main
reactions are considered for DEG formation. Since the reaction temperature remains high
during esterification, it is assumed that water will evaporate as soon as it is formed. The
overall kinetic scheme can be simplified by selecting a functional group model which is
HOOC COOH
COHOOC
HOCH2CH2OH
HOCH2CH2O
OH2
HOCH2CH2OCH2CH2O
OOC COO
33
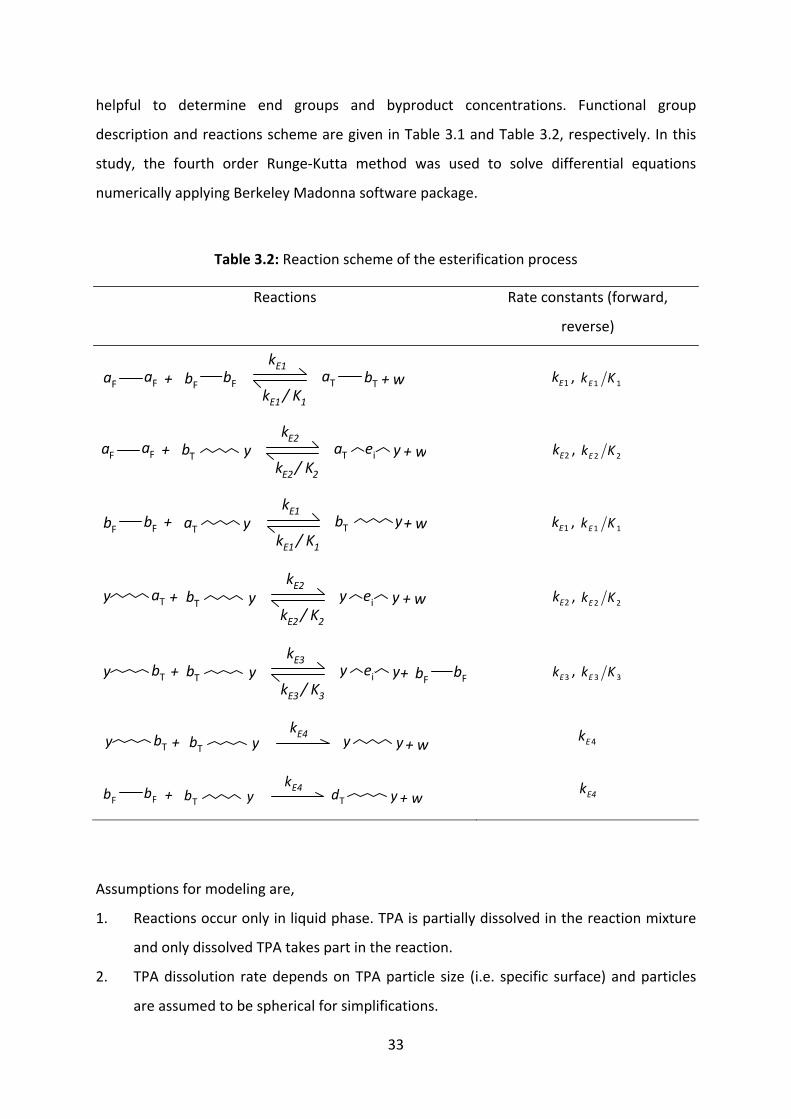
helpful to determine end groups and byproduct concentrations. Functional group
description and reactions scheme are given in Table 3.1 and Table 3.2, respectively. In this
study, the fourth order Runge‐Kutta method was used to solve differential equations
numerically applying Berkeley Madonna software package.
Table 3.2: Reaction scheme of the esterification process
Reactions Rate constants (forward,
reverse)
kE1+ bF bF aT bT + w
kE1 / K1aF aF
1Ek , 11 KkE
kE2+ bT aT + w
kE2 / K2
aF aF y yei
2Ek , 22 KkE
kE1+ aT bT + w
kE1 / K1bF bF y y
1Ek , 11 KkE
kE2+ bT y + w
kE2 / K2y yeiaTy
2Ek , 22 KkE
kE3+ bT y +
kE3 / K3y yeibTy bF bF 3Ek , 33 KkE
+ bT yy ybTy + wkE4
4Ek
kE4+ bT dTy y + wbF bF
E4k
Assumptions for modeling are,
1. Reactions occur only in liquid phase. TPA is partially dissolved in the reaction mixture
and only dissolved TPA takes part in the reaction.
2. TPA dissolution rate depends on TPA particle size (i.e. specific surface) and particles
are assumed to be spherical for simplifications.
34
3. Solubility of TPA in water is negligible.
4. Only undissolved TPA forms solid phase of heterogeneous system.
5. Esterification reactions are catalyzed by protons which are generated by dissociation
of terminal carboxyl groups of dissolved TPA, ( D,Fa ) and carboxyl groups at ester end
groups ( Ta ).
6. Equal reactivity is considered for carboxyl groups bound to TPA and to polymer chain
while hydroxyl groups bound to EG and to esters have different reactivity.13, 14
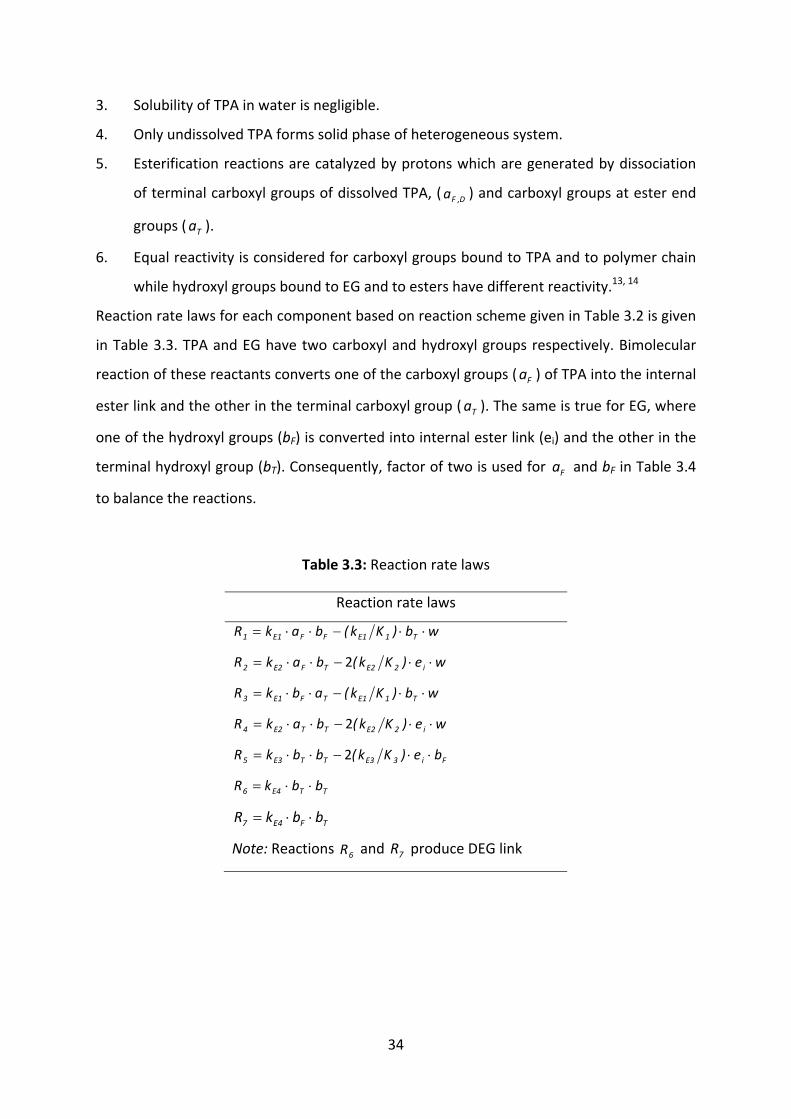
Reaction rate laws for each component based on reaction scheme given in Table 3.2 is given
in Table 3.3. TPA and EG have two carboxyl and hydroxyl groups respectively. Bimolecular
reaction of these reactants converts one of the carboxyl groups ( Fa ) of TPA into the internal
ester link and the other in the terminal carboxyl group ( Ta ). The same is true for EG, where
one of the hydroxyl groups (bF) is converted into internal ester link (ei) and the other in the
terminal hydroxyl group (bT). Consequently, factor of two is used for Fa and bF in Table 3.4
to balance the reactions.
Table 3.3: Reaction rate laws
Reaction rate laws
wb)Kk(bakR T1E1FFE11 ⋅⋅−⋅⋅=
we)Kk(bakR i2E2TFE22 ⋅⋅−⋅⋅= 2
wb)Kk(abkR T1E1TFE13 ⋅⋅−⋅⋅=
we)Kk(bakR i2E2TTE24 ⋅⋅−⋅⋅= 2
Fi3E3TTE35 be)Kk(bbkR ⋅⋅−⋅⋅= 2
TTE46 bbkR ⋅⋅=
TFE47 bbkR ⋅⋅=
Note: Reactions 6R and 7R produce DEG link

35
Table 3.4: Mass balance equations
[ ]21 22 RR
dtad F ⋅−⋅−=
[ ]7531 2222 RRRR
dtbd F ⋅−⋅+⋅−⋅−=
[ ]4321 RRRR
dtad T −−++=
[ ]765 22 RRRRRRR
dtbd
4321T −⋅−⋅−−+−+=
[ ]764321 RRRRRR
dtwd
++++++=
[ ]76 RR
dtdd T ++=
Phase equilibrium
The solubility of TPA in EG is reported to be extremely low and esterification is occurring in
liquid phase only. Thus, the solid‐liquid equilibrium should be considered to calculate the
composition of the reaction mass in the liquid phase and the concentration of functional
groups. The liquid reaction mass increases by the continuous dissolution of TPA until the
reaction medium becomes homogeneous and simultaneously decreases with the removal of
water. In simulation, TPA solubility in EG and oligomers is considered according to Yamada
et al.15
TPA solubility in EG is given as,
EGTPA ,β = 9062 exp (‐4877 / (273+T)) mol∙kg‐1 (1)
TPA solubility in oligomers is given as,
OLGTPA ,β = 374 exp (‐3831 / (273+T)) mol∙kg‐1 (2)
Where: T = temperature, ˚C
TPA carboxyl group concentration at phase equilibrium *Fa can be calculated by using
equation (1), (2), (4), (5) and esterification conversion, ε (definition see equation (25)).
*Fa = [ ])( EGOLGEG ββεβ −⋅+ mol∙kg‐1 (3)
The solubility of TPA in terms of carboxyl groups in EG,
EGβ = EGTPA ,2 β⋅ mol∙kg‐1 (4)
36
The solubility of TPA in terms of carboxyl groups in oligomers,
OLGβ = OLGTPA ,2 β⋅ mol∙kg‐1 (5)
Reaction rate for total carboxyl groups (a) can be given as,
[ ] [ ] [ ] [ ]dtad
dt
ad
dt
ad
dtad TD,FS,F ++= (6)
Where, S,Fa represents the carboxyl groups attached to undissolved TPA. Carboxyl groups
become available by TPA dissolution in the liquid phase. Simultaneously, available carboxyl
groups are consumed by esterification reaction. TPA dissolution constant and esterification
rate constant are given as kD and kE respectively. It is assumed that the change in carboxyl
groups concentration under solid‐liquid phase equilibrium is close to zero.
[ ]02 ≈⋅⋅⋅−−⋅=
4342144 344 21nconsumptio
D,FE
ndissolutio
D,F*
FDD,F bak)aa(k
dt
ad (7)
The mass transfer coefficient kD is inversely related to the TPA particle radius. As the
particles become smaller due to their dissolution, kD increases. By dissolution, particles may
reach a critical point where they dissolve completely. It is important to consider such
situations for simulation to minimize errors. kD is calculated by using algebraic equations
given in TPA dissolution calculations.
Vapor‐liquid phase equilibrium is considered based on polymer‐NRTL parameters obtained
from ASPEN databank16. EG and water are considered to be the only volatile components of
the reactive mixtures. The vapor phase is assumed to follow the ideal gas law. Oligomers are
assumed to be non‐volatile. The mole fractions and activity coefficient are calculated based
on apparent concentration of water, EG and oligomers in liquid phase. Water is removed
continuously to promote forward reactions. Thereby, the concentration of water should be
updated by subtracting the equal mole number of the removed condensed water from the
total generated water. The vapor phase mole fractions of EG and water are given by the
following equations.
PyPx EGEGEGEG ⋅=⋅⋅γ (8)
PyPx OHOHOHOH ⋅=⋅⋅2222
γ (9)
12
=++ OLGOHEG xxx (10)
12=+ OHEG yy (11)
Where,
37
=OLGOHEG x,x,x2
liquid phase apparent mole fraction of EG, water and oligomers.
=OHEG y,y2
vapor phase mole fractions of EG and water
=OHEG P,P2
vapor pressure of EG and water, bar
=P total pressure, bar
=OHEG , 2γγ activity coefficient of EG and water
Vapor pressures are calculated from Yamada et al17.
).T/(.EG .P 819319578808410331 +−⋅= (12)
)T/(..OH .P 2282166896684103312
+−⋅= (13)
Where, T = reaction temperature, °C
TPA dissolution calculations
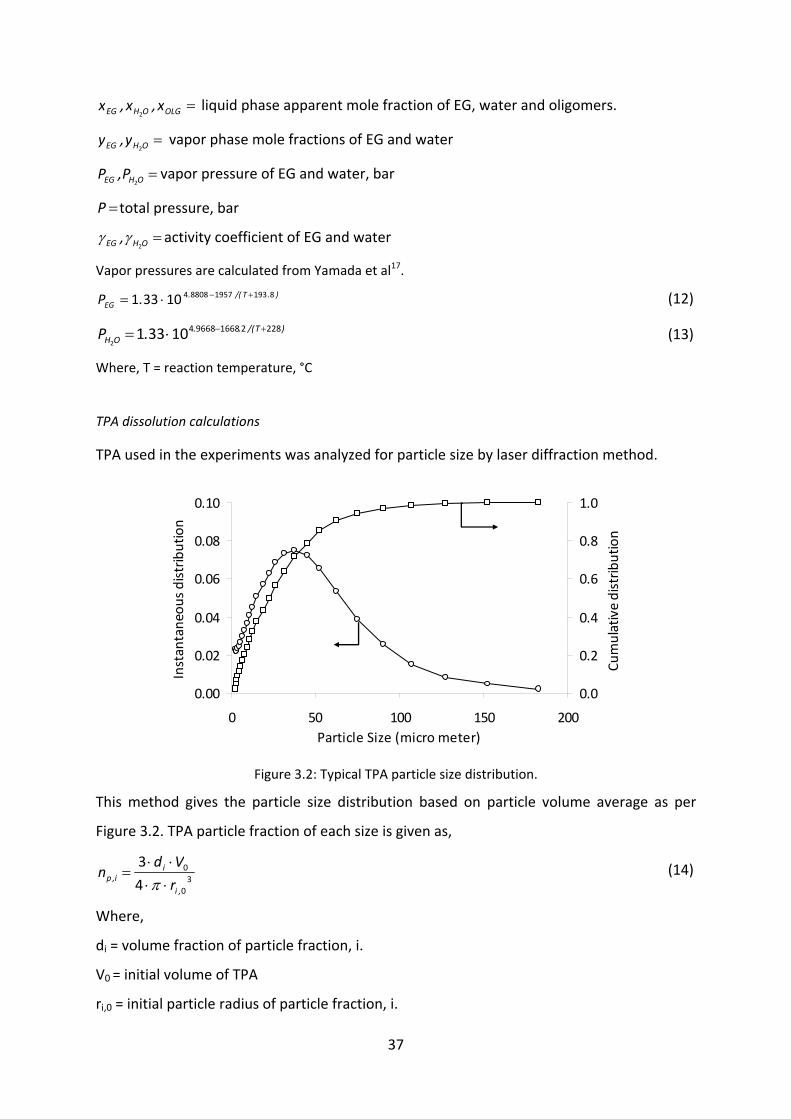
TPA used in the experiments was analyzed for particle size by laser diffraction method.
Figure 3.2: Typical TPA particle size distribution.
This method gives the particle size distribution based on particle volume average as per
Figure 3.2. TPA particle fraction of each size is given as,
30
0
4
3
,i
ii,p r
Vdn
⋅⋅⋅⋅
=π
(14)
Where,
di = volume fraction of particle fraction, i.
V0 = initial volume of TPA
ri,0 = initial particle radius of particle fraction, i.
0.00
0.02
0.04
0.06
0.08
0.10
0 50 100 150 200Particle Size (micro meter)
Instantaneou
s distrib
ution
0.0
0.2
0.4
0.6
0.8
1.0
Cumulative distrib
ution
38
We assume that all particles are dissolved with equal dissolution rate, q. By using this rate,
residual particle size for each fraction, i can be given as,
00
1VV
logq
rr i,ii
∑⋅+= (15)
Where, ∑Vi is the apparent volume of the particles in all fractions, i at time, t.
By using equation (14) and (15), specific interface of all particles is given as,
∑∑
⋅⋅⋅
⋅⋅⋅==Γ
3
2
344
ii,p
ii,p
rn
rn
VA
π
π (16)
Mass transfer constant opted for the current work is 5102 −×=sk m∙min‐1.18
Based on the specific interface and the mass transfer constant, the mass transfer coefficient
based on particle size can be given as,
Γ⋅= sD kk min‐1 (17)
Catalysis
Esterification reactions involve acid catalysis mechanism. The catalytic influence of an acid
depends on the degree of dissociation of the acid. The concentration of protons is
calculated based on the acidity carboxyl end groups.19
[ ] [ ] [ ]513513 1010 .T
.D,F aaH −−+ ⋅+⋅≈ (18)
Effective rate constant for esterification, polycondensation and DEG formation reactions can
be given by,
i,iE, k]H[k ∞+ ⋅= (19)
Where, k∞,i is a micro kinetic rate constant
Challa[13] and Otton et al.14 have considered different reactivity of hydroxyl groups at EG and
at terminal ester; consequently, in our study, we have used the rate constant, kE1 for the
reaction of EG with carboxyl groups, i.e. bF with D,Fa or Ta ; while, the rate constant kE2 for
the reaction of terminal hydroxyl group with carboxyl groups i.e. bT with D,Fa or Ta . Otton
et al.20 observed that acid catalyzed esterification is about three times faster than acid
catalyzed polycondensation. This relationship is used for the polycondensation rate
constant, kE3= kE1/3.

39
In all esterification experiments some fraction of EG also evaporated along with the water
during removal of byproducts, consequently EG concentration was corrected according to
real EG concentration in the reaction mixture. Therefore, kinetic simulations were
performed with the monomer feed ratio determined at the end of the reaction
(MRF=EGresidual/TPA0) which accounts for the loss of EG. Calculations for MRF are given in
Table 3.5, EGresidual was calculated by subtracting evaporated EG during esterification phase
from the initial amount of the feed. EG balance can be expressed as,
{ { { {43421
residualEG
actedRe
R
Liquid
L
Vapor
V
Feed
EGEGEGEG ++=0 (20)
Table 3.5: Calculations for EG/TPA final feed ratio
MRI EG0, mol EGresidual, mol TPA0, mol MRF
1.6 9.6 8.64 6 1.44
1.4 8.4 7.74 6 1.29
1.3 7.8 7.2 6 1.2
1.2 7.2 6.78 6 1.13
In the simulation, the temperature was described with five different heating rates of 8.7, 2,
0.067, 1.8, 0 ˚C/min for 0‐21, 21‐24, 24‐69, 69‐73, 73‐150 minutes respectively as shown in
Figure 3.1.
In presented work, reactions were carried out in absence of Sb catalyst. Therefore,
acetaldehyde generation was neglected. Activation energies for the esterification,
polycondensation and DEG formation reactions were taken from Kang et al.7 In our study,
pre‐exponential factors were fitted to experimental data. Rate constant kE1 was fitted for
each monomer feed ratio to carboxyl value of oligomers and water generation curve with
higher weighting on the carboxyl value. Rate constant kE2 was fitted to oligomeric chain
length, n. Rate constant kE3 for DEG formation was attuned for the optimal fitting of n and α
(definition see equation (21)).
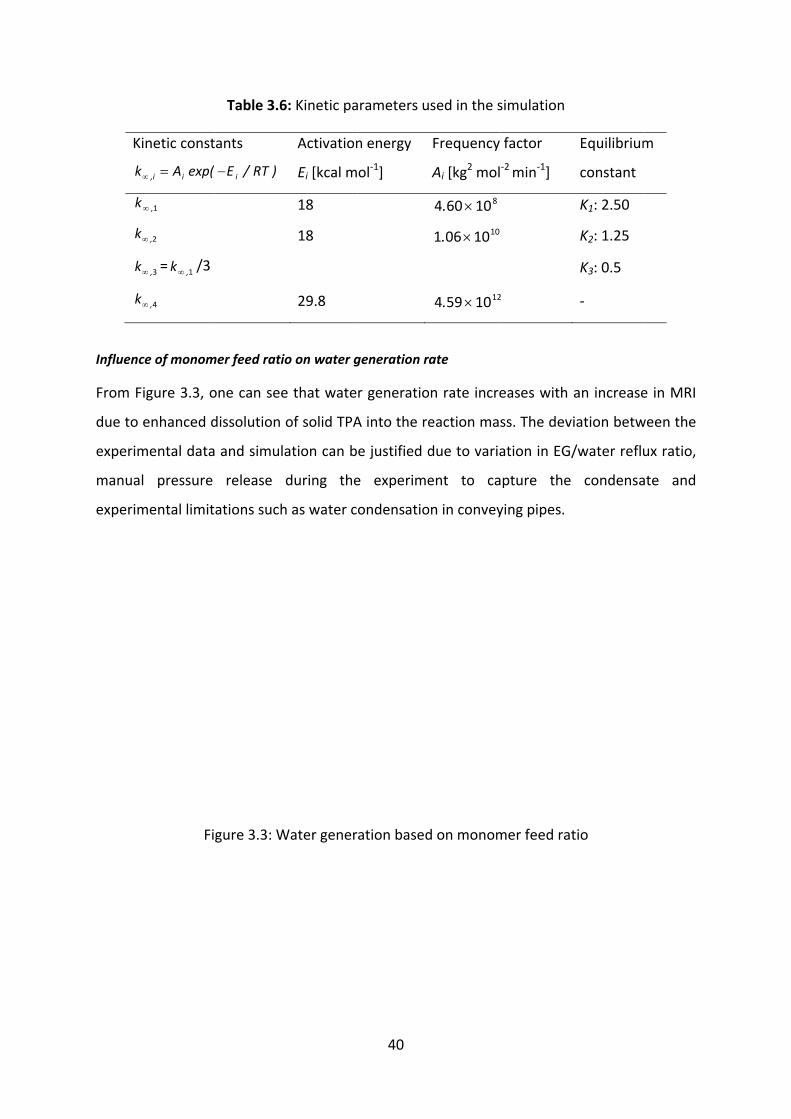
Ki
k∞
k∞
k∞
k∞
k∞
Influenc
From F
due to
experim
manual
experim
inetic const
exp(Aii, =∞
1,∞
2,∞
3,∞ = 1,k∞ /3
4,∞
ce of monom
igure 3.3, o
enhanced d
mental data
l pressure
mental limit
Fi
Table 3.6
tants
)RT/E( i−
mer feed ratio
one can see
dissolution o
and simula
release d
ations such
gure 3.3: W
6: Kinetic pa
Activation
Ei [kcal m
18
18
29.8
o on water g
e that wate
of solid TPA
ation can b
during the
h as water c
Water gener
40
arameters u
n energy
ol‐1]
generation r
r generatio
A into the re
e justified d
e experime
ondensatio
ation based
sed in the s
Frequency
Ai [kg2 mol
810604 ×.
1010061 ×.
1210594 ×.
ate
on rate incre
eaction mas
due to varia
ent to ca
on in convey
d on monom
simulation
factor ‐2 min‐1]
2
eases with
ss. The dev
ation in EG/
pture the
ying pipes.
mer feed rat
Equilibrium
constant
K1: 2.50
K2: 1.25
K3: 0.5
‐
an increase
iation betw
/water reflu
condensa
tio
m
e in MRI
ween the
ux ratio,
ate and

41
Influence of monomer feed ratio on carboxyl fraction, α
We introduce a parameter, α, that represents the fraction of carboxyl groups ( TF aaa += ) in
total terminal groups.
Tbaa+
=α (21)
During esterification phase, carboxyl groups are consumed mostly by their reaction with EG
and terminal hydroxyl groups. Increased concentration of EG promotes the carboxyl group
consumption and simultaneously it increases the terminal hydroxyl groups concentration.
Thus, the α value decreases dramatically at high monomer feed ratio during the
esterification (Figure 3.4). The actual final feed ratio in the reactor may be varied due to
some residual EG in the column and in the reactor line. This might cause deviations to
simulation.
Figure 3.4: Fraction of carboxyl groups in terminal groups, α as a function of monomer feed
ratio
0.00
0.05
0.10
0.15
0.20
0.25
1.0 1.1 1.2 1.3 1.4 1.5
MRF (EG/PTA)
α (‐)
model data

42
Influence of monomer feed ratio on chain length and molecular weight
The monomer feed ratio is an important operating parameter to obtain optimum chain
length (n) from esterification. By increasing the monomer feed ratio, n was found to
decrease. Oligomeric chain length was calculated from the measured intrinsic viscosity by
equation (22).
( ) 1928862 /αMnn ⋅+−= (22)
Where, 47061410273 .IV.Mn ⋅×=
Equation (22) can be derived from following equation,
( ) ( )44 344 21444 3444 21321
water GeneratedEG ConsumedFeed TPA
2221 OHEGTPAPET MαnMαnMnM ⋅−⋅−⋅⋅−++⋅= g∙mol‐1 (23)
Simulated chain length, nSIM has been calculated from equation (24)
TSIM ba
an
+=
0
(24)
Where, a0 is a saponification number.
The chain length decreases with an increase in mole ratio, which can be justified further by
simulation results given in Figure 3.5. From simulation, optimal feed ratio can be predicted
for optimum degree of polymerization during esterification phase in a batch reactor. At very
low feed ratios (MRF<1.04), n drops strongly. Under this condition, the polymer groups are
terminated mostly by acid ends, which can not react with each other. While at very high
feed ratios, the polymer end groups are terminated by mostly hydroxyl groups. At
intermediate feed ratios, polymer chains grow by esterification. The esterification reaction is
favored since the equilibrium constant is higher than one. Therefore, the reaction is less
limited by chemical equilibrium. In addition, esterification reaction generates water instead
of EG. Water is far more volatile than glycol, thus it is easier to remove from the reaction
melt. This also favors the forward reaction.21
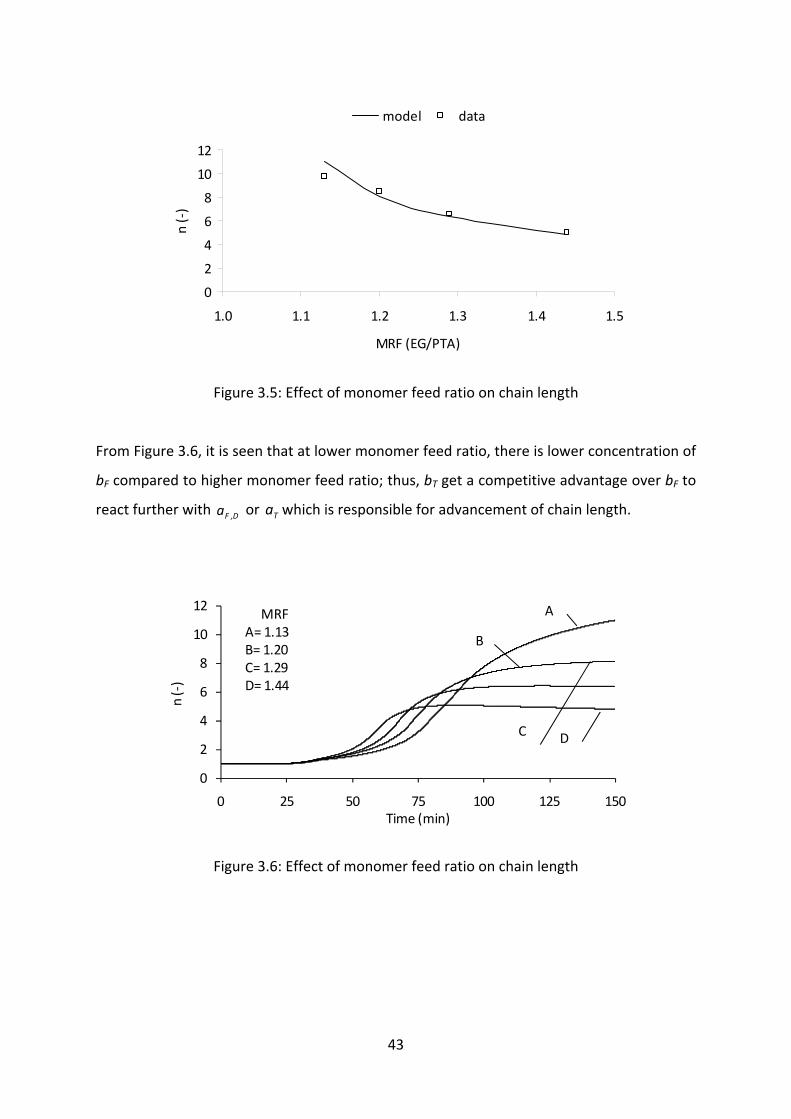
43
Figure 3.5: Effect of monomer feed ratio on chain length
From Figure 3.6, it is seen that at lower monomer feed ratio, there is lower concentration of
bF compared to higher monomer feed ratio; thus, bT get a competitive advantage over bF to
react further with D,Fa or Ta which is responsible for advancement of chain length.
Figure 3.6: Effect of monomer feed ratio on chain length
0
2
4
6
8
10
12
1.0 1.1 1.2 1.3 1.4 1.5
MRF (EG/PTA)
n (‐)
model data
0
2
4
6
8
10
12
0 25 50 75 100 125 150
n (‐)
Time (min)
B
C
A
D
MRFA= 1.13B= 1.20C= 1.29D= 1.44

44
Influence of monomer feed ratio on conversion
Esterification conversion, ε represents the conversion of TPA into esters.
01
aa
−=ε (25)
By increasing the monomer feed ratio, the TPA dissolution rate was improved which helped
ε to be increased. While total conversion, p that is responsible for the advancement of chain
length was found to decrease with an increase in monomer feed ratio as shown in
Figure 3.7.
Figure 3.7: Effect of monomer feed ratio on conversions;
Symbols: Experimental values; Line: Calculated
Total conversion of terminal groups is given as,
0.70
0.75
0.80
0.85
0.90
0.95
1.00
1.0 1.1 1.2 1.3 1.4 1.5
MRF (EG/PTA)
Conversion
(‐) ε
p
0.70
0.75
0.80
0.85
0.90
0.95
1.00
1.0 1.1 1.2 1.3 1.4 1.5
MRF (EG/PTA)
Conversion
(‐) ε
p

45
01a
bap T+
−= (26)
An increase in the monomer feed ratio shifts the balance of carboxyl to hydroxyl groups
away from unity. Based on this, we assume that a decrease in number average of chain
length with an increase in EG concentration is due to imbalance in the carboxyl to hydroxyl
ratio but not due to hindrance in the polycondensation caused by higher EG concentration.
Figure 3.8 shows the effect of monomer feed ratio on esterification (ε) and overall (p)
conversion simulated at the same reaction temperature. Lowering of the EG concentration
causes prolonged time for complete dissolution of TPA in the system due to its lower
solubility reaction media; consequently it takes longer time for esterification conversion to
reach maximum.
Figure 3.8: Conversion as a function of time and monomer feed ratio
Different functional group concentration profile during esterification phase
The simulation was performed with the monomer feed ratio of 1.13; the reaction
temperature was considered as actual experimental temperature. From
Figure 3.9, it can be seen that aF,S which represents solid TPA, acts as a reservoir for the
carboxyl groups in liquid phase. The concentration of D,Fa was increased at first due to
temperature increase in the reactor from 50 ˚C to 240 ˚C in the first 20 minutes. Thereafter,
its concentration dropped steadily with the reaction time till clearing point (tc), where solid
TPA just disappeared in the reaction mixture. After the clearing point, the liquid carboxyl
0
0.2
0.4
0.6
0.8
1
0 25 50 75 100 125 150
Time (min)
Conversion
(‐)
A
B
CD MRF
A= 1.44, εB= 1.20, εC= 1.20, pD= 1.44, p

46
group concentration dropped quickly. Beside this, one can follow the change in bF, bT and
water concentration.
Figure 3.9: Functional group and water concentration profile in Esterification phase; MRF 1.2
Influence of TPA particle size on conversion
According to the stationary state, the carboxyl group concentration in the liquid phase
depends on the TPA particle size along with reactor geometry and agitator speed.9 In this
work, mass transfer coefficient, ks was considered to be 5102 −× m∙min‐1 for semibatch
reactor. In Figure 3.10, we compared the conversion for the model based on TPA particle
size and independent on particle size. Mass transfer rate depending on particle size gave
slightly optimized conversion curve compared to model based constant mass transfer
coefficient. The difference in conversion could become larger for the mass transfer limited
esterification reactors. Figure 3.11 shows the effect of initial particle size on esterification
conversion for different monomer feed ratio. For Figure 3.11, TPA particle size distribution is
ignored and all particle are considered of equal size. It can be seen that TPA dissoultion
based on particle size becomes more important at low monomer feed ratio, because larger
particle size can lead to mass transfer limitation due to deficiency of excess EG. Thus, the
model based on TPA particle size is advantageous for mass transfer limited esterification
reactions.
0
2
4
6
8
10
12
0 25 50 75 100 125 150
Time (min)
Concentration (m
ol/kg)
tc
b F
a F,S
a F,D
w
b T
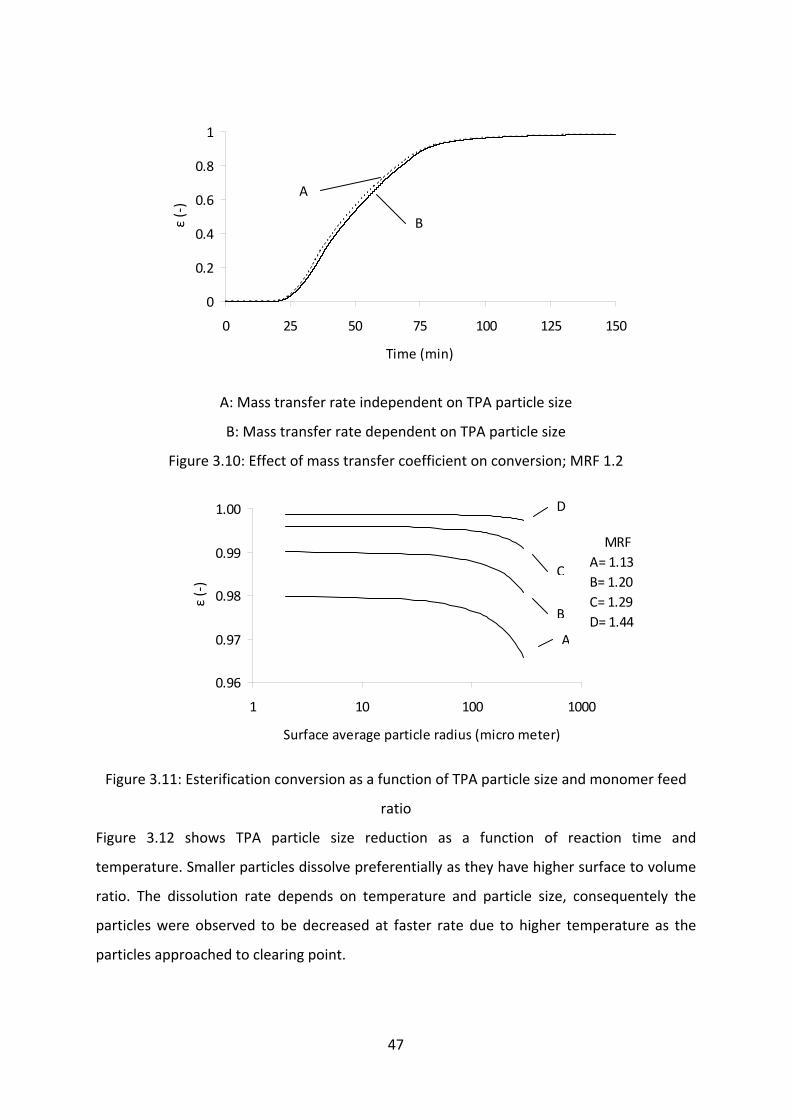
47
A: Mass transfer rate independent on TPA particle size
B: Mass transfer rate dependent on TPA particle size
Figure 3.10: Effect of mass transfer coefficient on conversion; MRF 1.2
Figure 3.11: Esterification conversion as a function of TPA particle size and monomer feed
ratio
Figure 3.12 shows TPA particle size reduction as a function of reaction time and
temperature. Smaller particles dissolve preferentially as they have higher surface to volume
ratio. The dissolution rate depends on temperature and particle size, consequentely the
particles were observed to be decreased at faster rate due to higher temperature as the
particles approached to clearing point.
0
0.2
0.4
0.6
0.8
1
0 25 50 75 100 125 150
Time (min)
ε (‐)
B
A
0.96
0.97
0.98
0.99
1.00
1 10 100 1000
Surface average particle radius (micro meter)
ε (‐)
C
B
A
D
MRFA= 1.13B= 1.20C= 1.29D= 1.44
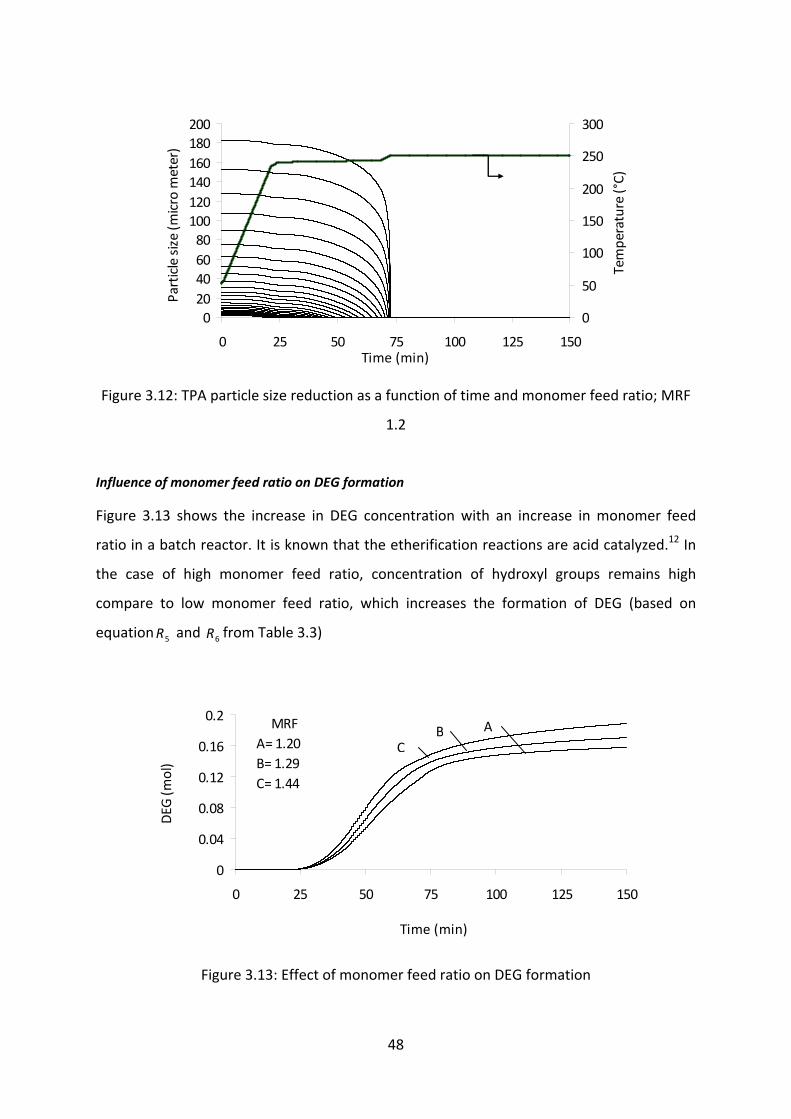
48
Figure 3.12: TPA particle size reduction as a function of time and monomer feed ratio; MRF
1.2
Influence of monomer feed ratio on DEG formation
Figure 3.13 shows the increase in DEG concentration with an increase in monomer feed
ratio in a batch reactor. It is known that the etherification reactions are acid catalyzed.12 In
the case of high monomer feed ratio, concentration of hydroxyl groups remains high
compare to low monomer feed ratio, which increases the formation of DEG (based on
equation 5R and 6R from Table 3.3)
Figure 3.13: Effect of monomer feed ratio on DEG formation
020406080100120140160180200
0 25 50 75 100 125 150Time (min)
Particle size (m
icro meter)
0
50
100
150
200
250
300
Temperature (°C)
0
0.04
0.08
0.12
0.16
0.2
0 25 50 75 100 125 150
Time (min)
DEG
(mol)
MRFA= 1.20B= 1.29C= 1.44
BC
A
49
Conclusion
The aim of this work was to study the influence of EG/TPA molar feed ratio on various
aspects of esterification process and to simulate esterification reactions with solid‐liquid
phase equilibrium for a reliable prediction of the generated oligomers properties. At lower
monomer feed ratio, degree of polymerization was observed to be increased due to higher
concentration of terminal hydroxyl groups in comparison to free hydroxyl end groups of EG.
However, lowering of the monomer feed ratio increased the TPA dissolution time. Influence
of TPA particle size and its distribution has been checked on reaction heterogeneity by
simulation. Esterification conversion and oligomeric chain length became more sensitive
towards TPA particle size as the EG/TPA feed ratio was lowered. It is advantageous to use
the model based on TPA particle size for mass transfer limited esterification reactions.
Simulation carried out with help of the given kinetic model agrees to a good extent with
experimental data.
Nomenclature
D,Fa carboxyl groups of dissolved TPA [mol kg‐1]
TF aaa += total carboxyl groups [mol kg‐1]
0a saponification number [mol kg‐1]
TF bbb += total hydroxyl groups [mol kg‐1]
DEG diethylene glycol
EG ethylene glycol
H+ dissociated protons from carboxyl groups [mol kg‐1]
IV intrinsic viscosity [dl g‐1]
kE,i rate constant [kg mol‐1 min‐1]
kD mass transfer coefficient based on particle size [min‐1]
ks mass transfer coefficient [m min‐1]
mEG mass of ethylene glycol [kg]
mL mass of liquid phase [kg]
MEG mole mass of EG [g mol‐1]
MPET mole mass of PET oligomers [g mol‐1]
Mn number average molecular weight [g mol‐1]
MTPA mole mass of TPA [g mol‐1]
50
mTPA,S mass of solid TPA [kg]
MRI EG/TPA feed ratio, initial [‐]
MRF EG/TPA feed ratio, final [‐]
Mw mole mass of water [g mol‐1]
n degree of polymerization or chain length [‐]
np,i number of TPA particles [‐]
p overall conversion [‐]
pKa acidity of carboxyl group in TPA [‐]
TPA terephthalic acid
ri TPA particle radius of particle fraction, i [μm]
Sb antimony ion
V0 initial volume of TPA solid phase [μm3]
w water [mol]
Greek Letters
α fraction of carboxyl groups in terminal groups [‐]
Γ specific surface area per unit volume [μm‐1]
ε esterification conversion [‐]
Appendix
Mass of liquid phase, mL is calculated as,
Total initial mass m0 in kg is given as,
000 ,EG,PTA mmm += (27)
Initial mass of liquid phase in kg is given as,
)166.0β( ,0,0,0, ⋅⋅+= EGTPAEGEGL mmm (28)
Mass of liquid phase in kg at any given time is given as,
⎥⎦
⎤⎢⎣
⎡ −⋅⋅−⋅+⋅=
0
000
018021
,L
,L,LL m
m).Nm(mm ε (29)
Derivation of equations (22) and (23):
Mole mass of PET is given as,
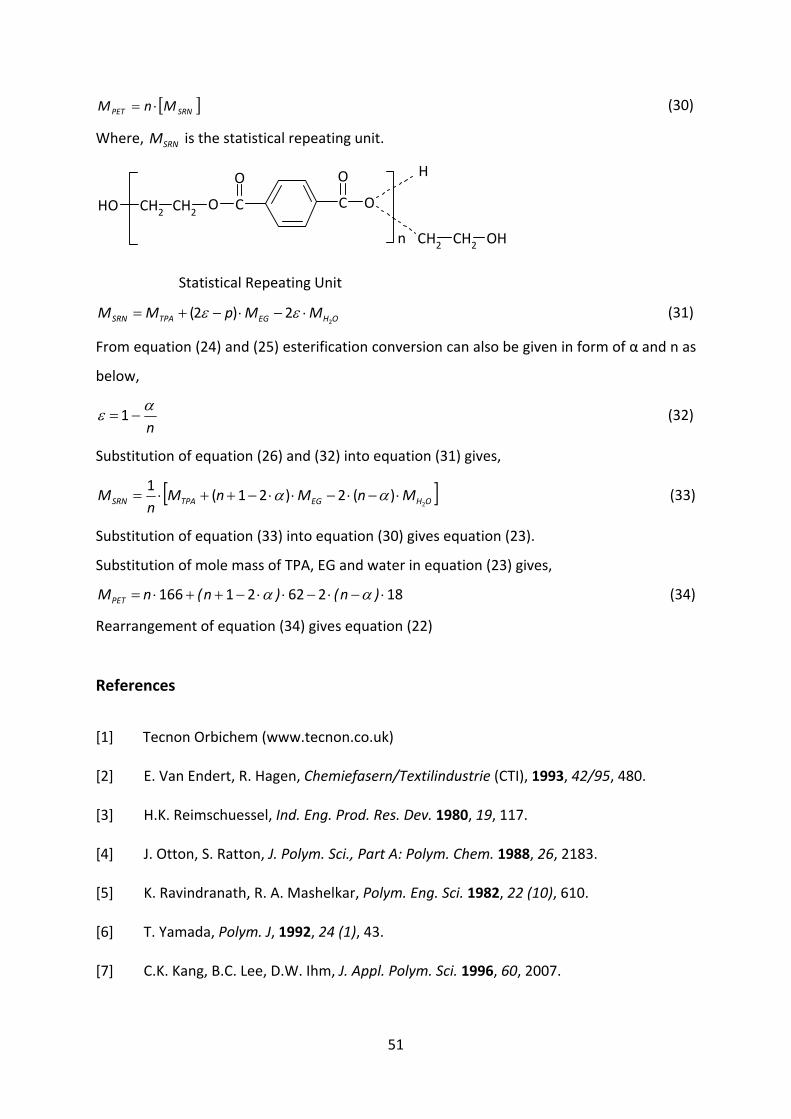
51
[ ]SRNPET MnM ⋅= (30)
Where, SRNM is the statistical repeating unit.
CH2CH2OH C
n
C
O
O
O
O
H
CH2 CH2 OH
Statistical Repeating Unit
OHEGTPASRN MMpMM2
2)2( ⋅−⋅−+= εε (31)
From equation (24) and (25) esterification conversion can also be given in form of α and n as
below,
nαε −= 1 (32)
Substitution of equation (26) and (32) into equation (31) gives,
[ ]OHEGTPASRN MnMnMn
M2
)(2)21(1
⋅−⋅−⋅⋅−++⋅= αα (33)
Substitution of equation (33) into equation (30) gives equation (23).
Substitution of mole mass of TPA, EG and water in equation (23) gives,
1826221166 ⋅−⋅−⋅⋅−++⋅= )n()n(nMPET αα (34)
Rearrangement of equation (34) gives equation (22)
References
[1] Tecnon Orbichem (www.tecnon.co.uk)
[2] E. Van Endert, R. Hagen, Chemiefasern/Textilindustrie (CTI), 1993, 42/95, 480.
[3] H.K. Reimschuessel, Ind. Eng. Prod. Res. Dev. 1980, 19, 117.
[4] J. Otton, S. Ratton, J. Polym. Sci., Part A: Polym. Chem. 1988, 26, 2183.
[5] K. Ravindranath, R. A. Mashelkar, Polym. Eng. Sci. 1982, 22 (10), 610.
[6] T. Yamada, Polym. J, 1992, 24 (1), 43.
[7] C.K. Kang, B.C. Lee, D.W. Ihm, J. Appl. Polym. Sci. 1996, 60, 2007.
52
[8] S.K. Gupta, A. Kumar, “Reaction engineering of step growth polymerization”, Plenum
Press, New York, 1987.
[9] C.K. Kang, B.C. Lee, D.W. Ihm, D.A. Tremblay, J. Appl. Polym. Sci. 1997, 63, 163.
[10] B.Gantillon, R. Spitz, T.F. McKenna, Macromol. Mater. Eng. 2004, 289, 88.
[11] K. Ravindranath, R. A. Mashelkar, Chem. Eng. Sci. 1986, 41/9, 2197.
[12] J.W. Chen, L.W. Chen, J. Polym. Sci., Part A: Polym. Chem. 1998, 36, 3073.
[13] G. Challa, J. Polym. Sci., Makromol. Chem. 1959, 38, 105.
[14] J. Otton, S. Ratton, J. Polym. Sci., Part A: Polym. Chem. 1991, 29, 377.
[15] T. Yamada, Y. Imamura, O. Makimura, Polym. Eng. Sci. 1985, 25(12), 788.
[16] ASPEN databank, Aspen Technology, Inc.
[17] T. Yamada, J. Appl. Polym. Sci. 1990, 41, 565.
[18] ASPEN polyester technology manual, Chapter 1, Unit operation models, ASPEN
Technology, Inc. 2004, 12.1, 26.
[19] H.C. Brown et al., in E.A. Braude, and F.C. Nachod “Determination of Organic
Structures by Physical Methods”, Academic Press, New York, 1955.
[20] J. Otton, S. Ratton, J. Polym. Sci., Part A: Polym. Chem. 1988, 26, 2183.
[21] D. Tremblay, Using simulation technology to improve profitability in the polymer
industry, Paper presented at AIChE Annual meeting, 1999.
53
Chapter 4: Influence of Reaction Pressure on Semibatch Esterification Process
of Poly(ethylene terephthalate) Synthesis
Abstract
Influence of esterification pressure on oligomeric properties was studied by using a
semibatch reactor. Esterification model for semibatch process was further improved by
considering EG reflux in the column. It was observed that increasing the reaction pressure
decreases EG/water ratio in the column while increasing the EG/TPA feed ratio increases
EG/water ratio in the column. By controlling the EG reflux in a semibatch reactor, it is
possible to generate oligomers with similar oligomeric properties observed at different
stages of continuous process.

54
Introduction
Poly(ethylene terephthalate) (PET) is considered as a very important polymer in commodity
polymers after polyolefin. PET is mostly used for fibers, bottles, and films. PET is mainly
synthesized from terephthalic acid (TPA) and ethylene glycol (EG) and the production of PET
essentially involves three steps: direct esterification, prepolymerization, melt
polycondensation. During the esterification process, water is continuously removed as a
byproduct to form low molecular weight oligomers where the latter (chain length of 1‐10)
are conveyed to the prepolymerization step and subsequently to the final melt
polymerization. In the semibatch esterification process, reaction temperature is increased
gradually with the formation of oligomers and the vapors emerging from the reactor are
passed through distillation column to separate water from EG and mainly EG is refluxed
back to the reactor. In the presented work, we have studied the influence of reaction
pressure on EG reflux and subsequently its effect on oligomeric properties such as carboxyl
group, EG consumption, chain length (n), esterification conversion (ε) and diethylene glycol
(DEG) formation. Although, several mathematical models1,2,3 for continuous esterification
process have been published, in which influence of esterification pressure on oligomeric
properties have been presented; however, a little has been reported for the influence of
reaction pressure on a semibatch esterification process. Patel et al.4 have studied the
influence of TPA particle size and EG/TPA feed ratio on the oligomeric properties by
simulation for a semibatch reactor. In the current work, influence of pressure above
atmosphere are estimated by simulation using the model4 whose validity was confirmed by
several experiments in a semibatch rector.
Experimental method
The direct esterification was carried out in a “Parr” semibatch reactor of a 1‐liter reaction
volume and equipped with magnetic stirrer drive. EG (1.82 mol) and TPA (1.3 mol) were
mixed thoroughly to make paste and charged to the reactor. Reactor line and the slurry
were made oxygen free by applying nitrogen flush and vacuum simultaneously. Reactor was
pressurized with nitrogen up‐to 2.5 bar. Installed column was of a straight reflux type with
helix inner packing. The column temperature was maintained at 150 °C throughout the
reaction to separate water and EG and to prevent the temperature drop due to EG reflux.
55
The condenser temperature and stirrer speed was set to ‐4°C and 140 rpm respectively. Oil
temperature was set to 290 °C. With the increase of the reaction temperature, the pressure
was increased simultaneously and controlled with magnetic pressure valve. Pressure was
maintained constant throughout the experiment at desired set value. At the early phase of
esterification, the reaction temperature increased to the boiling point of EG at given
pressure and as the reaction progressed, oligomers were being formed and reaction
temperature increased due to increase of the boiling point of reaction phase. Resulting
reaction temperature increased from 230 to 260 °C. After 90 minutes, the pressure was
gradually reduced to the atmospheric pressure in 5 minutes and the condensate mixture
(water+EG) was collected and analyzed. At the same time, the esterified oligomers were
removed from the reactor and quenched in dry ice. Oligomers were analyzed for their
molecular weight and carboxyl groups’ concentration. Several experiments were carried out
with different set pressure in the range between 3 to 3.75 bar to study its influence on
oligomeric properties.
Intrinsic viscosity of oligomers, carboxyl groups, water in reaction byproduct mixture and
DEG were determined by the analytical methods given in chapter 2.

56
Results and discussion
Mathematical Model Reaction Scheme
Proton catalyzed esterification, polycondensation and etherification reactions are
considered in this study. Functional group approach is considered for the simulation to
determine end groups and byproducts effectively. Functional group description and
reactions scheme are given in Table 4.1 and Table 4.2, respectively. In this study, the fourth
order Runge‐Kutta method was used to solve differential equations numerically applying
Berkeley Madonna software package.
Table 4.1: Molecular structures of components considered.
Symbol Description Molecular structure
Fa Carboxyl group in terephthalic acid
Ta Carboxyl group attached to ester
chain end
Fb Hydroxyl group in ethylene glycol
Tb Hydroxyl group attached to ester
chain end
w Water
Td Diethylene glycol bound at ester
chain end
id Internal ether link COOCH2CH2OCH2CH2OOC
ei Internal ester group COO
y Tb or Ta
HOOC COOH
COHOOC
HOCH2CH2OH
HOCH2CH2O
OH2
HOCH2CH2OCH2CH2O
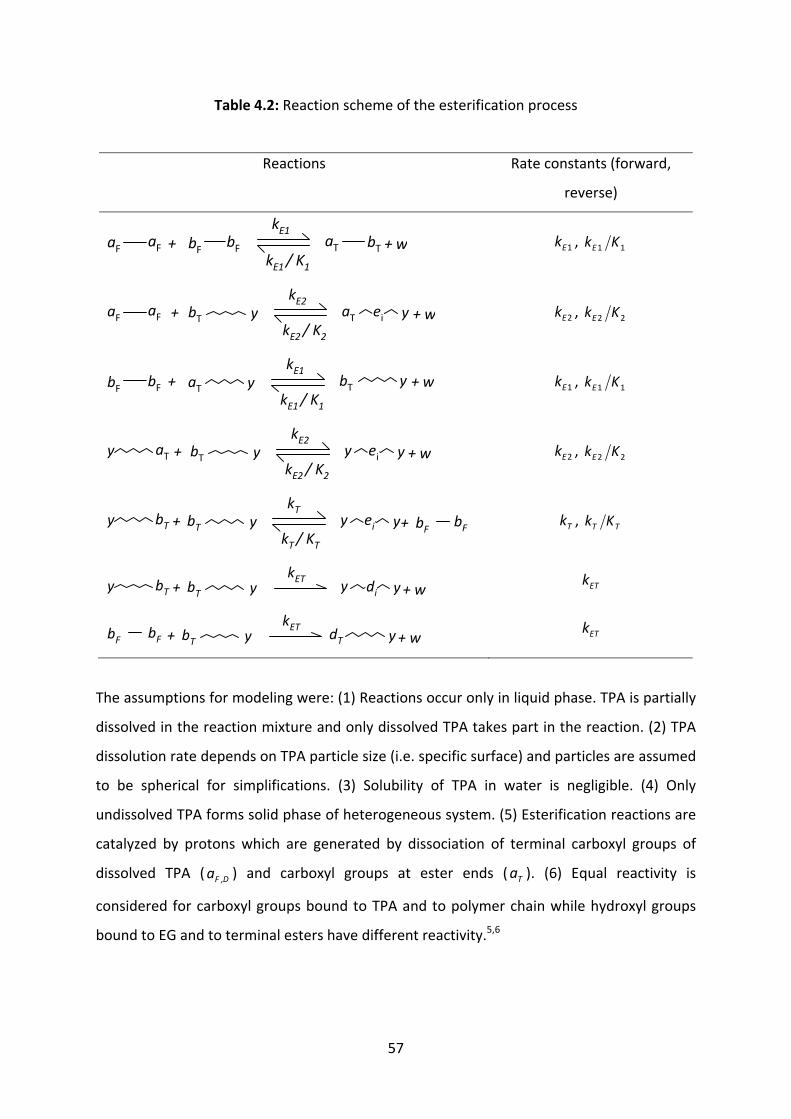
57
Table 4.2: Reaction scheme of the esterification process
Reactions Rate constants (forward,
reverse)
kE1+ bF bF aT bT + w
kE1 / K1aF aF
1Ek , 11 KkE
kE2+ bT aT + w
kE2 / K2
aF aF y yei
2Ek , 22 KkE
kE1+ aT bT + w
kE1 / K1bF bF y y
1Ek , 11 KkE
kE2+ bT y + w
kE2 / K2y yeiaTy
2Ek , 22 KkE
kT+ bT y +
kT / KTy yeibTy bF bF
Tk , TT Kk
kET+ bT yy ybTy + wdi
ETk
kET+ bT dTy y + wbF bF
ETk
The assumptions for modeling were: (1) Reactions occur only in liquid phase. TPA is partially
dissolved in the reaction mixture and only dissolved TPA takes part in the reaction. (2) TPA
dissolution rate depends on TPA particle size (i.e. specific surface) and particles are assumed
to be spherical for simplifications. (3) Solubility of TPA in water is negligible. (4) Only
undissolved TPA forms solid phase of heterogeneous system. (5) Esterification reactions are
catalyzed by protons which are generated by dissociation of terminal carboxyl groups of
dissolved TPA ( D,Fa ) and carboxyl groups at ester ends ( Ta ). (6) Equal reactivity is
considered for carboxyl groups bound to TPA and to polymer chain while hydroxyl groups
bound to EG and to terminal esters have different reactivity.5,6
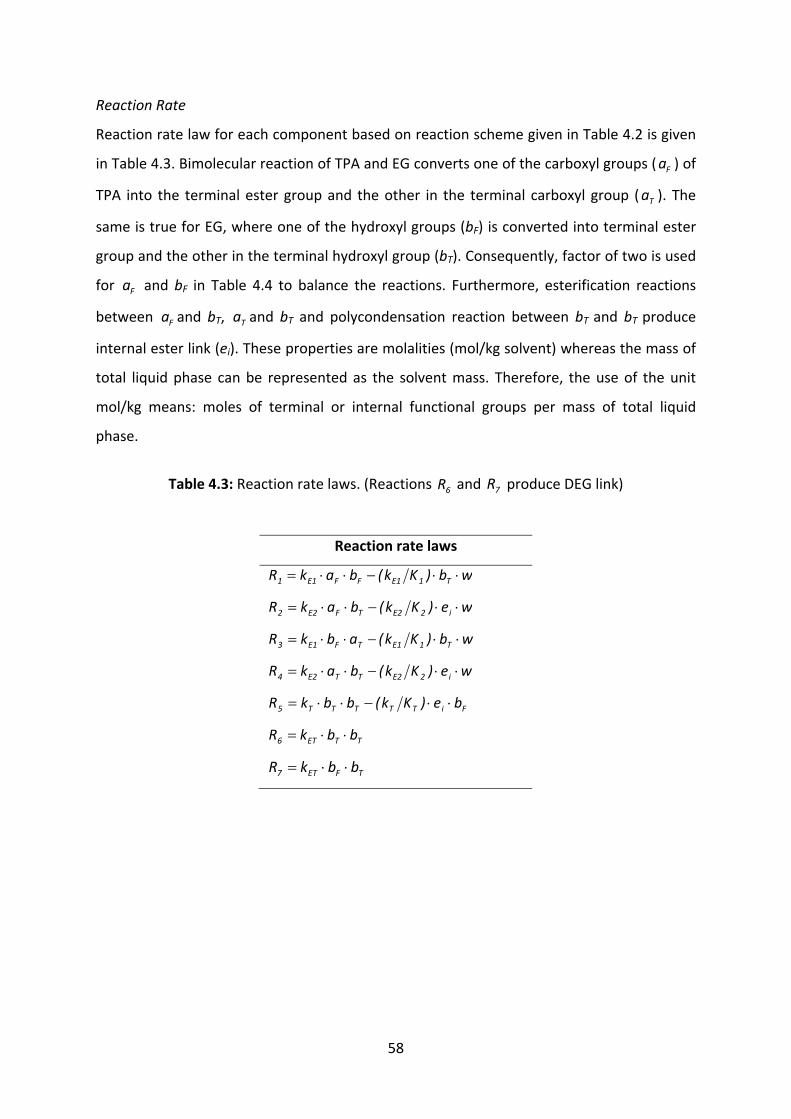
58
Reaction Rate
Reaction rate law for each component based on reaction scheme given in Table 4.2 is given
in Table 4.3. Bimolecular reaction of TPA and EG converts one of the carboxyl groups ( Fa ) of
TPA into the terminal ester group and the other in the terminal carboxyl group ( Ta ). The
same is true for EG, where one of the hydroxyl groups (bF) is converted into terminal ester
group and the other in the terminal hydroxyl group (bT). Consequently, factor of two is used
for Fa and bF in Table 4.4 to balance the reactions. Furthermore, esterification reactions
between Fa and bT, Ta and bT and polycondensation reaction between bT and bT produce
internal ester link (ei). These properties are molalities (mol/kg solvent) whereas the mass of
total liquid phase can be represented as the solvent mass. Therefore, the use of the unit
mol/kg means: moles of terminal or internal functional groups per mass of total liquid
phase.
Table 4.3: Reaction rate laws. (Reactions 6R and 7R produce DEG link)
Reaction rate laws
wb)Kk(bakR T1E1FFE11 ⋅⋅−⋅⋅=
we)Kk(bakR i2E2TFE22 ⋅⋅−⋅⋅=
wb)Kk(abkR T1E1TFE13 ⋅⋅−⋅⋅=
we)Kk(bakR i2E2TTE24 ⋅⋅−⋅⋅=
FiTTTTT5 be)Kk(bbkR ⋅⋅−⋅⋅=
TTET6 bbkR ⋅⋅=
TFET7 bbkR ⋅⋅=

59
Table 4.4: Mass balance equations
Equations
21 22 RRdt
ad F ⋅−⋅−=
⎟⎟⎟⎟⎟
⎠
⎞
⎜⎜⎜⎜⎜
⎝
⎛
⎟⎠⎞
⎜⎝⎛
−−⋅−⋅+⋅−⋅−=
∏=
+
∗
z
z)z(EG
*EG
zEG
L
L)z(EG
L,FEG,v75F
P
P
m
Ny
bkRRRRdt
bd
0
131 22222
γγ
4321 RRRRdt
ad T −−++=
7654321T RRRRRRR
dt
bd−⋅−⋅−−+−+= 22
⎟⎟⎟⎟⎟
⎠
⎞
⎜⎜⎜⎜⎜
⎝
⎛
⎟⎠⎞
⎜⎝⎛
−−++++++=
∏=
+ z
z)z(w
*w
zw
L
*L)z(W
Lw,v
P
P
m
Ny
wkRRRRRRdtwd
0
1764321
γγ
( )76
iT RRdt
ddd++=
+
Phase equilibrium
Due to the limited solubility of TPA in EG and the esterification is occurring in liquid phase
only; the solid‐liquid equilibrium is considered to calculate the functional groups
concentration. In simulation, TPA solubility in EG and in oligomers is considered according to
Yamada et al.2 TPA solubility in EG is given as:
EG,TPAβ = 9062 exp [‐4877 / T] mol∙kg‐1 (1)
TPA solubility in oligomers is given as:
OLG,TPAβ = 374 exp [‐3831 / T] mol∙kg‐1 (2)
where T is the temperature in K
Maximum TPA solubility in the EG and in the oligomers, *Fa can be calculated by using
Equations (1), (2), (4), (5) and the esterification conversion, ε (for definition see equation
(26)).
*Fa = )( EGOLGEG ββεβ −⋅+ mol∙kg‐1 (3)

60
The solubility of TPA in terms of carboxyl groups in EG,
EGβ ≡ EG,TPAβ⋅2 mol∙kg‐1 (4)
The solubility of TPA in terms of carboxyl groups in oligomers,
OLGβ ≡ OLG,TPAβ⋅2 mol∙kg‐1 (5)
Reaction rate for total carboxyl groups (a) can be given as,
dt
ad
dt
ad
dt
ad
dtad TD,FS,F ++= (6)
Where, S,Fa represents the carboxyl groups attached to undissolved TPA. Carboxyl groups
become available by TPA dissolution in the liquid phase and consumed by esterification
reaction. TPA dissolution and esterification rate constant are given as kD and kE respectively.
It is assumed that the change of D,Fa in the presence of S,Fa is close to zero.
02121 ≈−−−⋅=−−=32144 344 21
nconsumptiondissolutio
D,F*
FDS,FD,F RR)aa(kRR
dt
da
dt
ad (7)
The mass transfer coefficient kD depends on the TPA particle specific surface. kD is calculated
based on TPA particle size distribution and particle specific surface according to Patel et al.4
Vapor‐liquid phase equilibrium is considered based on polymer‐NRTL parameters obtained
from ASPEN databank.7 EG and water are considered only volatile components while
oligomers and DEG are considered to be non volatile under used reaction conditions. The
mole fractions and activity coefficient are calculated based on apparent amount of water,
EG and oligomers in the liquid phase. The vapor phase mole fractions of EG and water are
given by the following equations.
PyPx EGEGEGEG ⋅=⋅⋅γ (8)
PyPx wwww ⋅=⋅⋅γ (9)
1=+++ OLGwEGDEG xxxx (10)
1=+ wEG yy (11)
where, DEGx , EGx , wx and OLGx are the liquid phase apparent mole fraction of DEG, EG,
water and oligomers, EGy and wy are the vapor phase mole fractions of EG and water, EGP
and wP are the vapor pressure of pure EG and pure water in bar, P is the total pressure in
bar, and EGγ and wγ are the activity coefficient of EG and water. Vapor pressures of pure
components are calculated from Yamada et al.2
61
( ) )./(/log.Plog EG 81931957750188087 +−+= ϑ (12)
( ) ( )22821668750196687 +−+= ϑ/./log.Plog w (13)
where,ϑ is the reaction temperature in °C
In Table 4.4, a simple approach has been considered for the mass balance equations for EG
and water. The terms for water and EG removal as condensate were derived by considering
the water and EG separation without column, within column and with column. The model
equations for each situation are given as follow,
EG and water separation without column
∗==ww
wL
*L*
wL
*L*
LP
Py
m
Nx
m
Nw
γ (14)
wL* is a molality of water in the melt at boundary layer. NL
* is the total moles of the reactive
components in the melt at boundary layer. The total number of moles at this position
should be comparable as the total number of moles in the bulk phase NL.
( ) ( )( )nabwmNN LFLLLL 2/2/,* °++=≈ (15)
where wL and bF,L represents the moles of water and bF in liquid phase. mL is the mass of
liquid phase which can be given as,
( ) °= a/nm aL 0 (16)
where na(0) are the initial moles of carboxylic acid groups and a° is the saponification
number. *wx is the mol fraction of water in the melt at boundary layer and *
wγ is the activity
coefficient of water in the melt at boundary layer. (calculated as per ASPEN PNRTL model)
EG and water separation within column
For the column having z stages, EG and water separation within column can be given as,
∏===
⎟⎠⎞
⎜⎝⎛=
⎥⎥⎦
⎤
⎢⎢⎣
⎡
−−
=⎥⎥⎦
⎤
⎢⎢⎣
⎡ z
z)zat(w
zw
)z(EG
)z(EG
)z(w
)z(w
PP
x
y
x
y
000 1
1γ (17)
where yw(z) is the mole fraction of water in vapor phase at stage z, xEG(z=0) is the mole fraction
of EG in the liquid phase at bottom of the column, yEG(z) is the mole fraction of EG in vapor
phase at stage z, xw(z=0) is the mole fraction of water in the liquid phase at bottom of the

62
column.
EG and water separation with column,
By combining equation (14) and (17) and considering theoretical number of column stage z
= 2.2 (measured by EG‐water VLE‐data); EG and water separation with column can be given
as,
∏=
⎟⎠⎞
⎜⎝⎛
=∗
z
z)zat(w
zw*
ww
)z(w
L
L*L
P
P
P
P
y
m
Nw
0
γγ (18)
It means, the relation between the molality of the water in the melt at boundary layer (wL*)
and the mole fraction of water in the total condensate phase (yw(z)) can be given as,
∏=
+
⎟⎠⎞
⎜⎝⎛
=∗
Z
z)zat(w
*w
zw
)z(w
L
L*L
P
P
y
m
Nw
0
1
γγ (19)
Mass transfer coefficient of water (kv,w) and EG (kv,EG) is taken from Rafler et al.8 By using the
mass transfer coefficient in equation (19), the total transfer of water and EG from the
respective bulk phases wL and bF,L into the condensate (yw(z), yEG(z)) is given by,
( )⎟⎟⎟⎟⎟
⎠
⎞
⎜⎜⎜⎜⎜
⎝
⎛
⎟⎠⎞
⎜⎝⎛
−=−
∏=
+ z
z)zat(w
*w
zw
L
*L)z(w
Lw,v*
LLw,v
P
P
m
Ny
wkwwk
0
1
γγ
(20)
( )⎟⎟⎟⎟⎟
⎠
⎞
⎜⎜⎜⎜⎜
⎝
⎛
⎟⎠⎞
⎜⎝⎛
−=−
∏=
+
∗
z
z)z(EG
*EG
zEG
L
L)z(EG
L,FEG,v*L,FL,FEG,v
P
P
m
Ny
bkbbk
0
12
γγ (21)
Catalysis
In the present study, the esterification reactions were studied without any metal catalysts.
Esterification reactions involve acid catalysis mechanism. The catalytic influence of an acid
depends on the degree of dissociation of the acid. Acid strength (pKa) of dissolved TPA
carboxyl group and oligomeric terminal carboxyl group are considered to be the same.9,10
The pKa value of carboxyl group of TPA and terminal carboxyl groups is given in mol/L. From
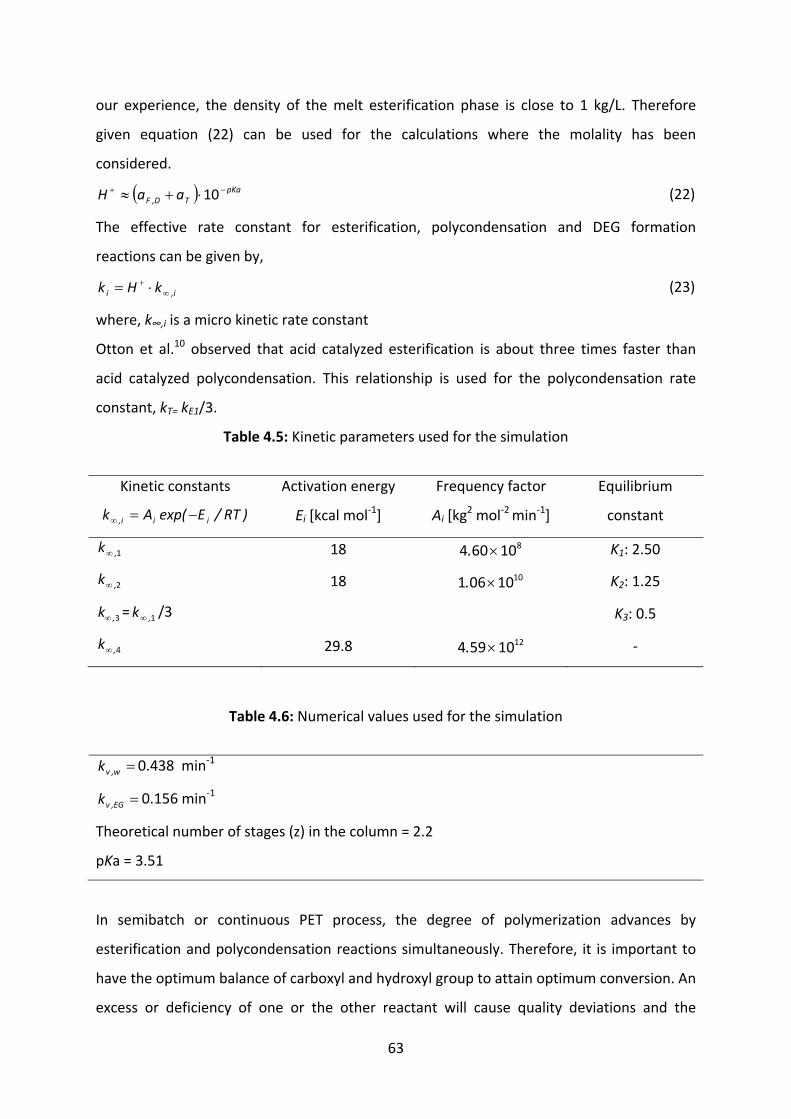
63
our experience, the density of the melt esterification phase is close to 1 kg/L. Therefore
given equation (22) can be used for the calculations where the molality has been
considered.
( ) pKaTD,F aaH −+ ⋅+≈ 10 (22)
The effective rate constant for esterification, polycondensation and DEG formation
reactions can be given by,
i,i kHk ∞+ ⋅= (23)
where, k∞,i is a micro kinetic rate constant
Otton et al.10 observed that acid catalyzed esterification is about three times faster than
acid catalyzed polycondensation. This relationship is used for the polycondensation rate
constant, kT= kE1/3.
Table 4.5: Kinetic parameters used for the simulation
Kinetic constants
)RT/Eexp(Ak iii, −=∞
Activation energy
Ei [kcal mol‐1]
Frequency factor
Ai [kg2 mol‐2 min‐1]
Equilibrium
constant
1,k∞ 18 810604 ×. K1: 2.50
2,k∞ 18 1010061 ×. K2: 1.25
3,k∞ = 1,k∞ /3 K3: 0.5
4,k∞ 29.8 1210594 ×. ‐
Table 4.6: Numerical values used for the simulation
=w,vk 0.438 min‐1
=EG,vk 0.156 min‐1
Theoretical number of stages (z) in the column = 2.2
pKa = 3.51
In semibatch or continuous PET process, the degree of polymerization advances by
esterification and polycondensation reactions simultaneously. Therefore, it is important to
have the optimum balance of carboxyl and hydroxyl group to attain optimum conversion. An
excess or deficiency of one or the other reactant will cause quality deviations and the

64
changes in the reaction rate.11
In semibatch process, esterification phase is nearly completed before applying full vacuum
to initiate polycondensation phase. Therefore, at the beginning of batch polycondensation,
oligomeric fraction of carboxyl groups in total terminal groups (α) remains significantly
lower than in continuous process. While, in continuous process, the carboxyl group
concentration changes at different stages due to their consumption via esterification and
formation via ester link degradation reactions. In most industrial continuous processes, the
melt‐phase reaction is performed in three to five continuous reactors in series.12 Therefore,
it is desirable to have specific oligomeric α at every stage to fulfill the requirement of next
stage in continuous process.
Yokoyama13 and Duh et al.14 studied the effect of carboxyl group concentration on
polycondensation rate in melt and solid phase respectively. However, the formation of
oligomers with α having broad values and its effect on esterification and polycondensation
rate has not been studied extensively. As far as we know, there has not been a paper
narrating the generation of oligomers of different α by a semibatch process that resembles
the oligomers observed at the different stages of a continuous process. In this paper, we
have made an attempt to simulate continuous process functional group profile by using
semi batch process. In our previous studies4, we generated the oligomers of different α
values by varying the EG/TPA feed ratio. However, the obtained α value was observed to be
lower than in continuous process. The feed ratio could not be lowered further due to
extremely low solubility of TPA in EG. In presented work, we have generated oligomers of
different α by varying the esterification pressure at constant EG/TPA feed ratio.
Figure 4.1 shows the influence of esterification pressure on fraction of unreacted EG to
initial EG feed. This fraction can be calculated as,
2
200
LR
VL m)p(aEGEGEGEGEG
⋅−⋅⋅°−=−=+
ε (24)
where, EGL and EGV are the moles of unreacted EG in liquid and vapor phase respectively.
EG0 and EGR are the moles of initial and reacted EG respectively. ε and p are the
esterification conversion and conversion by chain propagation respectively.

65
Figure 4.1: Effect of esterification pressure on unreacted EG in vapour and liquid phase.
Symbols: experimental values; Line: calculated
Unreacted EG at the end of esterification phase can be calculated by using equation (24)
which simplifies the influence of pressure on EG reflux. As can be seen in Figure 4.1, an
increase in esterification pressure boosts EG consumption and thus lowers unreacted EG.
Furthermore, to investigate the influence of pressure and EG/TPA feed ratio on vapour
phase composition, condensate was collected at the end of esterification and analysed for
EG and w content. From Figure 4.2, it can be seen that increasing pressure reduces EG/w
ratio in the vapour phase by increasing the EG reflux. From Figure 4.3, it is seen that EG/w
ratio in the vapour phase exhibits some opposite behaviour with increasing EG/TPA feed
ratio. This is due to the increasing EG mol fraction in liquid phase enhances EG mol fraction
in vapour phase.
0.16
0.20
0.24
0.28
0.32
3 3.2 3.4 3.6 3.8
(EG0‐EG
R)/EG0(‐)
P (bar)

66
Figure 4.2: Effect of esterification pressure on EG/W in vapor phase.
Symbols: experimental values; Line: calculated
Figure 4.3: Effect of EG/TPA feed ratio on EG/W in vapor phase. Pressure: 4 bar
From Figure 4.4 it can be seen that lowering the pressure in esterification phase decreases
the EG reflux and reduces the EG concentration in liquid phase. Reduction of excess EG in
liquid phase promotes further esterification of aT with bT and also lowers reverse
polycondensation reaction which is responsible to increase n and α. Figure 4.4 suggests that
it is possible to prepare oligomers having α value of a broad range by varying the EG reflux
or the reaction pressure instead of varying the EG/TPA feed ratio. n was calculated from the
measured intrinsic viscosity using Equation (25).4
( ) 1928862 /αMn n ⋅+−= (25)
where 47061410273 .n IV.M ⋅×=
0.00
0.04
0.08
0.12
0.16
0.20
3 3.2 3.4 3.6 3.8
EG/w
in vapor phase (m
ol/m
ol)
P (bar)
0.03
0.04
0.05
0.06
0.07
0.08
0.09
1 1.2 1.4 1.6 1.8
EG/w
in vapor phase (m
ol/m
ol)
EG/TPA (mol/mol)

67
Figure 4.4: Effect of esterification pressure on n and α.
Symbols: experimental values; Line: calculated
Figure 4.5 supports that higher reaction pressure increases the EG concentration in liquid
phase which promotes both esterification and etherification and thus overall EG
consumption was observed to be enhanced. DEG formation was observed much higher than
commercial continuous process. This was expected due to higher reaction pressure and
reactions carried without any DEG suppressant.
Figure 4.5: Influence of reaction pressure on DEG formation.
Symbols: experimental values; Line: calculated
Esterification conversion ε, which represents conversion of TPA into esters, can be
expressed as,
°−=aa
1ε (26)
0.0
0.2
0.4
0.6
0.8
2
3
4
5
6
7
8
3 3.2 3.4 3.6 3.8
α (‐)
n (‐)
P (bar)
n
α
2
3
4
5
6
3 3.2 3.4 3.6 3.8
DEG
(wt%
)
P (bar)
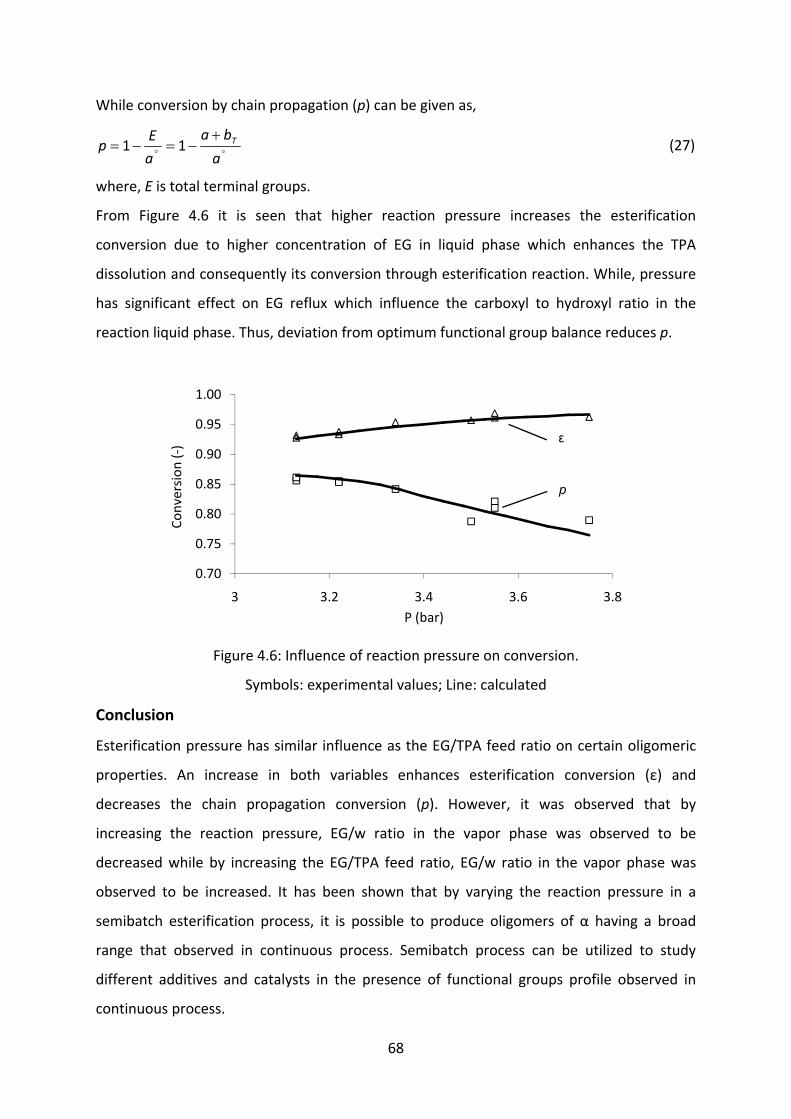
68
While conversion by chain propagation (p) can be given as,
°°
+−=−=
a
ba
a
Ep T11 (27)
where, E is total terminal groups.
From Figure 4.6 it is seen that higher reaction pressure increases the esterification
conversion due to higher concentration of EG in liquid phase which enhances the TPA
dissolution and consequently its conversion through esterification reaction. While, pressure
has significant effect on EG reflux which influence the carboxyl to hydroxyl ratio in the
reaction liquid phase. Thus, deviation from optimum functional group balance reduces p.
Figure 4.6: Influence of reaction pressure on conversion.
Symbols: experimental values; Line: calculated
Conclusion
Esterification pressure has similar influence as the EG/TPA feed ratio on certain oligomeric
properties. An increase in both variables enhances esterification conversion (ε) and
decreases the chain propagation conversion (p). However, it was observed that by
increasing the reaction pressure, EG/w ratio in the vapor phase was observed to be
decreased while by increasing the EG/TPA feed ratio, EG/w ratio in the vapor phase was
observed to be increased. It has been shown that by varying the reaction pressure in a
semibatch esterification process, it is possible to produce oligomers of α having a broad
range that observed in continuous process. Semibatch process can be utilized to study
different additives and catalysts in the presence of functional groups profile observed in
continuous process.
0.70
0.75
0.80
0.85
0.90
0.95
1.00
3 3.2 3.4 3.6 3.8
Conversion
(‐)
P (bar)
ε
p

69
Nomenclature
D,Fa carboxyl groups of dissolved TPA [mol kg‐1]
TF aaa += total carboxyl groups [mol kg‐1]
°a saponification number [mol kg‐1]
DEG diethylene glycol
E total terminal group [mol kg‐1]
EG ethylene glycol
H+ dissociated protons from carboxyl groups [mol kg‐1]
IV intrinsic viscosity [dl g‐1]
k,i effective rate constant [kg mol‐1 min‐1]
kD mass transfer coefficient based on particle size [min‐1]
kv,i mass transfer coefficient of component i [min‐1]
mL mass of liquid phase [kg]
Mn number average molecular weight [g mol‐1]
MRI EG/TPA feed ratio [‐]
n chain length [‐]
P pressure [bar]
p conversion by chain propagation [‐]
pKa acidity of carboxyl groups [‐]
TPA terephthalic acid
z number of stages in the column [‐]
Greek Letters
α fraction of carboxyl groups in terminal groups [‐]
ε esterification conversion [‐]
70
References
[1] K. Ravindranath, R. Mashelkar, Polym. Eng. Sci., 1982, 22, 10.
[2] T. Yamada, Polym. J., 1992, 24(1), 43.
[3] C.K. Kang, B.C. Lee, D.W. Ihm, D. A. Tremblay, J. App. Polym. Sci., 1997, 63, 163.
[4] H. Patel, G. Feix, R. Schomaecker, Macromol. React. Eng., 2007, 1, 502.
[5] G. Challa, J. Polym. Sci., Makromol. Chem. 1959, 38, 105.
[6] J. Otton, S. Ratton, J. Polym. Sci., Part A: Polym. Chem. 1991, 29, 377.
[7] ASPEN databank, Aspen Technology, Inc.
[8] G. Rafler, F. Herfurth, B.Otto, J. Marth, H. Gajewski, K. Zacharias, Acta
Polymerica, 1989, 40 (1), 44.
[9] H. C. Brown, ‘‘Determination of Organic Structures by Physical Methods’’, E. A.
Braude, F. C. Nachod, Eds., Academic Press, New York 1955.
[10] J.Otton, S. Ratton, J. Polym. Sci. Part A: Polym. Chem. 1988, 26, 2183.
[11] E. van Endert, R. Hagen, Chemiefasern/Textilindustrie (CTI), 1993, 42/95, 480.
[12] Th. Rieckmann and S. Voelker, Modern Polyesters, J. Wiley & Sons, Ltd., 93,
2003.
[13] H. Yokoyama, T. Sano, T. Chijiwa, R. Kajiya, Kobunshi Ronbunshu, 1979, 36(8),
557.
[14] B. Duh, J. App. Polym. Sci., 2002, 83, 1288.

71
Chapter 5: Influence of Oligomeric Carboxyl and Hydroxyl Group Balance on
Catalyzed Polycondensation of PET Synthesis
Abstract
Continuous Poly(ethylene terephthalate) (PET) process contains different carboxyl to
hydroxyl end group balance profiles for each of the reactors within the reactor cascade.
Such a different functional group balance profile is generated in lab scale experiments by
using a semibatch reactor. Several sets of experiments are performed to check the influence
of oligomeric carboxyl and hydroxyl group balance on antimony and titanium catalyzed
polycondensation phase of PET synthesis with respect to reaction rates and molecular
weight. Ratio of esterification and transesterification rate coupled with antimony catalyst
inhibition by hydroxyl groups leads to strong dependency of overall reaction rate on
functional group balance. Optimal functional group composition is investigated by
simulations based on a comprehensive kinetic model.

72
Introduction
The kinetics of melt phase polycondensation of Poly(ethylene terephthalate) (PET) process
has been studied by several groups mainly in thin films,1 batch or continuous reactors and it
is generally accepted that the polycondensation rate is mostly affected by the catalyst type
and concentration, temperature, diffusion of volatiles from reaction melt and the carboxyl
content.2 First three parameters have been widely studied. However, only a few authors
have discussed the influence of carboxyl group content on the overall reaction rate. Duh et
al.3 and Yokoyama et al.4 have studied the influence of carboxyl group content in a solid
phase and in continuous melt phase, respectively. Duh et al. proposed an optimal carboxyl
group concentration for pelletized solid state polycondensation. Yokoyama proposed
optimal carboxyl group concentration in oligomers for the melt phase polycondensation, but
detailed reasons for the optimal carboxyl content were missing. Berkau et al.5 proposed
preferred carboxyl group concentration region for optimal reaction rate during melt
polycondensation and predicted due to critical nature of carboxyl/hydroxyl group ratio and
varied diffusivities of volatiles in the melt. Rafler et al.6 presented the detailed comparison
of reaction model based on the reaction‐diffusion convection and reaction‐mass transfer
and suggested that the reaction‐mass transfer model proves to be more suitable for the
stirred polycondensation systems. Therefore, only the mass transfer coefficient has to be
estimated.
In two previous contributions,7,8 we have developed mathematical models for the
semibatch esterification process for PET synthesis. In this investigation, we have studied the
influence of carboxyl group fraction (α, carboxyl group content in total end groups) in the
semibatch melt polycondensation process by taking mass transfer of ethylene glycol (EG)
and water into account. We have used the available experimental data to verify the model.
Primarily, low molecular weight oligomers are produced from esterification reaction of
terephthalic acid (TPA) and EG. These low molecular weight oligomers were further
polymerized at comparatively higher temperature and under vacuum to obtain prepolymer
with fiber or film grade molecular weight.

73
Experimental Method
To study the effect of oligomeric carboxyl to hydroxyl balance on antimony and titanium
catalyzed polycondensation, esterification phase was carried according to the method given
in Patel et al.8 with added catalyst Sb (230 ppm, Atofina) or Ti (15 ppm, Equipolymers
GmbH) and 2 wt.% isophthalic acid (purity 99%, Fluka Chemie). Esterification was completed
after 90 minutes and oligomeric sample was collected by opening the reactor bottom valve
under nitrogen pressure slightly above atmospheric pressure to avoid oxygen penetration
into the reactor. After sampling, the oligomeric melt level in the reactor was maintained at
about 25% of the reactor volume. Oil temperature was increased to 295 °C. Pressure was
reduced gradually in the span of 5 minutes and later full vacuum was applied to favour
polycondensation. The reactor was equipped with helical ribbon type of stirrer and the
initial rotational speed was kept at 140 rpm in the prepolymerization phase. As the
oligomeric molecular weight increased, reaction temperature also increased due to shear.
Once the reaction temperature reached 280 °C, stirrer speed was reduced to 50 rpm and
kept constant throughout the remaining polycondensation phase. Several screening tests
were performed under different rotational speed to check its’ influence on overall
conversion. Optimal conversion was obtained with stirring speed combination of 140 rpm in
prepolymerization and 50 rpm in the final polymerization phase. However, it should be
noted here that such an optimal stirring speed depends on reactor geometry and stirrer
type. Each experiment was concluded after 45 minutes for Sb catalyzed polymerization.
While, for experiments containing Ti catalyst, reaction time was varied based on obtained
molecular weight. Finally, the polymers were removed under nitrogen pressure in a water
bath and pelletized. Collected samples were characterized by measuring the carboxyl value
and intrinsic viscosity.
From measured intrinsic viscosity (IV), molecular weight can be given as,
47061410273 .n IV.M ⋅×=
(1)
Total end‐group concentration (E) in mol/kg is given as,
Mn/E 2000= (2)
Where Mn is in g/mol. Carboxyl concentration (aT) is determined by the Karl‐Fischer
titration method. Hydroxyl group concentration of terminal esters (bT) can be determined by
subtracting acid group concentration from E.
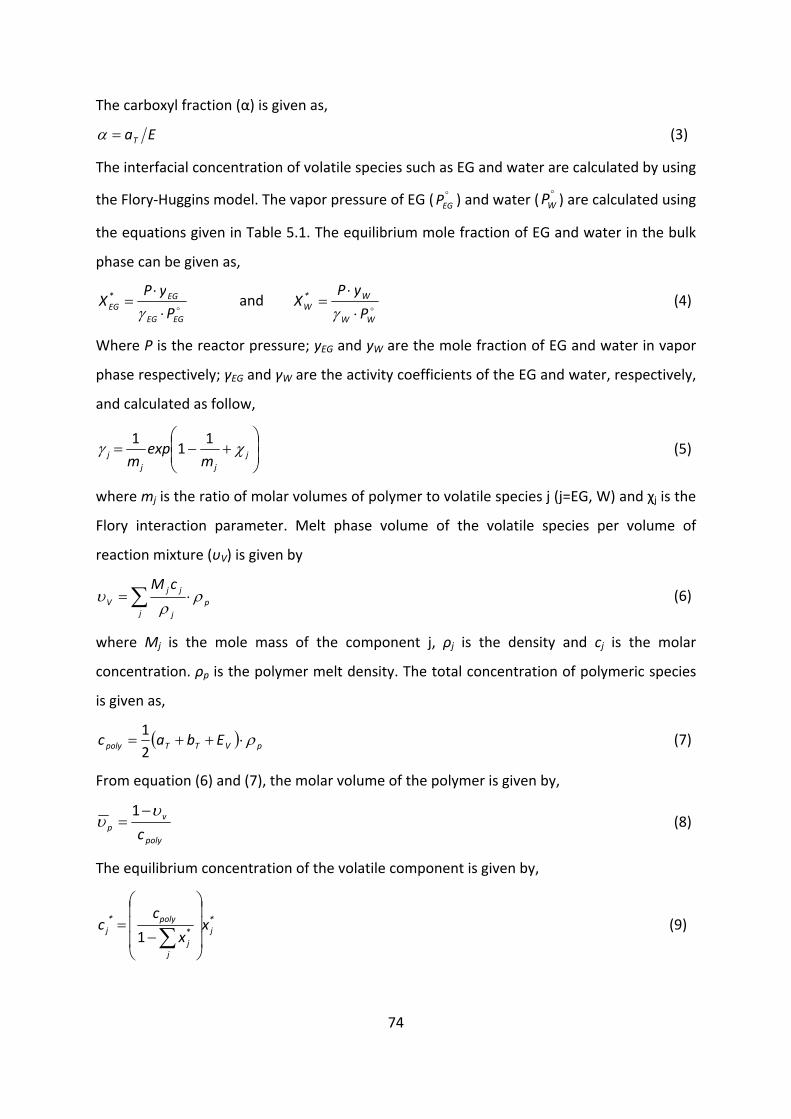
74
The carboxyl fraction (α) is given as,
EaT=α (3)
The interfacial concentration of volatile species such as EG and water are calculated by using
the Flory‐Huggins model. The vapor pressure of EG ( °EGP ) and water ( °
WP ) are calculated using
the equations given in Table 5.1. The equilibrium mole fraction of EG and water in the bulk
phase can be given as,
oEGEG
EG*EG P
yPX
⋅⋅
=γ
and oWW
W*W P
yPX
⋅⋅
=γ
(4)
Where P is the reactor pressure; yEG and yW are the mole fraction of EG and water in vapor
phase respectively; γEG and γW are the activity coefficients of the EG and water, respectively,
and calculated as follow,
⎟⎟⎠
⎞⎜⎜⎝
⎛+−= j
jjj m
expm
χγ 11
1 (5)
where mj is the ratio of molar volumes of polymer to volatile species j (j=EG, W) and χj is the
Flory interaction parameter. Melt phase volume of the volatile species per volume of
reaction mixture (υV) is given by
∑ ⋅=j
pj
jjV
cMρ
ρυ (6)
where Mj is the mole mass of the component j, ρj is the density and cj is the molar
concentration. ρp is the polymer melt density. The total concentration of polymeric species
is given as,
( ) pVTTpoly Ebac ρ⋅++=21
(7)
From equation (6) and (7), the molar volume of the polymer is given by,
poly
vp c
υυ
−=1
(8)
The equilibrium concentration of the volatile component is given by,
*j
j
*j
poly*j x
x
cc
⎟⎟⎟
⎠
⎞
⎜⎜⎜
⎝
⎛
−=
∑1 (9)
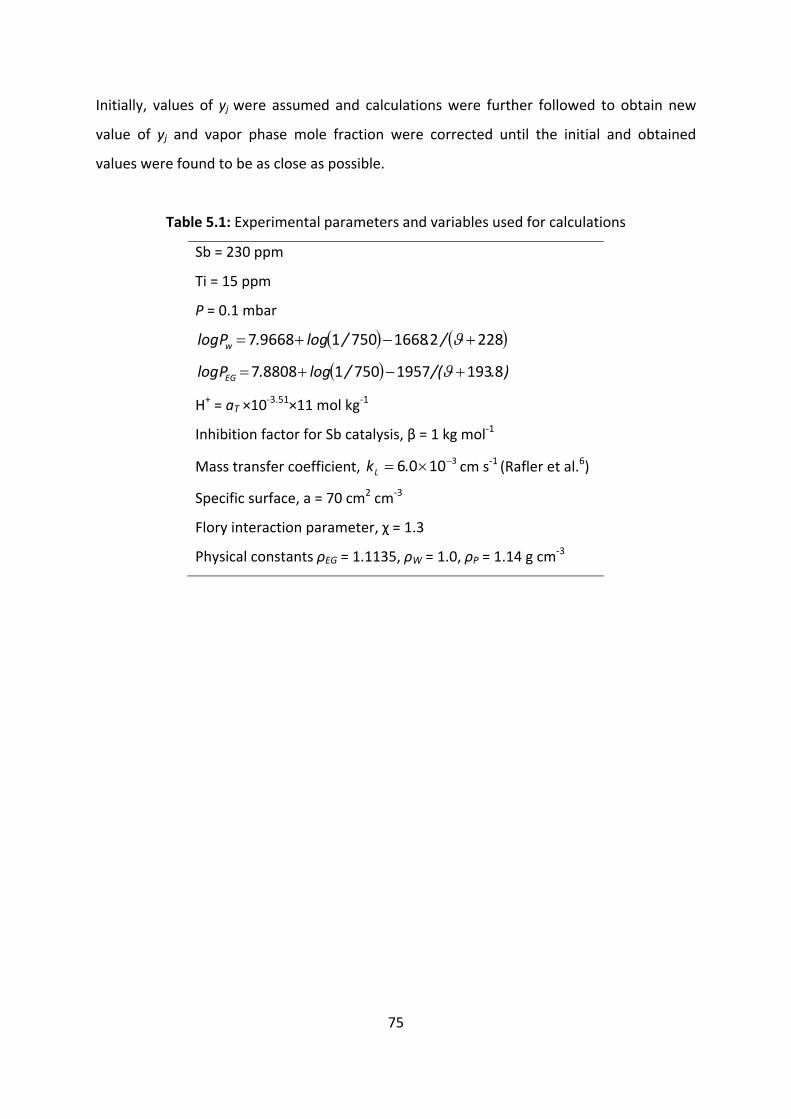
75
Initially, values of yj were assumed and calculations were further followed to obtain new
value of yj and vapor phase mole fraction were corrected until the initial and obtained
values were found to be as close as possible.
Table 5.1: Experimental parameters and variables used for calculations
Sb = 230 ppm
Ti = 15 ppm
P = 0.1 mbar
( ) ( )22821668750196687 +−+= ϑ/./log.Plog w
( ) )./(/log.Plog EG 81931957750188087 +−+= ϑ
H+ = aT ×10‐3.51×11 mol kg‐1
Inhibition factor for Sb catalysis, β = 1 kg mol‐1
Mass transfer coefficient, 31006 −×= .kL cm s‐1 (Rafler et al.6)
Specific surface, a = 70 cm2 cm‐3
Flory interaction parameter, χ = 1.3
Physical constants ρEG = 1.1135, ρW = 1.0, ρP = 1.14 g cm‐3
76
Results and Discussion
In TPA and EG based PET process, esterification and polycondensation reactions takes place
simultaneously during the melt polycondensation phase due to the presence of carboxyl and
hydroxyl groups. Kinetics become more complex because of main reactions coupled with
back and side reactions and increasing mass transfer limitation due to increasing melt
viscosity at higher conversion. In the present study, antimony acetate and titanium based
chelated catalyst (supplied by Equipolymers GmbH) are used as polycondensation catalysts.
El‐Toufaili et al.9 has observed that relative activity of antimony (Sb) in polycondensation
was enhanced strongly with a decreasing hydroxyl end group concentration of oligomers.
According to El‐Toufaili et al., Sb inhibition in the initial polycondensation phase is observed
due to hindrance of Sb – ester chain end chelation caused by competition between hydroxyl
groups of EG and oligomers. Hovenkamp10 also suggested the inhibition of Sb compounds by
EG. While Ti does not show such inhibition by hydroxyl groups instead Ti is in a favorable
neighborhood in the presence of excess hydroxyl groups. Based on these studies, we have
used an inhibition parameter (β) as a function of hydroxyl group concentration (1/1+β[OH])
for the simulation study where Sb was used as catalyst. Sb and Ti catalyzed side reactions
are also considered in the present study. Chen and Chen11 observed that most of the
diethylene glycol (DEG) is formed in esterification phase where the concentration of EG and
carboxyl group are significantly high, thus we have ignored the DEG formation reactions for
melt polycondensation phase while considering only the acetaldehyde and thermal scission
reactions. The functional group approach is considered to determine the concentrations of
end groups and byproducts effectively. Major reactions considered for simulation are given
in Table 5.2.

77
Table 5.2: Reaction scheme of the esterification process
Reactions Rate constants
(forward, reverse)
Ester interchange reaction (main polycondensation)
k1+ bT y +
k1 / K1y yeibTy bF bF
111 Kk,k
Polycondensation reaction through esterification
k2+ bT y + w
k2 / K2y yeiaTy
222 Kk,k
Esterification reaction
k3+ aT bT + w
k3 / K3bF bF y y
333 Kk,k
Degradation of internal ester link
k4+ Vy yyei aTy
4k
Acetaldehyde formation
k5+ v yy yeibTy + z
5k
k6 y aTbTy + z 6k
Where aT is the terminal carboxyl group, bT is the terminal hydroxyl group, bF is the hydroxyl
group in EG, ei is the internal ester link, w is water, v is the vinyl end group and z is
acetaldehyde. The concentrations of these species are given in molality (mol/kg solvent)
whereas the mass of total liquid phase can be represented as the solvent mass. Therefore
the use of the unit mol/kg can be interpreted as moles of terminal or internal functional
groups per mass of total liquid phase. The reaction rate laws and mass balance equations
are given in Table 5.3 and Table 5.4, respectively.
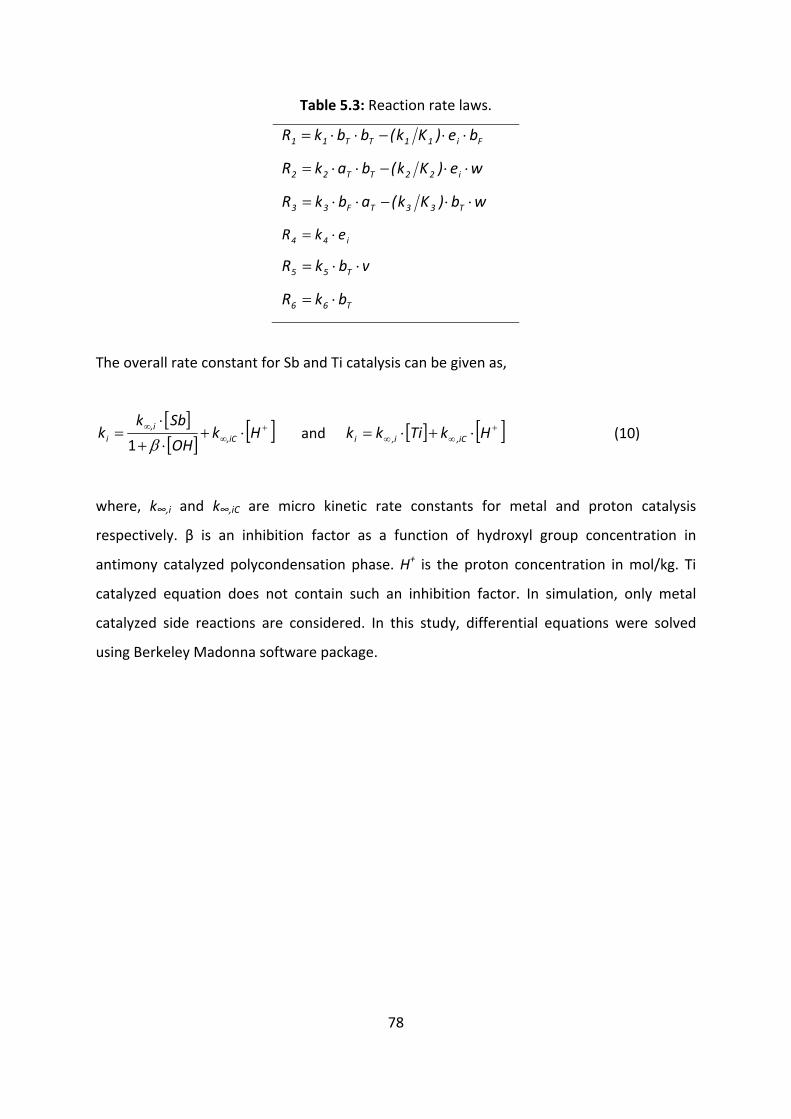
78
Table 5.3: Reaction rate laws.
Fi11TT11 be)Kk(bbkR ⋅⋅−⋅⋅=
we)Kk(bakR i22TT22 ⋅⋅−⋅⋅=
wb)Kk(abkR T33TF33 ⋅⋅−⋅⋅=
i44 ekR ⋅=
vbkR T55 ⋅⋅=
T66 bkR ⋅=
The overall rate constant for Sb and Ti catalysis can be given as,
[ ][ ] [ ]+∞
∞ ⋅+⋅+
⋅= Hk
OH
Sbkk ,iC
,ii β1
and [ ] [ ]+∞∞ ⋅+⋅= HkTikk iC,i,i (10)
where, k∞,i and k∞,iC are micro kinetic rate constants for metal and proton catalysis
respectively. β is an inhibition factor as a function of hydroxyl group concentration in
antimony catalyzed polycondensation phase. H+ is the proton concentration in mol/kg. Ti
catalyzed equation does not contain such an inhibition factor. In simulation, only metal
catalyzed side reactions are considered. In this study, differential equations were solved
using Berkeley Madonna software package.
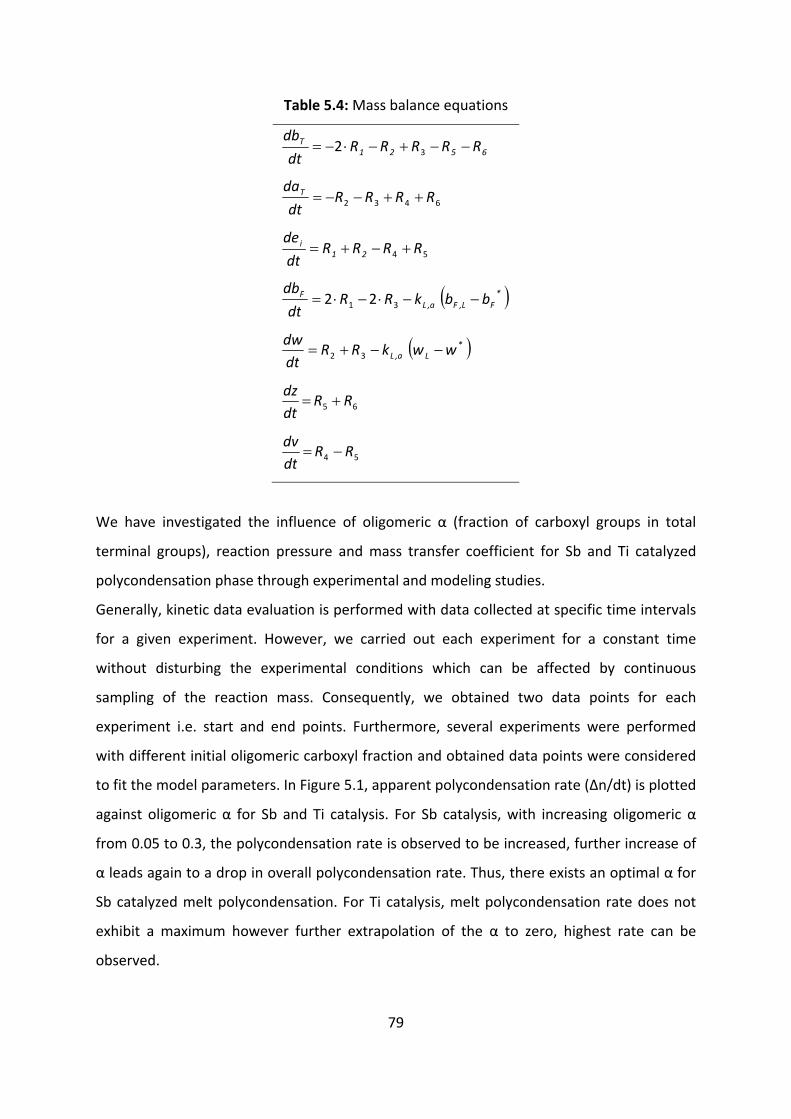
79
Table 5.4: Mass balance equations
6521T RRRRR
dt
db−−+−⋅−= 32
6432 RRRRdt
daT ++−−=
54 RRRRdt
de21
i +−+=
( )*FL,Fa,L
F bbkRRdt
db−−⋅−⋅= 31 22
( )*La,L wwkRR
dtdw
−−+= 32
65 RRdtdz
+=
54 RRdtdv
−=
We have investigated the influence of oligomeric α (fraction of carboxyl groups in total
terminal groups), reaction pressure and mass transfer coefficient for Sb and Ti catalyzed
polycondensation phase through experimental and modeling studies.
Generally, kinetic data evaluation is performed with data collected at specific time intervals
for a given experiment. However, we carried out each experiment for a constant time
without disturbing the experimental conditions which can be affected by continuous
sampling of the reaction mass. Consequently, we obtained two data points for each
experiment i.e. start and end points. Furthermore, several experiments were performed
with different initial oligomeric carboxyl fraction and obtained data points were considered
to fit the model parameters. In Figure 5.1, apparent polycondensation rate (Δn/dt) is plotted
against oligomeric α for Sb and Ti catalysis. For Sb catalysis, with increasing oligomeric α
from 0.05 to 0.3, the polycondensation rate is observed to be increased, further increase of
α leads again to a drop in overall polycondensation rate. Thus, there exists an optimal α for
Sb catalyzed melt polycondensation. For Ti catalysis, melt polycondensation rate does not
exhibit a maximum however further extrapolation of the α to zero, highest rate can be
observed.
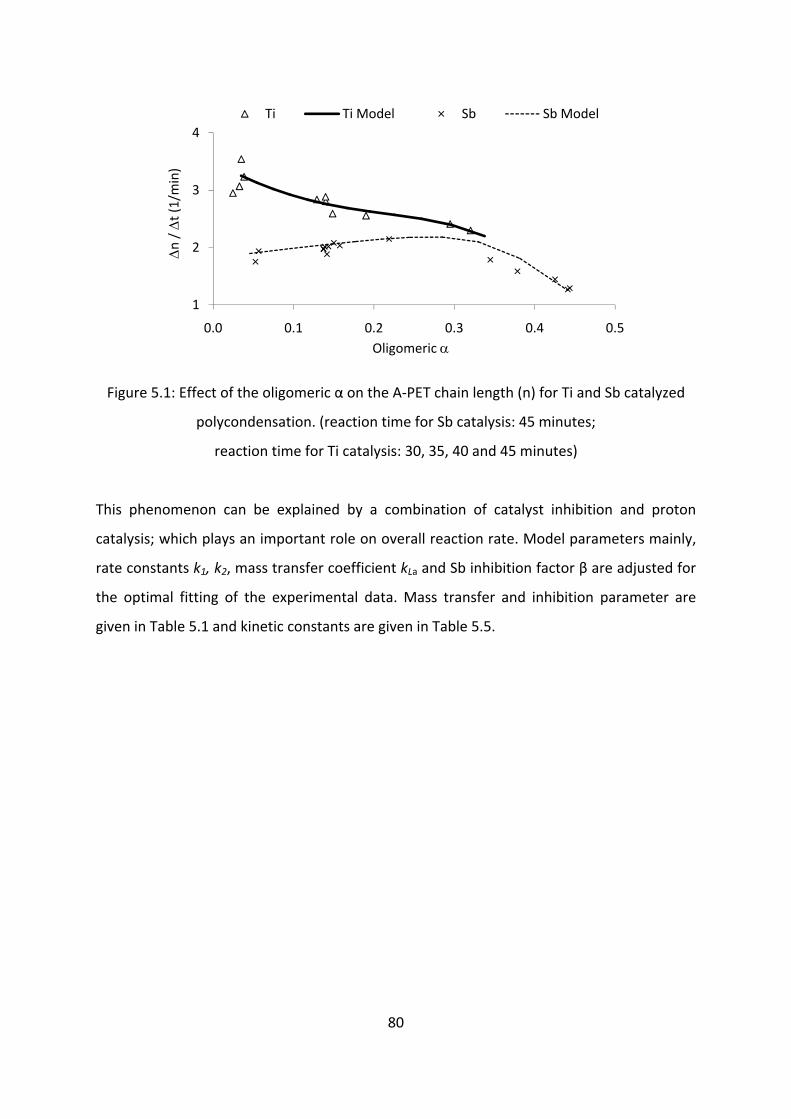
80
Figure 5.1: Effect of the oligomeric α on the A‐PET chain length (n) for Ti and Sb catalyzed
polycondensation. (reaction time for Sb catalysis: 45 minutes;
reaction time for Ti catalysis: 30, 35, 40 and 45 minutes)
This phenomenon can be explained by a combination of catalyst inhibition and proton
catalysis; which plays an important role on overall reaction rate. Model parameters mainly,
rate constants k1, k2, mass transfer coefficient kLa and Sb inhibition factor β are adjusted for
the optimal fitting of the experimental data. Mass transfer and inhibition parameter are
given in Table 5.1 and kinetic constants are given in Table 5.5.
1
2
3
4
0.0 0.1 0.2 0.3 0.4 0.5
Δn / Δt (1/min)
Oligomeric α
Ti Ti Model Sb Sb Model
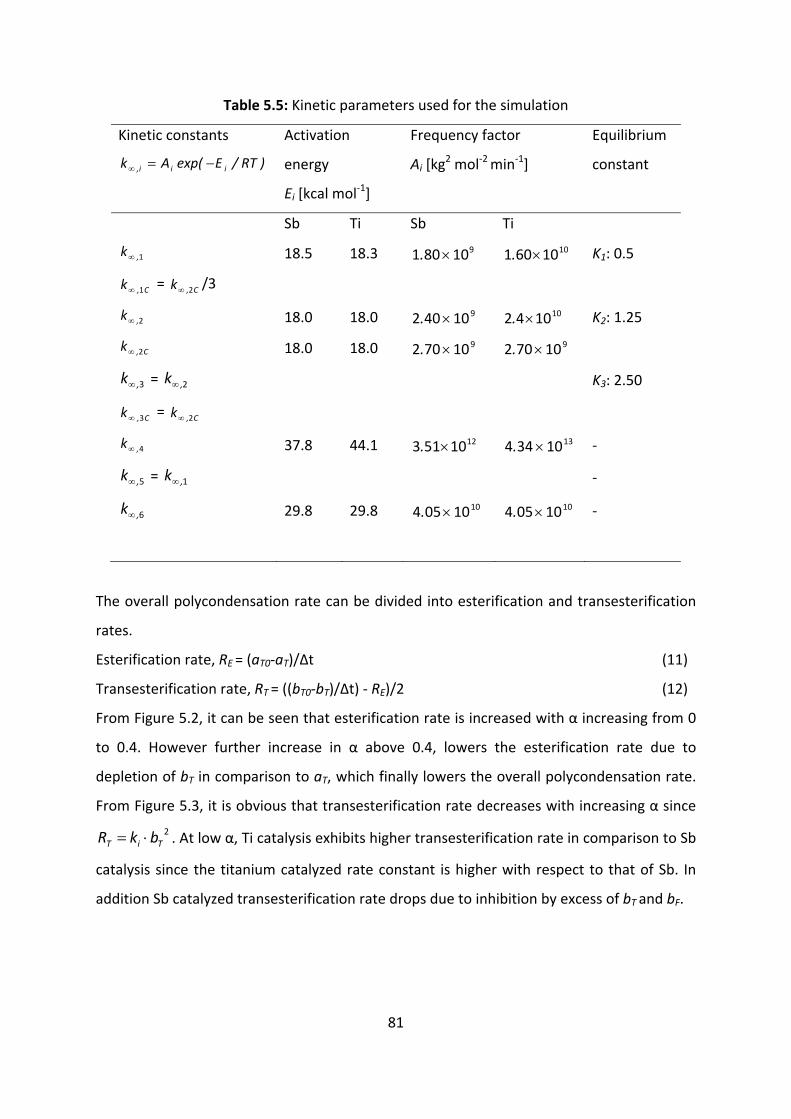
81
Table 5.5: Kinetic parameters used for the simulation
Kinetic constants
)RT/Eexp(Ak iii, −=∞
Activation
energy
Ei [kcal mol‐1]
Frequency factor
Ai [kg2 mol‐2 min‐1]
Equilibrium
constant
Sb Ti Sb Ti
1,k∞ 18.5 18.3 910801 ×. 1010601 ×. K1: 0.5
C,k 1∞ = C,k 2∞ /3
2,k∞ 18.0 18.0 910402 ×. 101042 ×. K2: 1.25
C,k 2∞ 18.0 18.0 910702 ×. 910702 ×.
3,k∞ = 2,k∞ K3: 2.50
C,k 3∞ = C,k 2∞
4,k∞ 37.8 44.1 1210513 ×. 1310344 ×. ‐
5,k∞ = 1,k∞ ‐
6,k∞ 29.8 29.8 1010054 ×. 1010054 ×. ‐
The overall polycondensation rate can be divided into esterification and transesterification
rates.
Esterification rate, RE = (aT0‐aT)/Δt (11)
Transesterification rate, RT = ((bT0‐bT)/Δt) ‐ RE)/2 (12)
From Figure 5.2, it can be seen that esterification rate is increased with α increasing from 0
to 0.4. However further increase in α above 0.4, lowers the esterification rate due to
depletion of bT in comparison to aT, which finally lowers the overall polycondensation rate.
From Figure 5.3, it is obvious that transesterification rate decreases with increasing α since
2TiT bkR ⋅= . At low α, Ti catalysis exhibits higher transesterification rate in comparison to Sb
catalysis since the titanium catalyzed rate constant is higher with respect to that of Sb. In
addition Sb catalyzed transesterification rate drops due to inhibition by excess of bT and bF.
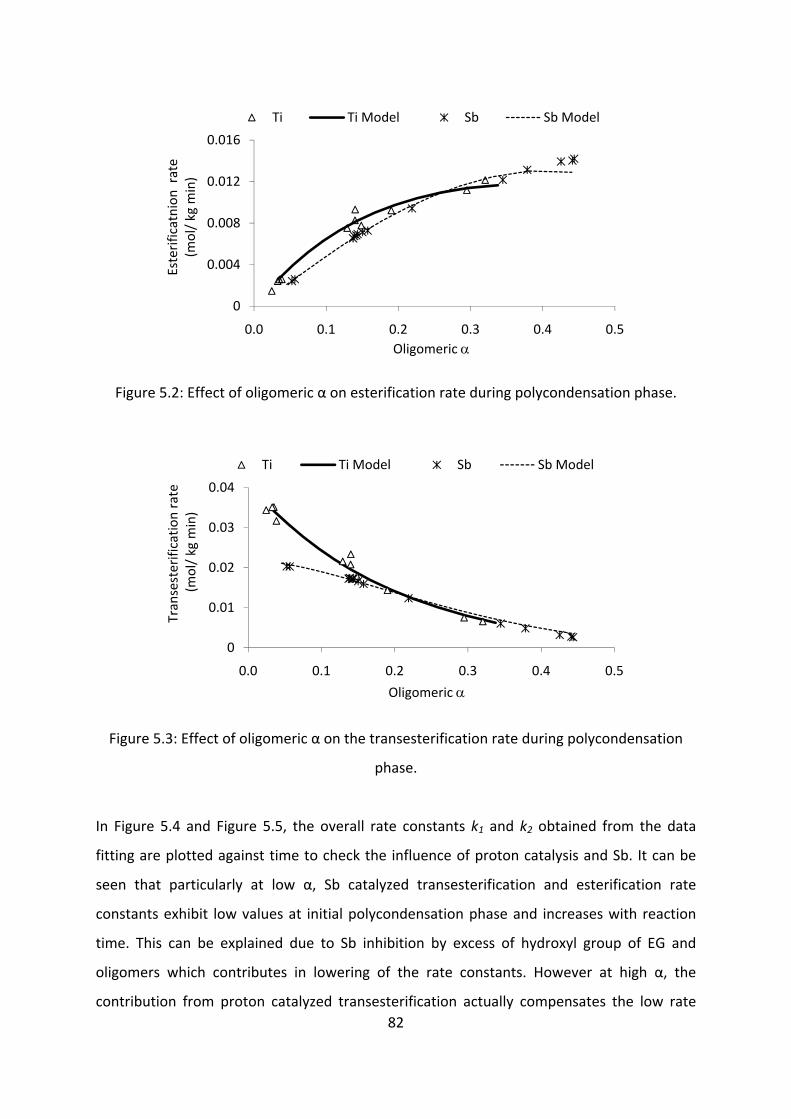
82
Figure 5.2: Effect of oligomeric α on esterification rate during polycondensation phase.
Figure 5.3: Effect of oligomeric α on the transesterification rate during polycondensation
phase.
In Figure 5.4 and Figure 5.5, the overall rate constants k1 and k2 obtained from the data
fitting are plotted against time to check the influence of proton catalysis and Sb. It can be
seen that particularly at low α, Sb catalyzed transesterification and esterification rate
constants exhibit low values at initial polycondensation phase and increases with reaction
time. This can be explained due to Sb inhibition by excess of hydroxyl group of EG and
oligomers which contributes in lowering of the rate constants. However at high α, the
contribution from proton catalyzed transesterification actually compensates the low rate
0
0.004
0.008
0.012
0.016
0.0 0.1 0.2 0.3 0.4 0.5
Esterificatnion
rate
(mol/ kg m
in)
Oligomeric α
Ti Ti Model Sb Sb Model
0
0.01
0.02
0.03
0.04
0.0 0.1 0.2 0.3 0.4 0.5
Transesterificatio
n rate
(mol/ kg m
in)
Oligomeric α
Ti Ti Model Sb Sb Model

83
induced by Sb inhibition in early polycondensation phase. Since the carboxyl group
concentration drops with time, the reaction rate decreases and becomes equal to metal
catalyzed reaction rate. Interestingly, Ti catalysis does not have such an inhibition from
hydroxyl groups and exhibits optimum activity from the very beginning of the
polycondensation phase.
Figure 5.4: Overall transesterification rate constants, k1 for Ti and Sb catalysis
(at α= 0.04, aT = 0.1 mol/kg; at α = 0.27, aT = 0.5 mol/kg)
Figure 5.5: Overall esterification rate constants, k2 for Ti and Sb catalysis
(at α= 0.04, aT = 0.1 mol/kg; at α = 0.27, aT = 0.5 mol/kg)
0
0.1
0.2
0.3
0.4
0 5 10 15 20 25 30 35 40 45
k 1 (kg/m
ol m
in)
Time (min)
Ti, α=0.04 Sb, α=0.27
Ti, α=0.27
Sb, α=0.04
0
0.2
0.4
0.6
0.8
1
0 5 10 15 20 25 30 35 40 45
k 2 (kg/m
ol m
in)
Time (min)
Ti, α=0.04 Sb, α=0.27
Ti, α=0.27
Sb, α=0.04

84
Figure 5.6 shows the influence of reaction pressure on optimal oligomeric α for Sb catalyzed
reaction. Vapour pressure of EG is much lower than of water, thus as the pressure is
increased, the overall reaction rate drops due to reverse reactions, mainly glycolysis
reaction by EG. Also the equilibrium constant for transesterification is about 0.5 in
comparison to esterification equilibrium constant of 1.25. As a result of that, esterification
reaction is less retarded in comparison to transesterification. Under moderate vacuum,
esterification is more favoured and consequently optimum α is observed to be shifted to
high values with increasing pressure.
Figure 5.6: Influence of oligomeric α on the chain length at different pressures in mbar.
(Sb catalysis; simulated reaction time: 45 minutes)
In PET polycondensation phase, mass transport limitation between the phases plays an
essential role. For semibatch polymerization, helical ribbon type stirrers are commonly used
due to their capacity to generate large interfacial area at low speed of agitation.12 Very high
speed of agitation does not lead automatically to thinner films or shorter diffusion paths. In
this case, the stirrer efficiency drops and the stirrer blades cut the melt but do not generate
effective specific interface. Based on this, we optimized the agitation profile for the melt
polycondensation phase in our reactor. Mass transfer coefficient kLa depends strongly on
hydrodynamics of the reaction melt. As a consequence, it becomes more difficult to
evaluate the approximate order of magnitude of kLa due to high viscosity and large bubble
formation at high conversion. As a result of mixing and bubble formation, the specific
40
50
60
70
80
90
100
110
0.0 0.1 0.2 0.3 0.4 0.5
Chain length, n
Oligomeric α
P = 0 P =0.1 P = 0.5P = 1 P = 2

85
interface generated in the stirred reactor is more than one order of magnitude larger than
the area calculated from the reaction melt volume and reactor dimensions.6 Rafler et al. also
found that the specific mass transfer area generated by both stirring and evaporation
depends on the reactivity of the reactants in the system, catalyst and temperature. Cheong
et al.13 observed that the enhanced interfacial area exerted by EG bubbles accounts for
about 30‐50% of the total available interfacial mass transfer area. Based on these
assumptions, we have adjusted the specific interfacial area for optimal fitting of our
experimental data (25.2 min‐1). From Figure 5.7 and Figure 5.8, it can be seen that
decreasing mass transfer coefficient lowers the chain length and shifts the optimal α to
higher value. However at α value of 0.35 and higher, the influence of mass transfer on
polycondensation rate diminishes. This can be further explained due to principle reaction
being esterification in comparison to transesterification and mass transfer resistance
becomes lower due to water is produced largely as a byproduct instead of EG.
Figure 5.7: Influence of oligomeric α on the chain length at different kLa values
(Sb catalysis; simulated reaction time: 45 minutes)
40
60
80
100
120
140
0.0 0.1 0.2 0.3 0.4 0.5
Chain length, n
Oligomeric α
72 36 25.2 21.6 14.4
kLa (1/min)
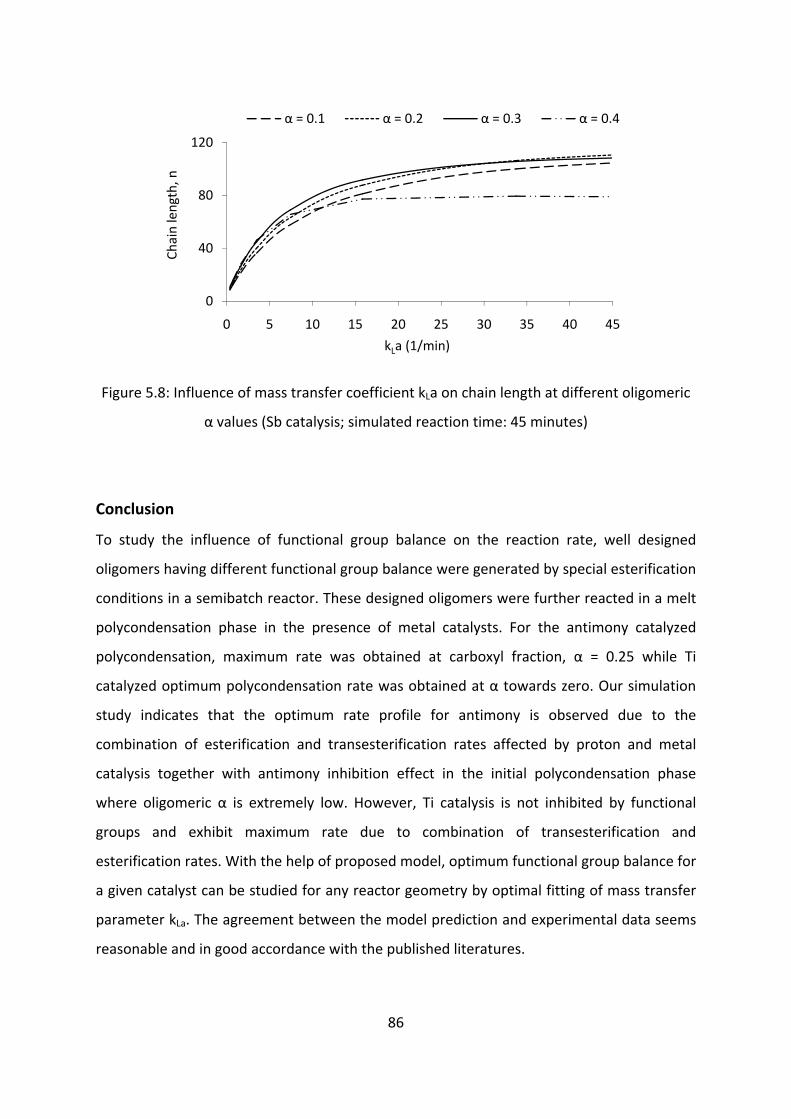
86
Figure 5.8: Influence of mass transfer coefficient kLa on chain length at different oligomeric
α values (Sb catalysis; simulated reaction time: 45 minutes)
Conclusion
To study the influence of functional group balance on the reaction rate, well designed
oligomers having different functional group balance were generated by special esterification
conditions in a semibatch reactor. These designed oligomers were further reacted in a melt
polycondensation phase in the presence of metal catalysts. For the antimony catalyzed
polycondensation, maximum rate was obtained at carboxyl fraction, α = 0.25 while Ti
catalyzed optimum polycondensation rate was obtained at α towards zero. Our simulation
study indicates that the optimum rate profile for antimony is observed due to the
combination of esterification and transesterification rates affected by proton and metal
catalysis together with antimony inhibition effect in the initial polycondensation phase
where oligomeric α is extremely low. However, Ti catalysis is not inhibited by functional
groups and exhibit maximum rate due to combination of transesterification and
esterification rates. With the help of proposed model, optimum functional group balance for
a given catalyst can be studied for any reactor geometry by optimal fitting of mass transfer
parameter kLa. The agreement between the model prediction and experimental data seems
reasonable and in good accordance with the published literatures.
0
40
80
120
0 5 10 15 20 25 30 35 40 45
Chain length, n
kLa (1/min)
α = 0.1 α = 0.2 α = 0.3 α = 0.4

87
Nomenclature
Ta terminal carboxyl groups of oligomers [mol kg‐1]
0a saponification number [mol kg‐1]
Fb hydroxyl groups of EG [mol kg‐1]
Tb terminal hydroxyl groups of oligomers [mol kg‐1]
ei internal ester groups [mol kg‐1]
E total terminal groups of oligomers [mol kg‐1]
H+ dissociated protons from carboxyl groups [mol kg‐1]
IV intrinsic viscosity [dl g‐1]
k,i rate constant [kg mol‐1 min‐1]
kL mass transfer coefficient [cm sec‐1]
a specific interfacial area [cm² cm‐³]
Mn number average molecular weight [g mol‐1]
n degree of polymerization or chain length [‐]
p overall conversion [‐]
Sb antimony ion
Ti titanium ion
v vinyl end group of oligomers [mol kg‐1]
z acetaldehyde [mol kg‐1]
Greek Letters
α carboxyl fraction in total terminal groups [‐]
β inhibition factor [kg mol‐1]
ε esterification conversion [‐]

88
References
[1] G. Rafler, E. Bonatz, H.‐D. Sparing and B. Otto, Acta. Polym. 1987, 38, 6.
[2] T. Sano, H. Yokoyama, Hitachi Review 1979, 28(2), 83.
[3] B. Duh, J. Appl. Polym. Sci. 2002, 83, 1288.
[4] H. Yokoyama, T. Sano, T. Chijiwa, R. Kajiya, Kobunshi Ronbunshu 1979, 36(8), 557.
[5] E. Berkau, Durham, W.R. Hocutt, US patent 3,551,386, 1970.
[6] G. Rafler, G. Reinisch, E. Bonatz, H. Versaeumer, J. Macromol. Sci. Chem. 1985, A22,
1413.
[7] H. Patel, G. Feix, R. Schomaecker, Macromol. React. Eng. 2007, 1, 502.
[8] H. Patel, G. Feix, R. Schomaecker, Macromol. Symp. 2007, 259, 65.
[9] F.A. El‐Toufaili, G. Feix, K.‐H. Reichert, J. Appl. Polym. Sci. Part A, 2006, 44, 1049.
[10] S.G. Hovenkamp, J. Polym.Sci. Part A‐1, 1971, 9, 479.
[11] J.‐W. Chen, L.‐W.Chen, J.Polym.Sci. Polym. Chem. Ed., 1998, 36, 3073.
[12] K. Ravindranath and R.A. Mashelkar, J. Appl. Polym. Sci. 1982, 27, 2625.
[13] S.I. Cheong, K.Y. Choi, J. Appl. Polym. Sci. 1995, 58, 1473.
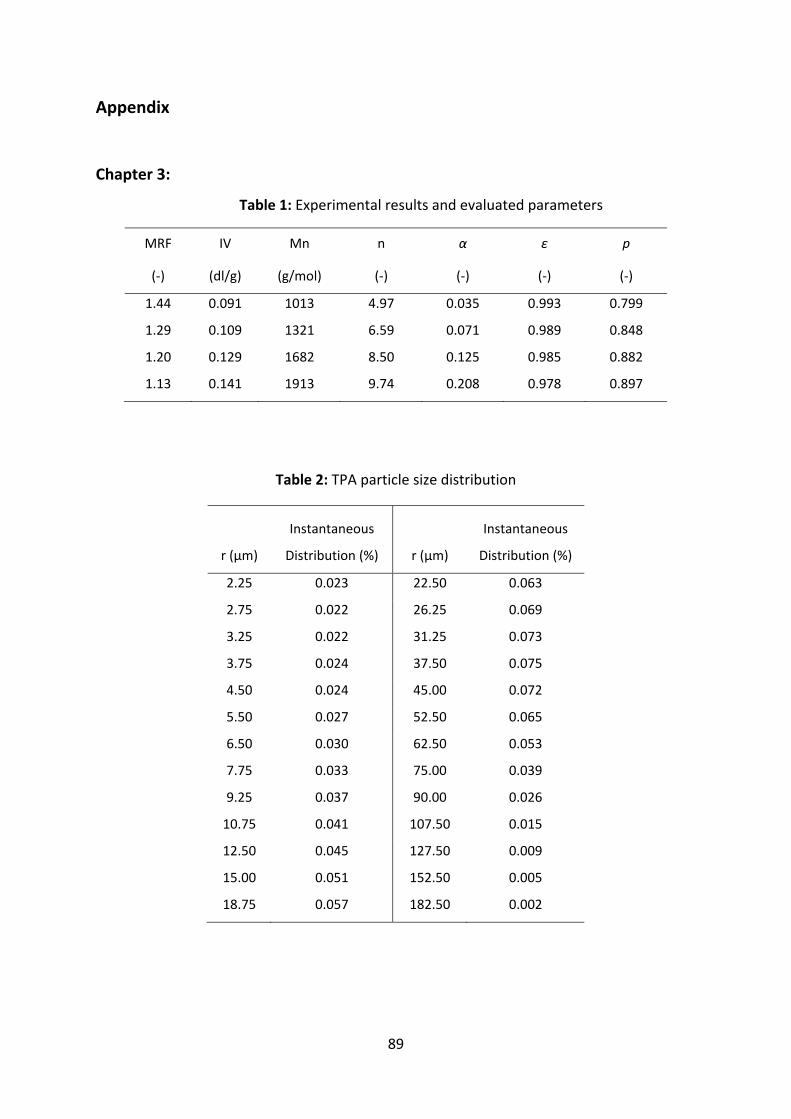
89
Appendix
Chapter 3:
Table 1: Experimental results and evaluated parameters
MRF IV Mn n α ε p
(‐) (dl/g) (g/mol) (‐) (‐) (‐) (‐)
1.44 0.091 1013 4.97 0.035 0.993 0.799
1.29 0.109 1321 6.59 0.071 0.989 0.848
1.20 0.129 1682 8.50 0.125 0.985 0.882
1.13 0.141 1913 9.74 0.208 0.978 0.897
Table 2: TPA particle size distribution
r (μm)
Instantaneous
Distribution (%) r (μm)
Instantaneous
Distribution (%)
2.25 0.023 22.50 0.063
2.75 0.022 26.25 0.069
3.25 0.022 31.25 0.073
3.75 0.024 37.50 0.075
4.50 0.024 45.00 0.072
5.50 0.027 52.50 0.065
6.50 0.030 62.50 0.053
7.75 0.033 75.00 0.039
9.25 0.037 90.00 0.026
10.75 0.041 107.50 0.015
12.50 0.045 127.50 0.009
15.00 0.051 152.50 0.005
18.75 0.057 182.50 0.002

90
Table 3: Experimental water collected with time for different feed ratio.
Time
(min)
MRF 1.44
w (mol)
MRF 1.36
w (mol)
MRF 1.29
w (mol)
MRF 1.2
w (mol)
0 0.00 0.00 0.01 0.08 20 0.00 0.00 0.01 0.08 25 0.53 0.90 0.32 0.62 30 1.76 1.86 1.42 1.71 35 2.97 3.25 2.85 2.76 40 4.29 4.33 4.02 3.84 45 5.67 5.70 5.22 4.97 50 7.05 6.99 6.45 6.05 55 8.26 8.31 7.46 6.98 60 9.29 9.20 8.37 7.70 65 10.05 9.77 9.14 8.43 70 10.17 9.97 9.48 8.72 75 10.17 10.05 9.60 8.72 80 10.17 10.15 9.60 8.72 85 10.17 10.18 9.60 8.72 125 11.45 11.91 10.97 10.67
Chapter 4:
Table 4: Experimental results of esterified oligomers under varied pressure.
P t EG/TPA (EG0‐EGR) / EG
(‐)
aT bT Mn n α ε p DEG
(bar) (min) (mol/mol) (mol/kg) (mol/kg) (g/mol) (‐) (‐) (‐) (‐) (wt. %)
3.13 95 1.4 0.28 0.70 0.77 1355 6.95 0.48 0.962 0.790 3.1
3.13 95 1.4 0.29 0.75 0.68 1401 7.21 0.52 0.897 0.840
3.22 95 1.4 0.28 0.68 0.80 1346 6.90 0.46 0.932 0.856
3.22 95 1.4 0.27 0.64 0.86 1335 6.82 0.43 0.954 0.842 3.4
3.34 95 1.4 0.24 0.47 1.13 1250 6.32 0.29 0.961 0.821 3.7
3.50 95 1.4 0.20 0.43 1.68 948 4.71 0.20 0.933 0.855
3.55 95 1.4 0.21 0.39 1.40 1116 5.59 0.22 0.938 0.853 4.5
3.55 95 1.4 0.19 0.31 1.58 1060 5.27 0.16 0.927 0.861
3.75 95 1.4 0.19 0.37 1.71 959 4.76 0.18 0.969 0.810 4.9
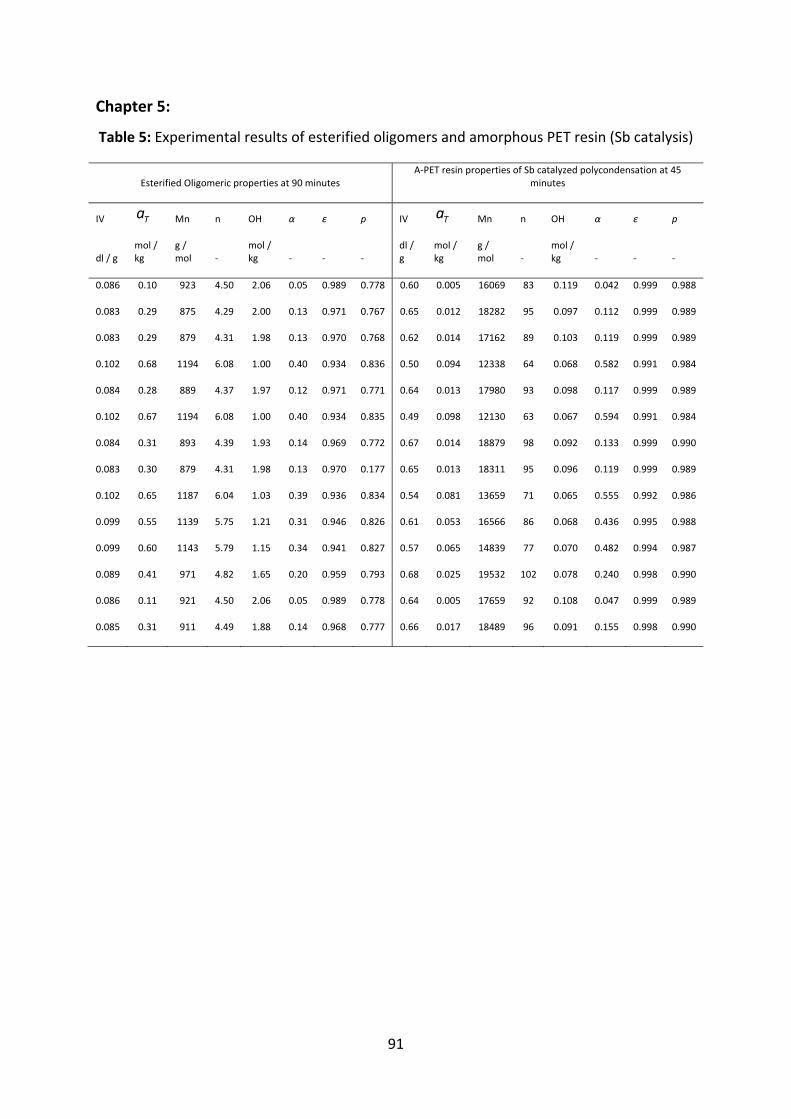
91
Chapter 5:
Table 5: Experimental results of esterified oligomers and amorphous PET resin (Sb catalysis)
Esterified Oligomeric properties at 90 minutes A‐PET resin properties of Sb catalyzed polycondensation at 45
minutes
IV Ta Mn n OH α ε p IV Ta Mn n OH α ε p
dl / g mol / kg
g / mol ‐
mol / kg ‐ ‐ ‐
dl / g
mol / kg
g / mol ‐
mol / kg ‐ ‐ ‐
0.086 0.10 923 4.50 2.06 0.05 0.989 0.778 0.60 0.005 16069 83 0.119 0.042 0.999 0.988
0.083 0.29 875 4.29 2.00 0.13 0.971 0.767 0.65 0.012 18282 95 0.097 0.112 0.999 0.989
0.083 0.29 879 4.31 1.98 0.13 0.970 0.768 0.62 0.014 17162 89 0.103 0.119 0.999 0.989
0.102 0.68 1194 6.08 1.00 0.40 0.934 0.836 0.50 0.094 12338 64 0.068 0.582 0.991 0.984
0.084 0.28 889 4.37 1.97 0.12 0.971 0.771 0.64 0.013 17980 93 0.098 0.117 0.999 0.989
0.102 0.67 1194 6.08 1.00 0.40 0.934 0.835 0.49 0.098 12130 63 0.067 0.594 0.991 0.984
0.084 0.31 893 4.39 1.93 0.14 0.969 0.772 0.67 0.014 18879 98 0.092 0.133 0.999 0.990
0.083 0.30 879 4.31 1.98 0.13 0.970 0.177 0.65 0.013 18311 95 0.096 0.119 0.999 0.989
0.102 0.65 1187 6.04 1.03 0.39 0.936 0.834 0.54 0.081 13659 71 0.065 0.555 0.992 0.986
0.099 0.55 1139 5.75 1.21 0.31 0.946 0.826 0.61 0.053 16566 86 0.068 0.436 0.995 0.988
0.099 0.60 1143 5.79 1.15 0.34 0.941 0.827 0.57 0.065 14839 77 0.070 0.482 0.994 0.987
0.089 0.41 971 4.82 1.65 0.20 0.959 0.793 0.68 0.025 19532 102 0.078 0.240 0.998 0.990
0.086 0.11 921 4.50 2.06 0.05 0.989 0.778 0.64 0.005 17659 92 0.108 0.047 0.999 0.989
0.085 0.31 911 4.49 1.88 0.14 0.968 0.777 0.66 0.017 18489 96 0.091 0.155 0.998 0.990
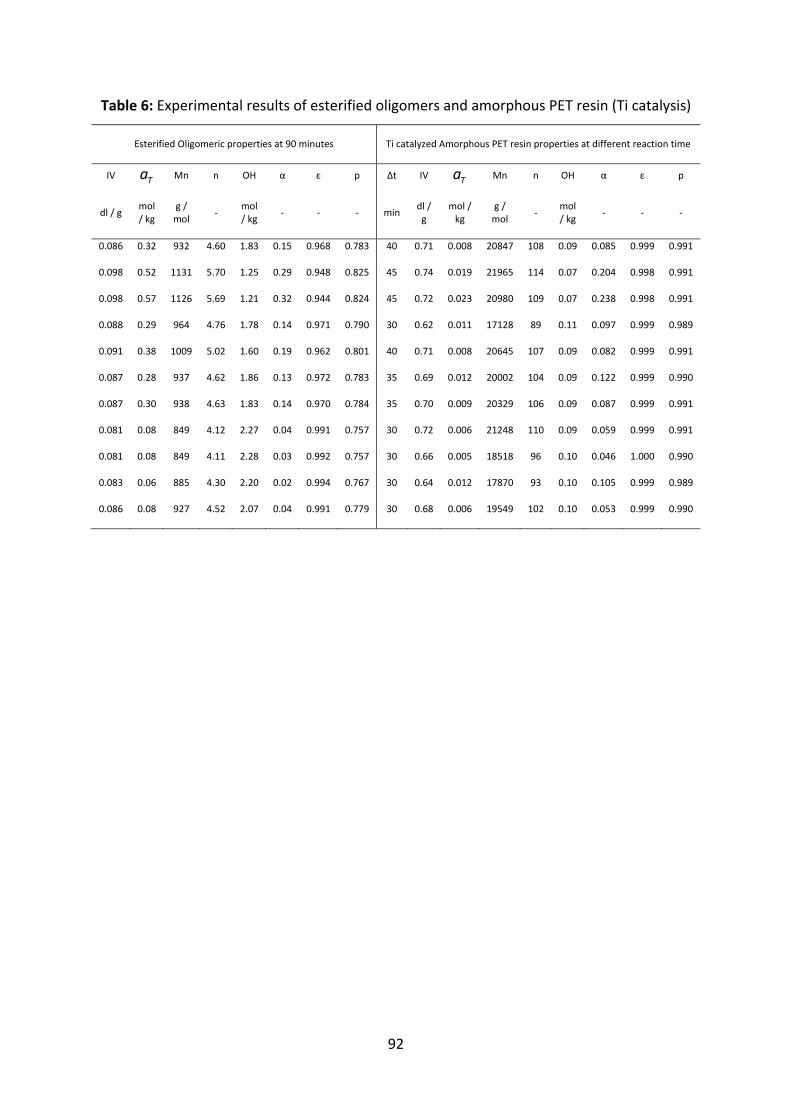
92
Table 6: Experimental results of esterified oligomers and amorphous PET resin (Ti catalysis)
Esterified Oligomeric properties at 90 minutes Ti catalyzed Amorphous PET resin properties at different reaction time
IV Ta Mn n OH α ε p Δt IV Ta Mn n OH α ε p
dl / g mol / kg
g / mol
‐ mol / kg
‐ ‐ ‐ min dl / g
mol / kg
g / mol
‐ mol / kg
‐ ‐ ‐
0.086 0.32 932 4.60 1.83 0.15 0.968 0.783 40 0.71 0.008 20847 108 0.09 0.085 0.999 0.991
0.098 0.52 1131 5.70 1.25 0.29 0.948 0.825 45 0.74 0.019 21965 114 0.07 0.204 0.998 0.991
0.098 0.57 1126 5.69 1.21 0.32 0.944 0.824 45 0.72 0.023 20980 109 0.07 0.238 0.998 0.991
0.088 0.29 964 4.76 1.78 0.14 0.971 0.790 30 0.62 0.011 17128 89 0.11 0.097 0.999 0.989
0.091 0.38 1009 5.02 1.60 0.19 0.962 0.801 40 0.71 0.008 20645 107 0.09 0.082 0.999 0.991
0.087 0.28 937 4.62 1.86 0.13 0.972 0.783 35 0.69 0.012 20002 104 0.09 0.122 0.999 0.990
0.087 0.30 938 4.63 1.83 0.14 0.970 0.784 35 0.70 0.009 20329 106 0.09 0.087 0.999 0.991
0.081 0.08 849 4.12 2.27 0.04 0.991 0.757 30 0.72 0.006 21248 110 0.09 0.059 0.999 0.991
0.081 0.08 849 4.11 2.28 0.03 0.992 0.757 30 0.66 0.005 18518 96 0.10 0.046 1.000 0.990
0.083 0.06 885 4.30 2.20 0.02 0.994 0.767 30 0.64 0.012 17870 93 0.10 0.105 0.999 0.989
0.086 0.08 927 4.52 2.07 0.04 0.991 0.779 30 0.68 0.006 19549 102 0.10 0.053 0.999 0.990

93
Curriculum Vitae PATEL, Himanshu born on January 19th, 1976 in Vallabh Vidyanagar, India
Education December 2004 –July 2008
PhD, Polymer Science Technical University of Berlin, Germany. In cooperation with Equipolymers GmbH, A Dow and PIC Joint Venture Company, Schkopau, Germany Advisors: Prof. R. Schomäcker (TU Berlin) and Dr. G. Feix (Equipolymers GmbH)
April 2002 – May 2004 Master of Science, Polymer Science A joint program by Free University, Humboldt University, Technical University of Berlin and University of Potsdam, Germany Thesis Advisor: Prof. K.‐H. Reichert (TU Berlin)
June 1996 – April 1998 Master of Science, Plastic Processing & Testing Sardar Patel University, Vallabh Vidyanagar, Gujarat, India
June 1993 – May 1996 Bachelor of Science, Chemistry C.U. Shah Science College, Gujarat University, Ahmedabad, Gujarat, India
Publications [1] Influence of Carboxyl and Hydroxyl Groups Balance on Catalyzed
Polycondensation of Poly(ethylene terephthalate). H. Patel, G. Feix, J.‐P.Wiegner, R. Schomäcker, submitted.
[2] Influence of Reaction Pressure on Semibatch Esterification Process of Poly(ethylene terephthalate) Synthesis. H. Patel, G. Feix, R. Schomäcker, Macromolecular Symposia, 2007, 259, 65.
[3] Modeling of Semibatch Esterification Process for Poly(ethylene terephthalate) Synthesis. H. Patel, G. Feix, R. Schomäcker, Macromolecular Reaction Engineering, 2007, 1, 502.