the effect of moderate cardiovascular exercise on auditory ...jass.neuro.wisc.edu/2013/01/601 group...
TRANSCRIPT
Anatoli Berezovsky Erika Jarvey
Ryan Popelka Rachel Lewandowski
Lab 601 Group 10
1
The Effect of Moderate Cardiovascular Exercise on Auditory Reaction Time
University of Wisconsin Madison
Physiology 435: Lab 601, Group 10
Anatoli Berezovsky, Erika Jarvey, Ryan Popelka, Rachel Lewandowski
Word count: 3181
Keywords: Exercise, Reaction Time, Auditory Stimulus
Anatoli Berezovsky Erika Jarvey
Ryan Popelka Rachel Lewandowski
Lab 601 Group 10
2
ABSTRACT
To test the effect of exercise on reaction time to an auditory stimulus, 14 individuals
were tested against themselves as controls and following exercise. In the control phase,
participants were asked to focus on relaxed breathing, while during exercise individuals ran
stairs. Throughout the tests heart rate and blood pressure were measured both before and after
each treatment. Muscular contractions of the arm/wrist were measured using electromyography
(EMG) while the participants performed the reaction time test using a hand held clicker. The
EMG was used to measure the maximum integrated electrical signal (mv-sec) of the muscle
activity during the click as well as the duration of each click. The reaction times post-exercise
were compared to those post-controlled breathing to determine if there were statistically
significant differences. Following exercise, participants’ reaction times showed a significant
decrease (N=140, paired t-test, p=0.029<0.05). Additionally, the decrease in reaction time was
more evident in males rather than females. Overall, there is moderately high support that exercise
decreases reaction time, and such results could have implications in athletic activities.
INTRODUCTION
The study of human reaction time and information processing has been of interest for
many decades, especially in association with athletics. New information always seems to be
surfacing on how to become a better athlete and increase performance. The quick and precise
decision making needed for skilled performance in many sports has researchers interested in
investigating the effects of exercise on reaction time (Ozyemisci-Taskiran et al., 2008).
Anatoli Berezovsky Erika Jarvey
Ryan Popelka Rachel Lewandowski
Lab 601 Group 10
3
Improving one’s reaction time in multiple sports can be the key to potentially getting off the
starting blocks sooner or successfully making contact with one more ball. Thus, research to
understand factors that alter reaction time can be used to influence how athletes prepare for and
perform during a game.
Reaction time (RT) is the elapsed time between the presentation of a sensory stimulus
and a subsequent behavioral response (Shelton and Kumar, 2010). It represents the level of
neuromuscular coordination in which the body responds to visual or auditory stimuli. These
stimuli travel via afferent pathways to reach the brain as sensory information and are converted
into neural signals. Neural transmissions then proceed to activate muscle and generate a motor
response (Shelton and Kumar, 2010). Reaction time is frequently used as an index of the well-
being of the central nervous system and information processing (Ozyemisci-Taskiran et al.,
2008). The faster the stimulus reaches the brain, the faster the signal is processed and the
necessary responses are generated (Shelton and Kumar, 2010).
A number of studies have been carried out to explain the effects of physical exercise on
cognitive function and reaction time. In one study testing the effects of aerobic exercise on
reaction time, it was found that in the exercise group, the premotor fraction of reaction time
decreased considerably after the exercise session, while an insignificant decrement of values was
observed for the control group. This was supported by the fact that during exercise, heart rate
levels increase as a physiological response, which indicates a state of arousal. It has been
suggested that an aroused state induced by moderate exercise is associated with maximum
cognitive function possibly due to increased cortical and muscular blood flow, allowing for an
Anatoli Berezovsky Erika Jarvey
Ryan Popelka Rachel Lewandowski
Lab 601 Group 10
4
increase in the speed of information processing and thus a decrease in reaction time (Ozyemisci-
Taskiran et al., 2008).
Nevertheless, this topic still remains controversial. It was determined through a study at
the University of Colorado Boulder that reaction time deteriorates when the subject is either too
relaxed or too tense (Welford, 1988). In yet another study which examined the effects of exercise
on reaction time to peripheral and central visual stimuli, it was concluded that, under normoxic
and hypoxic conditions, exercise causes an increase in reaction time. Under hyperoxic
conditions, however, it was determined that there was no difference in reaction time between the
exercising group and the resting group (Ando, et al., 2002).
As noted, reaction time to a visual stimulus has been extensively studied, but that to an
auditory stimulus has not. It has been shown, however, that auditory reaction time is faster than
visual reaction time (Boat and Dais-Fechner, 2005). In a specific study it was documented that
the mean reaction time to detect visual stimuli was approximately 180-200 milliseconds where
for sound it was 140-160 milliseconds (Shelton and Kumar, 2010). Furthermore, performing a
reaction time test to an auditory stimulus rather than a visual stimulus eliminates higher the
variability that can accompany visual stimuli, including the color of the light used and
background lights involved. It was found, for instance, that reaction time to a visual stimulus
greatly decreases in a dark room than in one that is well-lit (Tanner and Swets, 1954). This
information inspired the choice of an auditory stimulus and allowed the formulation of the
hypothesis that moderate cardiovascular exercise causes a decrease in reaction time to an
auditory stimulus.
Anatoli Berezovsky Erika Jarvey
Ryan Popelka Rachel Lewandowski
Lab 601 Group 10
5
To test this hypothesis, each subject’s resting heart rate was measured and the target heart
rate was calculated by doubling their resting heart rate. The subjects were informed to run up and
down a set of stairs until they reached approximately their target heart rate, and continue at about
the same pace for three minutes thereafter. After the treatment, the subjects were seated and
electrodes were placed on their forearm to measure muscle activity through electromyography.
They were given a clicker in their dominant hand and informed to click as they heard a
computer-generated static beep. Their reaction time was recorded by the BIOPAC program.
Blood pressure before and after exercise was another parameter that was measured to determine
a possible association between blood pressure and reaction time. Any association between
reaction time and muscle activity after exercise, as measured by maximum integrated electrical
signal and click duration, was also uncovered by the EMG.
All subjects were tested twice so that each subject was his or her own control; once after
exercise and once after a short period of focused breathing. Controlled variables included
electrode placement on a subject’s dominant arm, placement of the arm with the clicker on the
table, time of rest for the control phase, and order of measurements.
Based on prior studies, and the basic concept of the flight or fight response, the
hypothesis was that exercise would decrease reaction time. The information presented in other
studies stating that exercise causes an aroused state, thereby increasing cognitive function, gives
strong reason to believe this hypothesis. In addition to the main hypothesis of this study, with the
EMG readings, other hypotheses were generated. These included the amount of depolarization
(as measured by maximum integrated electrical signal) would be greater, and the signal would
last longer for the subjects after exercising due to the increased state of arousal.

Anatoli Berezovsky Erika Jarvey
Ryan Popelka Rachel Lewandowski
Lab 601 Group 10
6
MATERIALS AND METHODS
Several physiological parameters were measured to determine the effect of exercise on
reaction time. Before the task, resting heart rate (rHR) and resting blood pressure (rBP) were
measured to determine a baseline. After the task, post heart rate (pHR) and post blood pressure
(pBP) were measured to determine the effect of the task on those two parameters. Post BP was
measured while the EMG and reaction tests were calibrated, and pHR was measured right before
the reaction test was initiated. The goal of the exercise task was to increase heart rate to twice
that of the rHR. In addition to BP and HR, an EMG was performed to measure the muscular
electrical response of the clicking hand during the reaction test. The parameters that were
measured were maximum integrated electrical signal and the duration of the click responses.
Heart Rate
Each subject performed both an exercising task and a focused breathing task while their
heart rate was being monitored. For the exercising task, the subjects were taken into the hall and
asked to run up and down two flights of stairs thrice. Their HR was then measured and recorded.
If it was at least twice their rHR, they were asked to continue going up and down the two flights,
at a consistent pace, for an additional three minutes. If, following the first two runs up and down
the stairs, the HR was not twice the rHR, the subjects were asked to repeat the same process until
it was, and then they were asked to go on to perform the three minute task. For the focused
breathing task, the subjects remained seated and placed their heads down, closed their eyes, and
focused on their breathing for three minutes. Their heart rate was measured both before and after
the three minute time period. Following these two tasks, the reaction time test was performed.
Anatoli Berezovsky Erika Jarvey
Ryan Popelka Rachel Lewandowski
Lab 601 Group 10
7
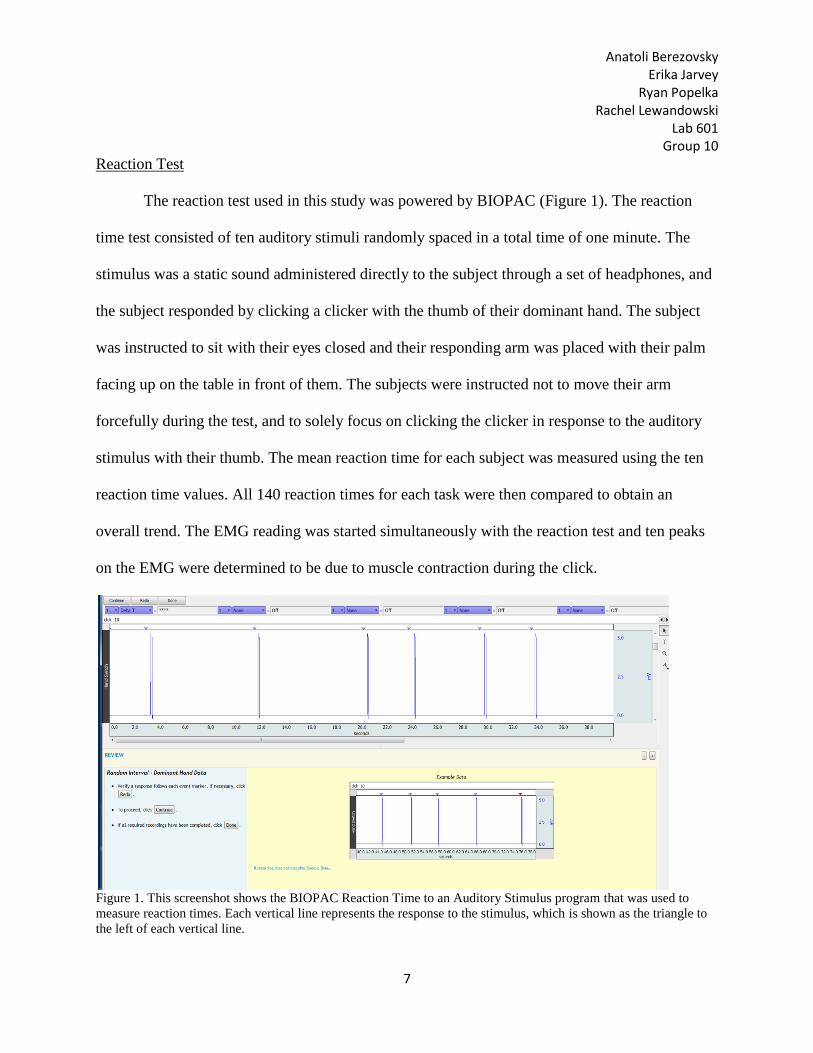
Reaction Test
The reaction test used in this study was powered by BIOPAC (Figure 1). The reaction
time test consisted of ten auditory stimuli randomly spaced in a total time of one minute. The
stimulus was a static sound administered directly to the subject through a set of headphones, and
the subject responded by clicking a clicker with the thumb of their dominant hand. The subject
was instructed to sit with their eyes closed and their responding arm was placed with their palm
facing up on the table in front of them. The subjects were instructed not to move their arm
forcefully during the test, and to solely focus on clicking the clicker in response to the auditory
stimulus with their thumb. The mean reaction time for each subject was measured using the ten
reaction time values. All 140 reaction times for each task were then compared to obtain an
overall trend. The EMG reading was started simultaneously with the reaction test and ten peaks
on the EMG were determined to be due to muscle contraction during the click.
Figure 1. This screenshot shows the BIOPAC Reaction Time to an Auditory Stimulus program that was used to
measure reaction times. Each vertical line represents the response to the stimulus, which is shown as the triangle to
the left of each vertical line.
Anatoli Berezovsky Erika Jarvey
Ryan Popelka Rachel Lewandowski
Lab 601 Group 10
8
14 subjects in the Physiology 435 lab each had their reaction time tested twice, once
following vigorous cardiovascular exercise and once more following focused breathing. The
order in which each subject performed each task was randomized by alternating the order in
which the tasks were performed; for example, the first subject to be tested would exercise, the
next would perform focused breathing, the third would exercise, and so on. In addition, a subject
was not tested twice in a single laboratory setting in order to dissipate any learning that could
have occurred during or in between tests.
Blood Pressure
A manual blood pressure cuff was used to measure the blood pressure of each individual
at two different time points in each task. Two individuals were listening at the same time for the
systolic and diastolic beats to help control for human error. This measurement was used to
support the evident increase in heart rate during the exercise trial and was collected both before
and after the participant performed each task.
EMG
Finally, an electromyography test was taken as the individual performed the reaction time
test. Recordings were based off the clicks from the participants’ dominant hand as they heard
the auditory stimulus. Electrodes were placed according to BIOPAC System instructions, with
the negative electrode just below the elbow, positive on the outside of the wrist and ground on
the inside of the wrist. The parameters that were measured using the EMG were the maximum
integrated electrical signal and the duration of the click responses. Data was taken for each
parameter at points one, five, and ten out of the ten total responses based on the auditory stimuli
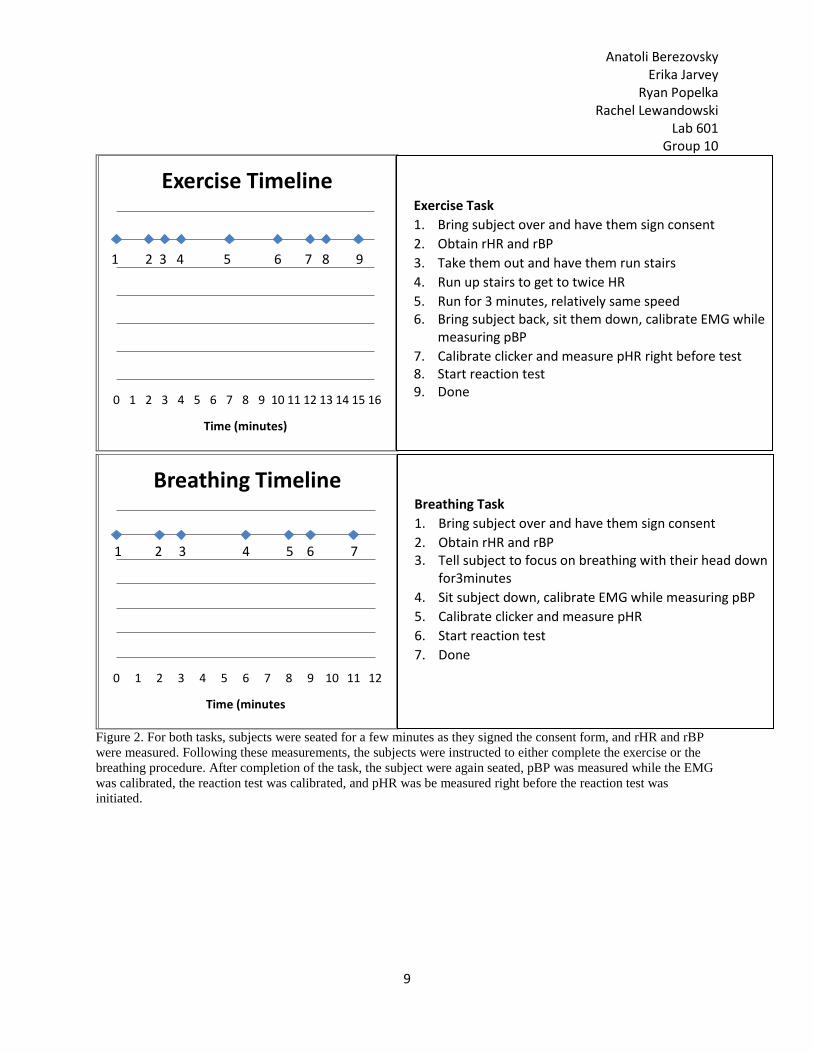
to get a more even spread of information. Figure 2 shows the timeline followed for each task.
Anatoli Berezovsky Erika Jarvey
Ryan Popelka Rachel Lewandowski
Lab 601 Group 10
9
Figure 2. For both tasks, subjects were seated for a few minutes as they signed the consent form, and rHR and rBP
were measured. Following these measurements, the subjects were instructed to either complete the exercise or the
breathing procedure. After completion of the task, the subject were again seated, pBP was measured while the EMG
was calibrated, the reaction test was calibrated, and pHR was be measured right before the reaction test was
initiated.
0 1 2 3 4 5 6 7 8 9 10 11 12 13 14 15 16
Time (minutes)
Exercise Timeline
0 1 2 3 4 5 6 7 8 9 10 11 12
Time (minutes
Breathing Timeline
1 2 3 4 5 6 7 8 9
Exercise Task
1. Bring subject over and have them sign consent
2. Obtain rHR and rBP
3. Take them out and have them run stairs
4. Run up stairs to get to twice HR
5. Run for 3 minutes, relatively same speed 6. Bring subject back, sit them down, calibrate EMG while
measuring pBP
7. Calibrate clicker and measure pHR right before test 8. Start reaction test 9. Done
1 2 3 4 5 6 7
Breathing Task
1. Bring subject over and have them sign consent
2. Obtain rHR and rBP 3. Tell subject to focus on breathing with their head down
for3minutes
4. Sit subject down, calibrate EMG while measuring pBP
5. Calibrate clicker and measure pHR
6. Start reaction test
7. Done

Anatoli Berezovsky Erika Jarvey
Ryan Popelka Rachel Lewandowski
Lab 601 Group 10
10
RESULTS
Following exercise, participants’ reaction times displayed a significant decrease (N=140,
paired t-test, p=0.029<0.05). When observing just the reaction times for males, an even more
significant p-value was obtained (N=90, paired t-test, p=9.6E-06<0.05) and when observing just
the females, the difference in reaction time was determined to be insignificant (N=50, paired t-
test, p=0.07>0.05). For the males, this represented a significant decrease in reaction time
following exercise; for females, however, the near-significant result represented an increase in
reaction time (Figure 3). Figure 4 shows individual values for each subject’s control reaction
time and post-exercise reaction time. Out of the 14 subjects tested, nine had decreases in their
reaction times and five had increases in their reaction times following exercise compared to their
control.
Figure 3. Overall, following exercise, participants’ reaction times showed a significant decrease (N=140, paired t-
test, p=0.029<0.05). When observing just the reaction times for males, an even more significant p-value was
obtained (N=90, paired t-test, p=9.6E-06<<0.05) and when observing just the females, the difference in reaction
time was determined to be insignificant (N=50, paired t-test, p=0.07>0.05). Error bars in this figure represent
standard deviations of the entire data set.
0
0.05
0.1
0.15
0.2
0.25
0.3
0.35
Overall Male Female
Me
an R
eac
tio
n T
ime
(s)
Reaction Times
Control
Exercise
Anatoli Berezovsky Erika Jarvey
Ryan Popelka Rachel Lewandowski
Lab 601 Group 10
11
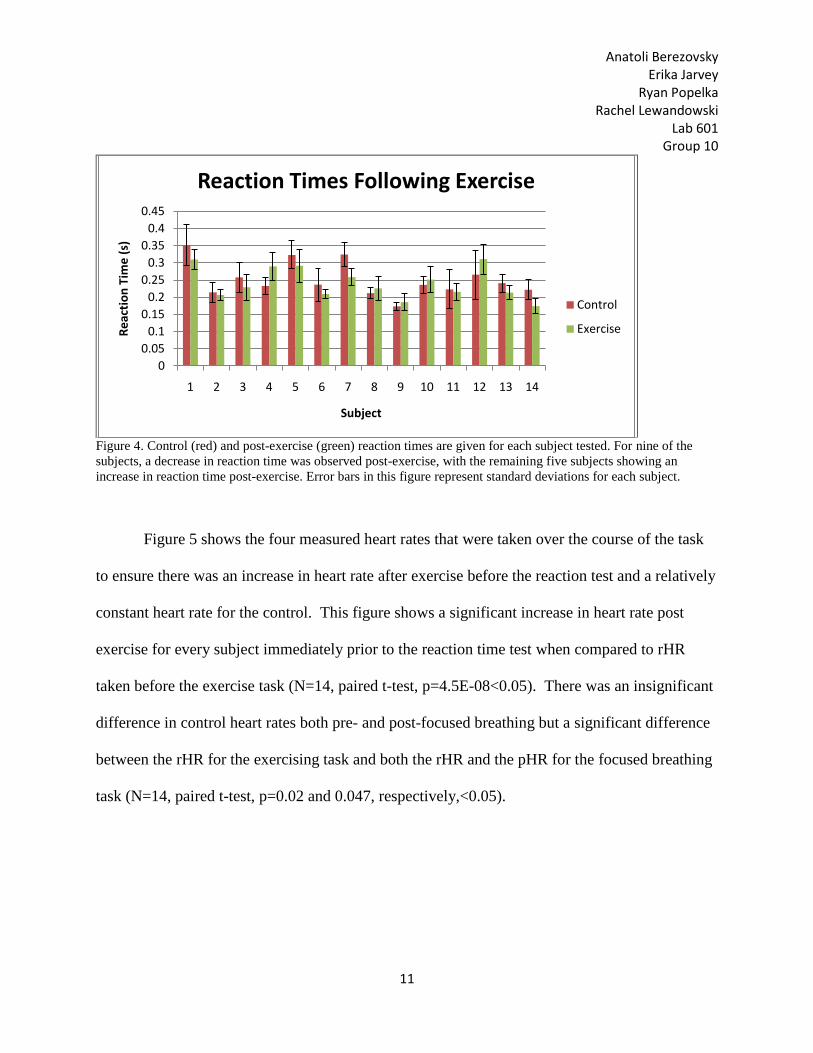
Figure 4. Control (red) and post-exercise (green) reaction times are given for each subject tested. For nine of the
subjects, a decrease in reaction time was observed post-exercise, with the remaining five subjects showing an
increase in reaction time post-exercise. Error bars in this figure represent standard deviations for each subject.
Figure 5 shows the four measured heart rates that were taken over the course of the task
to ensure there was an increase in heart rate after exercise before the reaction test and a relatively
constant heart rate for the control. This figure shows a significant increase in heart rate post
exercise for every subject immediately prior to the reaction time test when compared to rHR
taken before the exercise task (N=14, paired t-test, p=4.5E-08<0.05). There was an insignificant
difference in control heart rates both pre- and post-focused breathing but a significant difference
between the rHR for the exercising task and both the rHR and the pHR for the focused breathing
task (N=14, paired t-test, p=0.02 and 0.047, respectively,<0.05).
0
0.05
0.1
0.15
0.2
0.25
0.3
0.35
0.4
0.45
1 2 3 4 5 6 7 8 9 10 11 12 13 14
Re
acti
on
Tim
e (
s)
Subject
Reaction Times Following Exercise
Control
Exercise
Anatoli Berezovsky Erika Jarvey
Ryan Popelka Rachel Lewandowski
Lab 601 Group 10
12
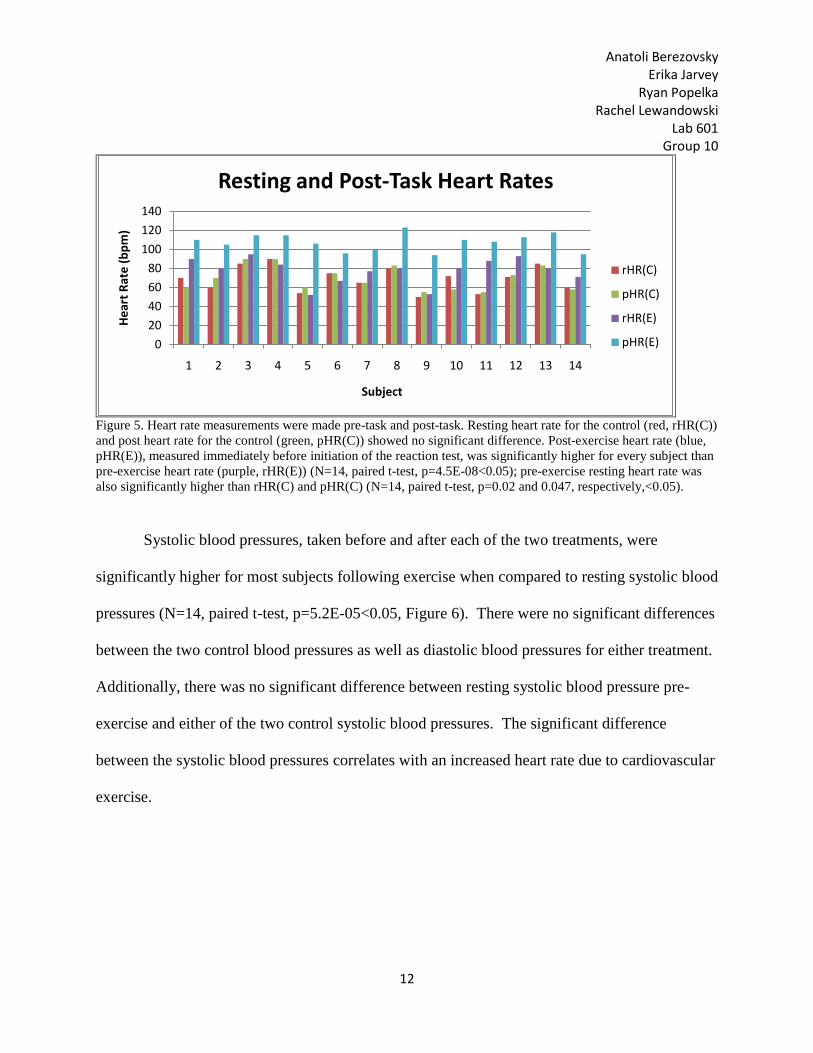
Figure 5. Heart rate measurements were made pre-task and post-task. Resting heart rate for the control (red, rHR(C))
and post heart rate for the control (green, pHR(C)) showed no significant difference. Post-exercise heart rate (blue,
pHR(E)), measured immediately before initiation of the reaction test, was significantly higher for every subject than
pre-exercise heart rate (purple, rHR(E)) (N=14, paired t-test, p=4.5E-08<0.05); pre-exercise resting heart rate was
also significantly higher than rHR(C) and pHR(C) (N=14, paired t-test, p=0.02 and 0.047, respectively,<0.05).
Systolic blood pressures, taken before and after each of the two treatments, were
significantly higher for most subjects following exercise when compared to resting systolic blood
pressures (N=14, paired t-test, p=5.2E-05<0.05, Figure 6). There were no significant differences
between the two control blood pressures as well as diastolic blood pressures for either treatment.
Additionally, there was no significant difference between resting systolic blood pressure pre-
exercise and either of the two control systolic blood pressures. The significant difference
between the systolic blood pressures correlates with an increased heart rate due to cardiovascular
exercise.
0
20
40
60
80
100
120
140
1 2 3 4 5 6 7 8 9 10 11 12 13 14
He
art
Rat
e (
bp
m)
Subject
Resting and Post-Task Heart Rates
rHR(C)
pHR(C)
rHR(E)
pHR(E)
Anatoli Berezovsky Erika Jarvey
Ryan Popelka Rachel Lewandowski
Lab 601 Group 10
13
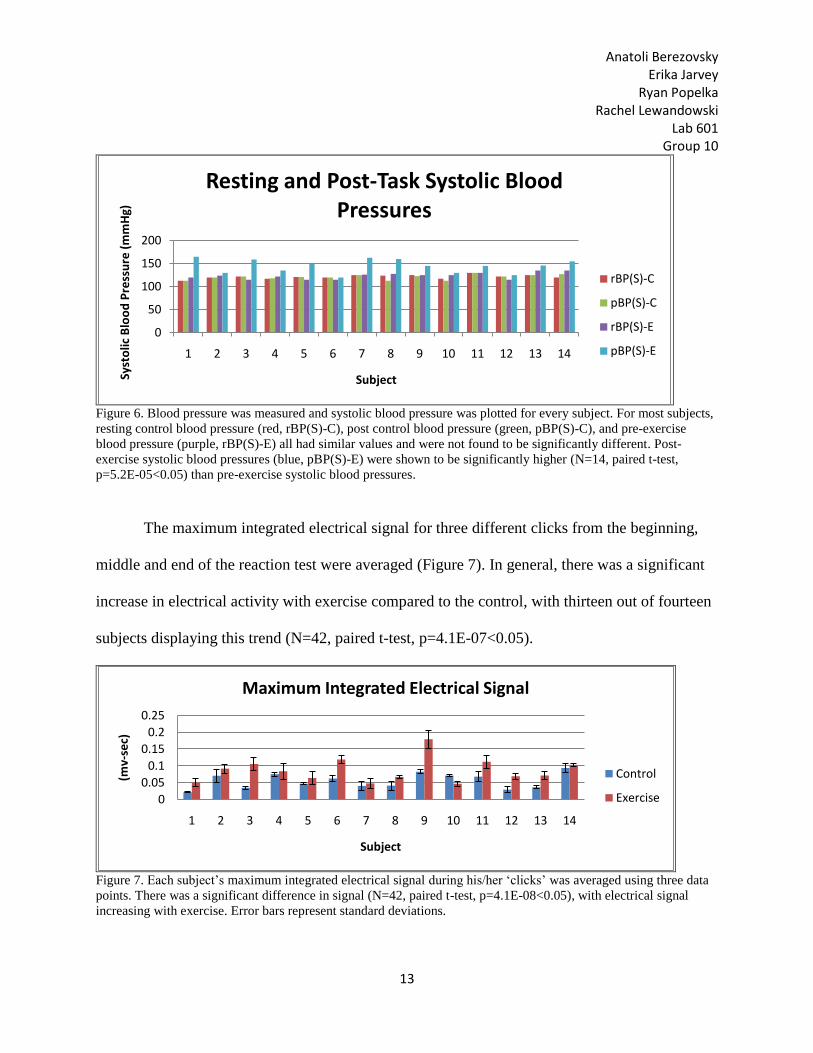
Figure 6. Blood pressure was measured and systolic blood pressure was plotted for every subject. For most subjects,
resting control blood pressure (red, rBP(S)-C), post control blood pressure (green, pBP(S)-C), and pre-exercise
blood pressure (purple, rBP(S)-E) all had similar values and were not found to be significantly different. Post-
exercise systolic blood pressures (blue, pBP(S)-E) were shown to be significantly higher (N=14, paired t-test,
p=5.2E-05<0.05) than pre-exercise systolic blood pressures.
The maximum integrated electrical signal for three different clicks from the beginning,
middle and end of the reaction test were averaged (Figure 7). In general, there was a significant
increase in electrical activity with exercise compared to the control, with thirteen out of fourteen
subjects displaying this trend (N=42, paired t-test, p=4.1E-07<0.05).
Figure 7. Each subject’s maximum integrated electrical signal during his/her ‘clicks’ was averaged using three data
points. There was a significant difference in signal (N=42, paired t-test, p=4.1E-08<0.05), with electrical signal
increasing with exercise. Error bars represent standard deviations.
0
50
100
150
200
1 2 3 4 5 6 7 8 9 10 11 12 13 14
Syst
olic
Blo
od
Pre
ssu
re (
mm
Hg)
Subject
Resting and Post-Task Systolic Blood Pressures
rBP(S)-C
pBP(S)-C
rBP(S)-E
pBP(S)-E
0
0.05
0.1
0.15
0.2
0.25
1 2 3 4 5 6 7 8 9 10 11 12 13 14
(mv-
sec)
Subject
Maximum Integrated Electrical Signal
Control
Exercise

Anatoli Berezovsky Erika Jarvey
Ryan Popelka Rachel Lewandowski
Lab 601 Group 10
14
There was also a significant difference in the duration of the electrical signal when
comparing the two tasks. Nine out of the fourteen subjects showed a decrease in the length of
signal after exercise, in contrast to the original hypothesis that exercise would increase the
duration of contraction (N=42, paired t-test, p=0.002<0.05, Figure 8).
Figure 8. The length of time of electrical signal was measured and averaged for each subject using three data points.
There was an overall significant difference in duration between the two tasks (N=42, paired t-test, p=0.002<0.05),
with signal duration decreasing following exercise. Error bars shown are standard deviations.
Figure 9 represents a correlation between reaction time after both the control and exercise
compared to the EMG recording of maximum electrical muscle signal. Although weak, there
appears to be a relationship between the two parameters showing that as muscle activity
increases, reaction time generally decreases. Specifically, results after exercise generally show
higher muscle activity and lower reaction time as compared to the control.
0
0.1
0.2
0.3
0.4
0.5
0.6
1 2 3 4 5 6 7 8 9 10 11 12 13 14
Du
rati
on
(se
c)
Subject
Duration of Signal
Control
Exercise

Anatoli Berezovsky Erika Jarvey
Ryan Popelka Rachel Lewandowski
Lab 601 Group 10
15
Figure 9. Muscle activity versus reaction time is plotted for each subject as a point. Linear trend lines were
calculated for the control treatment and exercise treatment data.
DISCUSSION
As predicted, the data showed a significant decrease in reaction time following exercise,
with the majority displaying this trend. This finding thus supports the hypothesis and previously
published data. One plausible mechanism for this decrease in reaction time is that an increased
heart rate due to moderate exercise increases cortical blood flow and enhances cognitive function
due to a greater state of arousal.
When observing the two genders separately, the females did not achieve significant
results while the males did. Thus, the need for more female study participants is imperative.
Interestingly, the females showed a near-significant increase in reaction time following exercise
rather than a decrease, opposite to the trend observed in males. This could be due to the
possibility that the specific females that were tested were more alert during the control compared
to the exercise phase. Further experiments could make the female response to exercise more
clear and show whether this result was due to small sample size or a difference in physiological
R² = 0.4553R² = 0.4178
0
0.05
0.1
0.15
0.2
0.25
0.3
0.35
0.4
0 0.05 0.1 0.15 0.2
Re
acti
on
Tim
e (
sec)
Muscle Activity (mv-sec)
Reaction Time with Varying Muscle Activity
Control
Exercise
Linear (Control)Linear (Exercise)
Anatoli Berezovsky Erika Jarvey
Ryan Popelka Rachel Lewandowski
Lab 601 Group 10
16
response between sexes. More subjects overall and more data points per participant would
establish a higher level of significance and a better reflection of the population.
The method that was used to increase heart rate was shown to be effective. Every
subject displayed a higher heart rate after exercise when compared to their control and resting
heart rates. The fact that these heart rates were measured immediately before the reaction test
ensued shows that subjects were in an aroused state immediately before the reaction test began.
Before performing the exercise task, however, it is possible that subjects became aware of the
fact that they would soon be exercising, leading to a feed-forward response that could have been
the cause of their significantly higher resting heart rate. It is unclear what effect this may have
had on reaction time. If performing this experiment a second time, it should be ensured that
subjects are not aware of which treatment they are receiving to avoid this response.
Thirteen out of fourteen subjects showed a significantly increased maximum integrated
electrical signal during their clicks after exercise as compared to the control treatment. This
supports the hypothesis that exercise induces an increased maximum integrated electrical signal
and suggests that exercise may cause a decrease in reaction time not only by an increase in
cortical blood flow, but also by an increase in muscle activity. The original hypothesis regarding
the duration of the electrical signal during the click predicted that the time would be greater
following exercise. This hypothesis is not supported by the data because the duration of the
subjects’ muscular electrical signal was significantly smaller following exercise. One idea can
link the two conclusions regarding the maximum integrated electrical signal and the duration of
the electrical signal. The higher amount of muscle activity could be due to a priming of the
muscle during exercise by increased stimulation of alpha motor neurons, resulting in a higher
Anatoli Berezovsky Erika Jarvey
Ryan Popelka Rachel Lewandowski
Lab 601 Group 10
17
amount of muscle tension after exercise compared to resting. This priming could also account for
the shorter contraction time because the stress from exercise on the muscle primed it for a faster
response. Another idea regarding the duration of electrical signal is that decreased duration could
be due to faster relaxation between contractions because of the sympathetic influence caused by
exercise. Additionally, it would be interesting to examine signal duration and determine if it
decreased as the test progressed due to the consecutive muscle stimulations imposed by the
reaction test itself.
If this experiment was repeated, more subjects would need to be used with more clicks
per subject to determine if these results exist over a larger population. Learning to perform better
between tests is also a concern, thus instead of waiting about one week in between trials per
person, the wait could be longer. For the control phase, a more controlled environment should
be created to provide optimal conditions for relaxing the subjects’ heart rate and blood pressure.
Furthermore, it may be wise to distribute a questionnaire asking for exercise habits to try to
account for differences among individuals.
As stated in the introduction, athletes responding to auditory stimuli can benefit from
the results of this study. The results support the hypotheses that exercise causes a decrease in
reaction time, more so in males than in females, and an increase in strength of muscle
contraction. Additionally, a decrease in contraction duration following exercise was also
observed. All of these physiological changes can aid in quick, explosive movements. The results
can be used as motivation to work harder before and during an athletic event to possibly decrease
reaction time, increase muscular ability, and overall increase performance.

Anatoli Berezovsky Erika Jarvey
Ryan Popelka Rachel Lewandowski
Lab 601 Group 10
18
Works Cited
Ando, S., N. Kida, and S. Oda. 202. Practice effects on reaction time for peripheral and central visual
fields. Perceptual and Motor Skills. 95:747-751.
Boat, J., and N. Dais-Fechner. Sight or Sound; A Study of Reaction Times. University of Colorado
Boulder.
Crabtree, D. A., and L. R. Antrim. 1988. Guidelines for Measuring Reaction Time. Perceptual and Motor
Skills. 66:363-370.
Ozyemisci-Taskiran, O., Z. Gunendi, N. Bolukbasi, and M. Beyazova. 2008. The effect of a single
session submaximal aerobic exercise on premotor fraction of reaction time: An electromyographic study.
Clinical Biomechanics. 23:231-235.
Shelton, J., and G. P. Kumar. 2010. Comparison between Auditory and Visual Simple Reaction Times.
Scientific Research. 1:30-32.
Tanner, W. P., and J. A. Swets. 1954. A decision-making theory of visual detection. Psychological
Review. 68:401-409.
Weford, A.T. 1988. Reaction Time, Speed of Performance, and Age. Annals of the New York Academy
of Science. 515:1-14.