the effect of manipulating features of examinees’ scripts ... · the effect of manipulating...
TRANSCRIPT

1
The effect of manipulating features of examinees’ scripts on their perceived quality
Tom Bramley
Paper presented at the Association for Educational Assessment – Europe (AEA-Europe) annual conference, Malta, November 2009.
Research Division Cambridge Assessment 1, Regent Street Cambridge CB2 1GG [email protected] www.cambridgeassessment.org.uk Cambridge Assessment is the brand name of the University of Cambridge Local Examinations Syndicate, a department of the University of Cambridge. Cambridge Assessment is a not-for-profit organisation.
2
The effect of manipulating features of examinees’ scripts
on their perceived quality
{Manuscript under review – please do not cite without the author’s permission}
Abstract
Expert judgment of the quality of examinees’ work plays an important part in standard setting,
standard maintaining, and monitoring of comparability. In order to understand and validate
methods that rely on expert judgment it is necessary to know what features of examinees’ work
influence the experts’ judgments. The controlled experiment reported here investigated the
effect of changing four features of scripts from a GCSE Chemistry examination: i) the quality
of written English; ii) the proportion of missing as opposed to incorrect responses; iii) the
profile of marks in terms of fit to the Rasch model; and iv) the proportion of marks gained on
the subset of questions testing 'good chemistry'. Six expert judges ranked scripts in terms of
perceived quality. There were two versions of each script, an original version and a
manipulated version (with the same total test score, written in the same handwriting) where
one of the four features had been altered. The rankings were analysed with a latent trait
(Rasch) model and the resulting ‘measures’ of the manipulated versions were compared with
those of the original versions in each category. The two largest effects were obtained by i)
changing the proportion of marks gained on ‘good chemistry’ items – scripts with a higher
proportion appeared better (on average); and ii) replacing incorrect responses with missing
responses – scripts with missing responses appeared worse (on average). The implications of
the findings for operational standard maintaining procedures are discussed.

3
Introduction
Expert judgment of the quality of examinees’ work can play an important part in
several aspects of the assessment process. First and most obvious is the marking (scoring) of a
response to a constructed-response item or an open-ended item. Here the task of the judge1 is
usually to assign a number (the ‘mark’) to the response according to guidelines or instructions
in the mark scheme (scoring rubric). A second aspect is standard-setting – deciding on a cut-
score on the score scale that represents the boundary between two categories such as pass/fail,
grade A / grade B, advanced / proficient. Here the task of the judge(s) is to decide whether the
quality of examinees’ work at a particular mark point on the scale is worthy of the higher or
lower categorisation, usually with reference to explicitly defined performance standards. An
example of this is the ‘Body of Work’ standard-setting method described by Kingston, Kahl,
Sweeney and Bay (2001). A third, and closely related, aspect is standard-maintaining –
deciding on a cut-score that represents the same performance standard as equivalent cut-scores
that have been set on previous versions of the test. Here the task of the judge(s) is to find the
point on the score scale where the quality of examinees’ work matches that of examinees at the
same boundary on previous versions of the test. The mandatory procedures for setting grade
boundaries on high-stakes school examinations in England and Wales (GCSEs and A-levels2)
include this kind of judgment as one source of evidence amongst others to be considered in an
‘award meeting’ (Ofqual, 2009, p37). A fourth aspect is comparability monitoring –
comparing the quality of examinees’ work on different tests where for whatever reason it is
deemed important that performance standards are comparable. This is a very broad area that
will have a different focus in different international contexts. An example from England would
be comparing the standard of work produced by examinees at the grade A boundary in a
particular GCSE or A-level subject from assessments produced by different examination
boards (Awarding Bodies). Reviews of comparability methods involving expert judgment
used in the UK can be found in Adams (2007) and Bramley (2007).

4
Standard setting, standard maintaining, and comparability monitoring all have in
common that the judge’s task is to make a holistic judgment about the quality of examinees’
work (henceforth referred to as a ‘script’), either at the level of an examination paper, or at the
level of a complete assessment (which might involve several papers as components).
It has frequently been found, in a variety of contexts and using a variety of methods, that
holistic judgments of the relative quality of scripts (made in the absence of knowledge of the
mark totals) do not correspond exactly to the ordering of the scripts by their mark totals (e.g.
Bramley, Bell & Pollitt, 1998; Gill & Bramley, 2008; Baird & Dhillon, 2005; Edwards &
Adams, 2002; Jones, Meadows & Al-Bayatti, 2004). Indeed, the finding is often made even in
contexts where the judges are aware of the mark totals, such as traditional grade awarding
meetings for GCSEs and A-levels. Here it is not unusual for a script with a lower total mark to
be judged more worthy of a higher grade than a script with a higher total mark – although the
nature of the award meeting ensures that these ‘reversals’ are far less common and of lesser
magnitude than in exercises where the judges do not know the mark totals.
It is therefore of great importance to understand in as much depth as possible the factors
that influence these holistic judgments in order to have confidence in the outcomes of exercises
that use them. It seems likely that there would be several, perhaps many, different features of
the scripts that influence the judgments, and that some of these might be deemed to be more or
less valid than others. For example, if ‘quality of handwriting’ was found to be a factor, this
would (presumably) not be considered a valid cause of perceived difference in quality. It also
seems likely that there would be differences among judges as to which features were more
relevant to their own decisions.
Several different methods have been used to get at the underlying causes of the judges’
decisions. The most obvious method is simply to ask the judges what factors they thought
were most relevant to their judgments. This has been done in many inter-board comparability
studies (e.g. Edwards & Adams, 2002; Fearnley, 2000; Jones et al., 2004). The advantage of

5
this method is its transparency, but there are several disadvantages. First, it is not possible to
know whether the judges are correct – that is, whether they are actually aware of the factors
underlying their judgments. This is the general problem of reliability of self-report measures,
discussed in several sources (e.g. Nisbett & Wilson, 1977; Leighton, 2004). Second, it seems
likely that judges would avoid mentioning any obviously invalid factor, such as handwriting, in
case it cast doubts on their expertise. Third, it is often the case that the judges report
something that is rather hard to pin down precisely, such as ‘depth of understanding’. Finally,
it is not possible to determine the relative importance of the factors that judges report.
A second method is to try to discover the cognitive processes underlying the judges’
judgments, and the features of the scripts that they are attending to, by verbal protocol analysis
(Ericsson & Simon, 1993). Here, judges are asked to ‘think aloud’ as they make their
judgments and the transcripts of their verbalisations are coded and analysed. Examples of this
approach can be found in Crisp (2008a,b), Suto & Greatorex (2008), and Greatorex & Nadas
(2008). The advantages of this approach over the previous one are that it gets closer to the
actual decision-making, and avoids post hoc rationalisation (or invention). Some of the same
disadvantages apply – for example it is still not necessarily the case that features elicited this
way are in fact the most causally relevant to judges’ decisions.
A third approach would be to carry out post hoc analysis of scripts that have been
involved in a judgmental exercise, comparing scripts with the same total score that were judged
to be of different quality and attempting to identify points of difference between them that
might have been responsible for the perceived difference. One disadvantage of this approach is
that scripts from different examinees can differ on many different features and it would be
difficult to determine which features had been relevant to the judgments.
A fourth, related, approach would be to identify, a priori, features of scripts that might
be salient to judges. Each of a set of scripts could then be rated on the presence or absence of
these features (or the degree to which they possess them). Then the relationships between the
6
coded features and perceived quality could be analysed. Potential problems with this approach
include multi-collinearity (similar types of feature tending to cluster together), separating
causation from correlation, and the risk of discovering spurious associations. But further cross-
validation work could minimise these problems. An example of this approach can be found in
Novakovic & Suto (in preparation).
A fifth approach, and the one tried in this study, is to carry out a controlled experiment,
preparing different versions of the same scripts that differ only in a single feature while
keeping others constant, in particular the total score. Differences between the versions in
perceived quality can then be attributed to the changes made. The advantage of this approach
is that it offers a rigorous way to isolate the effect of different script features on perceived
quality, and thus allow stronger causal conclusions to be drawn. A disadvantage is that the
features have to be specified in advance – so potentially could be found to be not relevant
(although this does avoid the pitfall of capitalising on chance associations in a post hoc
analysis). A further disadvantage is that only a small number of features can be tested in one
experiment – thus leaving the possibility that other, untested, features would be found to be of
greater importance. A final disadvantage is that the method lends itself best to features that can
be easily manipulated experimentally. These disadvantages notwithstanding, the approach
seems promising and, to the author’s knowledge, has not been tried before. This study
therefore represents a new approach to this difficult problem.
The particular judgmental method used in this study was the rank-ordering method for
standard maintaining (Bramley, 2005; Black & Bramley, 2008; Bramley & Black, 2008). A
detailed description of this method is beyond the scope of this paper, but it is essentially an
extension of Thurstone’s (1927) method of paired comparisons. Each judge’s task is to put
sets of scripts (with mark totals removed) into rank order according to perceived quality. The
key features of the method are: i) that it involves relative rather than absolute judgments, so
scripts are compared with each other rather than with a nominal standard. This allows any
7
differences among the judges in personal (absolute) standards to cancel out; and ii) the analysis
of the rankings with a latent trait (Rasch) model locates each script on a scale of ‘perceived
quality’ which can then be related to the total score scale. The rank-ordering method has been
used in a variety of settings and is evaluated in Bramley, Gill & Black (2008).
Method
The examination paper chosen for the study was one unit from a GCSE Chemistry
examination, from June 20073. This examination had a good mix of questions requiring
different types of response, and it had been marked on-screen, so both the scanned images of
the scripts and item level data (the marks of each examinee on each sub-question) were
available. There were 39 sub-questions on the paper and the maximum possible score was 60.
Examinees wrote their answers to the questions in allocated spaces on the question paper.
Features to be manipulated
Four features of scripts were chosen to be manipulated in this study. They were chosen
because they were hypothesised to be relevant to perceived quality, because they could be
relatively easily manipulated, and because they were not too subject-specific (meaning that it
might be appropriate to generalise results to other situations).
1. Quality of written English. Some of the questions on the paper required two or more
lines of writing in the response. The quality of the writing in terms of surface features such as
spelling and punctuation could conceivably have an effect on the perceived quality of a script.
It was hypothesised that the judges, as professional Chemistry examiners, would probably not
be influenced by this feature and that it could therefore serve to aid interpretation of the sizes
of any other effects that were found.
2. Missing response v incorrect answer. When judges compare two scripts with the
same total score, are they more likely to be impressed by an examinee who has attempted all

8
the questions, even if they have a lot of incorrect answers, or is a script containing fewer
incorrect answers but a higher number of missing responses perceived more favourably? No
hypothesis was made about the direction of this effect.
3. Profile of marks in terms of good fit to the Rasch model. If an examinee’s set of
responses fits the Rasch model, then they should have gained more of their marks on the easier
questions and fewer marks on the harder questions. On the other hand, a misfitting examinee
with the same total score will have picked up more marks than expected on the harder
questions, but these will be counterbalanced by some lower marks than expected on the easier
questions. It was hypothesised that judges might be more impressed by the performance of a
misfitting examinee than a well-fitting examinee with the same total score. Anecdotal
impressions and observations have suggested that examiners are more likely to take a good
answer to a hard question as evidence of high ability (rather than, for example, cheating,
special knowledge or good luck), and more inclined to treat a poor answer to an easy question
from such an examinee as evidence of carelessness rather than low ability. This impression
can be further supported by an analogy with high jumping – someone who clears a high bar but
knocks off a low bar might (arguably) seem to be a better jumper than one who clears the low
one but not the high one.
4. Profile of marks in terms of answers to ‘good chemistry’ questions. Although all sub-
questions on a chemistry paper could be said to be testing chemistry by definition, it seems
plausible that some sub-questions might conform more to a purist’s idea of what chemistry is
than others do. It was hypothesised that judges would be more impressed by an examinee who
had gained a higher proportion of their marks on the ‘good chemistry’ questions than an
examinee (with the same total score) who had gained a higher proportion of marks on the other
questions. Although at one level this feature is obviously specific to the paper, it seems
plausible that the concept could generalise – that is, it may be that on maths papers expert

9
judges are particularly influenced by performance on questions that bring out the ‘good
mathematicians’, or on language papers the ‘good linguists’ etc.
Script selection
1000 scripts were initially selected. 250 were sampled uniformly across the mark range
from total test scores of 11 to 50 (out of 60), five scripts on each mark point. The other 750
were sampled at random. This was to ensure that there would be enough scripts to select from
at each mark point. The data from these 1000 examinees was then analysed both with classical
item analysis and the Rasch model in order to obtain indices of item difficulty, omit rate, and
person fit. Ten scripts were then chosen for each feature to be manipulated, giving a total of 40
scripts. The manipulations made in each category are described below.
1. Quality of English. Ten scripts were chosen from across the mark range. 13 sub-
questions on the question paper were identified where the space for the examinee’s answer had
two or more lines. The responses of each examinee to these sub-questions were changed
(where possible) to improve the spelling, grammar and punctuation. It is important to stress
that these changes were relatively slight and superficial. No change was made that might have
changed the mark awarded to the response. In the few cases where the examinee’s response
was too incoherent to ‘improve’ without risking altering the mark it would have obtained, it
was left alone.
2. Missing response v incorrect answer. Ten scripts were chosen from across the mark
range. Five scripts were chosen because they had a high number of blanks (missing responses)
and five because they had a low number of blanks. For the five scripts with a high number of
blanks, incorrect responses to the sub-questions that had been left blank were located from
other examinees with the same total mark (using the 950+ non-selected scripts). It was thought
important to use examinees with the same total mark to supply the incorrect responses because
their responses would be more likely to be typical of what the original examinee might have

10
written. For the five scripts with a low number of blanks, sub-questions that might plausibly
have been left blank were identified (based on difficulty, position in paper, and the overall omit
rate). At the high end of the mark range the manipulation changed the response to about four
sub-questions out of a total of 39 sub-questions on the paper. At the low end of the mark range
as many as 13 responses were changed.
3. Profile of marks in terms of good fit to the Rasch model. Ten scripts were chosen
from across the mark range. Five scripts were chosen because the examinee had a high value
for the misfit statistic4 (indicating a ‘misfitting’ examinee); and five because the examinee had
a low (high negative) value for the fit statistic (indicating an ‘overfitting’ examinee). For the
five misfitting examinees, the fit statistics for each sub-question were inspected to discover
where the misfit lay – i.e. which of the easier sub-questions they had got unexpectedly low
marks on, or which of the harder sub-questions they had got unexpectedly high marks on.
Responses from examinees (with the same overall total score) who had obtained a more
expected score on these sub-questions were located in the (950+) remaining unused scripts.
Care was taken to ensure that the number of marks to be gained on the easier sub-questions
was balanced by the number of marks to be lost on the harder sub-questions so that the
manipulation did not change the overall total score. For the five ‘overfitting’ examinees, the
opposite was done – i.e. responses were located from the remaining unused scripts that would
make their profile fit less well, again taking care to ensure that marks gained equalled marks
lost. This was done in a plausible way – that is, not for example by making the easiest question
wrong and the hardest right, but by altering responses to sub-questions in a range of difficulties
closer to the examinee’s ability estimate. In all cases the manipulation involved changing each
examinee’s response to about ten sub-questions on the paper.
4. Profile of marks in terms of answers to ‘good chemistry’ questions. An examiner
who had set papers for the same suite of examination papers, but who was not an awarder for
this particular paper, was recruited to identify the ‘good chemistry’ sub-questions. He

11
identified 20 sub-questions worth 30 marks in total. Each examinee’s total on the ‘good
chemistry’ and ‘non-good-chemistry’ sub-questions was calculated. Ten scripts were chosen
from across the mark range. Five scripts were chosen because the examinees had scored a high
proportion of their marks on the ‘good chemistry’ sub-questions; and five because the
examinees had scored a low proportion of their marks on these sub-questions. For each set of
five, responses from the remaining pool of unused scripts were used to change the balance of
marks in the appropriate direction. As before, care was taken to find replacement responses
from examinees with the same (or if this was not possible a very similar) overall total score,
but a further precaution was taken – namely not inadvertently to change the mark profile in
terms of Rasch fit. This was achieved by making sure that the marks gained and the marks lost
were from ‘good chemistry’ and ‘non-good-chemistry’ sub-questions that were matched in
terms of difficulty. In all cases the manipulation involved changing each examinee’s response
to about ten sub-questions on the paper.
Script preparation
It was important to ensure that the original and manipulated versions of each script were
written in the same handwriting (in order to rule out handwriting as a potential feature
influencing the comparison). It was also important to ensure that the 40 pairs of scripts
(original + manipulated) were written in different handwriting (so they looked like 40 different
examinees), and to ensure that all handwriting looked as though it could plausibly have been
produced by 16-year olds.
To this end, the author’s colleagues volunteered (or were persuaded) to act as ‘scribes’,
and produce a pair of scripts for the study. They did this by copying out the original answers
onto a blank question paper, then produced the manipulated version by copying out onto a
second blank question paper the original answers plus the necessary changes. The scribes were
told not to try to imitate the examinees’ handwriting, but to use their own style, adapted to
12
make it more like a 16-year old’s (only if absolutely necessary). The scribes were also asked to
reproduce all the crossings out, mis-spellings, diagrams etc. in order to make the scripts look as
authentic as possible. The only feature they did not copy was the number of words per line
(which is very dependent on size and spacing of handwriting).
The scripts were then given a front page containing a random two-letter ID to be used in
the study. Each script was then scanned, thus creating a set of 80 pdf documents that could be
printed out as many times as required by the design of the study.
Judges
The expert judges invited to take part in the study were the six members of the awarding
panel (the group of experts responsible for standard maintaining) for this Chemistry paper in
June 2007. All agreed to take part. Before attending the meeting, the judges were asked to
carry out some preparatory work. The purpose of this was to ensure that they were fully re-
familiarised with everything relating to this particular examination. They were sent a package
of advance materials containing: i) the question paper; ii) the mark scheme; iii) the
specification grid; iv) the item level data analysis report; v) the report on the examination
prepared by the Principal Examiner; and vi) two examinees’ scripts (not from the study) to re-
mark.
They were asked to read all the material before attending the meeting, and to re-mark
the two scripts (so they could re-orient themselves to the kinds of responses examinees had
given). The aim was to ensure that the judges would be as well-prepared as possible to make
the rank-ordering judgments required of them.
Design
The design of the study was necessarily complex. The aim was to ensure that each
judge made a judgment about each script in the study. However, the intention was to conceal

13
from the judges the fact that there were two versions of each script, in case that knowledge
influenced the outcome.
Each pack of scripts to be ranked contained four scripts. The packs for each judge were
arranged into two sets of ten. Across the first ten packs, each judge saw one version of all 40
scripts in the study. The first pack contained scripts from the top end of the mark range, going
down to the tenth pack which contained scripts from the bottom end of the mark range. Across
the second ten packs, each judge saw the other version of each script, i.e. the version (original
or manipulated) that they had not seen in the first ten packs. The second ten packs also ran
from the top end (pack 11) to the bottom end (pack 20) of the mark range.
Each judge saw a different selection of scripts in each pack, and whether they first saw
the original or the manipulated version of each script was randomised. The average mark
range of the scripts in each pack was around five marks, i.e. the best script in each pack had
usually received a test total score five higher than the worst script in each pack, although the
random nature of the allocation algorithm meant that some packs had wider and some had
narrower ranges than this.
Instructions to judges
At the start of the meeting, the judges were given some general background to the study.
This information was presented orally. The purpose of the exercise was presented as being to
discover what features of scripts influence judgments of relative quality when scripts are put
into rank order. The main contrasts of this study with a conventional award meeting were
highlighted: i) relative rather than absolute judgments; ii) judgments of scripts across the whole
mark range rather than at a particular grade boundary; and iii) no marks visible on the scripts.
The specific instructions were then given to the judges on paper (see Appendix A), and
these were then explained. All relevant information about the purpose and the mechanics of
the study was given to the judges with the one exception mentioned above – they were not told
14
that there were two versions of each script. They were told that the second set of ten packs
contained the same scripts that they had seen in the first ten packs, but in different
arrangements (i.e. shuffled differently among the ten packs). While it was true that the
arrangement was shuffled, it was also the case that each script they saw in the second ten packs
was a different version of the script they had seen in the first ten packs. In order to facilitate
this subterfuge, the scripts had been given random 2-letter IDs (e.g. ‘DL’) in the hope that
these would be so unmemorable that the judges would not be aware that the IDs of the scripts
in their second ten packs were different from those in the first ten packs (which had been
cleared away before judgments on the second ten packs began).
The judges were asked to work independently, and to refrain from making tied rankings.
They were allowed to indicate any scripts they felt were genuinely of the same quality by
placing a bracket around them on their record sheets. Past studies have found that this helps
judges to move on, and avoid getting ‘hung up’ on difficult judgments. It was emphasised to
the judges that their rankings should be based on overall holistic judgments of quality, using all
the kinds of information that they would normally consider in an awarding situation, and that
they must not re-mark the scripts.
The final part of the meeting involved collecting written answers from each of the
judges to questions that were designed to elicit their opinions on the features of the scripts that
they thought influenced their judgments, and what they expected the outcomes of this study to
be. After collecting the written feedback, the full purpose of the study (including the existence
of two versions of each script) was revealed to the judges in a final plenary discussion session.
Results
Scale evaluation
The recording sheets contained 20 sets of rankings of four scripts for each of the six
judges. This data was double-keyed into a spreadsheet and checked. The data were analysed
15
using a Rasch formulation of Thurstone’s paired comparison model (see Andrich, 1978a;
Bramley, 2007). The paired comparison model requires the rankings to be converted to sets of
paired comparisons. Each ranking of four scripts yields six paired comparisons. The model
fitted was:
ji BBijp
jip−=
>
>
)(
)(ln
where p(i>j) is the probability that script i is ranked above script j, and Bi and Bj are the
‘measures’ of perceived quality for scripts i and j respectively.
FACETS software (Linacre, 2005) was used to fit this model. The full FACETS output
is given in Appendix B. No script was ranked first or last in every pack in which it appeared,
so measures could be estimated for all 80 scripts. The separation reliability index (analogous
to Cronbach’s Alpha) was high at 0.98, showing that the variability in perceived quality among
the scripts could not be attributed to chance. The fit statistics for both scripts and judges
showed a slight tendency towards over-fit suggesting that the judges were perceiving the trait
in the same way and that there was less variability in their judgments than modelled. All these
scale statistics need to be treated with some caution because the paired comparison analysis,
when derived from rankings, violates the assumption of local independence between paired
judgments. However, there was no indication of any serious problems with the scale5.
It was of great interest to see how the measures of perceived quality related to the marks
awarded to the scripts, which the judges were completely unaware of when making their
judgments. A low correlation would suggest that the judges were perceiving a different
construct of quality than that resulting from the application of the mark scheme.

16
y = 2.44x + 31.33
r = 0.95
0
10
20
30
40
50
60
-10 -5 0 5 10
Measure
Mark
FIGURE 1. Plot of mark (total score) of script against measure of perceived quality.
Figure 1 shows that there was a very high correlation (0.95) between the marks and the
measures. This is evidence of the expertise of the judges and the validity of the mark scheme.
The slope of the linear regression of mark on measure, 2.44, gives an approximate ‘rate of
exchange’ mapping the scale of perceived quality (in logits6) into the mark scale. Since the
choice of regression line is itself somewhat arbitrary (Bramley et al., 2008), and a standardised
major axis has a slope of 2.56, it seems reasonable to take a rough conversion factor of 1 logit
= 2.5 marks for interpreting effect sizes.
Effect of experimental manipulation on perceived quality
For the analyses reported below, the 20 scripts in each category were grouped into ten
pairs according to the research hypotheses about the effect of the experimental manipulation on
perceived quality. Figures 2 to 5 show the differences between the measures obtained by the
scripts in the original and manipulated versions. Scripts perceived to be of exactly the same

17
quality in both versions would have a value of zero for this difference. The error bars show ±1
standard error of measurement (calculated as (se12 + se2
2)½
.)
-3.0
-2.0
-1.0
0.0
1.0
2.0
3.0
4.0
Diffe
rence in m
easure
FIGURE 2. Plot of difference between measures of scripts with improved quality of English
and measures of original scripts.
Figure 2 appears to show no consistent effect of changing the quality of English – some
scripts had a higher measure in the improved version (points above the x-axis line) and some in
the original version (points below the x-axis). The biggest differences were all in the
‘improved’ direction, however, in line with the hypothesis.
18
-4.0
-3.0
-2.0
-1.0
0.0
1.0
2.0
3.0
4.0
5.0
6.0D
iffe
rence in m
easure
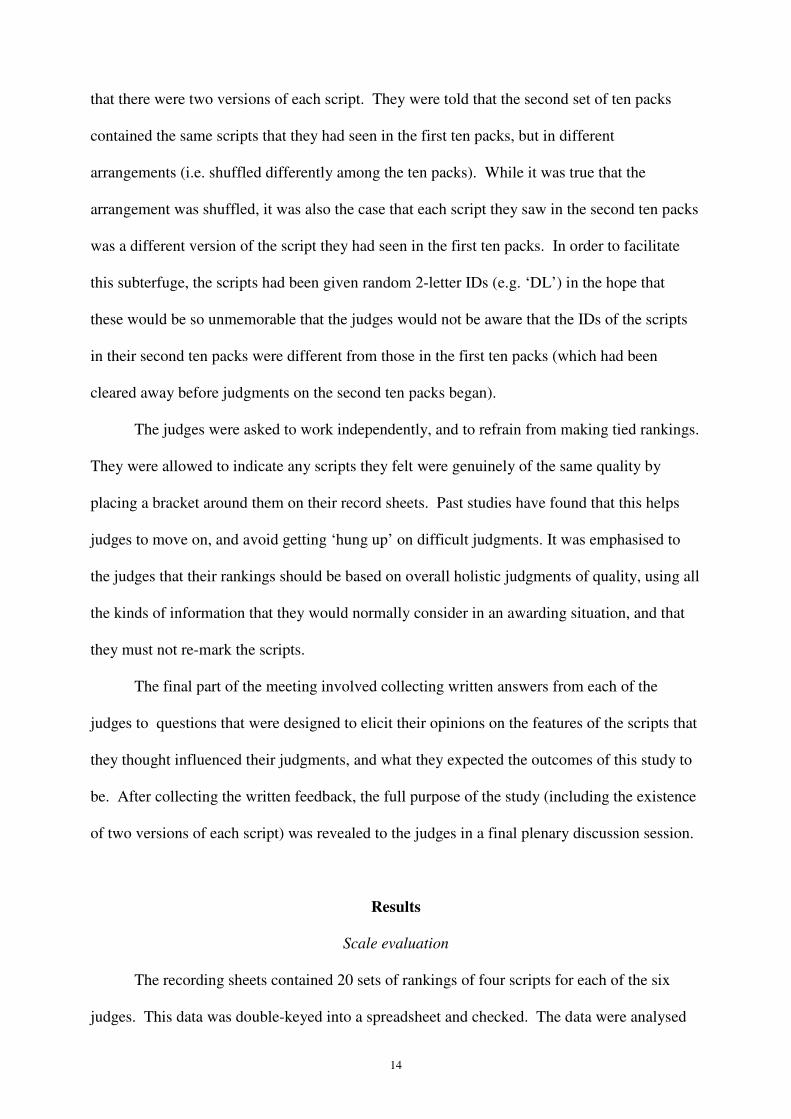
FIGURE 3. Plot of difference between measures of scripts with incorrect answers and
measures of scripts with missing answers.
Figure 3 shows that scripts with incorrect answers were fairly consistently perceived to
be of better quality than those with missing answers. Eight of ten points were above the x-axis.
No directional hypothesis had been made about whether the missing or incorrect answers
would be perceived to be better.
-4.0
-3.0
-2.0
-1.0
0.0
1.0
2.0
3.0
4.0
5.0
Diffe
rence in m
easure

19
FIGURE 4. Plot of difference between measures of scripts with worse fit to the Rasch model
and measures of scripts with better fit.
Figure 4 appears to show no consistent effect of changing the degree of fit, but the
biggest differences were clearly in favour of worse fit, as hypothesised.
-2.0
-1.0
0.0
1.0
2.0
3.0
4.0
5.0
Diffe
rence in m
easure
FIGURE 5. Plot of difference between measures of scripts with a higher proportion of ‘good
chemistry’ marks and measures of scripts with a lower proportion of ‘good chemistry’ marks.
Figure 5 shows that scripts with a higher proportion of good chemistry marks were
fairly consistently perceived to be of better quality than those with a lower proportion, as
hypothesised.
The above graphs have illustrated the main findings, and shown that the effect of
changing the scripts was in the direction predicted by the research hypothesis (where there was
a directional hypothesis). However, it appears from the graphs that none of the effects was
particularly large - although given that each pair of scripts would have received the same total
score it was not expected that large differences would be found.
20
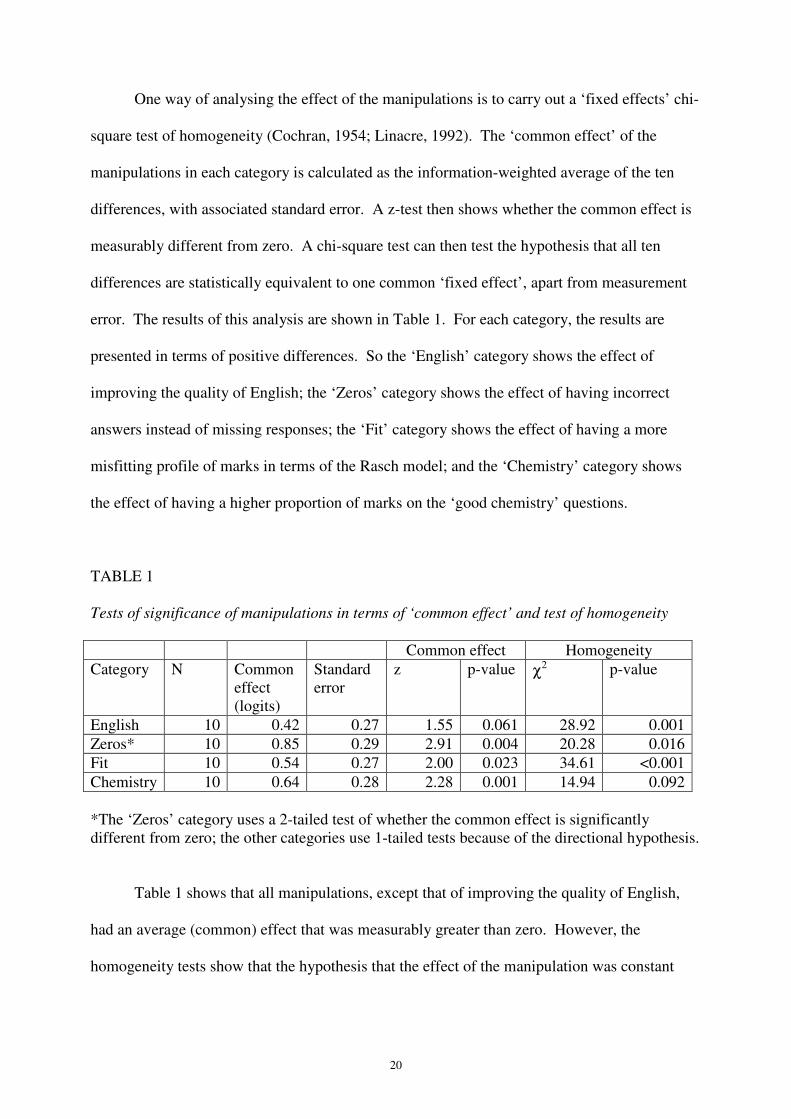
One way of analysing the effect of the manipulations is to carry out a ‘fixed effects’ chi-
square test of homogeneity (Cochran, 1954; Linacre, 1992). The ‘common effect’ of the
manipulations in each category is calculated as the information-weighted average of the ten
differences, with associated standard error. A z-test then shows whether the common effect is
measurably different from zero. A chi-square test can then test the hypothesis that all ten
differences are statistically equivalent to one common ‘fixed effect’, apart from measurement
error. The results of this analysis are shown in Table 1. For each category, the results are
presented in terms of positive differences. So the ‘English’ category shows the effect of
improving the quality of English; the ‘Zeros’ category shows the effect of having incorrect
answers instead of missing responses; the ‘Fit’ category shows the effect of having a more
misfitting profile of marks in terms of the Rasch model; and the ‘Chemistry’ category shows
the effect of having a higher proportion of marks on the ‘good chemistry’ questions.
TABLE 1
Tests of significance of manipulations in terms of ‘common effect’ and test of homogeneity
Common effect Homogeneity
Category N Common
effect
(logits)
Standard
error
z p-value χ2 p-value
English 10 0.42 0.27 1.55 0.061 28.92 0.001
Zeros* 10 0.85 0.29 2.91 0.004 20.28 0.016
Fit 10 0.54 0.27 2.00 0.023 34.61 <0.001
Chemistry 10 0.64 0.28 2.28 0.001 14.94 0.092
*The ‘Zeros’ category uses a 2-tailed test of whether the common effect is significantly
different from zero; the other categories use 1-tailed tests because of the directional hypothesis.
Table 1 shows that all manipulations, except that of improving the quality of English,
had an average (common) effect that was measurably greater than zero. However, the
homogeneity tests show that the hypothesis that the effect of the manipulation was constant
21
across all ten scripts can be rejected for all manipulations except that of the proportion of
marks gained on ‘good Chemistry’ questions – and even this was close to being rejected.
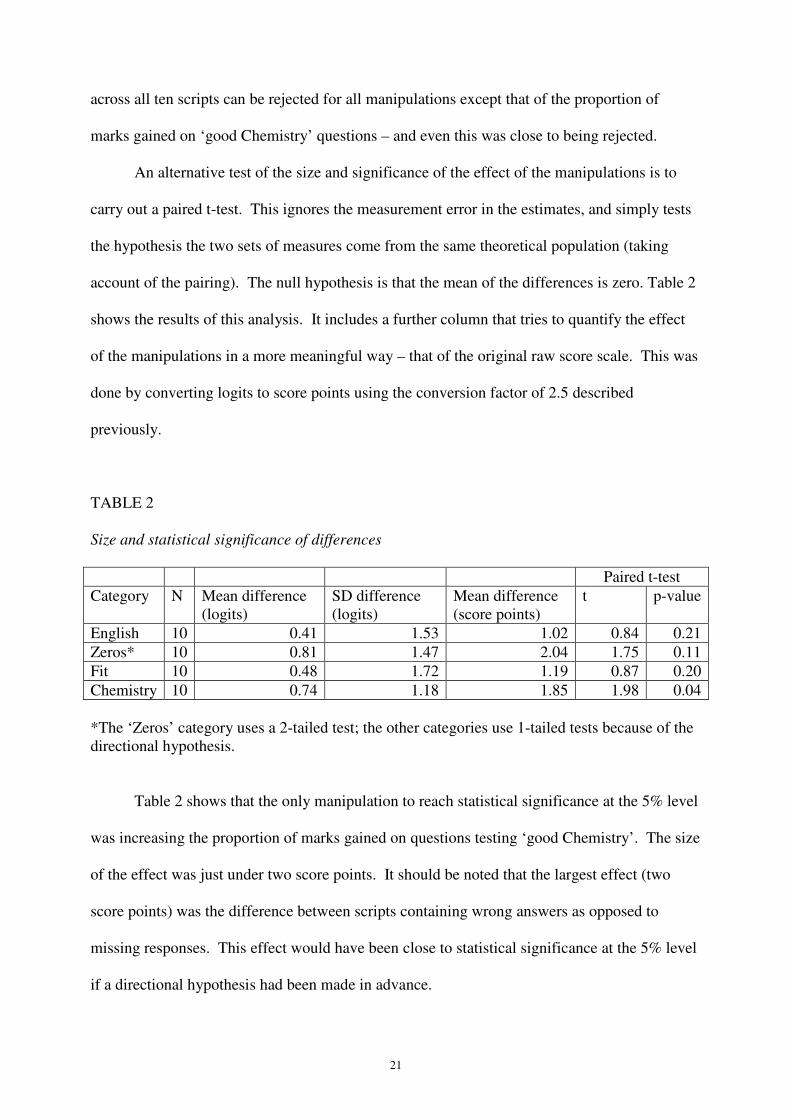
An alternative test of the size and significance of the effect of the manipulations is to
carry out a paired t-test. This ignores the measurement error in the estimates, and simply tests
the hypothesis the two sets of measures come from the same theoretical population (taking
account of the pairing). The null hypothesis is that the mean of the differences is zero. Table 2
shows the results of this analysis. It includes a further column that tries to quantify the effect
of the manipulations in a more meaningful way – that of the original raw score scale. This was
done by converting logits to score points using the conversion factor of 2.5 described
previously.
TABLE 2
Size and statistical significance of differences
Paired t-test
Category N Mean difference
(logits)
SD difference
(logits)
Mean difference
(score points)
t p-value
English 10 0.41 1.53 1.02 0.84 0.21
Zeros* 10 0.81 1.47 2.04 1.75 0.11
Fit 10 0.48 1.72 1.19 0.87 0.20
Chemistry 10 0.74 1.18 1.85 1.98 0.04
*The ‘Zeros’ category uses a 2-tailed test; the other categories use 1-tailed tests because of the
directional hypothesis.
Table 2 shows that the only manipulation to reach statistical significance at the 5% level
was increasing the proportion of marks gained on questions testing ‘good Chemistry’. The size
of the effect was just under two score points. It should be noted that the largest effect (two
score points) was the difference between scripts containing wrong answers as opposed to
missing responses. This effect would have been close to statistical significance at the 5% level
if a directional hypothesis had been made in advance.

22
Judge feedback
For reasons of space, it is not possible to describe the judges’ responses in detail here,
but in summary, their comments provided a lot of support to the experimental findings. All six
judges seemed to endorse the idea that answers to the ‘good chemistry’ questions would be
influential in their judgments, and this was indeed the largest effect found. Five of the judges
also endorsed the idea that good answers to difficult questions outweigh poor responses on
easy questions. As hypothesised, the wrong answers on easy questions can be attributed to
‘slip-ups’ when making holistic judgments of quality. Interestingly, there were differences
among the judges in their thoughts on how missing responses would affect their perception.
Two of the judges said that blanks give a worse impression than wrong answers, but another
two judges suggested the opposite. This was as hypothesised – there was no directional
hypothesis for this effect because both seemed plausible. However, the analysis of rank-order
judgments clearly suggested that the scripts in this study that had blanks instead of incorrect
answers were perceived to be of lower quality. There was some agreement among the judges
that the judgments ought not to be influenced by the quality of English, yet also some
recognition that in practice it might be hard to ignore. The point was made that poor English
can also hinder the communication of the examinee’s knowledge.
Discussion
The main finding of this study was that the most influential feature of scripts in
determining their perceived relative quality is the content of the questions on which the
examinee has gained their marks. It should be emphasised that all the experimental
manipulations made in this study did not affect the total score of the script. In this study, the
proportion of marks gained on the subset (worth half of the total marks) of questions deemed to
test ‘good chemistry’ was shown to be the most relevant. That is, given two identical scripts

23
(apart from the experimental manipulation) with the same total score, the script with the higher
proportion of ‘good chemistry’ marks was likely to be perceived to be of higher quality. It also
seemed clear from the results that a high proportion of missing responses (as opposed to
incorrect answers) creates a bad impression.
The finding that it is not only the total score, but also where and how the marks have
been gained that contributes to perceived quality is implicitly recognised in the established
procedure for setting grade boundaries in GCSEs and A-levels where the expert judges are
directed to focus on performance on questions known as ‘key discriminators’. Different
questions are deemed to be ‘key discriminators’ for different grade boundaries. Although
‘good chemistry’ is not the same concept as a ‘key discriminator’, there is the same idea that a
holistic judgment can be based on a particular subset of the total performance, or that different
parts of an examinee’s performance can carry more weight.
The implication is that the decision of grade-worthiness (in an award meeting), or of
relative quality (in a rank-ordering exercise) is dependent to a large extent on the internal
profile of marks in the scripts chosen to represent all the scripts at a particular mark point.
There is thus something of a tension between the rationale of judgmental standard maintaining
exercises (in awarding meetings or rank-ordering exercises) and the purpose of grading.
Applying a grade boundary to a mark scale ensures that everyone with a total mark on or above
the boundary (up until one mark below the next boundary) receives the grade. How an
examinee has achieved their total score is irrelevant – any mark profile that yields the same
total will receive the same grade. However, the mark profile has been shown to be important
in the judgmental standard-maintaining. If this were the only thing determining the grade
boundary, it (the boundary) would be affected by the particular scripts chosen for scrutiny by
the judges.
While the mark range of scripts considered at an award meeting is closely controlled,
there is (as yet) no such control exercised over the profile of marks within the scripts or of

24
other features, such as the number of missing responses, when selecting scripts for scrutiny.
This study suggests that it might be possible to (further) influence the outcome of an awarding
meeting (or rank-ordering exercise) by choosing scripts that exhibit particular features. With
the increasing availability of item level data, it is now in principle possible to check that the
scripts selected for scrutiny by expert judges are representative of all scripts on that total mark,
in terms of profile of performance on specified sub-sets of items, and in terms of number of
missing responses.
As our understanding of the features of scripts influencing judgments of quality
increases, it ought to be possible to predict with increasing accuracy what judgments a group of
experts will make about a given set of scripts. If good predictors can be discovered that can
easily be coded in advance, as was the case with three of the four features investigated here
(number of blanks, profile of marks in terms of Rasch fit, profile in terms of good chemistry),
this kind of research could, where successful, reduce the need for expert judgment in standard
maintaining exercises. Lest this sound too controversial, it should be noted that the success of
research in understanding the effect of statistical properties of examination cohorts on pass
rates has already led to a change in awarding practice in England, with experts now being
asked to make a confirmatory judgment about the quality of work on ‘Statistically
Recommended Boundaries’ (SRBs). Future work could test the findings of this study by
attempting to predict the result of these confirmatory judgments based on the features of the
scripts selected.
Notes
1 The expert making the judgment is generically referred to as a ‘judge’ in this article. Other more context-
specific terms include marker, rater, examiner and awarder. 2 General Certificate of Secondary Education (GCSE) examinations are taken in England and Wales at age 16+ at
the end of compulsory schooling, Advanced Subsidiary (AS)-levels are taken at 17+, and Advanced (A)-Levels at
age 18+ (this second year of post-compulsory examinations being referred to as A2). 3OCR (Oxford, Cambridge and RSA Examinations) is a UK Awarding Body. The Chemistry examination paper
used in this study was OCR’s GCSE Chemistry (Gateway) Higher Tier, unit code B641. It can be downloaded

25
from
http://www.ocr.org.uk/Data/publications/past_papers_2007_june/GCSE_Gateway_Chemistry_B_B641_02_June_
2007_Question_Paper.pdf . Accessed 21/4/09. 4 The ‘residual fit’ statistic in Rumm2020 (Rumm Laboratory, 2004).
5 A parallel analysis of the rankings was carried out using the Rasch Rating Scale Model (Andrich, 1978b). The
resulting measures of perceived quality correlated 0.999 with those from the paired comparison model. The
separation reliability index was the same (0.98). 6 The logit (log-odds unit) is the arbitrary unit created by the analysis method.
References
Adams, R. (2007). Cross-moderation methods. In P.E. Newton, J. Baird, H. Goldstein, H.
Patrick, & P. Tymms (Eds.), Techniques for monitoring the comparability of examination
standards. (pp. 212-245). London: Qualifications and Curriculum Authority.
Andrich, D. (1978a). Relationships between the Thurstone and Rasch approaches to item
scaling. Applied Psychological Measurement, 2, 449-460.
Andrich, D. (1978b). A rating formulation for ordered response categories. Psychometrika,
43(4), 561-573.
Baird, J.-A., & Dhillon, D. (2005). Qualitative expert judgements on examination standards:
valid, but inexact. AQA Research Report RPA_05_JB_RP_077. Guildford: AQA.
Black, B., & Bramley, T. (2008). Investigating a judgemental rank-ordering method for
maintaining standards in UK examinations. Research Papers in Education, 23(3), 357-373.
Bramley, T. (2005). A rank-ordering method for equating tests by expert judgment. Journal of
Applied Measurement, 6(2), 202-223.
Bramley, T. (2007). Paired comparison methods. In P.E. Newton, J. Baird, H. Goldstein, H.
Patrick, & P. Tymms (Eds.), Techniques for monitoring the comparability of examination
standards. (pp. 246-294). London: Qualifications and Curriculum Authority.
Bramley, T., Bell, J.F., & Pollitt, A. (1998). Assessing changes in standards over time using
Thurstone paired comparisons. Education Research & Perspectives, 25(2), 1-24.
Bramley, T. & Black, B. (2008). Maintaining performance standards: aligning raw score
scales on different tests via a latent trait created by rank-ordering examinees' work. Paper
presented at the Third International Rasch Measurement conference, University of Western
Australia, Perth, January 2008.
Bramley, T., Gill, T. & Black, B. (2008). Evaluating the rank-order method for standard
maintaining. Paper presented at the International Association for Educational Assessment
annual conference, Cambridge, September 2008.
Cochran, W.G. (1954). The combination of estimates from different experiments. Biometrics,
10(1), 101-129.
26
Crisp, V. (2008a). Exploring the nature of examiner thinking during the process of examination
marking, Cambridge Journal of Education, 38(2), 247-264.
Crisp, V. (2008b). Do assessors pay attention to appropriate features of student work when
making assessment judgments? Research Matters: A Cambridge Assessment Publication, 6,
5-9.
Edwards, E., & Adams, R. (2002). A comparability study in GCE AS geography including
parts of the Scottish Higher grade examination. A study based on the summer 2001
examination. Organised by the Welsh Joint Education Committee on behalf of the Joint
Council for General Qualifications.
Ericsson, K.A., & Simon, H.A. (1993). Protocol analysis: verbal reports as data. London:
MIT Press.
Fearnley, A. (2000). A comparability study in GCSE mathematics. A study based on the
summer 1998 examination. Organised by the Assessment and Qualifications Alliance
(Northern Examinations and Assessment Board) on behalf of the Joint Forum for the GCSE
and GCE.
Gill, T., & Bramley, T. (2008). How accurate are examiners’ judgments of script quality? An
investigation of absolute and relative judgments in two units, one with a wide and one with a
narrow ‘zone of uncertainty’. Paper presented at the British Educational Research
Association annual conference, Heriot-Watt University, Edinburgh, September 2008.
Greatorex, J., & Nadas, R. (2008). Using ‘thinking aloud’ to investigate judgements about A-
level standards: does verbalising thoughts result in different decisions? Paper presented at
the British Educational Research Association annual conference, Edinburgh, September
2008.
Jones, B., Meadows, M., & Al-Bayatti, M. (2004). Report of the inter-awarding body
comparability study of GCSE religious studies (full course) summer 2003. Assessment and
Qualifications Alliance.
Kingston, N.M., Kahl, S.R., Sweeney, K.P., & Bay, L. (2001). Setting performance standards
using the Body of Work method. In G. J. Cizek (Ed.), Setting Performance Standards:
Concepts, Methods and Perspectives. (pp. 219-248). Mahwah, NJ: Lawrence Erlbaum
Associates.
Leighton, J.P. (2004). Avoiding misconception, misuse, and missed opportunities: The
collection of verbal reports in educational achievement testing. Educational Measurement:
Issues and Practice, 23(4), 6–15.
Linacre, J.M. (1992). Treatment Effects. Rasch Measurement Transactions 6:2, 218-219.
Available at http://www.rasch.org/rmt/rmt62b.htm (Accessed 17/09/09).
Linacre, J. M. (2005). FACETS Rasch measurement computer program. Chicago:
Winsteps.com
Nisbett, R.E., & Wilson, T.D. (1977). Telling more than we can know: verbal reports on
mental processes. Psychological Review, 84(3), 231-259.

27
Novakovic & Suto (in preparation). How should grade boundaries be determined in
examinations? An exploration of the script features that influence expert judgments.
Ofqual (2009). GCSE, GCE and AEA Code of Practice. London: Qualifications and
Curriculum Authority. Retrieved April 28, 2009, from http://www.ofqual.gov.uk/files/2009-
04-14-code-of-practice.pdf.
Rumm Laboratory Pty Ltd. (2004). Interpreting RUMM2020. Part 1: dichotomous data.
Retrieved June 16, 2008, from http://www.rummlab.com.au/demo.html.
Suto, W. M. I. and Greatorex, J. (2008) What goes through an examiner’s mind? Using verbal
protocols to gain insights into the GCSE marking process, British Educational Research
Journal 34(2), 213 – 233.
Thurstone, L.L. (1927). A law of comparative judgment. Psychological Review, 34, 273-286.

28
Appendix A – Instructions to judges
You have 20 separate packs each containing 4 scripts. Each script is identified by a two-letter code, e.g.
‘CF’. The label on each pack lists the IDs of the scripts it contains. The scripts you receive within each
pack are in no particular order, and have been cleaned of marks. Each judge has a different
combination of scripts in their packs.
The task we would like you to complete for each pack is to place the 4 scripts into a single rank order
from best to worst.
Although this may not be easy in the absence of marks, we hope that your familiarisation with the
question papers, mark schemes, item level statistics and other information from the award meeting will
make it a feasible task.
You may use any method you wish to create your ranking, based on scanning the scripts and using your
own judgment to summarise their relative merits, but you should not re-mark the scripts. We are
expecting each pack to take around 15 minutes to rank, but would also expect the first few packs to take
a bit longer while you become accustomed to the task.
No tied ranks are allowed. If you are concerned that two or more scripts are genuinely of exactly the
same standard you may indicate this by placing a bracket around them in the table on the record sheet,
but you must enter every script onto a separate line of the table, as in the example below:
Rank Script ID
Best 1 AF
� 2 DM
� 3 RO
Worst 4 WP
When you have finished ranking a pack, please replace the scripts in the plastic wallet and return it to
the box at the front.
In most packs, the scripts cover a range of about 5-6 marks. Occasionally the range is narrower or
wider than this.
Pack 1 contains scripts from the top end of the mark range, working down to Pack 10 which contains
scripts from the bottom end of the mark range. The mark ranges of consecutive packs overlap.
Packs 11 to 20 follow the same pattern and use the same scripts, but in different pack combinations.
Please do not collaborate or confer with any of your colleagues who are completing this exercise as it is
important that we have independent individual responses.

29
Appendix B – FACETS output
B641 script features project 05-22-2008 11:02:54
Table 7.2.1 Judge Measurement Report (arranged by mN).
-----------------------------------------------------------------------------------------------
| Obsvd Obsvd Obsvd Fair-M| Model | Infit Outfit |Estim.| |
| Score Count Average Avrage|Measure S.E. | MnSq ZStd MnSq ZStd|Discrm| N Judge |
-----------------------------------------------------------------------------------------------
| 60 120 .5 .50| .00 .23 | .79 -2.0 .75 -1.0| 1.31 | 3 |
| 60 120 .5 .50| .00 .23 | 1.04 .4 1.00 .1| .93 | 4 |
| 60 120 .5 .50| .00 .24 | .84 -1.3 .84 -.3| 1.22 | 6 |
| 60 120 .5 .50| .00 .23 | .85 -1.3 .64 -1.3| 1.28 | 1 |
| 60 120 .5 .50| .00 .24 | 1.13 1.0 1.07 .3| .83 | 2 |
| 60 120 .5 .50| .00 .25 | 1.13 1.0 1.14 .4| .81 | 5 |
-----------------------------------------------------------------------------------------------
| 60.0 120.0 .5 .50| .00 .24 | .96 -.4 .91 -.3| | Mean (Count: 6) |
| .0 .0 .0 .00| .00 .01 | .14 1.2 .18 .7| | S.D. (Populn) |
| .0 .0 .0 .00| .00 .01 | .15 1.4 .19 .8| | S.D. (Sample) |
-----------------------------------------------------------------------------------------------
Model, Populn: RMSE .24 Adj (True) S.D. .00 Separation .00 Reliability 1.00
Model, Sample: RMSE .24 Adj (True) S.D. .00 Separation .00 Reliability .83
Model, Fixed (all same) chi-square: .0 d.f.: 5 significance (probability): 1.00
-----------------------------------------------------------------------------------------------
Table 7.3.1 Script Measurement Report (arranged by mN).
---------------------------------------------------------------------------------------------
| Obsvd Obsvd Obsvd Fair-M| Model | Infit Outfit |Estim.|
| Score Count Average Avrage|Measure S.E. | MnSq ZStd MnSq ZStd|Discrm| Nu Script
---------------------------------------------------------------------------------------------
| 9 18 .5 1.00| 8.87 .77 | .78 -.2 .47 -.4| 1.20 | 42 F01B (mark 50)
| 9 18 .5 1.00| 8.33 .68 | 1.12 .4 .91 .2| .88 | 21 E01A (mark 48)
| 9 18 .5 1.00| 8.08 .58 | 1.28 1.0 2.69 2.2| .25 | 12 C06B (mark 49)
| 9 18 .5 1.00| 7.39 .73 | 1.58 1.2 1.96 1.0| .39 | 10 C05B (mark 47)
| 9 18 .5 1.00| 7.15 .59 | .58 -1.6 .43 -1.0| 1.69 | 9 C05A (mark 47)
| 9 18 .5 1.00| 7.13 .61 | .65 -1.0 .56 -.6| 1.45 | 71 Z06A (mark 52)
| 9 18 .5 1.00| 6.89 .57 | .85 -.5 .69 -.6| 1.31 | 22 E01B (mark 48)
| 9 18 .5 1.00| 6.82 .53 | 1.13 .6 1.18 .7| .65 | 41 F01A (mark 50)
| 9 18 .5 1.00| 6.35 .58 | .70 -1.0 .76 -.5| 1.40 | 72 Z06B (mark 52)
| 9 18 .5 1.00| 6.13 .58 | .77 -.8 .60 -.8| 1.42 | 11 C06A (mark 49)
| 9 18 .5 1.00| 5.59 .65 | 1.23 .6 .93 .0| .84 | 62 Z01B (mark 46)
| 9 18 .5 1.00| 5.41 .66 | .78 -.4 .51 -.4| 1.29 | 26 E03B (mark 40)
| 9 18 .5 .99| 5.22 .59 | .46 -2.1 .36 -1.4| 1.79 | 1 C01A (mark 44)
| 9 18 .5 .99| 5.06 .60 | 1.22 .7 1.39 .8| .65 | 51 F06A (mark 45)
| 9 18 .5 .99| 4.57 .60 | 1.35 1.2 2.65 1.9| .21 | 24 E02B (mark 43)
| 9 18 .5 .99| 4.51 .62 | 1.13 .5 1.47 .7| .73 | 61 Z01A (mark 46)
| 9 18 .5 .99| 4.36 .59 | 1.30 1.0 1.11 .3| .56 | 2 C01B (mark 44)
| 9 18 .5 .99| 4.33 .57 | .79 -.8 .59 -.6| 1.47 | 52 F06B (mark 45)
| 9 18 .5 .98| 3.95 .57 | .92 -.2 1.34 .8| .99 | 43 F02A (mark 41)
| 9 18 .5 .98| 3.95 .61 | .97 .0 .66 -.2| 1.14 | 54 F07B (mark 35)
| 9 18 .5 .98| 3.76 .63 | .94 -.1 .57 .2| 1.21 | 30 E05B (mark 35)
| 9 18 .5 .97| 3.38 .58 | .91 -.2 .76 -.4| 1.19 | 25 E03A (mark 40)
| 9 18 .5 .96| 3.30 .54 | 1.05 .3 .90 .0| .94 | 27 E04A (mark 38)
| 9 18 .5 .96| 3.30 .58 | .58 -1.6 .44 -1.0| 1.70 | 13 C07A (mark 41)
| 9 18 .5 .96| 3.28 .62 | 1.08 .4 .83 .4| .89 | 14 C07B (mark 41)
| 9 18 .5 .96| 3.09 .59 | 1.21 .8 1.44 .7| .55 | 44 F02B (mark 41)
| 9 18 .5 .95| 3.03 .60 | .82 -.5 .60 .0| 1.33 | 28 E04B (mark 38)
| 9 18 .5 .94| 2.79 .55 | 1.04 .2 .95 .1| .92 | 23 E02A (mark 43)
| 9 18 .5 .90| 2.14 .57 | .95 .0 .93 .0| 1.08 | 73 Z07A (mark 36)
| 9 18 .5 .89| 2.13 .62 | 1.01 .1 .75 .0| 1.05 | 64 Z02B (mark 39)
| 9 18 .5 .86| 1.78 .61 | .74 -.7 .56 -.5| 1.39 | 63 Z02A (mark 39)
| 9 18 .5 .80| 1.41 .60 | .74 -.8 .66 -.2| 1.39 | 46 F03B (mark 34)
| 9 18 .5 .78| 1.24 .63 | 1.08 .3 1.35 .6| .82 | 53 F07A (mark 35)
| 9 18 .5 .74| 1.05 .60 | .71 -1.1 .50 -.4| 1.52 | 29 E05A (mark 35)
| 9 18 .5 .64| .58 .54 | .79 -.9 .73 -.7| 1.52 | 31 E06A (mark 30)
| 9 18 .5 .64| .56 .75 | 1.68 1.4 1.29 .6| .48 | 74 Z07B (mark 36)
| 9 18 .5 .61| .45 .60 | .99 .0 .81 .0| 1.05 | 16 C08B (mark 31)
| 9 18 .5 .59| .36 .61 | 1.21 .8 1.79 .9| .40 | 4 C02B (mark 33)
| 9 18 .5 .58| .32 .64 | .86 -.4 .52 -.2| 1.29 | 56 F08B (mark 27)
| 9 18 .5 .50| .01 .67 | .75 -.7 .42 -.6| 1.36 | 45 F03A (mark 34)
| 9 18 .5 .43| -.27 .57 | 1.52 2.1 1.90 .9| -.40 | 66 Z03B (mark 28)
| 9 18 .5 .41| -.35 .59 | .69 -1.3 .48 -.1| 1.62 | 15 C08A (mark 31)
| 9 18 .5 .41| -.37 .67 | .73 -.6 .45 -.4| 1.34 | 3 C02A (mark 33)
| 9 18 .5 .41| -.38 .56 | .65 -1.5 .53 -1.1| 1.73 | 32 E06B (mark 30)
| 9 18 .5 .35| -.62 .56 | .89 -.4 .73 .0| 1.31 | 55 F08A (mark 27)
| 9 18 .5 .26| -1.04 .89 | .38 -1.1 .15 -.5| 1.40 | 5 C03A (mark 24)

30
| 9 18 .5 .22| -1.26 .77 | 1.42 .9 1.17 .5| .71 | 77 Z09A (mark 25)
| 9 18 .5 .10| -2.19 .71 | .47 -1.2 .29 -1.0| 1.46 | 65 Z03A (mark 28)
| 9 18 .5 .07| -2.65 .76 | .67 -.5 .45 -.5| 1.26 | 6 C03B (mark 24)
| 9 18 .5 .06| -2.71 1.00 | 1.59 .9 1.43 .8| .71 | 75 Z08A (mark 32)
| 9 18 .5 .05| -2.96 1.02 | 1.55 .8 1.01 .6| .77 | 76 Z08B (mark 32)
| 9 18 .5 .05| -2.98 .63 | 1.24 .7 1.53 1.0| .67 | 58 F09B (mark 19)
| 9 18 .5 .04| -3.09 .69 | .70 -.6 .52 -.3| 1.30 | 39 E10A (mark 18)
| 9 18 .5 .03| -3.33 .65 | .42 -1.8 .29 -1.5| 1.61 | 18 C09B (mark 25)
| 9 18 .5 .03| -3.36 .62 | .75 -.6 .75 -.4| 1.28 | 36 E08B (mark 23)
| 9 18 .5 .02| -3.85 .70 | 1.55 1.2 1.49 .7| .44 | 34 E07B (mark 26)
| 9 18 .5 .02| -3.86 .65 | 1.42 1.2 1.43 .7| .45 | 33 E07A (mark 26)
| 9 18 .5 .02| -3.98 .56 | .86 -.4 .83 -.3| 1.25 | 19 C10A (mark 16)
| 9 18 .5 .02| -4.17 .62 | .97 .0 .76 -.1| 1.08 | 37 E09A (mark 20)
| 9 18 .5 .01| -4.34 .57 | 1.00 .0 .89 .0| 1.04 | 40 E10B (mark 18)
| 9 18 .5 .01| -4.38 .60 | .76 -.7 .58 -.8| 1.39 | 60 F10B (mark 13)
| 9 18 .5 .01| -4.51 .57 | .79 -1.0 .59 -.5| 1.55 | 59 F10A (mark 13)
| 9 18 .5 .01| -4.56 .60 | .48 -1.9 .38 -1.2| 1.73 | 38 E09B (mark 20)
| 9 18 .5 .01| -4.68 .55 | .88 -.4 .73 -.3| 1.31 | 68 Z04B (mark 21)
| 9 18 .5 .01| -4.73 .54 | .88 -.5 .83 -.2| 1.31 | 20 C10B (mark 16)
| 9 18 .5 .01| -4.80 .59 | 1.06 .3 1.07 .3| .89 | 80 Z10B (mark 17)
| 9 18 .5 .01| -4.84 .54 | 1.33 1.6 1.40 .9| .04 | 49 F05A (mark 14)
| 9 18 .5 .01| -5.05 .59 | 1.05 .2 .85 .1| .98 | 78 Z09B (mark 25)
| 9 18 .5 .01| -5.21 .54 | .90 -.4 .77 -.2| 1.31 | 35 E08A (mark 23)
| 9 18 .5 .00| -5.38 .61 | 1.17 .6 1.11 .3| .77 | 48 F04B (mark 22)
| 9 18 .5 .00| -5.46 .57 | .91 -.3 .78 -.1| 1.20 | 67 Z04A (mark 21)
| 9 18 .5 .00| -5.57 .59 | 1.66 2.0 2.24 2.1| -.18 | 7 C04A (mark 14)
| 9 18 .5 .00| -5.66 .55 | .93 -.2 .78 -.4| 1.21 | 79 Z10A (mark 17)
| 9 18 .5 .00| -5.83 .62 | 1.02 .1 .88 .1| .98 | 47 F04A (mark 22)
| 9 18 .5 .00| -6.15 .82 | 1.24 .6 .85 .6| .79 | 17 C09A (mark 25)
| 9 18 .5 .00| -6.27 .58 | .72 -.9 .55 -1.0| 1.48 | 50 F05B (mark 14)
| 9 18 .5 .00| -6.29 .57 | .72 -1.0 .56 -.9| 1.51 | 57 F09A (mark 19)
| 9 18 .5 .00| -6.36 .57 | 1.06 .2 1.00 .1| .92 | 69 Z05A (mark 12)
| 9 18 .5 .00| -6.67 .60 | 1.06 .2 .94 .0| .94 | 8 C04B (mark 14)
| 9 18 .5 .00| -7.89 1.04 | .99 .2 .62 .0| 1.04 | 70 Z05B (mark 12)
---------------------------------------------------------------------------------------------
| Obsvd Obsvd Obsvd Fair-M| Model | Infit Outfit |Estim.|
| Score Count Average Avrage|Measure S.E. | MnSq ZStd MnSq ZStd|Discrm| Nu Script
---------------------------------------------------------------------------------------------
| 9.0 18.0 .5 .49| .00 .63 | .97 -.1 .91 .0| | Mean (Count: 80)
| .0 .0 .0 .44| 4.54 .10 | .30 .9 .50 .8| | S.D. (Populn)
| .0 .0 .0 .44| 4.56 .10 | .30 .9 .50 .8| | S.D. (Sample)
---------------------------------------------------------------------------------------------
Model, Populn: RMSE .64 Adj (True) S.D. 4.49 Separation 7.03 Reliability .98
Model, Sample: RMSE .64 Adj (True) S.D. 4.52 Separation 7.07 Reliability .98
Model, Fixed (all same) chi-square: 4352.6 d.f.: 79 significance (probability): .00
Model, Random (normal) chi-square: 78.1 d.f.: 78 significance (probability): .48
---------------------------------------------------------------------------------------------