the effect of manager characteristics on the capital
TRANSCRIPT

THE EFFECT OF MANAGER CHARACTERISTICS ON THE
CAPITAL STRUCTURES OF FIRMS LISTED AT THE NAIROBI
SECURITIES EXCHANGE
AUGUSTUS MAITHYA KYENZE
D61/76632/2012
A RESEARCH PROJECT PRESENTED IN PARTIAL
FULFILLMENT OF THE REQUIREMENTS FOR THE AWARD OF
DEGREE OF MASTER IN BUSINESS ADMINISTRATION,
UNIVERSITY OF NAIROBI
2014

ii
DECLARATION
This Research Project is my original work and has not been presented in any other
University.
Signed…………………………………………… Date …………………………………..
AUGUSTUS MAITHYA KYENZE
D61/76632/2012
This Research project has been submitted for examination with my approval as University
Supervisor.
Signed………………………………………….. Date ……………………………………
Mr. Nixon Omoro
Lecturer
Department of Finance and Accounting
School of Business, University of Nairobi

iii
DEDICATION
The research project is dedicated to my lovely wife Mrs Juliet Maithya, My daughters
Trezer and Susan for their understanding and moral support throughout my studies.

iv
ACKNOWLEDGEMENT
I wish to recognize a number of individuals who contributed to the successful completion
of this research project.
My sincere gratitude to my project supervisor Mr. Nixon Omoro, Department of Finance
and Accounting for their tireless guidance, selfless dedication and encouragement in
making this project a reality. I also wish to acknowledge the contribution of the rest of
University of Nairobi fraternity especially the library staff to the success of this project.
My sincere gratitude to Central bank of Kenya for the provision of necessary data used in
the completion of this study.
Most important of all I extend my gratitude to the Almighty God for providing me with
strength, good health and knowledge that helped make this project a reality.
To all of you kindly accept my appreciation for your great support.

v
ABSTRACT
Managers are at the helm of leadership in any organization. Their values, behaviors skills,
and all aspects related to temperament and intellectual ability will ultimately influence the
approach they will take in decision making. One of the important indicators of an
organization performance is its capital structure. Different managers have different
characteristics which contribute to firm’s financial option. This study therefore sought to
establish the effect of manager characteristics on capital structure of firms listed in the
Nairobi securities exchange. The study adopted across sectional and explanatory study
design. The study targeted the 61 companies listed in the Nairobi securities exchange.
Secondary data was collected from different organizations from the years 2008-2013.
Descriptive statistics was used to taste the normality of the data collected. Data analysis
was done using the statistical package for social sciences. The study concluded that there
was a significant relationship between the age of the CEOs and the performance of the
firm. The study concluded that the CEOs need to be of a mature age as they are tasked with
making important decisions. The study also concluded that there was no significant
relationship between the gender of the respondents and the performance of the firm
although the majority of the CEOs are male. The study also concluded that there was no
significant between the level of education of the CEOs and the firms listed at the NSE. The
study concluded that the majority of the CEOs at the firms listed at the NSE have master’s
degrees. The study recommended that more female CEOs be appointed as it will promote
gender equality in management. The study also recommended that organizations facilitate
for their CEOs to attend trainings that will equip them with relevant skills in management.
.

vi
TABLE OF CONTENTS
DECLARATION .................................................................................................................. ii
DEDICATION ..................................................................................................................... iii
ACKNOWLEDGEMENT .................................................................................................. iv
ABSTRACT .......................................................................................................................... v
TABLE OF CONTENTS ................................................................................................... vi
LIST OF TABLES ............................................................................................................ viii
LIST OF ABBREVIATIONS ............................................................................................. ix
CHAPTER ONE: INTRODUCTION ................................................................................ 1
1.1 Background of the Study ............................................................................................. 1
1.1.1 Manager Characteristics ....................................................................................... 2
1.1.2 Capital Structure ................................................................................................... 4
1.1.3 Relationship between the Managerial Characteristics and Capital Structure ...... 5
1.1.4 Nairobi Securities Exchange ................................................................................ 6
1.2 Research Problem ................................................................................................... 7
1.3 Research objective ...................................................................................................... 9
1.4 Value of the Study ...................................................................................................... 9
CHAPTER TWO: LITERATURE REVIEW ................................................................. 11
2.1 Introduction ............................................................................................................... 11
2.2 Theoretical Review ................................................................................................... 11
2.2.1 Trade off Theory .................................................................................................... 11
2.2.2 Agency Theory ....................................................................................................... 12
2.2.3 Upper Echelons Theory .......................................................................................... 13
2.3 Determinants of Capital Structure ............................................................................. 14
2.4 Empirical Review ...................................................................................................... 20
2.5 Summary of Literature Review ................................................................................. 25
CHAPTER THREE: RESEARCH METHODOLOGY ................................................. 26
3.1 Introduction .......................................................................................................... 26
3.2 Research Design ................................................................................................... 26
3.3 The Population .......................................................................................................... 27

vii
3.4 Data Collection .......................................................................................................... 27
3.5 Data Analysis ............................................................................................................ 28
CHAPTER FOUR: DATA ANALYSIS, RESULTS AND DISCUSSION .................... 30
4.1 Introduction ............................................................................................................... 30
4.2 Response Rate ........................................................................................................... 30
4.3 Age of the Chief Executive Officer ........................................................................... 30
4.4 Gender of the Chief Executive Officer ..................................................................... 31
4.5 Tenure of the Chief Executive Officer ...................................................................... 32
4.6 Level of education of the Chief Executive Officer ................................................... 32
4.7 Capital Structure of the Firm ..................................................................................... 33
4.8 Regression Analysis .................................................................................................. 34
4.9 Discussion ................................................................................................................. 36
CHAPTER FIVE: SUMMARY CONCLUSION AND RECOMMENDATION ......... 37
5.1 Introduction ............................................................................................................... 37
5.3 Discussions of the Findings ....................................................................................... 37
5.4 Conclusions of the Study ........................................................................................... 38
5.5 Recommendations of the Study ................................................................................. 39
5.6 Limitations of the Study ............................................................................................ 39
5.7 Recommendations for Further Studies ...................................................................... 40
REFERENCES ................................................................................................................... 42
APPENDICES ....................................................................................................................... i
APPENDIX 1: Secondary Data Capture Form .................................................................. i
APPENDIX 2 : Firms quoted in Nairobi Securities Exchange ......................................... ii
APPENDIX 3: AGE ......................................................................................................... iv
APPENDIX 4: GENDER ................................................................................................ vii
APPENDIX 5: TENURE ................................................................................................. ix
APPENDIX 6: LEVEL OF EDUCATION ...................................................................... xi
APPENDIX 7: CAPITAL STRUCTURE ..................................................................... xiii

viii
LIST OF TABLES
Table 4.1:Age of the CEO. ....................................................................................................... 30
Table 4.2: Gender of the CEO. ................................................................................................. 31
Table 4.3: Tenure of the CEO. ................................................................................................. 32
Table 4.4:Level of Education ................................................................................................... 32
Table 4.5:Capital Structure of the Firm ................................................................................... 33
Table 4.6:Model Summary ....................................................................................................... 34
Table 4.7:ANOVA Results ...................................................................................................... 34
Table 4.8: Regression coefficients ........................................................................................... 35

ix
LIST OF ABBREVIATIONS
CEO – Chief Executive Officer
CMA- Capital Markets Authority
EPS - Earnings Per Share
MIMS - Main Investment Market Segment
NSE – Nairobi Securities Exchange
USD – United States Dollar

1
CHAPTER ONE: INTRODUCTION
1.1 Background of the Study
Manager characteristic is the aspect of values, behaviours and skills, in addition to other
traits that are related to temperament and intellectual ability. According to Tarus and
Ayabei (2014) managers have different characteristics such as age, gender diversity which
contribute to firms’ financing option. Therefore it is crucial to examine whether having
managers characteristics would enhance or weaken capital structure. Researchers in
accounting, economics and management agree that managers trait are critical in exercising
strategic control, tougher monitoring and financial decision making (such as capital
structure) in firms (Gulamhussen and Santa, 2011).
The Capital structure of a company is the combination of debt, equity and other sources of
finance that it uses for its long term financing. The key division in capital structure is
between debt and equity. This separation of funding into either debt or equity can be
sometimes complicated by the existence of other types of capital that blur the line between
debt and equity. This study adopts the definition that capital structure of a company is the
combination of debt and equity a firm uses to finance its long term assets. One of the
important decisions made by board of directors is capital structure. Capital structure has
long been linked to the firm’s profitability and performance (Abor, 2005; Arbiyan and
Safari, 2009; Chakraborty, 2010).
The study was built on the following theories; The “Upper echelons” literature (Hambric&
Mason, 1984) which attempts to link the attributes of the firm’s leaders with strategic
choices and organizational outcomes based on innovation performance. Agency theory

2
which posits that capital structure is determined by agency costs. The trade-off theory
which addresses the issue of bankruptcy cost. It states that there is a tax advantage to
financing with debt (tax benefit) and that there is a cost of financing with debt (bankruptcy
and financial distress cost of debt) Jensen and Meckling (1976).
The study was carried out on firms listed in the Nairobi Securities Exchange. This is
because these firms are properly regulated with all the necessary documentation and
therefore the findings will be invaluable to all the firms in Kenya as it will provide a
benchmark on the effect of manager characteristics on capital structure. These firms such
as Kakuzi, East African Breweries, Bamburi cement, Athi River mining, Safaricom,
Nation and Standard media groups and others are good examples of firms listed in the NSE
and trade their shares frequently therefore a researcher would get all the information they
need easily.
1.1.1 Manager Characteristics
The concept of managers characteristic is the aspects of values, behaviours and skills, in
addition to other traits that are related to temperament and intellectual ability. The qualities
necessary for management can be seen as a balance, with integrity as the strong, solid base,
with respect and responsibility balanced on either side (John, 2006). James (2010) defines
characteristics of managers and the influence of these characteristics on organizational
change and performance such as managerial age, education, experience, tenure and
functional background. Malmendier at al., (2010) show that measurable managerial
characteristics have significant explanatory power for corporate financing decisions
beyond traditional capital-structure determinants. There are two classifications of managers

3
characteristics including observable and non observable characteristics. This study will
concentrate on observable characteristics.
These characteristics of managers can be measured quantitatively. For example the
managerial age can be measured through grouping them into age brackets. The education
can be measured according to educational level of managers. Experience of managers can
be bracket according to the number of years the individual has had in the work place using
an interval. The tenure and functional background of managers can also be measured
quantitatively according to the number of years they have been at the helm of leadership.
Other manager characteristics may include the leadership styles of managers; social
networks and the level of collaboration. Gender also plays a big role in determining the
capital structure of a company.
Verner (2006) stated that women directors may better understand particular market
condition than men, which brings more creativity and quality to decision making thus may
affect the capital structure of firms. Larger gender diversity may generate a better public
image of the firm and improve firm performance. Another observable characteristic likely
to affect the capital structure of firms include ethnic diversity. Hambrick, Cho and Chen
(1996) discussed advantages of having ethnic diversity in the management of an
organization. Ethnic diversity broadens knowledge; idea and experience through the range
of information resources of different cultural background among the management team
hence diversify financing sources. An organization with high level of cultural
heterogeneity in management is able to share ideas and reach ultimate decision based on

4
the various thinking and thus, will improve management performance through a common
consensus among the multiracial group of managers.
1.1.2 Capital Structure
Capital structure is described as ratio of debt to equity. According to Ajao and Ema, (2012)
debt comprises of long term loans such as debenture and equity which includes paid up
share capital, share premium, reserves, and retained earnings. Hence, a firm can use debts
and/or equity to finance its investment. Apparently, capital structure has been argued to be
important management decision since it highly affect the equity return and risks related to
owner as well as the market value of the shares. Thus, deciding how to finance a firm is
very important not just to the managers of a firm but also to fund providers (Ajao & Ema,
2012).
Making a wrong mix of finances employed in the firm might seriously affect the
performance and survival of the business enterprise. It is therefore incumbent on
management of a company to determine an optimal capital structure which will ensure that
their business continues as going concern. Most economies in developing countries are
uncertain, thus, capital structure decision are very important since the existence of macro
environment factors such as high and soaring interest rates, volatility in economic and
political situations are important factors that determines the capital structure of firms (Ajao
& Ema, 2012). Capital structure of a firm will be measured by short term debt divided by
the total assets or long-term debt divided by total assets (Martin, 1993) and total debt
divided by total assets.
5
1.1.3 Relationship between the Managerial Characteristics and Capital
Structure
Gender differences in attitudes towards risk and in risk related behaviour and their effect
on capital structure have long been studied in the economics and psychology literatures
(Francoeuretal, 2008). More recently, there has been a significant increase of women in
corporate executive offices. With this increase, researchers have started to investigate the
impact of gender on various corporate decisions, such as capital structure decisions (Huang
and Kisgen, 2008). More recent studies begin to investigate whether gender of corporate
executives or directors affect corporate decision-making.
Extant literature on individual risk-taking behaviour shows that demographic and
socioeconomic factors influence individual risk tolerance, e.g., age of the individual. That
is, an individual’s ability and willingness to bear risk could be shaped by his or her age
thus influencing his capital structure decision making skills (Leland, 2001). The structure
of responsibility and power of decision making in publicly traded companies is
hierarchical according to the age of top executives. Executives in these firms work in a
hierarchy with the CEO in most cases an older individual at the top. As a result the CEO is
the most powerful individual on the board regarding capital structure decision making
(Wang,et l.,2001). Niederle & Vesterlund (2007) examine whether age difference affects
the capital structure decisions of managers. They conclude that younger managers more
frequently select to operate in more competitive environment than older do. However, the
authors remark that this difference exists not due to different risk aversion, but because
young managers are more overconfident and there are age differences in preferences for

6
performance in a competitive environment. According to Morton, (2002) there is a
significant relationship between capital structure and age plus experience of top
employees. Firms with older and qualified board membership have low leverage or debt
ratio compared to young and less qualified.
Several recent studies have focused mainly on the effects of different managerial traits on
capital structure decision making behaviour. For example, well-educated and
overconfident managers may predict a pecking order of financing decisions (Baker et al.,
2004), managers with growth perception bias overestimate the growth of future earnings
generated by their company and hence view external finance as unduly costly (Hackbarth,
2007), Educated CEOs tend to issue new equity whenever the debt-to-equity ratio is lower
relative to the sector's ratio; CEOs who are educated are open to new experiences and
avoid traditional, available, funding sources. They consider as more important the
exploitation of possible advantages rather than avoiding possible negative consequences
and they tend to issue new equity whenever the stock price is relatively high. (Graham et al
2001).
1.1.4 Nairobi Securities Exchange
The Nairobi Securities Exchange (NSE) was constituted as Nairobi Stock Exchange in
1954 as a voluntary association of stockbrokers in the European community registered
under the Societies Act (RoK, 2013). As a capital market institution, the Stock Exchange
plays an important role in the process of economic development. A number of brokers are
licensed to operate. The Nairobi Securities Exchange comprises 61 listed companies with a

7
daily trading volume of over USD 5 million and a total market capitalization of
approximately USD 15 billion (CMA, 2013).
The NSE, like many other emerging markets, suffers from the lack of liquidity in the
market. In Kenya, The government and the private sector have invested heavily in creating
an enabling environment for doing business and indeed, some companies have performed
exceedingly well as a result. Several companies, however, are experiencing declining
performance and some have even been delisted from the NSE in the last decade.
Momentous efforts to revive the ailing and liquidating companies have focused on
financial decisions. However managers and practitioners still lack adequate guidance for
attaining optimal financing decisions (Kibet, Tenei & Mutwol, 2011) yet many of the
problems experienced by the companies put under statutory management were largely
attributed to financing (Chebii, Kipchumba & Wasike, 2011).
1.2 Research Problem
A growing body of empirical evidence suggests that manager-specific characteristics
significantly influence firms' financing decisions (Graham and Harvey, 2001, Bertrand and
Scholar, 2003). Extant literature shows that powerful managers directly influence capital
structure decisions of the firm (Daily and Johnson, 1997) and might exert their power by
opposing the board (Haynes and Hillman, 2010). Machold looked at taxes, size of firm,
business risk, and asset tangibility as determinants of Capital Structure and omitted
Manager Characteristics which my study is looking at.
Companies in the same industry run by management of different characteristics; who
employ different capital structure models experience different results. Broadly speaking,

8
there are two forms of capital: equity capital and debt capital. Each has its own benefits
and drawbacks and a substantial part of wise corporate stewardship and management is
attempting to find the perfect capital structure in terms of risk / reward payoff for
shareholders. Management styles range from aggressive to conservative. The more
conservative a management's approach is, the less inclined it is to use debt to increase
profits. An aggressive management may try to grow the firm quickly, using significant
amounts of debt to ramp up the growth of the company's earnings per share (EPS).
Despite the recognized importance of the effects of these personality traits on corporate
performance and behaviour and resulting financial policies, knowledge of the influence of
a global, multi-facet, personality dimension, which may provide a comprehensive and
compelling rubric for assessment and description of human (e .g., CEOs) personality, on
behavioural outcomes, and hence their impact on capital structure decisions, is limited.
Most research in finance has maintained a primarily analytical and descriptive focus and
studied the consequences of a priori heterogeneous CEO behaviour for single personality
(e.g., risk-aversion) traits on corporate finance decisions.
According to the studies done Sinan (2010) on how firm characteristics affect capital
structure the study looks at various firm level characteristics such as, profitability, size,
growth opportunities, asset tangibility, non-debt tax shield, volatility and liquidity on
capital structure; According to a study conducted by Sayılgan 2002 on the Firm-Specific
determinants of corporate capital structure they looked at size, profitability and growth
opportunities in plant, property and equipment, growth opportunities in total assets, non-

9
debt tax shields and tangibility. Also in the African scene Turkson 2013 looks at how
organization’s profitability affects capital structure of an organization. Locally, Ondiek
(2010) studied relationship between capital structure and financial performance of firms
listed at the Nairobi Securities Exchange. This study did not review managerial
characteristics. Otieno (2012) studied capital structure and performance at Nairobi
Securities Exchange. From the review of studies previously done here, it can be seen that
there is no study that has been conducted on the effects of manager characteristics on the
capital structure of firms listed in Nairobi Securities Exchange. This study therefore sought
to fill this research gap by answering one research question: How do Manager
Characteristics affect Capital Structure?
1.3 Research objective
To establish the effect of manager characteristics on the capital structure of firms listed in
Nairobi Securities Exchange.
1.4 Value of the Study
The benefit of the study goes to the firms’ management to use the outcome in improving
on optimal capital structure through managers characteristics concept and provide
information to firms operating in Kenyan business environment and investors on how
managers characteristics operates thus enhancing capital structure decision which benefits
shareholders value in the firm.
The study also provides information to scholars pursuing, research and students in this
field showing the gaps for further studies in this area. From the study scholars would be

10
able to evaluate the effect of managers’ characteristics on capital structure. The study also
helps in policy building to govern institutions. The study would go a long way in helping
policy makers gain a deeper understanding on the effect of managers characteristics on
capital structure hence come up with policies that would help firms improve their
performance.

11
CHAPTER TWO: LITERATURE REVIEW
2.1 Introduction
This chapter details literature of past studies done in the area of manager characteristics
and its effect on capital structure. The chapter also entail the theories of the study.
2.2 Theoretical Review
In carrying out the research on the impact of managers’ character on the capital structure;
the researcher employed trade-off theory, agency theory and upper Echelons theory.
2.2.1 Trade off Theory
The trade-off theory of capital structure argues that capital structure is determined by the
trade-off between the benefits of debt tax shields and the costs of financial distress. A
number of studies examine the quantitative effects of the trade-off between taxes and
financial distress costs in dynamic, structural models in which managers are assumed to
behave in the interests of shareholders (Fischer et al 1989), Leland and Toft (1996),
Goldstein et al. (2001), Hennessy and Whited (2005), Strebulaev (2007)).
Because they do not incorporate managerial discretion, manager characteristics have no
effect on capital structure in these models. We contribute to this literature by analysing the
effects of managerial discretion in a dynamic model that also incorporates taxes and
bankruptcy costs. Apart from reconciling growing evidence on the effects of manager
characteristics on financing decisions (Berger et al. (1997), this study), our analysis also
sheds light on the relative importance of taxes, bankruptcy costs, and manager-shareholder
agency conflicts in the determination of capital structure. Though widely utilized in

12
corporate finance, the trade-off theory has been criticized on the basis that it is not
adequately descriptive of observed capital structures. The fact that existing trade-off
models fail to address debt structure leaves the theory open to criticism.
Since this theory argues that capital structure is determined by the trade-off between the
benefits of debt tax shields and the costs of financial distress, the theory will help in
explaining how a manager’s character comes into play in determining what trade-off to
choose.
2.2.2 Agency Theory
The agency theory of capital structure is based on the premise that agency conflicts
between managers and outside investors are a key determinant of capital structure (Myers,
2001). DeMarzo and Sannikov (2006) and DeMarzo and Fishman (2007) investigate the
effects of agency conflicts on capital structure in dynamic frameworks with risk-neutral
agents and complete contracting.
Berk et al. (2006) analyse the effects of managerial risk aversion on capital structure in a
framework with one-sided commitment. We complement their study by developing a
framework with moral hazard effort provision, incentive compensation, and risky long-
term debt. We implement the manager’s contract through financial securities, which leads
to a dynamic capital structure and implications for the effects of manager and firm
characteristics on long-term debt and short-term debt.
Subramanian (2008) develops a continuous-time agency model to show how a risk-averse
manager’s discretion in dynamic financing, effort and project choices affects capital
structure. He (2011) studies the effects of manager shareholder agency conflicts on capital

13
structure and finds that the effects of debt overhang on managerial incentives lowers the
optimal leverage.
Agency theory is somewhat controversial, particularly in the literature on financial ethics.
For example, Horrigan claims that the agency theory…. “Raises the ethical danger of
creating a very contentious, litigious view of financial relationship pitting agents against
principals and principles against principles as perpetual adversaries” Business world is an
adversaries place is valid but this hardly originated with agency theory. The world of
business has competition at it very core, competition exist not only among firms but within
firms, as employees compete for recognition, promotions and salary increases agency
theory acknowledge this world but did not create it .In this study, the agency theory will
help in explaining how a manager’s character comes into play in managing conflicts
between managers and outside investors which are a key determinant of capital structure of
an organization.
2.2.3 Upper Echelons Theory
Upper echelons theory of demographic diversity of the top management team builds on the
idea of the dominant coalition (Cyert and March, 1963) to propose that executives
influence organization innovation performance through the decisions they make ( Hambric
and Mason,1984). Upper echelon theory suggests that executives will make decisions that
are consistent with their cognitive base (Hambric and Mason, 1984) or executive
orientation (Finkelstein and Hambric, 1996), which consists of two elements:
psychological characteristics (including values, cognitive models, and other personality
factors) and observable experiences. A fundamental principle of upper echelons theory is
that observable experiences (i.e, demographic measures) are systematically related to the
14
psychological and cognitive elements of executive orientation hence organization
innovation performance. Upper echelons research employs the use of observable
demographic characteristics as proxy measures of executive orientation.
Executive orientation works through a perceptual or filtering process that results in what is
called managerial perceptions (Hambric and Mason, 1984) or construed reality (Finklestein
and Hambric, 1996).In this study, this theory will try to show how the manager’s character
since they occupy the Upper echelons sector will come into play in decision making
concerning the funding of business hence the capital structure.
2.3 Determinants of Capital Structure
The capital structure of an organization is determined by a number of factors within or
outside the organization. Some of these factors are discussed as follows;
2.3.1 Size of the Firm
Firm size has been empirically found to be strongly positively related to capital structure.
Larger firms are more diversified and hence have lower variance of earnings, making them
able to tolerate high debt ratios (Wald, 1999). Smaller firms, on the other hand, may find it
relatively more costly to resolve information asymmetries with lenders, thus, may present
lower debt ratios (Castanias, 1983). Lenders to larger firms are more likely to get repaid
than lenders to smaller firms, reducing the agency costs associated with debt. Therefore,
larger firms will have higher debts. Another explanation for smaller firms having lower
debt ratios is if the relative bankruptcy costs are an inverse function of firm size (Titman
and Wessels, 1988). Empirical evidence on the relationship between size and capital
structure supports a positive relationship. Several works show a positive relationship

15
between firm size and leverage (see Barclay and Smith, 1996; Friend and Lang, 1988;
Barton et al., 1989; MacKie-Mason, 1990; Kim et al., 1998; Al-Sakran, 2001, Hovakimian
et al., 2004).
From the theoretical point of view, the effect of size on leverage is ambiguous. As Rajan
and Zingales (1995, p. 1451) claim: “Larger firms tend to be more diversified and fail less
often, so size may be an inverse proxy for the probability of bankruptcy. If so, size should
have a positive impact on the supply debt. However, size may also be a proxy for the
information outside investors have, which should increase their preference for equity
relative to debt.” Also empirical studies do not provide us with clear information. Some
authors find a positive relation between size and leverage, for example Huang and Song
(2002), Rajan and Zingales (1995) and Friend and Lang (1988).On the other hand, some
studies report a negative relation, for example (Kester, 1986), (Kim – Sorensen, 1986) and
(Titman – Wessels, 1988).
2.3.2 Profitability
There are no consistent theoretical predictions on the effects of profitability on leverage.
From the point of view of the trade-off theory, more profitable companies should have
higher leverage because they have more income to shield from taxes. The free cash-flow
theory would suggest thatmore profitable companies should use more debt in order to
discipline managers, to induce them to pay out cash instead of spending money on
inefficient projects. However, from the point of view of the pecking-order theory, firms
prefer internal financing to external. So more profitable companies have a lower need for

16
external financing and theref.ore should have lower leverage. Most empirical studies
observe a negative relationship between leverage and profitability.
Profitability is proxied by return on assets (defined as earnings before interest and taxes
divided by total assets). The relationship between firm profitability and capital structure
can be explained by the pecking order theory (POT) discussed above, which holds that
firms prefer internal sources of finance to external sources. The order of the preference is
from the one that is least sensitive (and least risky) to the one that is most sensitive (and
most risky) that arise because of asymmetric information between corporate insiders and
less well informed market participants (Myers, 1984). By this token, profitable firms with
access to retained profits can rely on them as opposed to depending on outside sources
(debt). Murinde et al. (2004) observe that retentions are the principal source of finance.
Titman and Wessels (1988) and Barton et al. (1989) agree that firms with high profit rates,
all things being equal, would maintain relatively lower debt ratios since they are able to
generate such funds from internal sources
2.3.3 Firm growth
Growth is likely to place a greater demand on internally generated funds and push the firm
into borrowing (Hall et al., 2004). According to Marsh (1982), firms with high growth will
capture relatively higher debt ratios. In the case of small firms with more concentrated
ownership, it is expected that high growth firms will require more external financing and
should display higher leverage (Heshmati, 2001). Aryeetey et al. (1994) maintain that
growing SMEs appear more likely to use external finance although it is difficult to
determine whether finance induces growth or the opposite (or both). As enterprises grow

17
through different stages, i.e., micro, small, medium and large scale, they are also expected
to shift financing sources. They are first expected to move from internal sources to external
sources (Aryeetey, 1998). There is also a relationship between the degree of previous
growth and future growth. Michaelas et al. (1999) argue that future opportunities will be
positively related to leverage, in particular short term leverage. They argue that the agency
problem and consequently the cost of financing are reduced if the firm issues short-term
debt rather than long-term debt.
Myers (1977), however, holds the view that firms with growth opportunities will have a
smaller proportion of debt in their capital structure. This is because conflicts of interest
between debt and equity holders are especially serious for assets that give the firm the
option to undertake such growth opportunities in the future. He argues further that growth
opportunities can produce moral hazard situations and small scale entrepreneurs have an
incentive to take risks to grow. The benefits of this growth, if realized, will not be enjoyed
by lenders who will only recover the amount of their loans, resulting in a clear agency
problem. This will be reflected in increased costs of long-term debt that can be mitigated
by the use of short- term debt.
2.3.4 Asset structure
The asset structure of a firm plays a significant role in determining its capital structure. The
degree to which the firm’s assets are tangible should result in the firm having greater
liquidation value (Titman and Wessels, 1988; Harris and Raviv, 1991). Bradley et al.
(1984) assert that firms that invest heavily in tangible assets also have higher financial
leverage since they borrow at lower interest rates if their debt is secured with such assets. It

18
is believed that debt may be more readily used if there are durable assets to serve as
collateral (Wedig et al., 1988). By pledging the firm’s assets as collateral, the costs
associated with adverse selection and moral hazards are reduced. This will result in firms
with assets that have greater liquidation value having relatively easier access to finance at
lower cost, consequently leading to higher debt or outside financing in their capital
structure. In the case of small firms, the concession of collateral reduces the under-
investment problem in the firms by increasing the probability of obtaining credit –
functioning also as a management instrument in conflicts between entrepreneur and
financiers, since the degree of the entrepreneurs’ involvement in sharing business risk, by
granting personal collateral, is clearly evident. It is further suggested that bank financing
will depend upon whether the lending can be secured by tangible assets (Storey 1994;
Berger and Udell 1998).
2.3.5 Age of the firm
Age of the firm is a standard measure of reputation in capital structure models. As a firm
continues longer in business, it establishes itself as an ongoing business and therefore
increases its capacity to take on more debt; hence age is positively related to debt. Before
granting a loan, banks tend to evaluate the creditworthiness of entrepreneurs as these are
generally believed to pin high hopes on very risky projects promising high profitability
rates. In particular, when it comes to highly indebted companies, they are essentially
gambling their creditors’ money. If the investment is profitable, shareholders will collect a
significant share of the earnings, but if the project fails, then the creditors have to bear the
consequences (Myers, 1977).
19
To overcome problems associated with the evaluation of creditworthiness, Diamond
(1989) suggests the use of firm reputation. He takes reputation to mean the good name a
firm has built up over the years; the name is recognized by the market, which has observed
the firm’s ability to meet its obligations in a timely manner. Directors concerned with a
firm’s reputation tend to act more prudently and avoid riskier projects in favour of safer
projects, even when the latter have not been approved by shareholders, thus reducing debt
agency costs (by reducing the “temptation” to gamble at creditors’ cost).
It is important to note the extension of firm risk to the personal area of the businessperson
(given the unlimited liability of entrepreneurs) to be a way of managing the agency costs
resulting from cases of more opportunistic behaviour. Given the fragmentation of
information, and the high costs of control and evaluation, the firm’s and the entrepreneur’s
reputations become a valuable asset in the management of relations between the principal
(investor) and the agent (businessperson) (Landström, 1993). Petersen and Rajan (1994)
found that older firms should have higher debt ratios since they should be higher quality
firms. Hall et al. (2004) agreed that age is positively related to long-term debt but
negatively related to short-term debt. Esperança et al. (2003), however, found that age is
negatively related to both long-term and short-term debt.
2.3.6 Tax Rate
According to the trade-off theory, a company with a higher tax rate should use more debt
and therefore should have higher leverage, because it has more income to shield from
taxes. However, for example Fama and French (1998,) declare that debt has no net tax

20
benefits. As MacKie-Mason (1990,p. 1471) claims: “Nearly everyone believes taxes must
be important to financing decision, but little support has been found in empirical analysis.”
Cordes and Shefferin (1983) examined cross-sectional differences in the effective tax rates
caused by tax carry-backs and carry-forwards, foreign tax credits, investment tax credits,
the alternate tax on capital gains, and the minimum tax. "They found significant
differences across industries with the highest effective tax rate for tobacco manufacturing
(45%) and the lowest rate (16%) for transportation and agriculture" (Copeland, 1988:518).
This supports the above theory. In 1984, Bradley, Jarrell, and Kim took the ratio of
depreciation plus investment tax credits to earnings as a proxy for non-debt tax shields. By
regressing leverage against this variable, it was found significantly positive, indicating that
debt does not act as a tax shield (Copeland, 1988:518). Also, Long and Maliz (1985) added
several additional variables to those used by Bradley et al. By estimating a similar
regression, they found non-debt tax shields to be negatively related to leverage (Copeland,
1988: 519).
2.4 Empirical Review
According to a study carried by kdal, Sinan (2010) on how Firm Characteristics Affect
Capital Structure; This study tried to determine the influence of various firm level
characteristics such as, profitability, size, growth opportunities, asset tangibility, non-debt
tax shield, volatility and liquidity on capital structure. Employing the cross-sectional data
methodology, the researcher examines the capital structure determinants of 202 companies
from FTSE 250 for the time period of 2002 – 2009. Seven variables multiple regression
models are used to estimate the influence of firm level attributes on capital structure and
capital structure is measured simultaneously by the ratios of total debt, long-term debt and

21
short-term debt at both book value and market value of equity. The results obtained from
four different regression models show that profitability and liquidity are negatively and
significantly related to leverage. Also asset tangibility has a positive relationship with
leverage, which is significant. Moreover the researcher finds that total debt ratio at market
value of equity is the most important dependent variable as a proxy of capital structure,
followed by long-term debt ratio at market value of equity.
Shukeri, Shin and Shaari (2012) sought to establish whether board of director’s
characteristics affected firm performance using evidence from Malaysian public listed
companies. The study used six boards of directors’ characteristics, including managerial
ownership, board size, board independence, CEO duality, gender diversity and ethnic
diversity. Return on Equity (ROE) was used as a measurement for firm financial
performance. There were 300 Malaysian public listed companies being randomly selected
from each sector. The results showed that board size and ethnic diversity had positive
relationship with ROE while board independence had negative relationship. There was no
significant relationship between managerial ownership, CEO duality and gender diversity
on firm performance.
Pahuja and Sahi (2012) studied factors affecting capital structure decisions using empirical
evidence from selected Indian firms. The sample comprised of 30 companies comprising
Sensex and the data for a period of three years i.e. 2008 to 2010. In order to derive the
existing relationship between dependent and set of independent variables taken in the study
a typical procedure of Ordinary Least Square (OLS) regressions is undertaken. Capital
Structure is dependent variable and is associated with number of independent variables to
study what actually determines the capital structure of an organization. The correlation

22
results showed negative correlation between profitability, findings being consistent with
Rajan and Zingales (1995). The Pearson correlations of debt equity ratio with size,
profitability and tangibility are negative but statistically insignificant.
Bennedsen, Pérez-González and Wolfenzon (2010) reviewed whether Chief Executive
Officers matters in organizational performance. They specifically reviewed as to whether
they meaningfully affected firm performance. The objective of this paper is to investigate
whether CEOs affect firm performance using variation in the firms’ exposure to their
CEOs resulting from the managers’ own deaths and from the deaths of their immediate
family members. Specifically, we study the effects of the deaths of spouses, children,
parents, and parents-in-law. The main advantages of this rather painful empirical strategy
are two. First, these shocks presumably affect managers’ ability to perform their jobs,
either directly, through their own death, or indirectly, by grief or the additional time they
spend with their families, which would limit their ability to execute their professional
roles. Second, it is reasonable to expect that, personal shocks to managers, particularly
those arising from the deaths of family members unaffiliated with the firm, do not affect
firms’ investment opportunities, except through the decrease in the CEO’s effectiveness
that results from personal grief or additional time spent with the family. They show that
CEOs’ own deaths and deaths in their families lead to economically and statistically large
declines in firm performance as measured by firm profitability, investment, and sales
growth.
According to a study conducted by Guven Sayılgan 2002 on The Firm-Specific
Determinants of Corporate Capital Structure with the purpose of carrying out empirical
testing, using dynamic panel data methodology, to analyse the impact of firm specific
23
characteristics on the corporate capital structure decisions of Turkish firms. The sample
covers 123 Turkish manufacturing firms listed on the Istanbul Stock Exchange (ISE) and
the analysis is based on the year-end observations of ten consecutive years running from
1993-2002. In this study, the panel data methodology is used and six variables - size,
profitability and growth opportunities in plant, property and equipment, growth
opportunities in total assets, non-debt tax shields and tangibility - are analysed as the firm
specific determinants of the corporate capital structure. This work contributes to the
existing body of literature in the way that all of the independent variables of the study are
significant determinants for the capital structure decisions of Turkish firms. Our analysis
shows that variables of size and growth opportunity in total assets reveal a positive
association with the leverage ratio, however, profitability, growth opportunities in plant,
property and equipment, non-debt tax shields and tangibility reveal inverse relation with
debt level.
In the African scene, studies done by Anthony Hercules Turkson from cape cost
polytechnic in Ghana in 2013; the study that adopted the panel data methodology to
determine the effect of profitability on the capital structure showed that an organization’s
profitability affected the capital structure of the organization. The study was conducted by
examining the financial statements of the firms and looking at the ratio estimates of debt
and assets which also revealed the profitability.
Berger and Bonaccorsi (2006) using data on commercial banks in the USA showed that
higher leverage or lower equity capital ratio is related to higher profit efficiency, and Abor
(2005) on capital structure and profitability of SMEs in Ghana, showed that short-term
debt ratio is positively correlated with return on equity.

24
According to a study conducted by Edward Njenga in 2013 on capital structure of listed
firms in Kenya: the case of non-financial firms; This study investigates the capital structure
of listed firms in Kenya with an intention of identifying the factors that determine their
capital structure. In particular, the study seeks to determine both firm specific and
macroeconomic factors as well as to assess the relevance of capital structure theories in
Kenya. The study is conducted based on a sample of 29 non-financial firms listed on the
Nairobi Securities Exchange during the period 2004-2012 using panel data estimation
technique. Both the fixed effects and random effects models are estimated and the results
reveal that firm specific factors affecting the capital structure of listed firms in Kenya are
asset tangibility, firm’s profitability, size of the firm, firm’s growth opportunities and
finally liquidity of a firm’s assets while the macroeconomic factors are economic growth
and corporate tax rate. It is further established that the behaviour of Kenyan firms can best
be explained by pecking order theory which is an indicator of asymmetry in the capital
market.
An Empirical Analysis of Macro-Economic Influences on Corporate Capital Structure of
Listed Companies in Kenya by Muthama, Mbaluka and Kalunda in 2011. The study
analyzes the influence of the macro economic factors on the capital structure of selected
listed companies in Kenya. The study through analytical and descriptive research design
aimed at determining the magnitude and the direction of the relationship between selected
macroeconomic variables on corporate capital structure of listed companies in Kenya. An
econometric model of multiple linear regressions was used where leverage (debt ratios)
was regressed against GDP growth rate, inflation and interest rate. The study revealed that
indeed macro-economic factors have pronounced influence on the capital structure of the

25
listed companies. GDP growth rate was found to have a positive influence on long term
debt ratio and a negative influence on total debt ratio and short term debt ratio. Inflation on
the other hand had a negative influence on the short term debts while interest rates as
measured by the treasury bills have a positive influence on the long term debt ratio and
total debt ratio and a negative influence on the short term debt ratio.
2.5 Summary of Literature Review
This study reviewed the trade-off theory that argues capital structure is determined by the
trade-off between the benefits of debt tax shields and the costs of financial distress; it also
reviewed Agency theory that argues that structure is based on the premise that agency
conflicts between managers and outside investors are a key determinant of capital
structure, and lastly the upper echelons theory that says demographic diversity of the top
management team builds on the idea of the dominant coalition to propose that executives
influence organization innovation performance through the decisions they make. The
section also looks at the determinants of capital structure such as size, profitability,
tangibility, growth opportunities and tax of the organization or firm.
Finally the section looks at different studies on different areas of the world such a study
carried by kdal, Sinan (2010) on how Firm Characteristics Affect Capital Structure, a study
conducted by GüvenSayılgan on The Firm-Specific Determinants of Corporate Capital
Structure and studies done by Anthony Hercules Turkson from cape cost polytechnic in
Ghana in 2013; to determine the effect of profitability on the capital structure.

26
CHAPTER THREE
RESEARCH METHODOLOGY
3.1 Introduction
Research methodology sets out various stages and phases that were followed in completing
the study. This chapter discusses the methods that were used in the collection and analysis
of data and how data presentation has been done. It also discusses how the objective of the
study was met. It specifically covers the research design, study population, data collection,
and data analysis and presentation.
3.2 Research Design
This study adopted a cross-sectional and explanatory study design. Cross-sectional studies
(also known as cross-sectional analyses, transversal studies, prevalence study) are one type
of observational study that involves data collection from a population, or a representative
subset, at one specific point in time. Cross-sectional studies involve data collected at a
defined time. They are often used to assess the prevalence of acute or chronic conditions,
or to answer questions about the causes of disease or the results of intervention. They may
also be described as censuses.
Cross-sectional studies may involve special data collection, including questions about the
past, but they often rely on data originally collected for other purposes. This study sought
to establish managers’ characteristics and its influence on capital structure. The study was
both longitudinal and cross sectional since it reviewed the performance of several
companies over a period of years. Quantitative data relating to managers tenure, managers’

27
age, manager education, managers gender of Kenyan firms listed in the securities exchange
was collected over the past six (6) years from 2008 to 2013 annual reports.
3.3 The Population
The total population for the study comprised of 61 companies (Attached Appendix 2). The
study was conducted in firms listed on the Nairobi Securities Exchange for the period
ranging from 2008 to 2013. An analysis on the annual reports of listed companies (NSE’s,
Main Investment Market segment (MIMS) and Alternative Investment Market Segment
(AIMS) companies) in the NSE was done. These companies must have been trading
actively and consistently (not suspended) for at least six (6) years. Firms in the study only
included companies in MIMS and AIMS. The MIMS has 48 and the AIMS 13 listed
companies.
3.4 Data Collection
The study collected secondary data. The manager characteristics variables were collected
by use of secondary data capture form (Attached appendix 1). This form provided
information on managerial characteristics of managers from different firms given that my
data is longitudinal in nature (2008-2013).
The secondary data for the study was also collected from annual reports of firms listed on
the NSE from 2008 to 2013 which was obtained from www.africanfinancials.com and
www.nse.co.ke, Company data was collected on each of these variables. Data on the
independent variables and dependent variable was collected from the listed companies’
relevant journals and firms Regulatory Bodies like Capital Markets Authority.
28
3.5 Data Analysis
Statistical analysis; descriptive, correlation, multiple regression and analysis of variance
was used to address the objectives of the study. Descriptive statistics was used to test the
normality of data collected since the data was quantitative and the aim was to establish the
degree of association and cause effect relationship between the variables.
Multiple Regressions was used because of its ability to use multiple independent variables
to estimate their effect on a single dependent variable. This would predict a single
dependent variable from any number of independent variables entered into regression
equations. Blalock (1999, p.45) states that “if there are a large number of interval-scale
variables that are interrelated, it is possible to predict any particular variable from any
combination of the others’. The study thus used the technique to examine the effect of
manager characteristics on capital structure. The study employed both Assets and liabilities
information from the balance sheet of firms listed in Nairobi Securities Exchange.
The regression model which assumes linearity, normality, constant and independence was
Y=Bo+Xi β1+X2B2 +X3B3+X4B4+e
Y = the dependent variable (capital structure)
Capital structure= short term debt÷ total assets or long term debts÷ total assets or
total debts÷ total assets
Bo = Constant
X= coefficient
e = error rate

29
β1, β2, β3, β4, β5, β6 – was the regression coefficients in Y by each variable of X
= managers tenure (measured according to number of years manager has in the
firm)
X2 = Managers’ age (measured through grouping them into age brackets)
X3 = Manager Education (measured according to the level of education attained)
X4 = Managers gender (either male or female whereby female is a lady)
30
CHAPTER FOUR
DATA ANALYSIS, RESULTS AND DISCUSSION
4.1 Introduction
The chapter presents the findings from data collected.
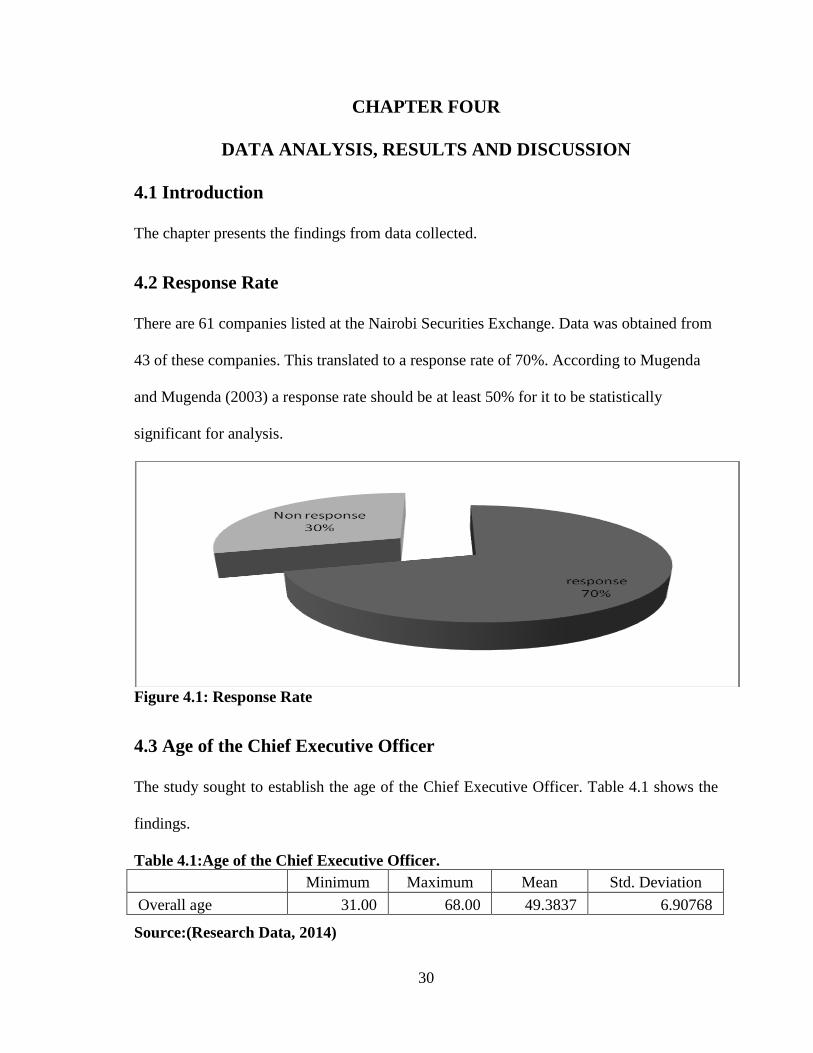
4.2 Response Rate
There are 61 companies listed at the Nairobi Securities Exchange. Data was obtained from
43 of these companies. This translated to a response rate of 70%. According to Mugenda
and Mugenda (2003) a response rate should be at least 50% for it to be statistically
significant for analysis.
Figure 4.1: Response Rate
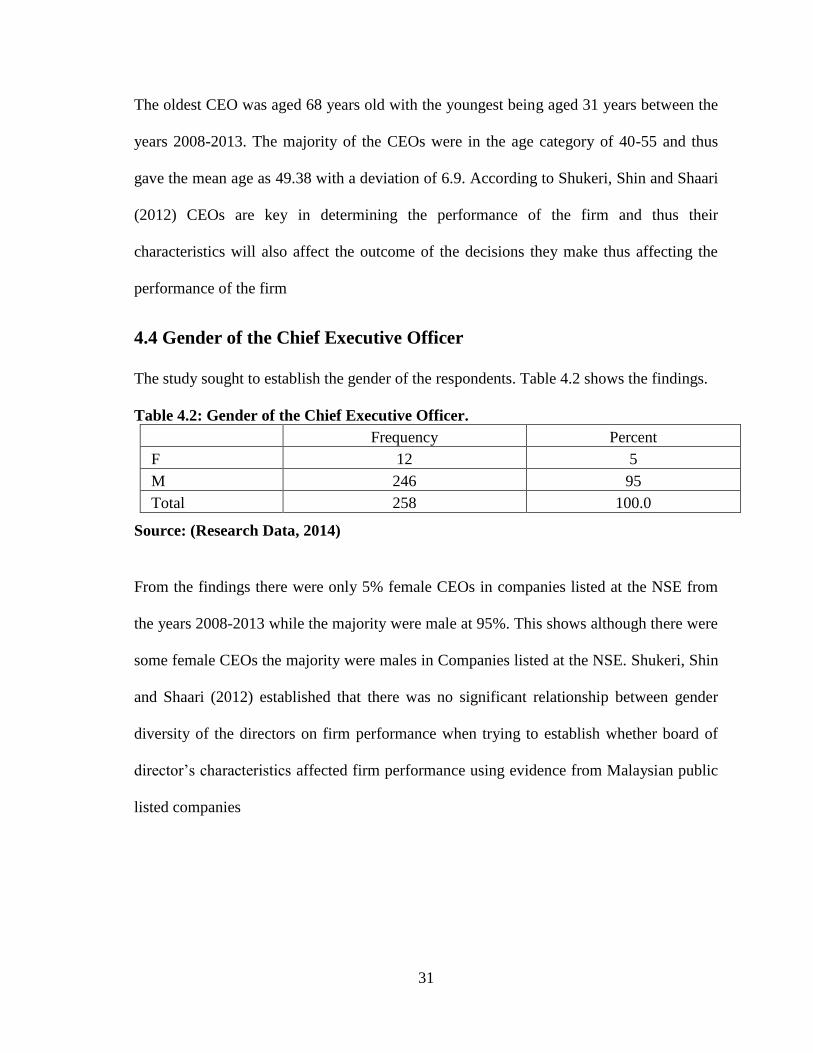
4.3 Age of the Chief Executive Officer
The study sought to establish the age of the Chief Executive Officer. Table 4.1 shows the
findings.
Table 4.1:Age of the Chief Executive Officer.
Minimum Maximum Mean Std. Deviation
Overall age 31.00 68.00 49.3837 6.90768
Source:(Research Data, 2014)
31
The oldest CEO was aged 68 years old with the youngest being aged 31 years between the
years 2008-2013. The majority of the CEOs were in the age category of 40-55 and thus
gave the mean age as 49.38 with a deviation of 6.9. According to Shukeri, Shin and Shaari
(2012) CEOs are key in determining the performance of the firm and thus their
characteristics will also affect the outcome of the decisions they make thus affecting the
performance of the firm
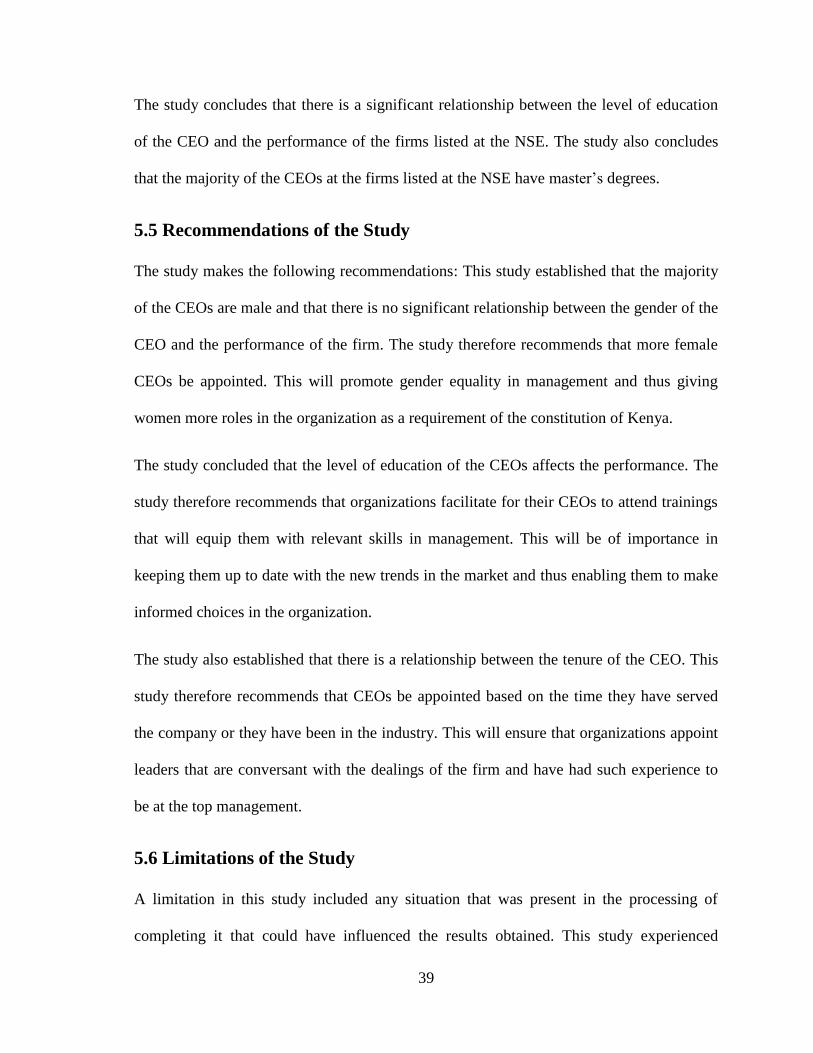
4.4 Gender of the Chief Executive Officer
The study sought to establish the gender of the respondents. Table 4.2 shows the findings.
Table 4.2: Gender of the Chief Executive Officer.
Frequency Percent
F 12 5
M 246 95
Total 258 100.0
Source: (Research Data, 2014)
From the findings there were only 5% female CEOs in companies listed at the NSE from
the years 2008-2013 while the majority were male at 95%. This shows although there were
some female CEOs the majority were males in Companies listed at the NSE. Shukeri, Shin
and Shaari (2012) established that there was no significant relationship between gender
diversity of the directors on firm performance when trying to establish whether board of
director’s characteristics affected firm performance using evidence from Malaysian public
listed companies

32
4.5 Tenure of the Chief Executive Officer
The study sought to establish the tenure of the CEO. The findings are in table 4.3.
Table 4.3: Tenure of the Chief Executive Officer
N Minimum Maximum Mean Std. Deviation
Overall tenure 258 1.00 29.00 5.9225 4.47668
Source: (Research Data, 2014)
From the findings the CEO that had been serving for the longest time in the company had
been for 29 years while the one with the shortest tenure had been in the company for one
year. The majority of the CEOs had been in the category of less than 8years thus giving the
mean of 5.92 and a deviation of 4.47. The period a CEO is in office is key in determining
their performance and that of the company. This period they serve is important in the
firm’s performance since CEOs are important in determining the performance of the firm
(Wolfenzon, 2010).
4.6 Level of education of the Chief Executive Officer
Table 4.4 shows the level of education of the CEOs.
Table 4.4: Level of Education
Frequency Percent
Bachelors Degree 120 46.5
Doctorate 11 4.2
Masters Degree 127 49.3
Total 258 100.0
Source: (Research Data, 2014)

33
From the finding 46.5% of the CEOs between the years 2008-2013 had bachelor’s degree,
4.2% had doctorates and 49.3% had master’s degrees. This shows that the majority of teh
CEOs of the firms listed at the NSE had master’s degrees. Bennedsen, Pérez-González and
Wolfenzon (2010) concluded that the Chief Executive Officers matters in determining the
organizational performance. Thus the education level of the CEO is very important since
they are charged with the mandate to make very important decisions that affect the
performance of the firm.
4.7 Capital Structure of the Firm
The study sought to establish the capital structure of the firm. The findings are shown in
the table 4.5
Table 4.5: Capital Structure of the Firm
N Minimum Maximum Mean Std. Deviation
Overal C.S 258 .01 129.29 8.4355 17.14718
Source: (Research Data, 2014)
From the findings above, the minimal capital structure ratio was at 0.01 while the highest
was at 129.29. The mean of the capital structure ratio was 8.43 with a standard deviation if
17.14. Njenga (2013) concluded from both the fixed effects and random effects models are
estimated and the results reveal that firm specific factors affecting the capital structure of
listed firms in Kenya are asset tangibility, firm’s profitability, size of the firm, firm’s
growth opportunities and finally liquidity of a firm’s assets while the macroeconomic
factors are economic growth and corporate tax rate.

34
4.8 Regression Analysis
Multiple regression analysis was conducted to test the influence among predictor variables.
Table 4.6:Model Summary
Model R R Square Adjusted R Square Std. Error of the Estimate
1 .776 .602 .598 1.12
a. Predictors: (Constant), overall education, overall tenure, overall gender, overall age
From the findings the R-Square which is the coefficient of determination is a commonly
used statistic to evaluate model fit. The adjusted R2,
is also called the coefficient of
multiple determinations, is the percent of the variance in the dependent explained uniquely
or jointly by the independent variables. 60.2% of the changes in the capital structure of the
companies listed at the NSE can be attributed to the combined effect of the predictor
variables. This means that 39.8% of the changes in the capital structure can be attributed to
other factors.
Table 4.7:ANOVA Results
Model Sum of
Squares
df Mean Square F Sig.
Regression 1399.994 4 349.999 10.194 .004b
Residual 74164.608 253 293.141
Total 75564.602 257
a. Dependent Variable: overall Capital Structure
b. Predictors: (Constant), overall education, overall tenure, overall gender, overall age
The probability value of 0.004 indicates that the regression relationship was highly
significant in predicting how age, gender, tenure and education of the CEO influence the
capital structure of the firms listed at the NSE. The F critical at 5% level of significance
was 2.5252 since F calculated is greater than the F critical (value = 10.194), this shows that
the overall model was significant.

35
Table 4.8: Regression coefficients
Model Unstandardized
Coefficients
Standardized
Coefficients
T Sig.
B Std. Error Beta
(Constant) 22.499 2.270 2.191 .001
Overall age -.029 .161 -.012 -.181 .003
Overall gender -6.546 5.140 -.081 -1.273 .000
Overall tenure -.066 .240 -.017 -.275 .002
Overall education -3.420 1.928 -.115 -1.774 .000
A. Dependent Variable: Overall Capital Structure
From the table 4.8 the regression model can be written as:
Y=22.49 -0.29X1-6.546X2-0.066X3-3.420X4
The regression equation above has established that taking all factors into account (Age,
gender, tenure and education) constant at zero, the capital structure of the firm will be at
22.499. The findings presented also show that taking all other independent variables at
zero, a unit increase in the age of the CEO would lead to a 0.029 reduction in the capital
structure of the firm. A unit change in the gender of the CEO would lead to 6.546
decreases in the capital structure of the firm. In addition, the findings show that a unit
increase in the tenure of the CEO would lead to a 0.066 decrease in the capital structure of
the firm. The study also found that a unit increase in the education level of the CEO would
lead to a 3.420 decrease in the capital structure of the firm. All the variables were
significant as the P-values were less than 0.05.

36
4.9 Discussion
According to Upper Echelons theory, executives influence organisation innovations
performance through the decisions they make. This theory suggests that executives make
decisions that are consistent with their observable characteristics. The findings of this
study show that there is a significant relationship between the age of the CEOs and capital
structure of firms listed in NSE.
The study also shows that there is a positive relationship between tenure of CEOs and
capital structure of firms listed in NSE. According to this study there is also a significant
relationship between the level of education and capital structure of firms listed in NSE.
The findings of this study show there is no significant relationship between gender and
capital structure of firms listed in NSE.
According to agency theory, capital structure is determined by agency conflicts between
managers and outside investors while the findings of this study shows that capital structure
of firms is determined by managers observable characteristics such as age, tenure and level
of education.
According to Hennessy and Whited (2005), capital structure is determined by the trade-off
between the benefits of debt tax shield and the cost of financial distress. Njenga (2013)
concluded that firm specific factors affecting capital structure of listed firms in Kenya are
asset tangibility, firm’s profitability, size of the firm, firm’s growth opportunities and
liquidity of firm’s assets.

37
CHAPTER FIVE
SUMMARY CONCLUSION AND RECOMMENDATION
5.1 Introduction
This chapter provides the summary of the findings from chapter four, and also it gives the
conclusions and recommendations of the study based on the objectives of the study.
5.3 Discussions of the Findings
The study established that the majority of the CEOs of the firms listed at the NSE were in
the age bracket of between 40-55 with the oldest being 68 years old and the youngest being
31 years between the years 2008-2013.According to Shukeri, Shin and Shaari (2012)
CEOs are key in determining the performance of the firm and thus their characteristics will
also affect the outcome of the decisions they make thus affecting the performance of the
firm.
The findings also established that majority of the CEOs in the Firms listed at NSE were
male. However Shukeri, Shin and Shaari (2012) in trying to establish whether the board of
director’s characteristics affected firm performance using evidence from Malaysian public
listed companies, they concluded that there was no significant relationship between gender
diversity of the directors on firm performance.
On the tenure of the CEOs, the findings established that different CEOs had served their
organization for different years. The period a CEO is in office is key in determining their
performance and that of the company. This period they serve is important in the firm’s
performance since CEOs are important in determining the performance of the firm
(Wolfenzon, 2010).

38
On the level of education the study established that the majority of the CEOs had master’s
degrees followed by those with bachelor’s degrees and the least had doctorate degrees.
Bennedsen, Pérez-González and Wolfenzon (2010) concluded that the Chief Executive
Officers matters in determining the organizational performance. Thus the education level
of the CEO is v0ery important since they are charged with the mandate to make very
important decisions that affect the performance of the firm.
The study established that the firms listed at the NSE had different capital structure ratio.
Njenga (2013) concluded from both the fixed effects and random effects models are
estimated and the results reveal that firm specific factors affecting the capital structure of
listed firms in Kenya are asset tangibility, firm’s profitability, size of the firm, firm’s
growth opportunities and finally liquidity of a firm’s assets while the macroeconomic
factors are economic growth and corporate tax rate.
5.4 Conclusions of the Study
The study made the following conclusions; there is a significant relationship between the
age of the CEOs and the performance of the firm. The study concludes that CEOs need to
be of a mature age as they are tasked with making important decisions.
The study also concludes there is no significant relationship between the gender of the
respondents and the performance of the firm. The study concludes that the majority of the
CEOs are male. The study also concludes that the tenure of the CEO affects the
performance of the firm.
39
The study concludes that there is a significant relationship between the level of education
of the CEO and the performance of the firms listed at the NSE. The study also concludes
that the majority of the CEOs at the firms listed at the NSE have master’s degrees.
5.5 Recommendations of the Study
The study makes the following recommendations: This study established that the majority
of the CEOs are male and that there is no significant relationship between the gender of the
CEO and the performance of the firm. The study therefore recommends that more female
CEOs be appointed. This will promote gender equality in management and thus giving
women more roles in the organization as a requirement of the constitution of Kenya.
The study concluded that the level of education of the CEOs affects the performance. The
study therefore recommends that organizations facilitate for their CEOs to attend trainings
that will equip them with relevant skills in management. This will be of importance in
keeping them up to date with the new trends in the market and thus enabling them to make
informed choices in the organization.
The study also established that there is a relationship between the tenure of the CEO. This
study therefore recommends that CEOs be appointed based on the time they have served
the company or they have been in the industry. This will ensure that organizations appoint
leaders that are conversant with the dealings of the firm and have had such experience to
be at the top management.
5.6 Limitations of the Study
A limitation in this study included any situation that was present in the processing of
completing it that could have influenced the results obtained. This study experienced

40
several limitations. First, the data used in the analysis was secondary data meant for other
purposes and was subject to various macroeconomic variables which may have influenced
their construction. This may have however limited the applicability of the data in other
circumstances.
Under the study period, there have been massive fluctuations in the capital structure among
firms listed at the NSE. This may have tampered with the prevailing rates of Capital
structure which the dependent variable in this study.
The data used in this study could also have been affected by different regulatory
adjustments imposed by the regulators. For example, in the year 2013 saw the
demutualization of the stock market. These could have affected the level of capital
structure of many firms.
In addition, the levels of interest rates fluctuated a lot during the period of the study. Since
debt is accompanied by the interest rates paid by the companies, this would have affected
the level of debt financing of many companies listed at the NSE. This was done through
affecting the ability of companies to repay credit facilities thus limiting the amount they
could access.
5.7 Recommendations for Further Studies
This study sought to establish the effect of manager characteristics on the capital structure
of firms listed in Nairobi Securities Exchange. The study however concentrated on only
the firms listed at the Nairobi Securities Exchange. This study therefore recommends that
in the future a similar study be conducted across all firms in the country so as to generalize
the findings.

41
The study also recommends that in the future a study be conducted on the effects of the
organization culture on the capital structure of firms. This will enable the organizations
establish how their culture contributes to the performance of the firm and thus make
changes accordingly.

42
REFERENCES
Angelo, H. de – Masulis, R. (1980): Optimal Capital Structure under Corporate and
Personal Taxation. Journal of Financial Economics.
Abor,;Arbiyan Safari,; Chakraborty, (2010). Is there a window of opportunity for seasoned
equity issuance? Journal of Finance.
Ajao K. & Ema Z. (2012).The long-run performance of firms following loan
announcements, Unpublished working paper, University of Florida.
Baker H.&Nofsinger, J. (2010).Behavioral Finance, Investors, Corporations and Markets
.Kolb Series in Finance, Essentia l Perspectives. NJ: John Wiley & Sons.
Inc.
Baker K. (2004), Educational Research: Planning, Conducting, and Evaluating
Quantitative and Qualitative Research. Upper Saddle River, NJ. Pearson
Education, Inc.
Bauer, P. – Bubák, V. (2003): Informative Value of Firm Capital Structure. Prague
Economic
Bennedsen, M. Pérez-González, F. And Wolfenzon, D. (2010). “Do CEOs matter?”
Financial journal of the Danish Social Science Research Foundation. 14 (3)
, 142-155
Booth, L., Aivazian, V. Demirguc-Kunt, A.Maksimovic, V. (2001): Capital Structure in
Developing Countries. Journal of Finance.
Bradley, M. – Jarrell, G. – Kim, E. H. (1984): On the Existence of an Optimal Capital
Structure: Theory and Evidence. Journal of Finance.
Budner, S. (1962). Intolerance of ambiguity as a personality variable. Journal of
Cacioppo, J. T., Petty, R. E., & Kao, C. F. (1984).
Chaplinsky, S. – Niehaus, G. (1993): Do Inside Ownership and Leverage Share
CommonDeterminants? Quarterly Journal of Business and Economics

43
Chebii K., Kipchumba and Wasike, (2011). Using expectations to test asset pricing
models, Unpublished working paper, Duke University.
Friend, I. – Lang, L. (1988): An Empirical Test of the Impact of Managerial
Self-interest on Corporate Capital Structure. Journal of Finance.
Gonedes, N. J. – Lang, L. – Chikaonda, M. (1988): Empirical Results on Managerial In-
centives and Capital Structure. The Wharton School, University of
Pennsylvania, Working Pa-per.
Gulamhussen and Santa, (2011). Educational research: Planning, conducting, and
evaluating quantitative and qualitative research (3rd). Upper Saddle River,
NJ: Prentice Hall.
Grable, J. & Lytton R. H. (1999). Financial risk tolerance revisited: the development of a
risk assessment instrument. Financial Services Review,
Graham, J. R., & Harvey, C. R. (2001). The Theory and Practice of Corporate Finance:
Evidence from the Field. Journal of Financial Economics.
Hackbarth, D. (2007). Managerial Traits and Capital Structure Decisions. EFA 2004
Maastricht Meetings Paper .
Harris, M. – Raviv, A. (1991): The Theory of Capital Structure. Journal of Finance ,
vol. 46,
Huang, S. G. Song, F. M. (2002): The Determinants of Capital Structure: Evidence from
China . Hong Kong Institute of Economics and Business Strategy, Working
Paper,
Jensen, M. C. – Meckling, W. H. (1976): Theory of the Firm: Managerial Behaviour,
Agency Costs and Ownership Structure. Journal of Financial Economics ,
vol. 3,
Kester, C. W. (1986): Capital and Ownership Structure: A Comparison of United States

44
and Japanese Manufacturing Corporations. Financial Management, vol. 15,
1986, pp. 5–16.
Kibet, Tenei&Mutwol, (2011) Financing decisions: Who issues stock? Journal of
Financial Economics, forthcoming.
Kim, W. S. – Sorensen, E. H. (1986): Evidence on the Impact of the Agency Costs of
Debt in Corporate Debt Policy. Journal of Financial and Quantitative
Analysis, vol. 21, 1986,
Klein, L. S. – O’brien, T. J. – peters, S. R. (2002): Debt vs. Equity and Asymmetric In-
formation: A Review. Financial Review
Long, M. – Malitz, I. (1985): The Investment-financing Nexus: Some Empirical
Evidence.Midland Corporate Finance Journal,
MacKIE - Mason, J. K. (1990): Do Taxes Affect Corporate Financing Decisions?
Journal of Finance.
Malmendier, U., Tate, A.G., & Yan, J. (2011).Overconfidence and Early-Life Experiences:
The Impact of Managerial Traits on Corporate Financial Policies .
Malmendier, Ulrike, and Tate, Geoffrey A., 2004, Who Makes Acquisitions?CEO
Overconfidence and the Market’s Reaction, NBER Working Paper 10813.
Marsh, P. (1982): The Choice between Equity and Debt: An Empirical Study. Journal of
Finance
Maryam Masnoon and Monazza Rauf (2013) Impact of Corporate Governance on Capital
Structure - A Study of KSE Listed Firms.
Mershon, B. &Gorsuch, R.L. (1988). Number of Factors in the Personality Sphere: Does
Increase in Factors Increase Predictability of Real-life Criteria? Journal of
Personality and Social Psychology,

45
Modigliani, F. – Miller, M. (1958): The Cost of Capital, Corporation Finance, and the
The-ory of Investment. American Economic Review ,
Myers, S. C. (1984): The Capital Structure Puzzle. Journal of Finance, vol. 39, 1984,
need for cognition. Journal of Personality Assessment. of the Big-Five
personality domains. Journal of Research in Personality.
Ondiek, B. (2010). Relationship between capital structure and financial performance of
firms listed at the Nairobi Stock Exchange. Unpublished MBA Thesis,
University of Nairobi.
Otieno, O. L. (2012). Capital Structure and Performance at Nairobi Stock Exchange
(NSE). Unpublished MBA Thesis, University of Nairobi.
Pahuja, A. And sahi, A. (2012). Factors affecting capital structure decisions: empirical
evidence from selected indian firms. International Journal of Marketing,
Financial Services and Management Research. Vol.1 No. 3, 2277 3622
Paunonen, S.V. & Ashton, M.S. (2001).Big five factors and facets and the prediction of
behavior.Journal of Personality and Social Psychology, Personality,
Psychological Assessment Resources. Psychologist,
Rajan, R. G. – Zingales, L. (1995): What Do We Know about Capital Structure? Some
Evi-dence from International Data. Journal of Finance.
R. L. (2002). Reliability and validity of a brief measure of sensation seeking. Personality
and Individual Differences,
Rok, (2013). The theory and practice of corporate finance: evidence from the field, Journal
of Financial Economics.
ROSS, S. (1977): The Determination of Financial Structure: the Incentive-signalling
Approach.Bell Journal of Economics and Management Science,
Rosenberg, M. (1965). Society and the Adolescent Self- Image. Princeton, NJ: Princeton
University Press.

46
Scheier, M. F., Carver, C. S., & Bridges, M. W. (1994). Distinguishing optimism from
neuroticism (and trait anxiety, self -mastery, and self-esteem): A
reevaluation of the Life Orientation Test. Journal of Personality and Social
Psychology,
Shefrin, H. (2002). Beyond Greed and Fear: Understanding Behavioral Finance and the
Psychology of Investing. NY: Oxford University Press.
Shukeri, S. N., Shin, O. W. And Shaari M. S. (2012). Does Board of Director’s
Characteristics Affect Firm Performance? Evidence from Malaysian Public
Listed Companies. International Business Research, Vol. 5, No. 9; 2012
Tarus, G. and Ayabei, T. (2014).The theory of capital structure, Journal of Finance.
Titman, S. (1984): The Effect of Capital Structure on a Firm’s Liquidation Decision.
Journalof Financial Economics ,
Vasiliou, D., & Daskalakis, N. (2009).Behavioral capital structure: Is the neoclassical
paradigm threatened? Evidence from the field.Journal of
BehavioralFinance
Wald, J. K. (1999): How Firm Characteristics Affect Capital Structure: An International
Com-parison. Journal of Financial Research,
Zuckerman, M. (1994).Behavioral Expression and Biosocial Bases of Sensation Seeking.
New York: Cambridge University Press.

APPENDICES
APPENDIX 1: Secondary Data Capture Form
Firm Year Age Gender Level of
Educati
on
Tenur
e
Capital
structure
1.Safaricom Ltd 2008
2009
2010
2011
2012
2013
2. Kakuzi Ltd 2008
2009
2010
2011
2012
2013
3. CMC Holdings Ltd 2008
2009
2010
2011
2012
2013
4. Equity Bank Ltd 2008
2009
2010
2011
2012
2013
Source: (Author, 2014)

APPENDIX 2 : Firms quoted in Nairobi Securities Exchange
AGRICULTURAL
Eaagads Ltd
Kakuzi Ltd
Kapchorua Tea Co. Ltd
The Limuru Tea Co. Ltd
Rea Vipingo Plantations Ltd
Sasini Ltd
Williamson Tea Kenya Ltd
AUTOMOBILES & ACCESSORIES
Car & General (K) Ltd
CMC Holdings Ltd
Marshalls (E.A.) Ltd
Sameer Africa Ltd
BANKING
Barclays Bank of Kenya Ltd
CFC Stanbic of Kenya Holdings Ltd
Diamond Trust Bank Kenya Ltd
Equity Bank Ltd
Housing Finance Co.Kenya Ltd
I&M Holdings Ltd
Kenya Commercial Bank Ltd
National Bank of Kenya Ltd
NIC Bank Ltd
Standard Chartered Bank Kenya Ltd
The Co-operative Bank of Kenya Ltd
COMMERCIAL AND SERVICES
Express Kenya Ltd
Hutchings Biemer Ltd
Kenya Airways Ltd
Longhorn Kenya Ltd
Nation Media Group Ltd
Scangroup Ltd
Standard Group Ltd
TPS Eastern Africa Ltd
Uchumi Supermarket Ltd
CONSTRUCTION & ALLIED
ARM Cement Ltd

iii
Bamburi Cement Ltd
Crown Paints Kenya Ltd
E.A.Cables Ltd
E.A.Portland Cement Co. Ltd
ENERGY & PETROLEUM
KenGen Co. Ltd
KenolKobil Ltd
Kenya Power & Lighting Co Ltd
Total Kenya Ltd
Umeme Ltd
INSURANCE
British-American Investments Co.(Kenya) Ltd
CIC Insurance Group Ltd
Jubilee Holdings Ltd
Kenya Re Insurance Corporation Ltd
Liberty Kenya Holdings Ltd
Pan Africa Insurance Holdings Ltd
INVESTMENT
Centum Investment Co Ltd
Olympia Capital Holdings Ltd
Trans-Century Ltd
MANUFACTURING & ALLIED
A.Baumann & Co Ltd
B.O.C Kenya Ltd
British American Tobacco Kenya Ltd
Carbacid Investments Ltd
East African Breweries Ltd
Eveready East Africa Ltd
Kenya Orchards Ltd
Mumias Sugar Co. Ltd
Unga Group Ltd
TELECOMMUNICATION & TECHNOLOGY
Safaricom Ltd
GROWTH ENTERPRISE MARKET SEGMENT (GEMS)
Home Afrika Ltd Source: (Nairobi Securities Exchange, 2014)

iv
APPENDIX 3: AGE
Name of the Company 2008 2009 2010 2011 2012 2013
BOC 35-45 years
35-45
years
35-45
years
35-45
years
35-45
years
35-45
years
Athi River Mining 46-55 years
46-55
years
46-55
years
46-55
years
46-55
years
46-55
years
Bamburi Cement 35-45 years
35-45
years
35-45
years
35-45
years
35-45
years
46-55
years
Barclays Bank of Kenya Ltd 35-45 years
46-55
years
46-55
years
46-55
years
46-55
years
46-55
years
Car & General Kenya 35-45 years
35-45
years
35-45
years
46-55
years
46-55
years
46-55
years
Centum Kenya
below 35
years
below 35
yrs
below 35
yrs
below 35
yrs
below 35
yrs
35-45
years
CFC Stanbic 46-55 years
46-55
years
46-55
years
46-55
years
46-55
years
46-55
years
CMC Holdings 46-55 years
46-55
years
46-55
years
46-55
years
46-55
years
46-55
years
Co-operative Bank of
Kenya 35-45 years
35-45
years
35-45
years
46-55
years
46-55
years
46-55
years
Crown Paints 35-45 years
35-45
years
46-55
years
46-55
years
46-55
years
46-55
years
Diamond Trust Bank 35-45 years
35-45
years
35-45
years
35-45
years
35-45
years
46-55
years
East African Breweries 35-45 years
35-45
years
35-45
years
46-55
years
46-55
years
46-55
years
East African Cables 35-45 years
35-45
years
35-45
years
35-45
years
35-45
years
46-55
years
East African Portland
Cement 56-65 years
56-65
years
56-65
years
above 65
yrs
above 65
yrs
above 65
yrs
Equity Bank 46-55 years
46-55
years
46-55
years
46-55
years
46-55
years
46-55
years
Eveready East Africa 35-45 years
35-45
years
35-45
years
35-45
years
35-45
years
35-45
years
Express Kenya 35-45 years
46-55
years
46-55
years
46-55
years
46-55
years
46-55
years

v
Housing Finance Company
of Kenya 35-45 years
35-45
years
35-45
years
35-45
years
35-45
years
35-45
years
Jubilee Holdings 35-45 years
35-45
years
46-55
years
46-55
years
46-55
years
46-55
years
KenGen 46-55 years
46-55
years
46-55
years
46-55
years
46-55
years
46-55
years
KenolKobil 35-45 years
35-45
years
35-45
years
35-45
years
35-45
years
46-55
years
Kenya Airways 35-45 years
35-45
years
46-55
years
46-55
years
46-55
years
46-55
years
Kenya Commercial Bank 46-55 years
46-55
years
46-55
years
46-55
years
46-55
years
46-55
years
Kenya Power & Lighting 46-55 years
46-55
years
46-55
years
46-55
years
46-55
years
46-55
years
Kenya Re 46-55 years
46-55
years
46-55
years
46-55
years
46-55
years
46-55
years
Mumias Sugar 46-55 years
46-55
years
46-55
years
46-55
years
46-55
years
56-65
years
Nation Media Group 56-65 years
56-65
years 56-65 yrs
above 65
yrs
above 65
yrs
above 65
yrs
National Bank of Kenya 35-45 years
46-55
years
46-55
years
46-55
years
46-55
years
46-55
years
NIC Bank 46-55 years
46-55
years
46-55
years
46-55
years
46-55
years
46-55
years
Olympia Capital Holdings 35-45 years
46-55
years
46-55
years
46-55
years
46-55
years
46-55
years
Pan Africa Insurance
Holdings 46-55 years
46-55
years
46-55
years
46-55
years
46-55
years
56-65
years
REA Vipingo Plantations 56-65 years
56-65
years
56-65
years
above 65
yrs
above 65
yrs
above 65
yrs
Safaricom 46-55 years
46-55
years
46-55
years
46-55
years
46-55
years
46-55
years
Sasini 46-55 years
46-55
years
46-55
years
46-55
years
46-55
years
46-55
years
ScanGroup 46-55 years
46-55
years
46-55
years
46-55
years
56-65
years
56-65
years
Standard Chartered Bank
Kenya 35-45 years
46-55
years
46-55
years
46-55
years
46-55
years
46-55
years
Standard Group 56-65 years
56-65
years
56-65
years
56-65
years
56-65
years
56-65
years

vi
Source: (NSE, 2014)
Total Kenya 56-65 years
56-65
years
56-65
years
56-65
years
56-65
years
56-65
years
TPS Serena 56-65 years
56-65
years
56-65
years
56-65
years
56-65
years
56-65
years
TransCentury 46-55 years
46-55
years
46-55
years
46-55
years
46-55
years
46-55
years
Uchumi 35-45 years
35-45
years
35-45
years
35-45
years
35-45
years
35-45
years
Unga Group 56-65 years
56-65
years
56-65
years
56-65
years
56-65
years
56-65
years
Williamson Tea Kenya 46-55 years
46-55
years
46-55
years
46-55
years
46-55
years
46-55
years

vii
APPENDIX 4: GENDER
Name of the Company 2008 2009 2010 2011 2012 2013
BOC male male male female female female
Athi River Mining male male male male male male
Bamburi Cement male male male male male male
Barclays Bank of Kenya Ltd male male male male male male
Car & General Kenya male male male male male male
Centum Kenya male male male male male male
CFC Stanbic female male male male male male
CMC Holdings male male male male male male
Co-operative Bank of Kenya male male male male male male
Crown Paints male male male male male male
Diamond Trust Bank male female female female female female
East African Breweries male male male male male male
East African Cables male male male male male male
East African Portland Cement male male male male male male
Equity Bank male male male male male male
Eveready East Africa male male male male male male
Express Kenya male male male male male male
Housing Finance Company of
Kenya
male male male male male male
Jubilee Holdings male male male male male male
KenGen male male male male male male
KenolKobil male male male male male male
Kenya Airways male male male male male male
Kenya Commercial Bank male male male male male male
Kenya Power & Lighting male male male male male male
Kenya Re male female female male male male
Mumias Sugar male male male male male
Nation Media Group M male male male male male
National Bank of Kenya F male male male male male
NIC Bank male male male male male
Olympia Capital Holdings male male male male male
Pan Africa Insurance Holdings M male male male male male
REA Vipingo Plantations M male male male male male
Safaricom M male male male male male
Sasini M male male male male male
ScanGroup M male male male male male
Standard Chartered Bank Kenya M male male male male male
Standard Group M male male male male male
Total Kenya M male male male male male

viii
TPS Serena male male male male male
TransCentury M male male male male male
Uchumi male male male male male
Unga Group M male male male male male
Williamson Tea Kenya M male male male male male
Source: (NSE, 2014)

ix
APPENDIX 5: TENURE
Name of the Company 2008 2009 2010 2011 2012 2013
BOC less than 8 years less than
8 years
less than 8
years
less than
8 years
less than 8
years
less than 8
years
Athi River Mining 24-30 years 24-30
years
24-30 years 24-30
years
24-30 years 24-30 years
Bamburi Cement less than 8 years less than
8 years
less than 8
years
less than
8 years
less than 8
years
less than 8
years
Barclays Bank of Kenya
Ltd
less than 8 years less than
8 years
less than 8
years
9-15
years
9-15 years less than 8
years
Car & General Kenya less than 8 years less than
8 years
less than 8
years
less than
8 years
less than 8
years
less than 8
years
Centum Kenya less than 8 years less than
8 years
less than 8
years
less than
8 years
less than 8
years
less than 8
years
CFC Stanbic less than 8 years less than
8 years
less than 8
years
less than
8 years
less than 8
years
less than 8
years
CMC Holdings less than 8 years less than
8 years
less than 8
years
less than
8 years
less than 8
years
less than 8
years
Co-operative Bank of
Kenya
less than 8 years less than
8 years
less than 8
years
less than
8 years
less than 8
years
less than 8
years
Crown Paints less than 8 years less than
8 years
less than 8
years
less than
8 years
less than 8
years
less than 8
years
Diamond Trust Bank less than 8 years less than
8 years
9-15 years 9-15
years
9-15 years 9-15 years
East African Breweries less than 8 years less than
8 years
less than 8
years
less than
8 years
less than 8
years
less than 8
years
East African Cables less than 8 years less than
8 years
less than 8
years
less than
8 years
less than 8
years
less than 8
years
East African Portland
Cement
less than 8 years less than
8 years
less than 8
years
less than
8 years
less than 8
years
less than 8
years
Equity Bank less than 8 years less than
8 years
less than 8
years
less than
8 years
less than 8
years
9-15 years
Eveready East Africa less than 8 years less than
8 years
less than 8
years
less than
8 years
less than 8
years
less than 8
years
Express Kenya less than 8 years less than
8 years
less than 8
years
less than
8 years
less than 8
years
less than 8
years
Housing Finance
Company of Kenya
less than 8 years less than
8 years
less than 8
years
less than
8 years
less than 8
years
less than 8
years
Jubilee Holdings less than 8 years less than
8 years
less than 8
years
less than
8 years
less than 8
years
less than 8
years
KenGen less than 8 years less than
8 years
less than 8
years
less than
8 years
9-15 years 9-15 years
KenolKobil less than 8 years less than
8 years
less than 8
years
less than
8 years
less than 8
years
less than 8
years
Kenya Airways less than 8 years less than
8 years
less than 8
years
less than
8 years
less than 8
years
9-15 years
Kenya Commercial Bank less than 8 years less than
8 years
less than 8
years
less than
8 years
less than 8
years
less than 8
years

x
Kenya Power & Lighting 9-15 years 9-15
years
9-15 years 9-15
years
9-15 years less than 8
years
Kenya Re less than 8 years less than
8 years
less than 8
years
less than
8 years
less than 8
years
less than 8
years
Mumias Sugar less than 8 years less than
8 years
less than 8
years
9-15
years
9-15 years less than 8
years
Nation Media Group less than 8 years less than
8 years
less than 8
years
less than
8 years
less than 8
years
less than 8
years
National Bank of Kenya 9-15 years 9-15
years
9-15 years 9-15
years
9-15 years less than 8
years
NIC Bank less than 8 years less than
8 years
less than 8
years
less than
8 years
less than 8
years
less than 8
years
Olympia Capital Holdings 9-15 years 9-15
years
9-15 years 16-23
years
16-23 years 16-23 years
Pan Africa Insurance
Holdings
less than 8 years less than
8 years
less than 8
years
less than
8 years
less than 8
years
less than 8
years
REA Vipingo Plantations less than 8 years 9-15
years
9-15 years 9-15
years
9-15 years 9-15 years
Safaricom less than 8 years 9-15
years
less than 8
years
less than
8 years
less than 8
years
less than 8
years
Sasini less than 8 years less than
8 years
less than 8
years
less than
8 years
less than 8
years
less than 8
years
ScanGroup less than 8 years less than
8 years
less than 8
years
less than
8 years
less than 8
years
less than 8
years
Standard Chartered Bank
Kenya
less than 8 years less than
8 years
less than 8
years
less than
8 years
less than 8
years
less than 8
years
Standard Group less than 8 years less than
8 years
less than 8
years
less than
8 years
less than 8
years
less than 8
years
Total Kenya less than 8 years less than
8 years
less than 8
years
less than
8 years
less than 8
years
less than 8
years
TPS Serena less than 8 years less than
8 years
less than 8
years
less than
8 years
9-15 years 9-15 years
TransCentury less than 8 years less than
8 years
less than 8
years
less than
8 years
less than 8
years
less than 8
years
Uchumi less than 8 years less than
8 years
less than 8
years
less than
8 years
less than 8
years
less than 8
years
Unga Group less than 8 years less than
8 years
less than 8
years
less than
8 years
9-15 years 9-15 years
Williamson Tea Kenya less than 8 years less than
8 years
less than 8
years
less than
8 years
less than 8
years
9-15 years
Source: (NSE, 2014)

xi
APPENDIX 6: LEVEL OF EDUCATION
Name of the
Company
2008 2009 2010 2011 2012 2013
BOC bachelors
degree
bachelors
degree
bachelors
degree
bachelors
degree
bachelors
degree
bachelors
degree
Athi River Mining masters
degree
masters
degree
masters
degree
masters
degree
masters
degree
masters
degree
Bamburi Cement bachelors
degree
bachelors
degree
bachelors
degree
bachelors
degree
bachelors
degree
bachelors
degree
Barclays Bank of
Kenya Ltd
masters
degree
masters
degree
masters
degree
masters
degree
masters
degree
masters
degree
Car & General
Kenya
bachelors
degree
bachelors
degree
bachelors
degree
bachelors
degree
bachelors
degree
bachelors
degree
Centum Kenya bachelors
degree
bachelors
degree
bachelors
degree
bachelors
degree
bachelors
degree
bachelors
degree
CFC Stanbic masters
degree
masters
degree
masters
degree
masters
degree
masters
degree
masters
degree
CMC Holdings bachelors
degree
bachelors
degree
bachelors
degree
bachelors
degree
bachelors
degree
bachelors
degree
Co-operative Bank
of Kenya
bachelors
degree
bachelors
degree
bachelors
degree
bachelors
degree
bachelors
degree
bachelors
degree
Crown Paints masters
degree
masters
degree
masters
degree
masters
degree
masters
degree
masters
degree
Diamond Trust
Bank
bachelors
degree
bachelors
degree
bachelors
degree
bachelors
degree
bachelors
degree
bachelors
degree
East African
Breweries
bachelors
degree
masters
degree
masters
degree
masters
degree
masters
degree
masters
degree
East African
Cables
bachelors
degree
bachelors
degree
bachelors
degree
bachelors
degree
masters
degree
masters
degree
East African
Portland Cement
masters
degree
masters
degree
masters
degree
masters
degree
masters
degree
masters
degree
Equity Bank bachelors
degree
bachelors
degree
bachelors
degree
bachelors
degree
bachelors
degree
bachelors
degree
Eveready East
Africa
bachelors
degree
bachelors
degree
bachelors
degree
bachelors
degree
masters
degree
masters
degree
Express Kenya masters
degree
masters
degree
masters
degree
masters
degree
masters
degree
masters
degree
Housing Finance
Company of
Kenya
bachelors
degree
bachelors
degree
bachelors
degree
bachelors
degree
bachelors
degree
bachelors
degree
Jubilee Holdings bachelors
degree
bachelors
degree
bachelors
degree
bachelors
degree
bachelors
degree
bachelors
degree
KenGen bachelors
degree
bachelors
degree
bachelors
degree
bachelors
degree
bachelors
degree
bachelors
degree
KenolKobil bachelors
degree
bachelors
degree
bachelors
degree
bachelors
degree
bachelors
degree
bachelors
degree

xii
Kenya Airways bachelors
degree
bachelors
degree
bachelors
degree
bachelors
degree
bachelors
degree
bachelors
degree
Kenya
Commercial Bank
masters
degree
masters
degree
masters
degree
masters
degree
masters
degree
masters
degree
Kenya Power &
Lighting
masters
degree
masters
degree
masters
degree
masters
degree
masters
degree
masters
degree
Kenya Re masters
degree
masters
degree
masters
degree
masters
degree
masters
degree
masters
degree
Mumias Sugar masters
degree
masters
degree
masters
degree
masters
degree
masters
degree
masters
degree
Nation Media
Group
masters
degree
masters
degree
masters
degree
masters
degree
masters
degree
masters
degree
National Bank of
Kenya
bachelors
degree
bachelors
degree
bachelors
degree
bachelors
degree
bachelors
degree
masters
degree
NIC Bank bachelors
degree
bachelors
degree
bachelors
degree
bachelors
degree
bachelors
degree
bachelors
degree
Olympia Capital
Holdings
masters
degree
masters
degree
masters
degree
masters
degree
masters
degree
masters
degree
Pan Africa
Insurance
Holdings
masters
degree
masters
degree
masters
degree
masters
degree
masters
degree
masters
degree
REA Vipingo
Plantations
masters
degree
masters
degree
masters
degree
masters
degree
masters
degree
masters
degree
Safaricom bachelors
degree
bachelors
degree
masters
degree
masters
degree
masters
degree
masters
degree
Sasini masters
degree
PhD PhD PhD PhD PhD
ScanGroup masters
degree
masters
degree
masters
degree
masters
degree
masters
degree
masters
degree
Standard
Chartered Bank
Kenya
masters
degree
masters
degree
masters
degree
masters
degree
masters
degree
masters
degree
Standard Group bachelors
degree
bachelors
degree
bachelors
degree
masters
degree
masters
degree
masters
degree
Total Kenya bachelors
degree
bachelors
degree
bachelors
degree
bachelors
degree
bachelors
degree
bachelors
degree
TPS Serena masters
degree
masters
degree
masters
degree
masters
degree
masters
degree
masters
degree
TransCentury PhD PhD PhD PhD PhD PhD
Uchumi masters
degree
masters
degree
masters
degree
masters
degree
masters
degree
masters
degree
Unga Group bachelors
degree
bachelors
degree
bachelors
degree
bachelors
degree
bachelors
degree
bachelors
degree
Williamson Tea
Kenya
bachelors
degree
bachelors
degree
bachelors
degree
bachelors
degree
bachelors
degree
bachelors
degree
Source: (NSE, 2014)
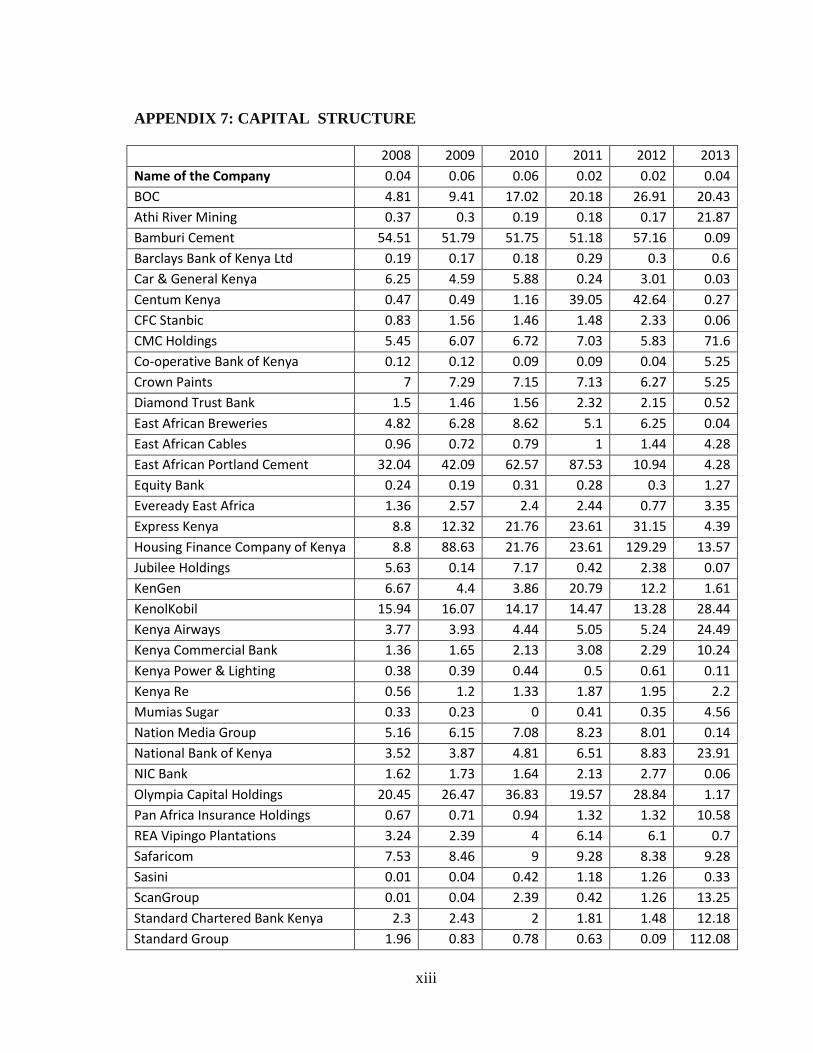
xiii
APPENDIX 7: CAPITAL STRUCTURE
2008 2009 2010 2011 2012 2013
Name of the Company 0.04 0.06 0.06 0.02 0.02 0.04
BOC 4.81 9.41 17.02 20.18 26.91 20.43
Athi River Mining 0.37 0.3 0.19 0.18 0.17 21.87
Bamburi Cement 54.51 51.79 51.75 51.18 57.16 0.09
Barclays Bank of Kenya Ltd 0.19 0.17 0.18 0.29 0.3 0.6
Car & General Kenya 6.25 4.59 5.88 0.24 3.01 0.03
Centum Kenya 0.47 0.49 1.16 39.05 42.64 0.27
CFC Stanbic 0.83 1.56 1.46 1.48 2.33 0.06
CMC Holdings 5.45 6.07 6.72 7.03 5.83 71.6
Co-operative Bank of Kenya 0.12 0.12 0.09 0.09 0.04 5.25
Crown Paints 7 7.29 7.15 7.13 6.27 5.25
Diamond Trust Bank 1.5 1.46 1.56 2.32 2.15 0.52
East African Breweries 4.82 6.28 8.62 5.1 6.25 0.04
East African Cables 0.96 0.72 0.79 1 1.44 4.28
East African Portland Cement 32.04 42.09 62.57 87.53 10.94 4.28
Equity Bank 0.24 0.19 0.31 0.28 0.3 1.27
Eveready East Africa 1.36 2.57 2.4 2.44 0.77 3.35
Express Kenya 8.8 12.32 21.76 23.61 31.15 4.39
Housing Finance Company of Kenya 8.8 88.63 21.76 23.61 129.29 13.57
Jubilee Holdings 5.63 0.14 7.17 0.42 2.38 0.07
KenGen 6.67 4.4 3.86 20.79 12.2 1.61
KenolKobil 15.94 16.07 14.17 14.47 13.28 28.44
Kenya Airways 3.77 3.93 4.44 5.05 5.24 24.49
Kenya Commercial Bank 1.36 1.65 2.13 3.08 2.29 10.24
Kenya Power & Lighting 0.38 0.39 0.44 0.5 0.61 0.11
Kenya Re 0.56 1.2 1.33 1.87 1.95 2.2
Mumias Sugar 0.33 0.23 0 0.41 0.35 4.56
Nation Media Group 5.16 6.15 7.08 8.23 8.01 0.14
National Bank of Kenya 3.52 3.87 4.81 6.51 8.83 23.91
NIC Bank 1.62 1.73 1.64 2.13 2.77 0.06
Olympia Capital Holdings 20.45 26.47 36.83 19.57 28.84 1.17
Pan Africa Insurance Holdings 0.67 0.71 0.94 1.32 1.32 10.58
REA Vipingo Plantations 3.24 2.39 4 6.14 6.1 0.7
Safaricom 7.53 8.46 9 9.28 8.38 9.28
Sasini 0.01 0.04 0.42 1.18 1.26 0.33
ScanGroup 0.01 0.04 2.39 0.42 1.26 13.25
Standard Chartered Bank Kenya 2.3 2.43 2 1.81 1.48 12.18
Standard Group 1.96 0.83 0.78 0.63 0.09 112.08

xiv
Total Kenya 1.96 0.22 0.83 1.29 0.78 3.35
TPS Serena 0.91 0.9 0.64 1.21 1.13 1.56
TransCentury 6.67 56.75 0.36 0.14 0.06 0.06
Uchumi 0.09 0.11 0.01 0.09 0.11 3.85
Unga Group 0.09 8.87 0.11 8.85 0.01 0.79
Source: (NSE, 2014)